Sample Category Title
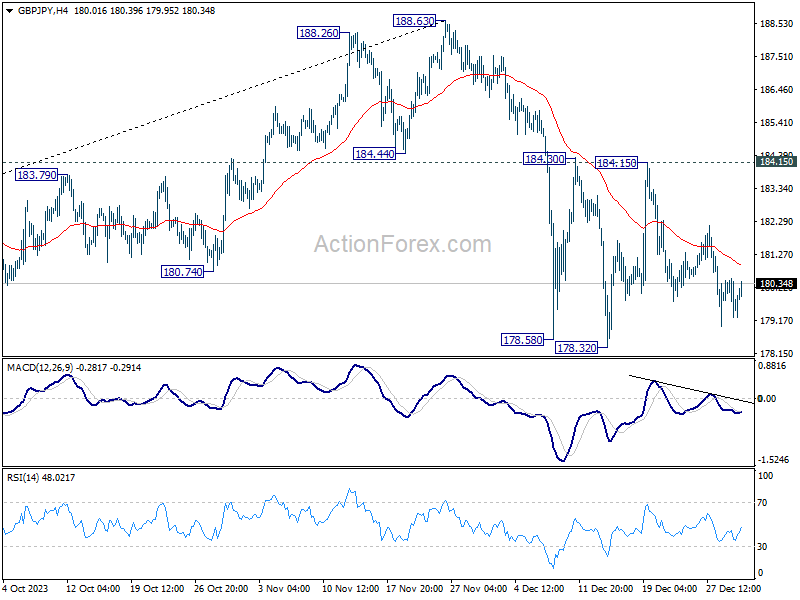
GBP/JPY Daily Outlook
Daily Pivots: (S1) 179.07; (P) 179.80; (R1) 180.30; More...
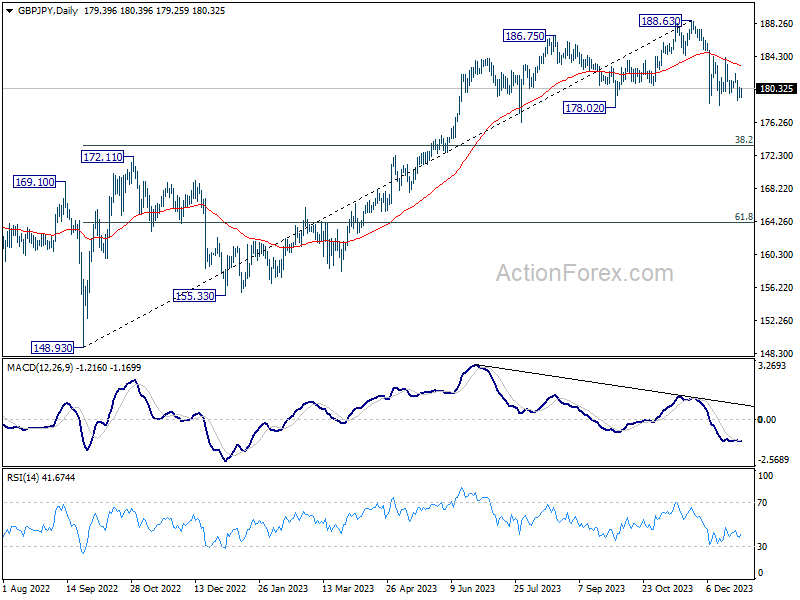
Intraday bias in GBP/JPY stays neutral as range trading continues. Further decline is expected as long as 184.15 resistance holds. On the downside, break of will resume the decline from 188.63 and target 38.2% retracement of 148.93 to 188.63 at 173.46. However, decisive break of 184.15 will argue that pull back from 188.63 has completed and bring retest of this high.
In the bigger picture, price actions from 188.63 medium term top are currently seen as a correction to the up trend from 148.93 (2022 low) only. As long as 172.11 resistance turned support holds, larger up trend from 123.94 (2020 low) is still in favor to resume through 188.63 at a later stage.
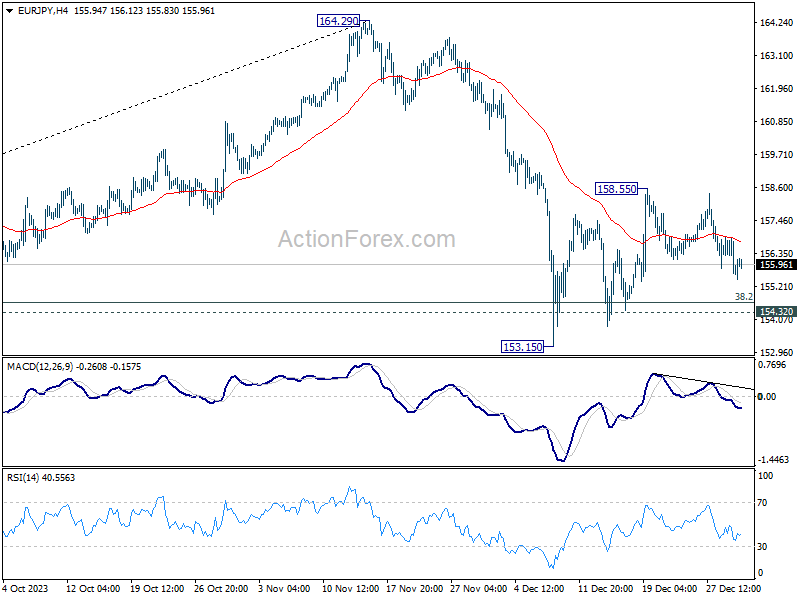
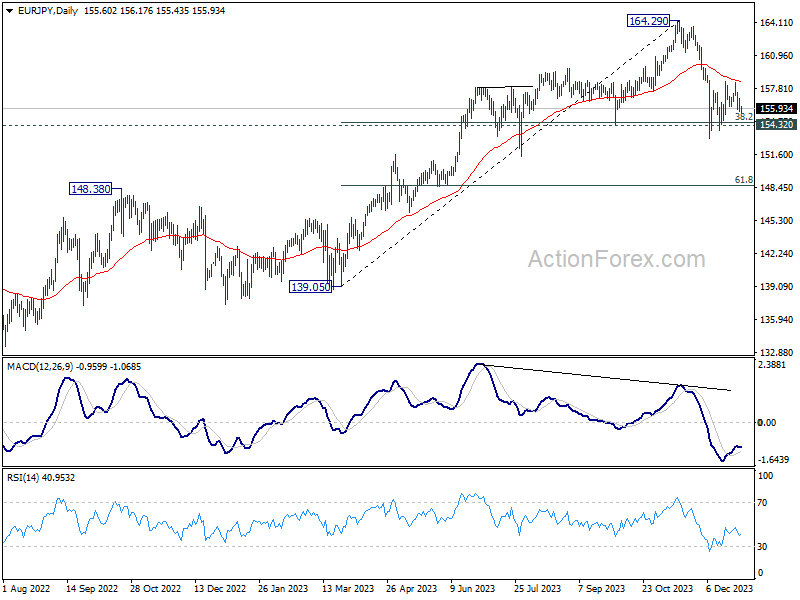
EUR/JPY Daily Outlook
Daily Pivots: (S1) 155.24; (P) 156.10; (R1) 156.55; More...
Range trading continues in EUR/JPY and intraday bias stays neutral. On the upside, above 158.55 will resume the corrective rebound from 153.15. On the downside, break of 153.15 will resume whole fall from 164.39 to 61.8% retracement of 139.05 to 164.29 at 148.69.
In the bigger picture, price actions from 164.29 medium term top are tentatively seen as a correction to rise from 139.05 for now. As long as 148.48 resistance turned support holds (2022 high), larger up trend from 114.42 (2020 low) could still resume through 164.29 at a later stage.
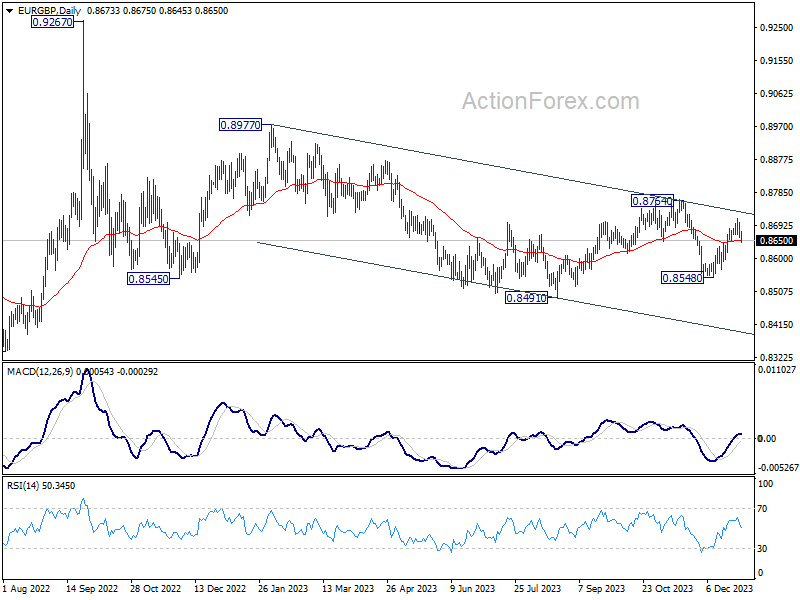
EUR/GBP Daily Outlook
Daily Pivots: (S1) 0.8653; (P) 0.8677; (R1) 0.8693; More...
Break of 0.8649 minor support argues that EUR/GBP's rebound from 0.8548 has completed at 0.8713. Intraday bias is back on the downside for retesting 0.8548 support. On the upside, however, break of 0.8713 will resume the rebound to 0.8764 key resistance next.
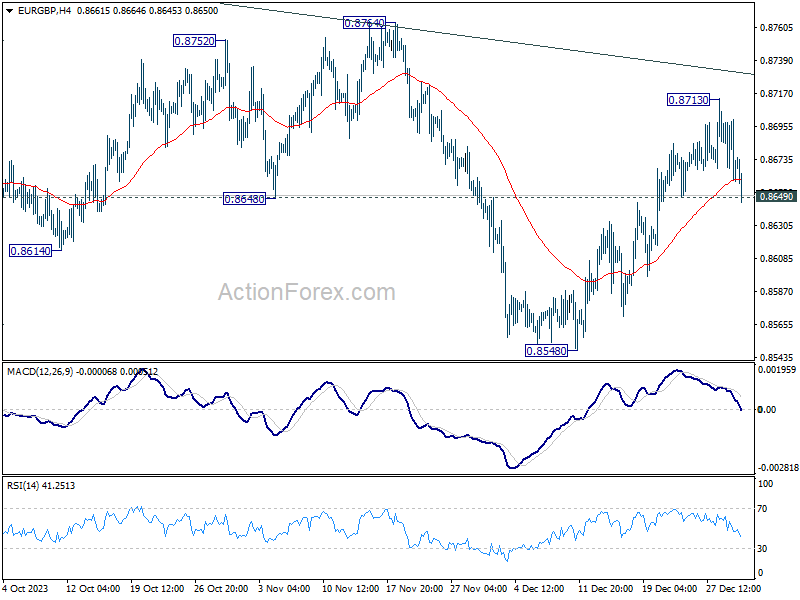
In the bigger picture, current development suggests that down trend from 0.9267 (2022 high) is still in progress. This decline is seen as the third leg of the pattern from 0.9499 (2020 high). Break of 0.8201 will target 100% projection of 0.9499 to 0.8201 from 0.9267 at 0.7969. In any case, outlook will stay bearish as long as 0.8764 resistance holds.
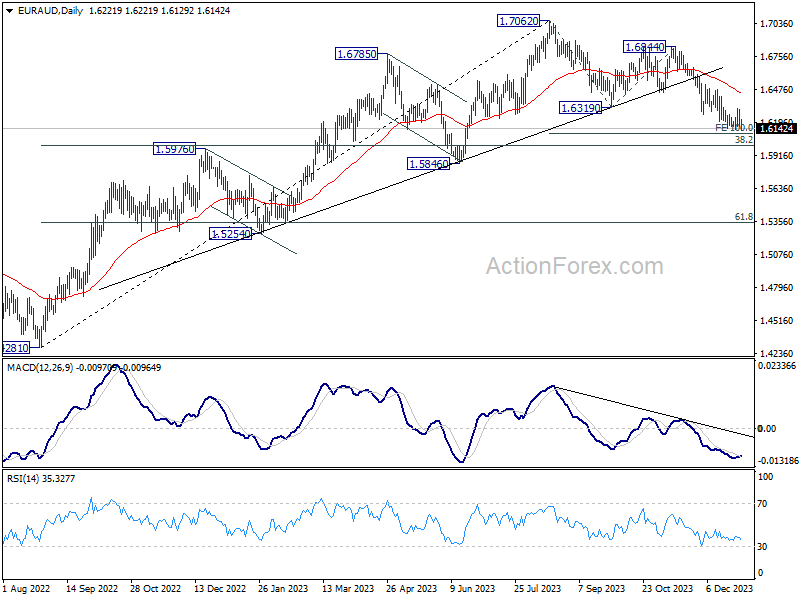
EUR/AUD Daily Outlook
Daily Pivots: (S1) 1.6146; (P) 1.6225; (R1) 1.6283; More..
EUR/AUD's decline is resuming by breaching 1.6137 and intraday bias is back on the downside for 100% projection of 1.7062 to 1.6319 from 1.6844 at 1.6106. Meanwhile, considering bullish convergence condition in 4H MACD, firm break of 1.6313 resistance should indicate short term bottoming, and turn bias back to the upside for 1.6478 resistance instead.
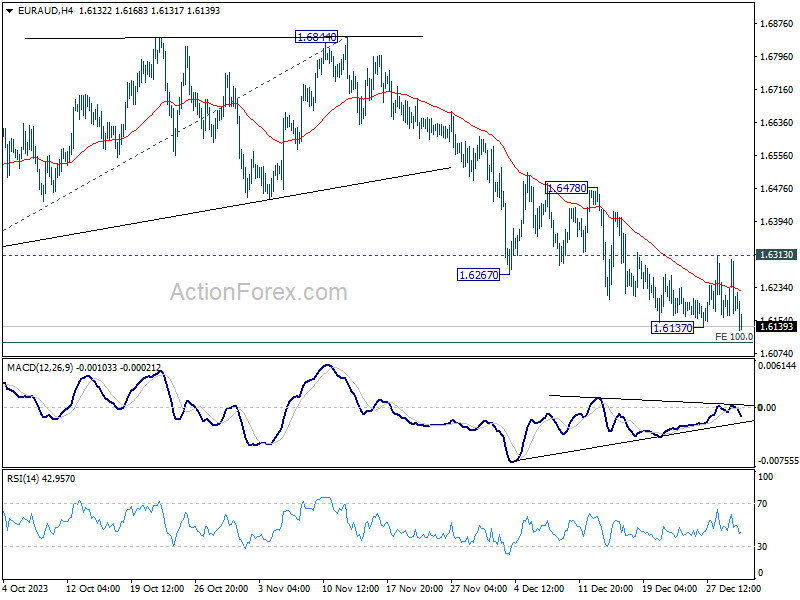
In the bigger picture, fall from 1.7062 medium term top is seen as correcting the whole up trend from 1.4281 (2022 low). Deeper decline would be seen to 38.2% retracement of 1.4281 to 1.7062 at 1.6000. Strong support could be seen there to bring rebound on first attempt. But risk will stay on the downside as long as 1.6844 resistance holds. Sustained break of 1.6000 would bring further fall to 61.8% retracement at 1.5343.
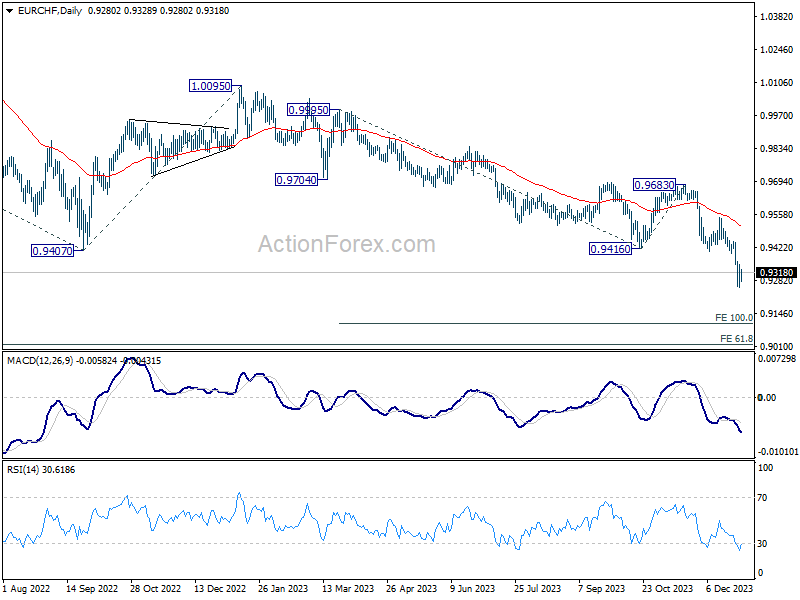
EUR/CHF Daily Outlook
Daily Pivots: (S1) 0.9245; (P) 0.9298; (R1) 0.9341; More...
Intraday bias in EUR/CHF is turned neutral with current recovery, and some more consolidations would be seen above 0.9252. But further decline is expected as long as 0.9402 support turned resistance holds. On the downside, break of 0.9252 will resume larger down trend. Next target is 100% projection of 0.9995 to 0.9416 from 0.9683 at 0.9104 next.
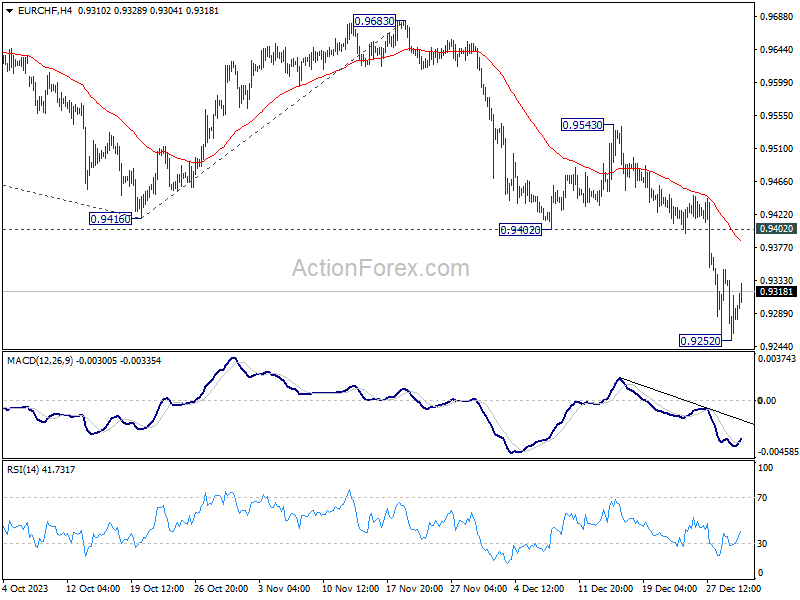
In the bigger picture, medium term outlook remains bearish as long as 0.9683 resistance holds. Current fall from 1.2004 (2018 high) is part of the multi-decade down trend. Next target is 61.8% projection of 1.1149 (2020 high) to 0.9407 from 1.0095 at 0.9018.
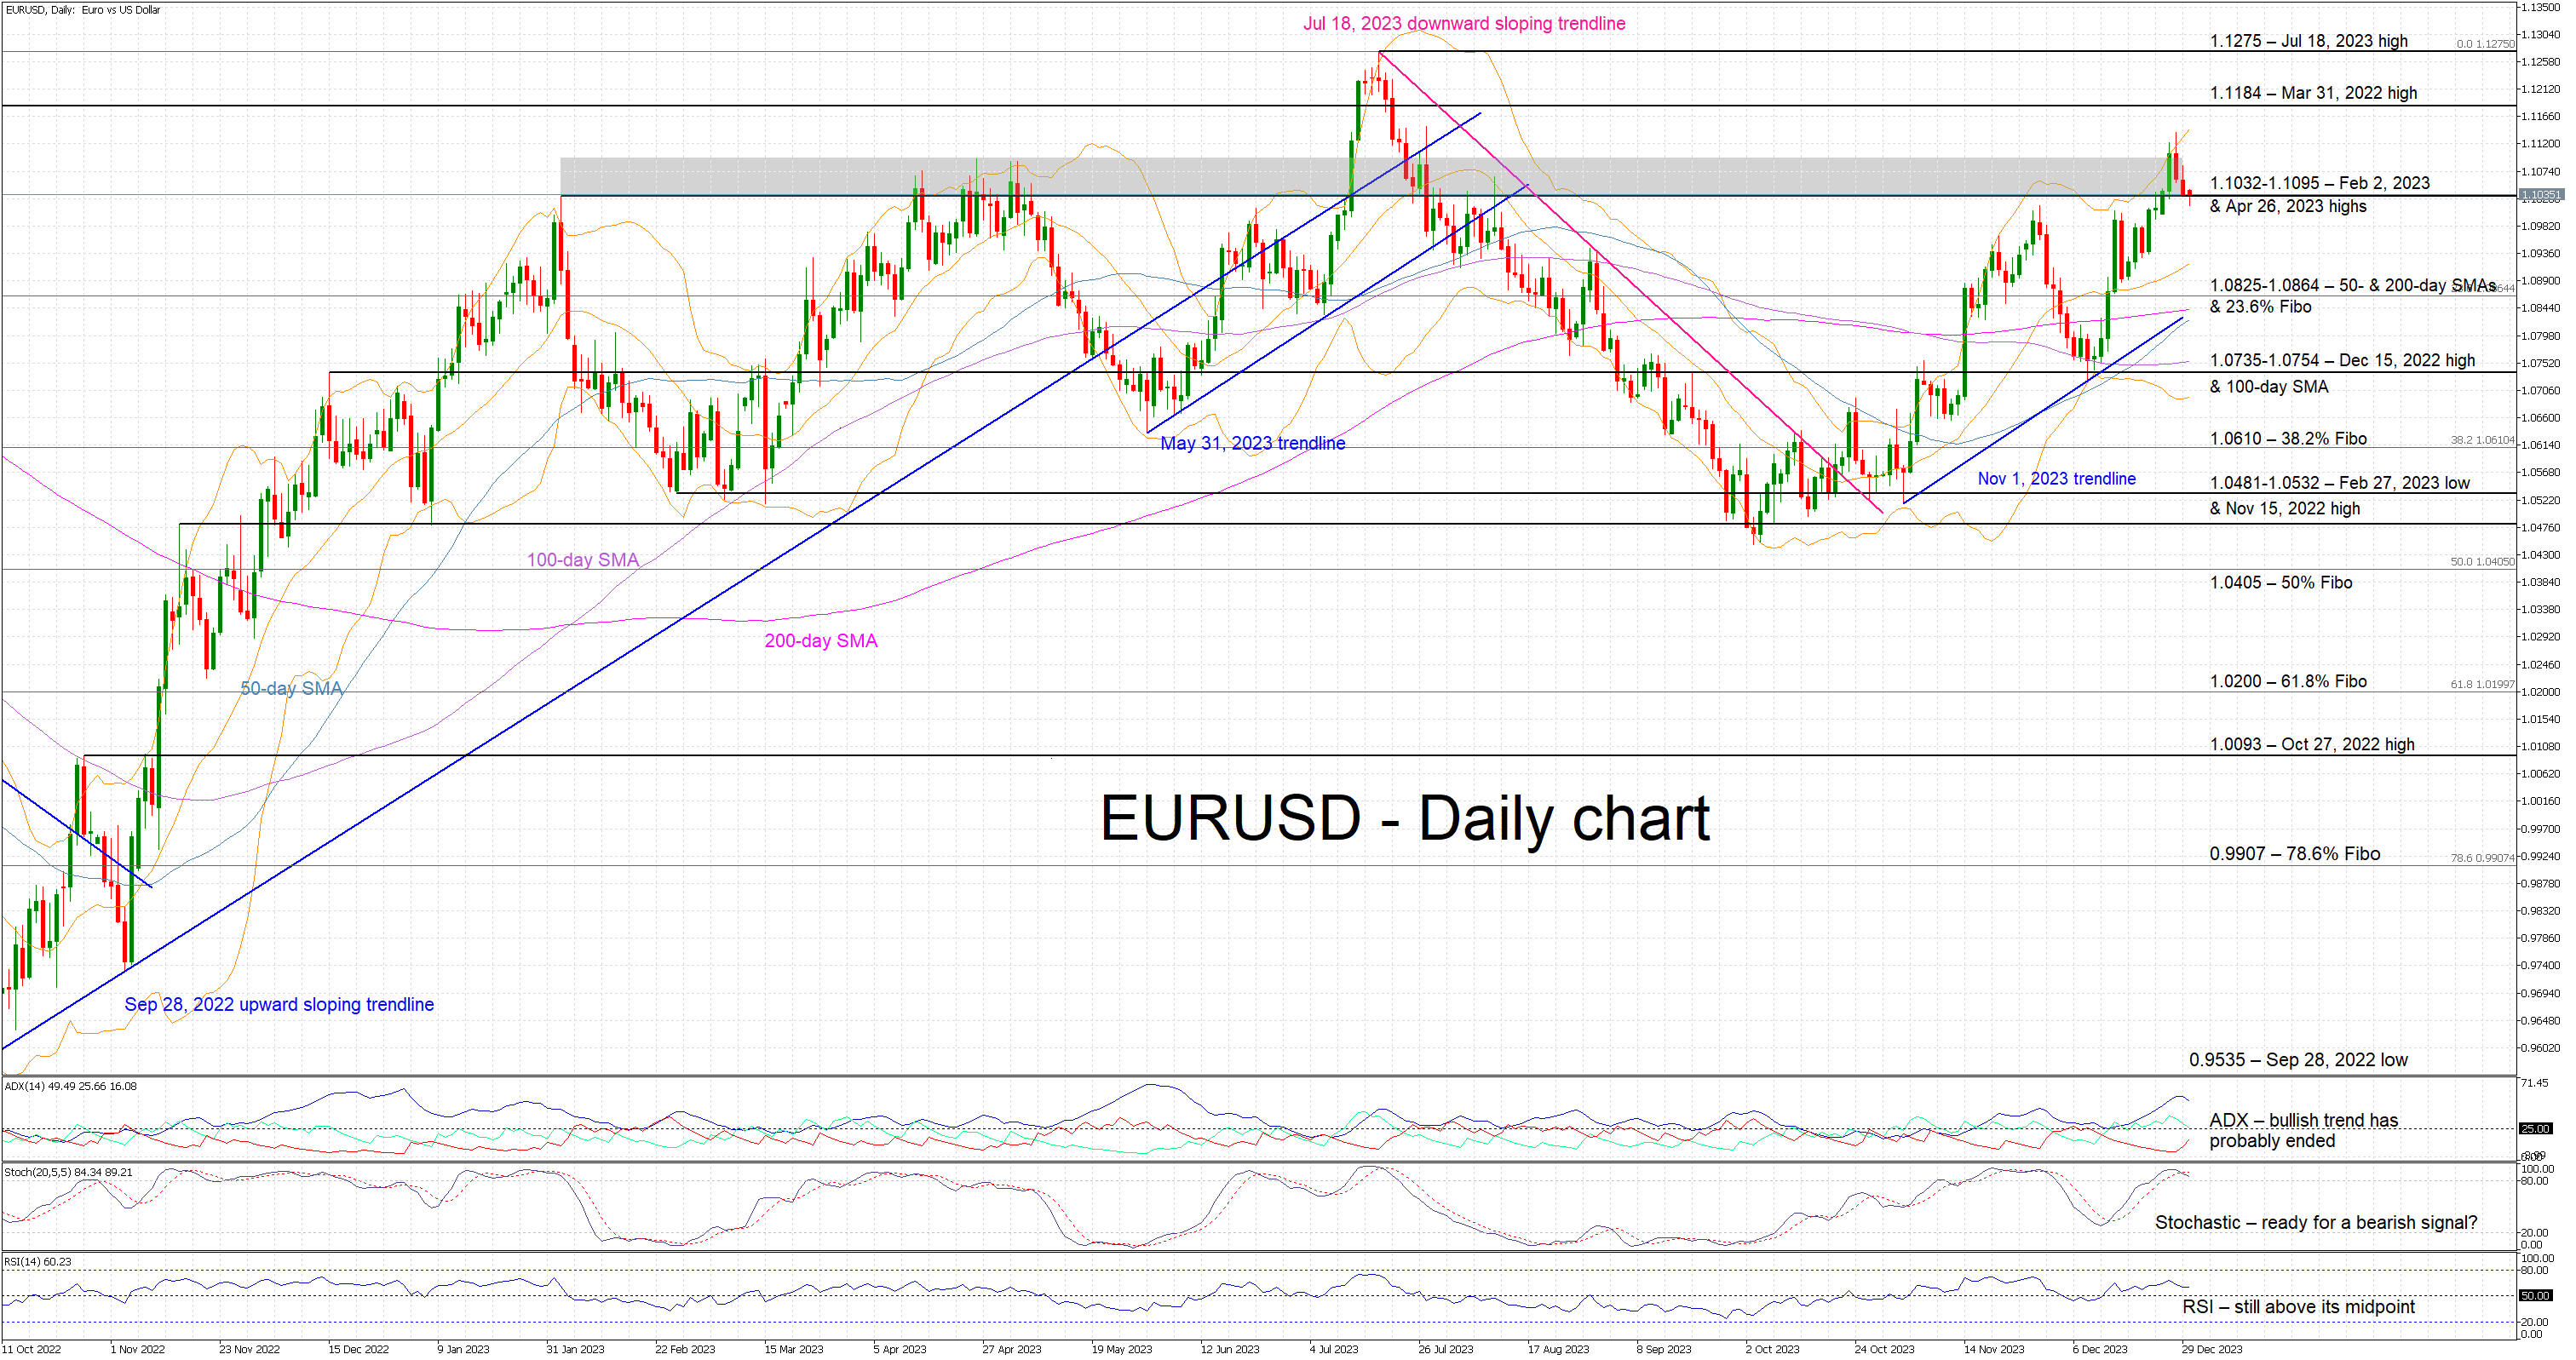
EURUSD Fails Again at Key Resistance Area
- EURUSD in the red again today after making a new 5-month high
- The key resistance area at 1.1032 is playing a key role in this move
- Momentum indicators signal that the current bullish move has probably ended
EURUSD is registering its third straight red candle, after reaching a new 5-month high at 1.1139. However, the busy 1.1032-1.1095 area, which has been making the bulls’ lives difficult since February 2023 with several failed breakout attempts recorded, appears to have played a key part again. EURUSD is edging lower with the momentum indicators ready to send strong bearish signals.
The RSI is heading towards its 50-threshold and the Average Directional Movement Index (ADX) has peaked and is now edging lower, possibly confirming the completion of the current bullish trend in EURUSD. More crucially, the stochastic oscillator has crossed below its moving average and it appears ready to break below its overbought territory. Should this take place, it would be seen as a strong bearish signal.
If the bulls remain hungry, they could try again to overcome the busy 1.1032-1.1095 area, which is populated by the February 2, 2023 and April 26, 2023 highs. If they are successful, they could then have a go at pushing EURUSD towards the March 31, 2022 and the July 18, 2023 highs at 1.1184 and 1.1275 respectively.
On the flip side, the bears are keen to push EURUSD decisively below the 1.1032-1.1095 range. They could then stage a move towards the 1.0825-1.0864 area, which is defined by the 50- & 200-day simple moving averages (SMAs) and the 23.6% Fibonacci retracement of the September 28, 2022 – July 18, 2023 uptrend. Even lower, the 1.0735-1.0754 region set by the December 15, 2022 high and the 100-day SMA could prove stronger to break than currently foreseen.
To sum up, EURUSD bulls appear to have failed again at overcoming the busy 1.1032-1.1095 area and thus opening the door for a more protracted correction, especially if the stochastic oscillator sends a strong bearish signal.
Goodbye 2023 and Hello to a Potentially Volatile 2024
Auld Lang Syne to 2023 and welcome 2024! Here is a recap of the key highlights that shocked global markets in 2023 and the potential emerging themes to look out for in 2024 as well as my “Chart Of The Year”.
2023 key highlights & cross-assets performances in the past 2 years
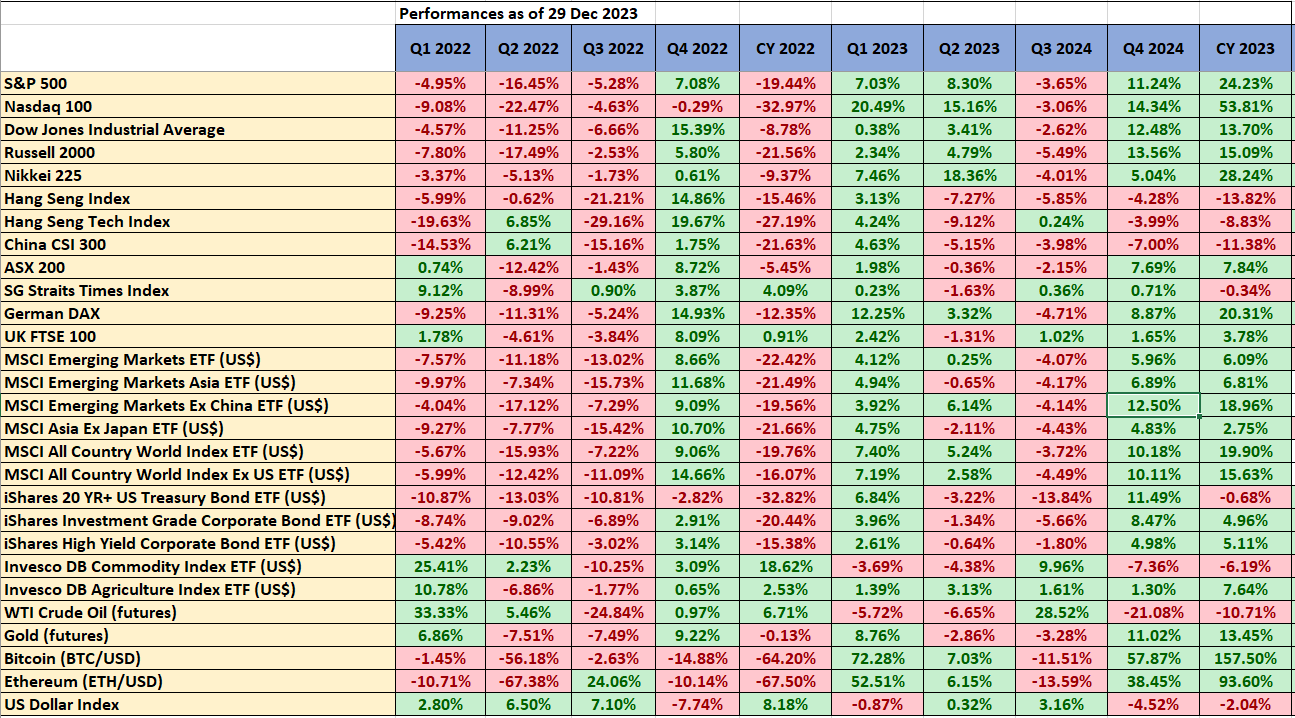
Fig 1: Cross assets performances as of 29 Dec 2023 (Source: TradingView, click to enlarge chart)
- The US Federal Reserve’s stance of keeping interest rates higher for a longer period in the first half of 2023 triggered a resilient US dollar environment in the absence of a recession scenario in the US that led the US stock market to outperform the rest of the world.
- The outperformance of the US stock market in 2023 was led by the Magnificent 7 (Apple, Amazon, Microsoft, Alphabet/Google, Nvidia, Meta, Tesla) mega-cap technology stocks that have stronger balance sheets and are skewed toward “AI productivity” theme play. Also, these 7 stocks have a significant combined market-cap weightage in the Nasdaq 100 that recorded an annual gain of 54% in 2023 (2.3 times S&P 500’s 2023 returns).
- US regional banking crisis that led to the collapse of Silicon Valley Bank & First Republic Bank due to poor balance sheet risk management reinforced by outsized mark-to-market losses on longer-term US Treasuries (higher US Treasury yields via Fed’s tightening monetary policy). It also indirectly led to the demise of Credit Suisse which eventually was brought over by rival UBS.
- The US regional banking crisis was just a blip, negated by a liquidity backstop orchestrated by the US Treasury; the Bank Term Funding Program (BTFP).
- The risk-off behaviour in Q3 reversed abruptly in Q4 to a raging risk-on FOMO behaviour triggered by a significant easing liquidity condition in the US; the rapid drawdown of the Fed’s overnight reverse repo facility from a peak of US$2.55 trillion in December 2022 to US$683.25 billion (-74%) for the week of 11 Dec 2023 as money market funds that choose to invest their surplus cash in short-term US Treasury bills instead (rather than parking in overnight reverse repos facility) which in turn helped to fund the US Treasury general account (also US Treasury’s issuance switch from longer-term Treasuries to T-bills for funding needs).
- A rise in the expectations of a Fed’s dovish pivot where the first Fed funds rate cut is priced in to come as early in March 2024 indicated by the CME FedWatch tool that led to a slide of 120 basis points (bps) in the US 10-year Treasury yield from a 16-year high of 5% printed on 23 October 2023, synchronized with a weakening US dollar that kickstarted a rally in almost all asset classes (equities, bonds, gold, cryptocurrencies) except oil & China-related risk assets.
- China’s post-Covid re-opening bullish theme play on China and Hong Kong stock markets fizzled out after Q1 due to a heightened deflationary risk spiral caused by a persistent weak property market in China. The Hang Seng Index ended 2023 with a fourth consecutive annual loss of -14% (prior years’ losses of -15% in 2022, -14% in 2021 & -3% in 2020); its worst performance streak since 2000.
- Due to China’s structural weakness (deflationary risk spiral), China, and Hong Kong stock markets failed to respond to the cyclical upswing in risk assets during Q4 2023 reinforced by renewed US dollar weakness. The CSI 300 and Hang Seng Index recorded losses of -7% and -4.3% respectively in Q4 whereas the MSCI Emerging Markets Ex China exchange-traded fund gained by +12.5% over the same period, slightly outperformed the US S&P 500’s Q4 return of +11.24%
- The Japanese yen (JPY) plummeted to a 33-year low against the US dollar in Q3 2023 due to the Bank of Japan (BoJ)’s newly appointed Governor Ueda’s reluctance to offer firm guidance to normalize its short-term negative interest rate policy despite Japan’s core inflation rate had exceeded BoJ’s 2% target for the 20th consecutive month.
Emerging themes for 2024
- A potentially weaker US dollar due to the shrinkage of the US Treasury yield spread premium against the rest of the world, and a potential major JPY strength revival triggered by internal economic factors (service prices in Tokyo rose at their fastest pace since 1994 to a record gain of 3% y/y in November 2023, indicating an increase in the odds of sustainable wage-driven inflationary growth), political and business groups’ mounting pressures against a weaker JPY.
- The rest of the world equities may outperform the US stock market due to a weaker US dollar environment. Keep a lookout on China for potentially more “generous” fiscal and monetary policy stimulus measures that may stoke positive animal spirits in the short to medium term for China and Hong Kong stock markets.
- The stepped-up dovish expectations on the upcoming Fed’s interest rate cut cycle compiled with rosy earnings forecasts by analysts polled by FactSet that are projecting an earnings growth of +11.5% y/y for the US S&P 500 in CY 2024, a significant improvement from an expected CY 2023 earnings growth of just 0.6% which in turn have indicated another year of goldilocks scenario for the US economy.
- In contrast, the hastened speed of 6 interest rate cuts by the Fed in 2024 projected by market participants in the interest rates futures market also implied a probable US recession-liked scenario in 2024. In addition, the latest November 2023 data of the Conference Board US Leading Economic Index (LEI) has continued to flash a recession signal reinforced by weakness in the housing and labour market. If a recession hits the US economy in the second half of 2024, earnings downgrades are likely to materialize and the initial projected S&P 500 CY 2024 earnings growth rate of +11.5% is likely to be tapered to the downside which in turn may trigger a risk-off scenario that can overshadow the initial positive feedback loop from easing liquidity conditions.
- Potential heightened geopolitical tension between the US and China that may also spark a risk-off scenario in the latter part of 2024; the recently concluded China’s annual economic work plan conference attended by the top leadership stated that 2024 top priority will be on building a modern industrial system with a focus on developing cutting-edge technologies and artificial intelligence. Making high-tech industrialization a key priority in 2024 is likely to invite more scrutinization from neo-conservative US politicians that may put a strain on the current US-China relationship in the run-up to the November 2024 US presidential election. There is likely to be intense debate among the presidential candidates and finger-pointing again at China’s current industrialization policy that needs to be “neutralized” due to its potential national security threat to the US.
Chart Of The Year – a potential major top in USD/JPY
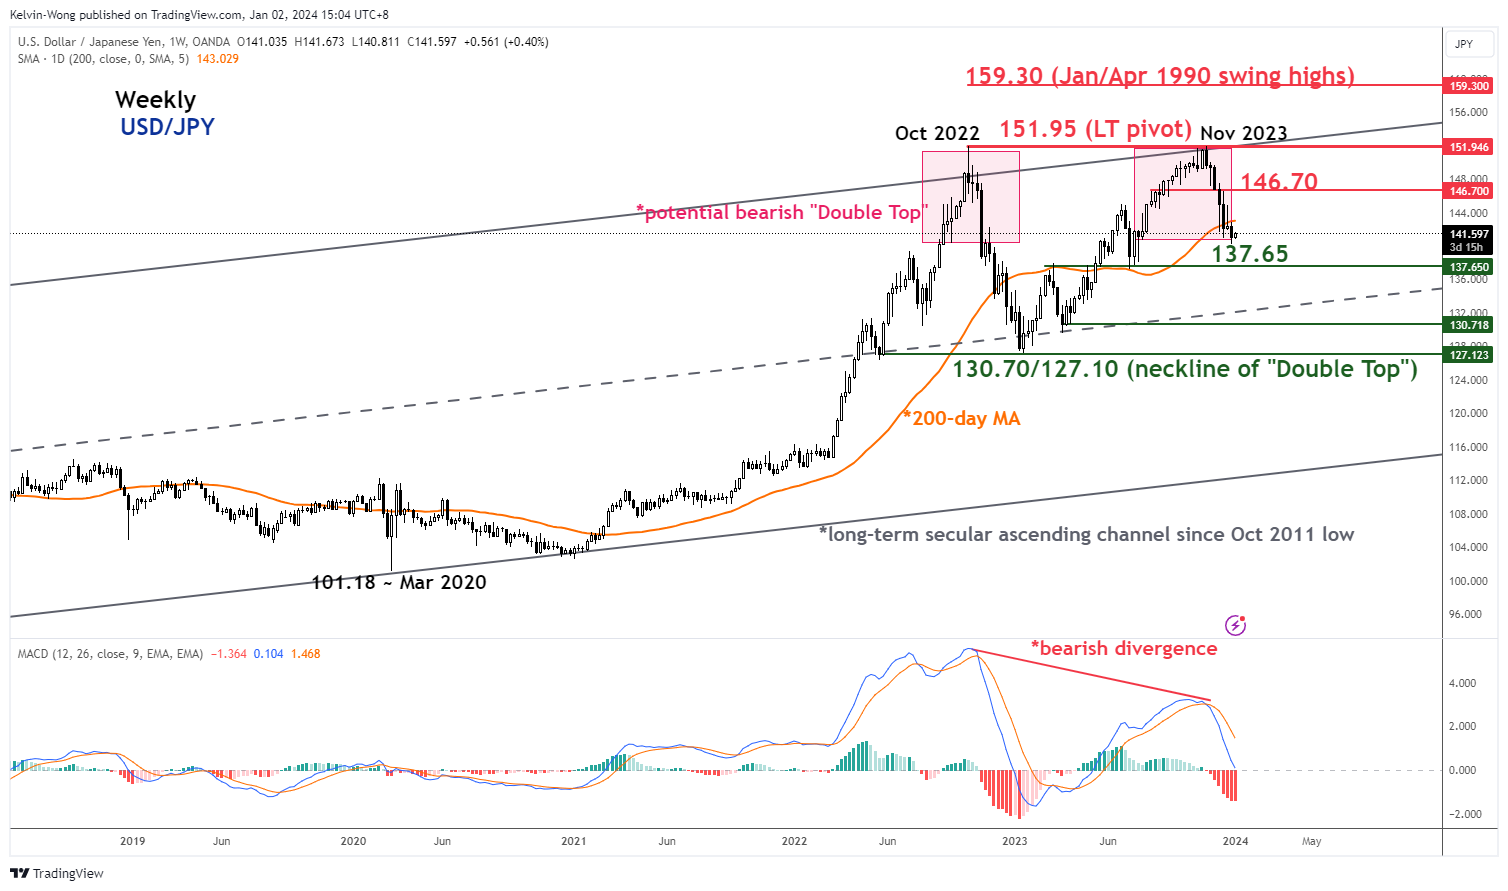
Fig 2: USD/JPY major trend as of 2 Jan 2024 (Source: TradingView, click to enlarge chart)
- The price actions of USD/JPY have declined by 8% to hit an intraday low of 140.25 in December 2023 after a bearish reaction from its 151.95 long-term pivotal resistance printed in mid-November 2023.
- The USD/JPY has traced out a potential impending major bearish reversal “Double Top” configuration considering the developments of its price actions from October 2022 to November 2023.
- In addition, the weekly MACD trend indicator has flashed out a bearish divergence condition over the same period (October 2022 to November 2023) which indicates the major uptrend phase from the March 2020 low of 101.18 has started to lose upside momentum which in turn increases the odds of a multi-month corrective decline to unfold next.
- A breakdown with a weekly close below 137.65 support exposes the next major support zone of 130.70/127.10 (also the neckline of the “Double Top” & 50% Fibonacci retracement of the prior major uptrend phase from March 2020 low to November 2023 high).
- On the other hand, a clearance above 151.95 invalidates the bearish scenario to see the next major resistance coming in at 159.30 in the first step.
Markets are Back From Holiday
In focus today
We wish our readers a Happy New Year on this first trading day of 2024.
Today's calendar looks light with the most important data release being the Eurozone M3 measure of money supply for November. M3 has been on a downward trajectory since ECB started their tightening policy, which bodes negative for the economic outlook.
Final December manufacturing PMIs will also be released for a wide range of countries, including Sweden, Spain, Italy, Germany, Europe and UK.
For the remainder of the week focus will be tilted mainly towards the US, as we get the ISM manufacturing index, JOLTs and FOMC minutes on Wednesday, while the December Jobs Report and ISM services index are due for release on Friday. We look for non-farm payrolls printing at +170k and average hourly earnings growth coming in at +0.2% m/m.
In Europe, the most important release will be preliminary Eurozone HICP for December on Friday. After declining for seven consecutive months, we expect headline HICP to turn north, creeping higher to 2.9% y/y, as the base effects from energy prices are fading. Core inflation is expected to keep declining to 3.3% y/y. Inflation numbers out of Spain on Friday surprised to the downside, while figures from Germany and France released on Thursday should give us an indication of what to expect from HICP on Friday.
Economic and market news
What happened during Christmas: In the absence of any significant macro news, the 'everything' rally continued in the trading days between Christmas and New Year. Lower yields and higher equities were the overarching theme as growing expectations for monetary policy easing continue to support the market sentiment. Markets are now pricing in 150bp and 165bp of rate cuts in 2024 for the Fed and the ECB, respectively. Over the last two weeks, the 10Y UST yield has dropped 8bp to 3.85%, while the MSCI AC World Index is up by roughly 1.5%.
On the geopolitical front, tensions are still ongoing with Israel announcing its plans to shift tactics, withdrawing thousands of its troops from Gaza, while Yemen's Houthi rebels are still attacking pro-Israeli shipping in the Red Sea. Biden's hope of a new international maritime force, focusing on restoring security, remains unsettled, especially since the USS Gerald R. Ford aircraft carrier was called back from the Middle East yesterday. In respect of Russia's invasion of Ukraine, talks have been held among G7 with regards to confiscating USD 300bn of Russian assets, and channelling these funds to Ukraine. This could help dampen the growing scepticism of providing new funding packages to Ukraine seen in both Europe and the US.
What happened overnight: NBS PMI manufacturing for December surprised to the downside, printing 49.0 (consensus: 49.5, November: 49.4), while the broader Caixin PMI manufacturing came in at 50.8, surprising to the upside and slightly higher than the November print of 50.7.
Equities: Amid a strong Christmas rally, equities retreated on Friday. The narrative has been the same over the holidays: Yields and repricing of central banks sending a broad range of sectors higher, primarily small caps. Interestingly, large caps cyclicals have flat-lined while mostly defensives (utilities, staples, health care, financials) were beating the tape last week. Weak macro and probably fatigue after a ninth-straight weekly gain triggered some selling ahead of New Year with S&P -0.3% and small cap Russell 2000 -1.5%. US futures are slightly higher again this morning.
FI: The market closed on a positive note as 10Y US Treasuries and Bunds declined by some 40bp during December. The market is factoring in almost 6-7 rate cuts from ECB and the Federal Reserve in 2024. Given the solid rally we have seen in Q4, we expect a slower movement from now as we need to see the more evidence in terms of lower inflation and limited wage pressure for the many rate cuts to materialise in 2024. We do not believe in as many rate cuts from ECB, but the easing cycle will be begin in 2024, so there a risk of rebound in yield/rates during 2024.
FX: Summarizing the FX year of 2023, we note that the USD ended up in the losing camp within G10, together with NZD, NOK and JPY, despite the two latter's comebacks during Q4. CHF stands out as the top performer through the year (vs USD) but notably the SEK also closed 2023 as a positive year, after a remarkable comeback during H2. Looking into 2024, we foresee USD strength and Scandie weakness over the medium-term horizon.
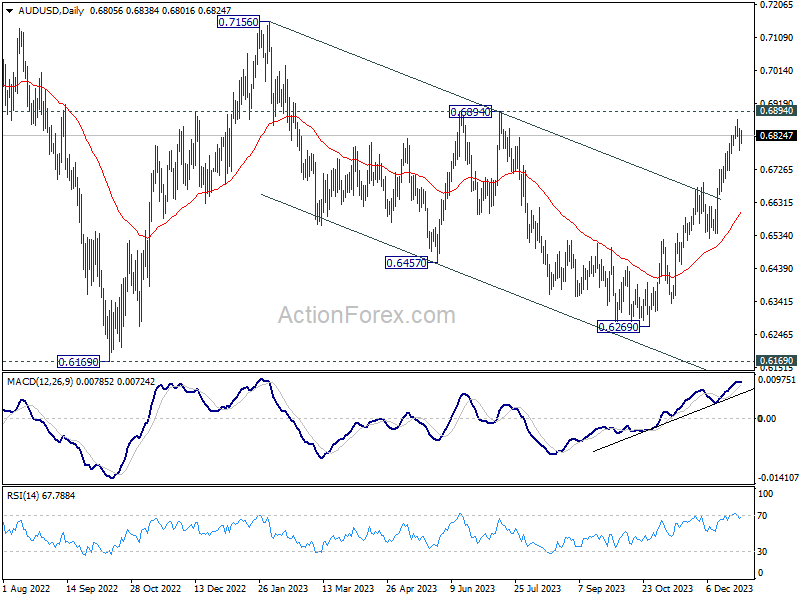
AUD/USD Daily Report
Daily Pivots: (S1) 0.6779; (P) 0.6812; (R1) 0.6845; More...
Intraday bias in AUD/USD stays neutral at this point. On the upside, decisive break of 0.6894 resistance will extend the rally from 0.6269 towards 0.7156 key resistance next. On the downside, however, break of 0.6796 support will indicate short term topping, on bearish divergence condition in 4H MACD. Intraday bias will be turned back to the downside for pullback to 0.6689 resistance turned support.
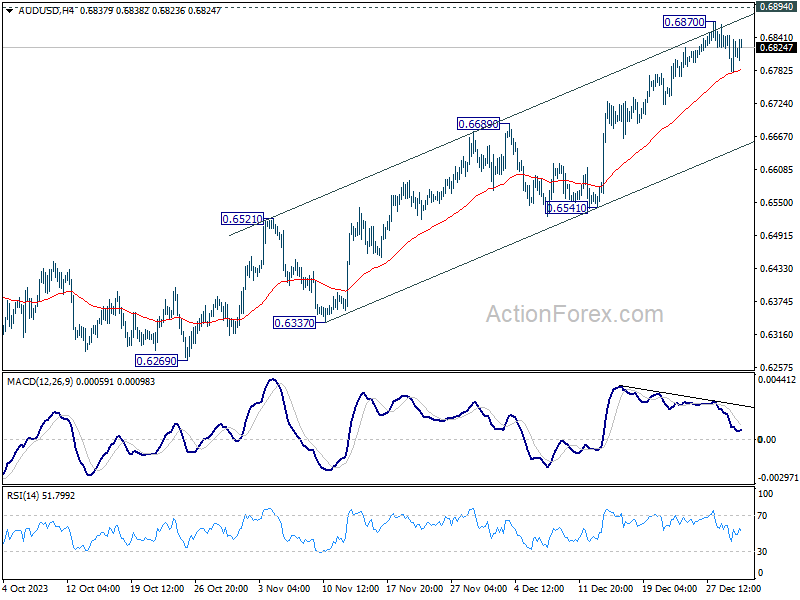
In the bigger picture, there is no confirmation that down trend from 0.8006 (2021 high) has completed. Price actions from 0.6169 (2022 low) could be just a medium term corrective pattern. Rise from 0.6269 is seen as the third leg of the pattern. For now, range trading should be seen between 0.6169 and 0.7156 (2023 high), until further developments.
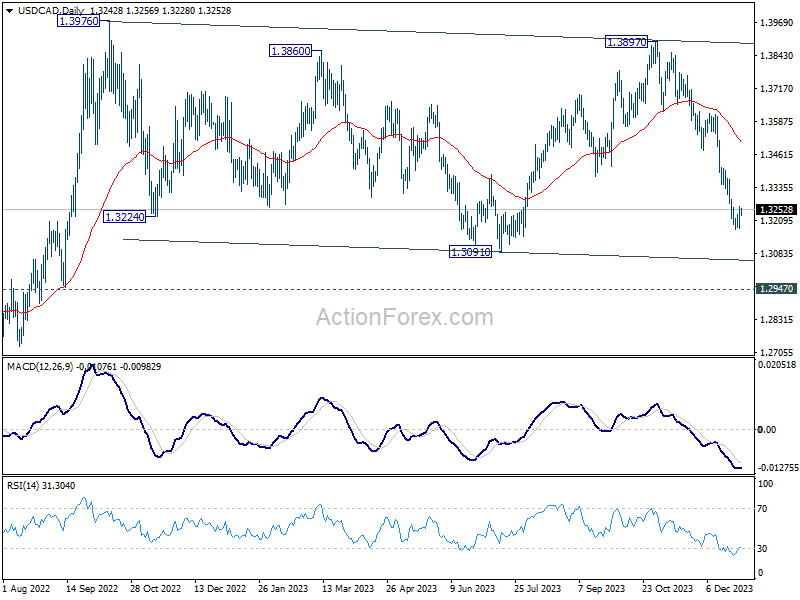
USD/CAD Daily Outlook
Daily Pivots: (S1) 1.3196; (P) 1.3230; (R1) 1.3283; More...
Intraday bias in USD/CAD stays neutral at this point and some more consolidations could be seen. On the downside, break of 1.3176 will resume the fall from 1.3897 to 1.3091 support and possibly below. Nevertheless, considering bullish convergence condition in 4H MACD, break of 1.3284 will indicate short term bottoming, and turn bias back to the upside for stronger rebound.
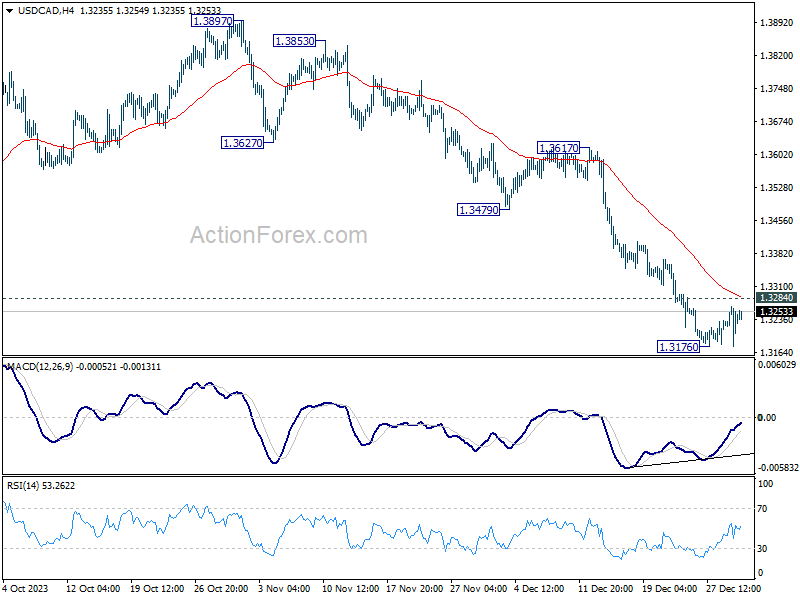
In the bigger picture, outlook is mixed up by deeper then expected fall from 1.3897. But after all, price actions from 1.3976 (2022 high) are viewed as a corrective pattern that's in progress. Larger up trend from 1.2005 (2021 low) is still expected to resume at a later stage as long as 1.2947 resistance turned support holds.