
Sample Category Title
Technical Outlook and Review
DXY:
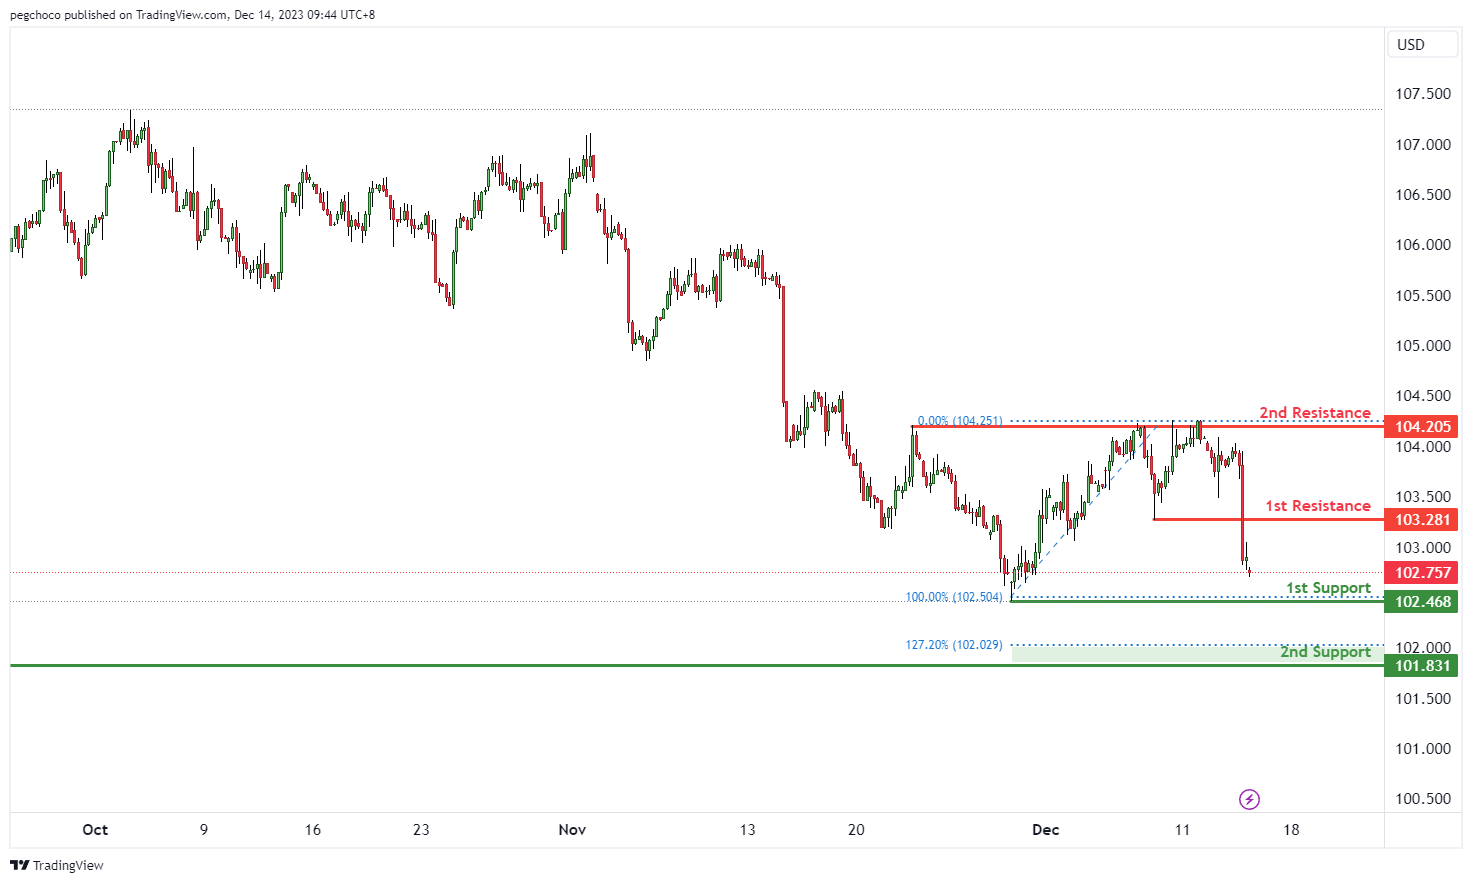
The DXY (US Dollar Index) chart currently shows a bearish overall momentum, indicating a downward trend in the US dollar. Price could potentially continue this bearish movement towards the 1st support level.
The 1st support at 102.46 is categorized as a swing low support, and it has historical significance as a level where buying interest emerged in the past. Traders should watch this level for potential signs of a temporary pause or reversal in the bearish movement.
The 2nd support at 101.83 is identified as an overlap support and coincides with the 127.20% Fibonacci Extension level. This suggests that it could be a stronger support level, but it’s still essential to monitor price action around this level carefully.
On the resistance side, the 1st resistance at 103.28 is considered a pullback resistance. This level may act as a barrier where selling interest could intensify, potentially causing a continuation of the bearish trend.
Further up, the 2nd resistance at 104.20 is categorized as a multi-swing high resistance, indicating another level where selling pressure may increase.
EUR/USD:
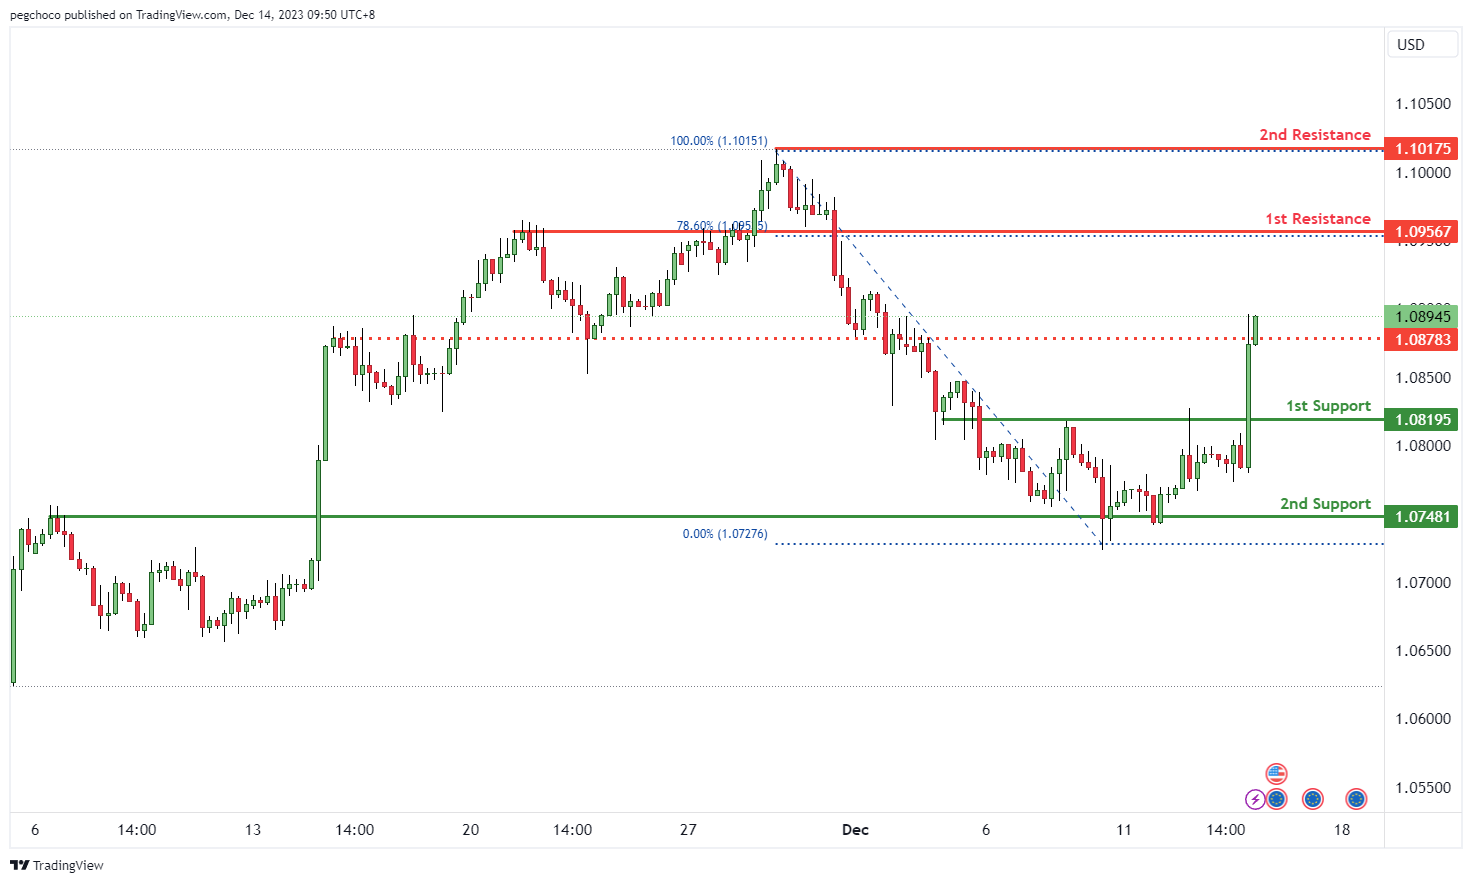
The EUR/USD chart currently has a bullish overall momentum, indicating an upward trend in the Euro against the US Dollar. Price could potentially continue this bullish movement towards the 1st resistance level.
The 1st support at 1.0819 is categorized as a pullback support. This level is significant as it suggests a potential area where buying interest may emerge, providing temporary support for the EUR/USD pair.
The 2nd support at 1.0748 is identified as an overlap support and coincides with the 78.60% Fibonacci Retracement level. This suggests that it could be a stronger support level, but it’s still essential to monitor price action around this level carefully.
On the resistance side, the 1st resistance at 1.0956 is considered a pullback resistance and coincides with the 78.60% Fibonacci Retracement level. This level may act as a barrier where selling interest could intensify, potentially causing a temporary pause or reversal in the bullish trend.
Further up, the 2nd resistance at 1.1017 is categorized as a swing high resistance, indicating another level where selling pressure may increase.
Intermediate resistance at 1.0878 also provides an important level to watch for potential price reactions.
EUR/JPY:
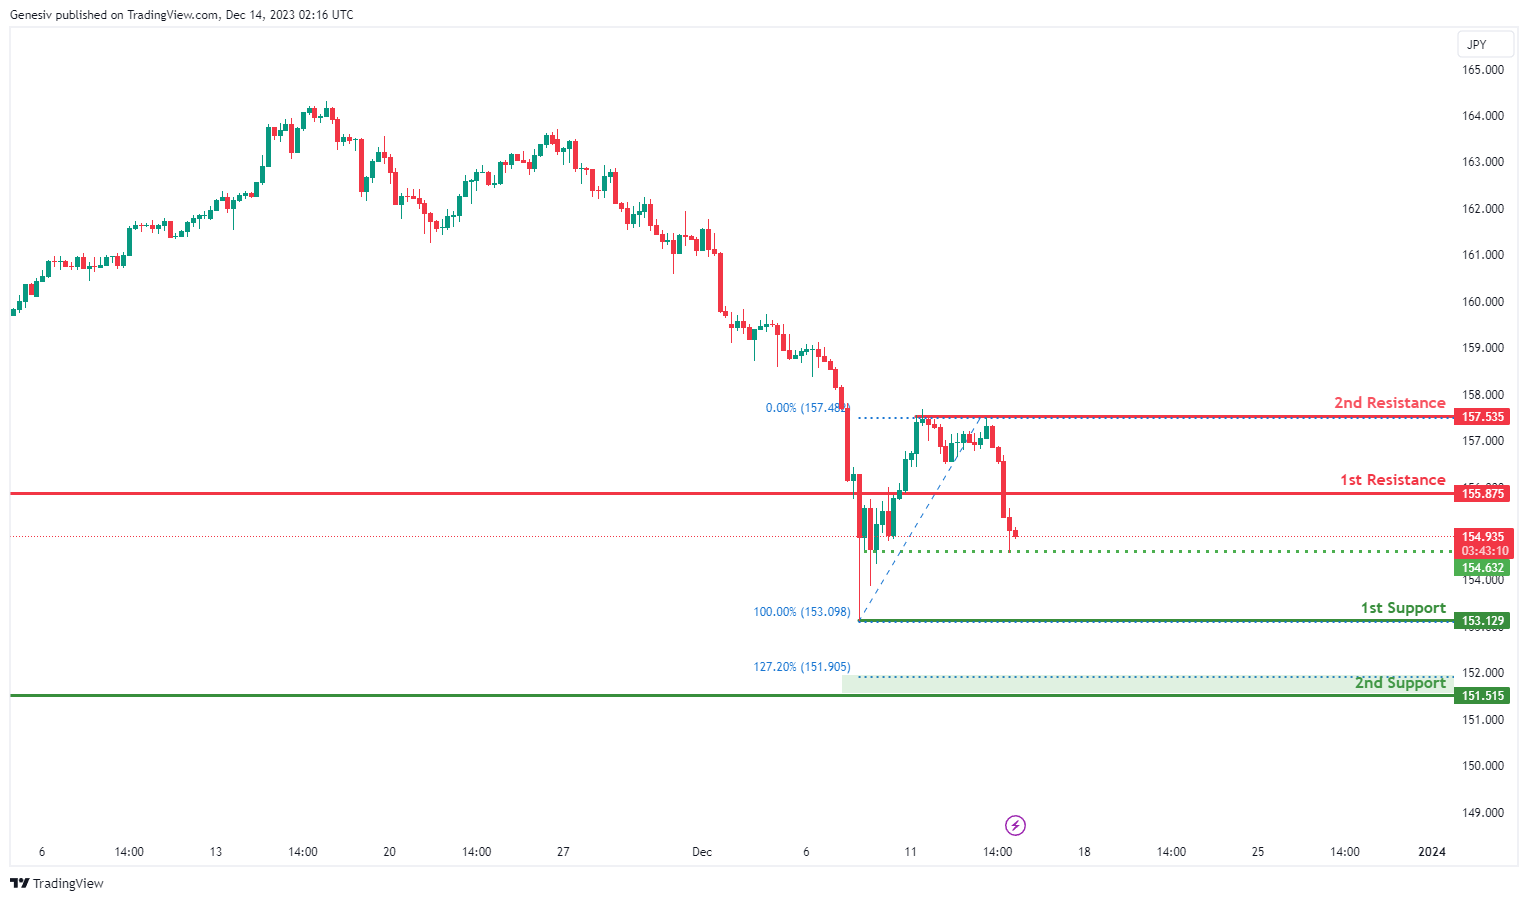
The EUR/JPY chart currently demonstrates a bearish overall momentum, and there is a potential for a bearish continuation towards the 1st support.
The 1st support at 153.13 is considered significant for several reasons. Firstly, it is identified as a pullback support, indicating a potential area where buying interest may emerge after a pullback, providing support for the currency pair. Additionally, this level aligns with the 100% Fibonacci Retracement, further reinforcing its significance as a potential reversal or bounce point.
Similarly, the 2nd support at 151.52 is characterized as a swing low support and is associated with the 127.20% Fibonacci Extension. This confluence strengthens the support level, suggesting that it could act as a crucial zone where buying interest may be present, providing additional support for a potential reversal or bounce.
On the resistance side, the 1st resistance at 155.88 is identified as a pullback resistance. This level is likely to act as a barrier where selling interest could intensify, potentially causing a pause or reversal in the bearish trend.
Furthermore, the 2nd resistance at 157.54 is associated with multi-swing high resistance. This level adds an extra layer of significance to the resistance, indicating a potential area where selling pressure may increase, especially considering its alignment with multiple historical swing highs.
EUR/GBP:
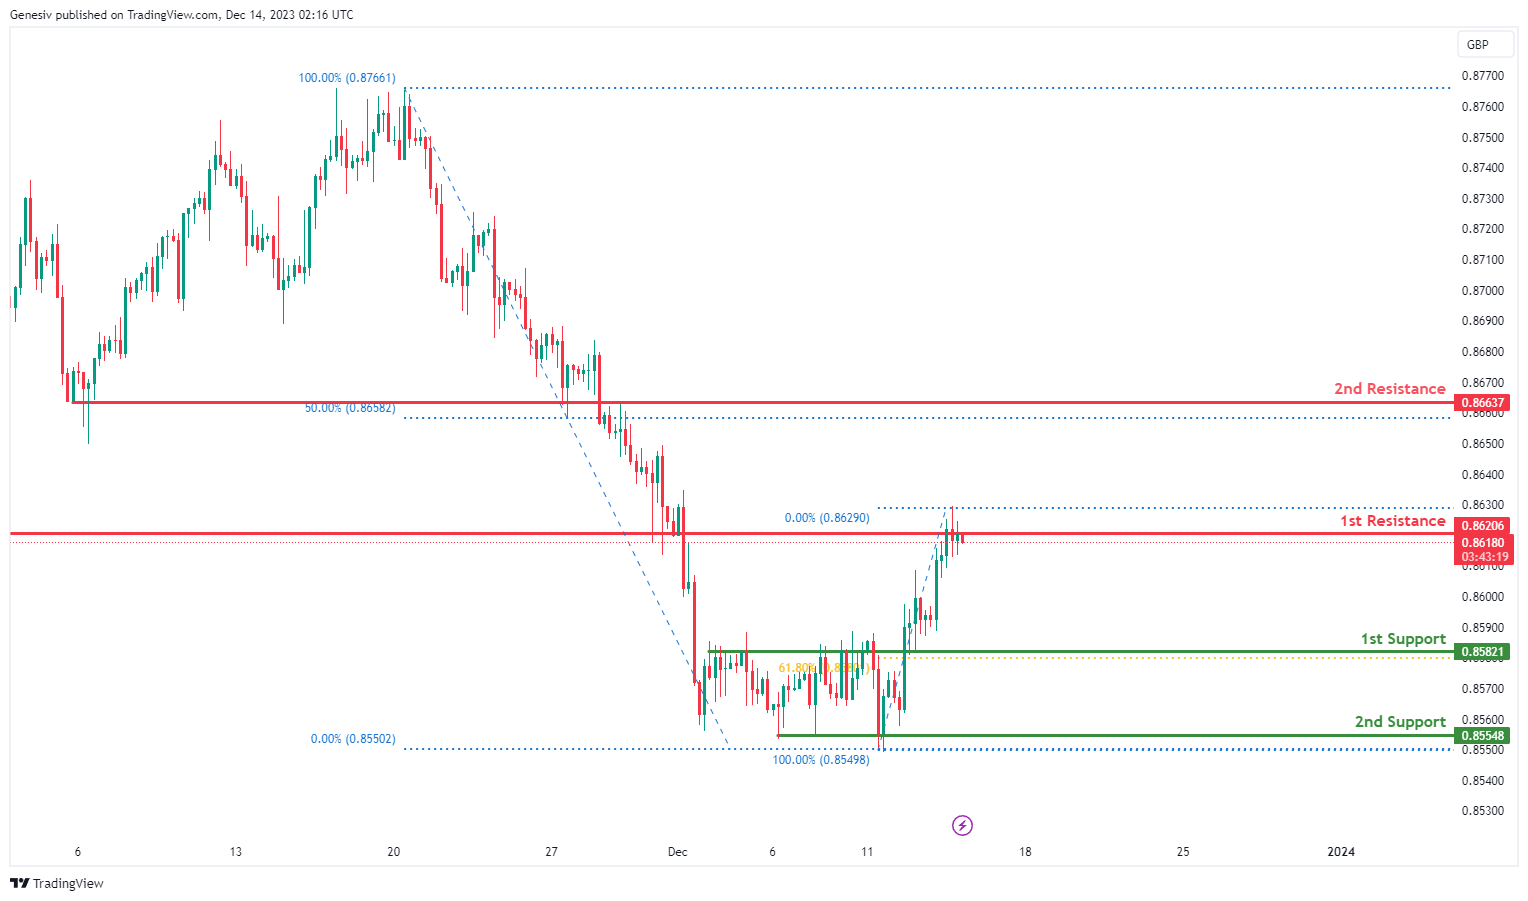
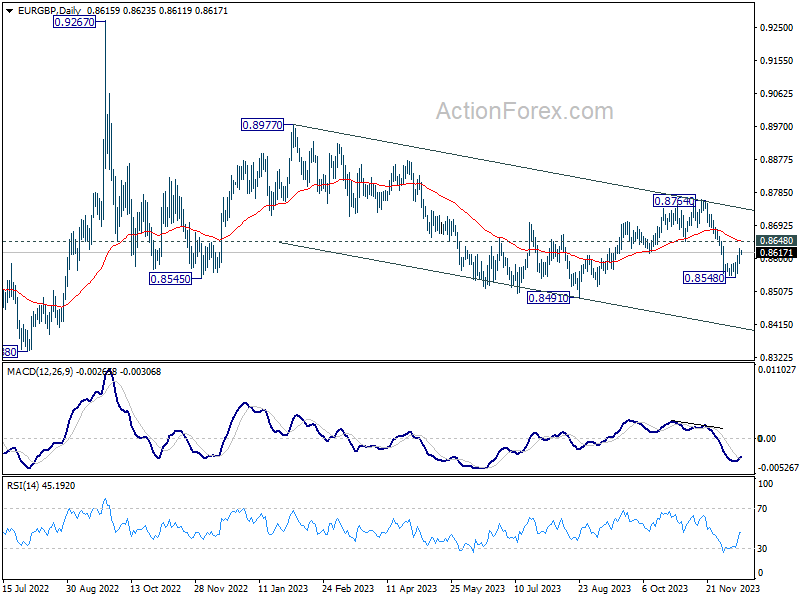
The EUR/GBP chart currently indicates a bearish overall momentum, and there is a potential scenario where the price may experience a short-term rise towards the 1st resistance before reversing and dropping towards the 1st support.
The 1st support at 0.8582 is considered significant for multiple reasons. Firstly, it is identified as an overlap support, suggesting a convergence of historical price points and reinforcing its potential as a crucial area where buying interest may emerge. Additionally, this support level aligns with the 61.80% Fibonacci Retracement, further enhancing its importance as a potential reversal or bounce point.
Similarly, the 2nd support at 0.8555 is characterized as a multi-swing low support and is associated with the 100% Fibonacci Retracement. This confluence strengthens the support level, suggesting that it could act as a significant zone where buying interest may be present, providing additional support for a potential reversal or bounce.
On the resistance side, the 1st resistance at 0.8621 is identified as a pullback resistance. This level is likely to act as a barrier where selling interest could intensify, potentially causing a pause or reversal in the short-term rise before a drop.
Furthermore, the 2nd resistance at 0.8664 is associated with both an overlap support and the 50% Fibonacci Retracement. This adds an extra layer of significance to the resistance, indicating a potential area where selling pressure may increase, especially considering the alignment with both technical and Fibonacci-based resistance.
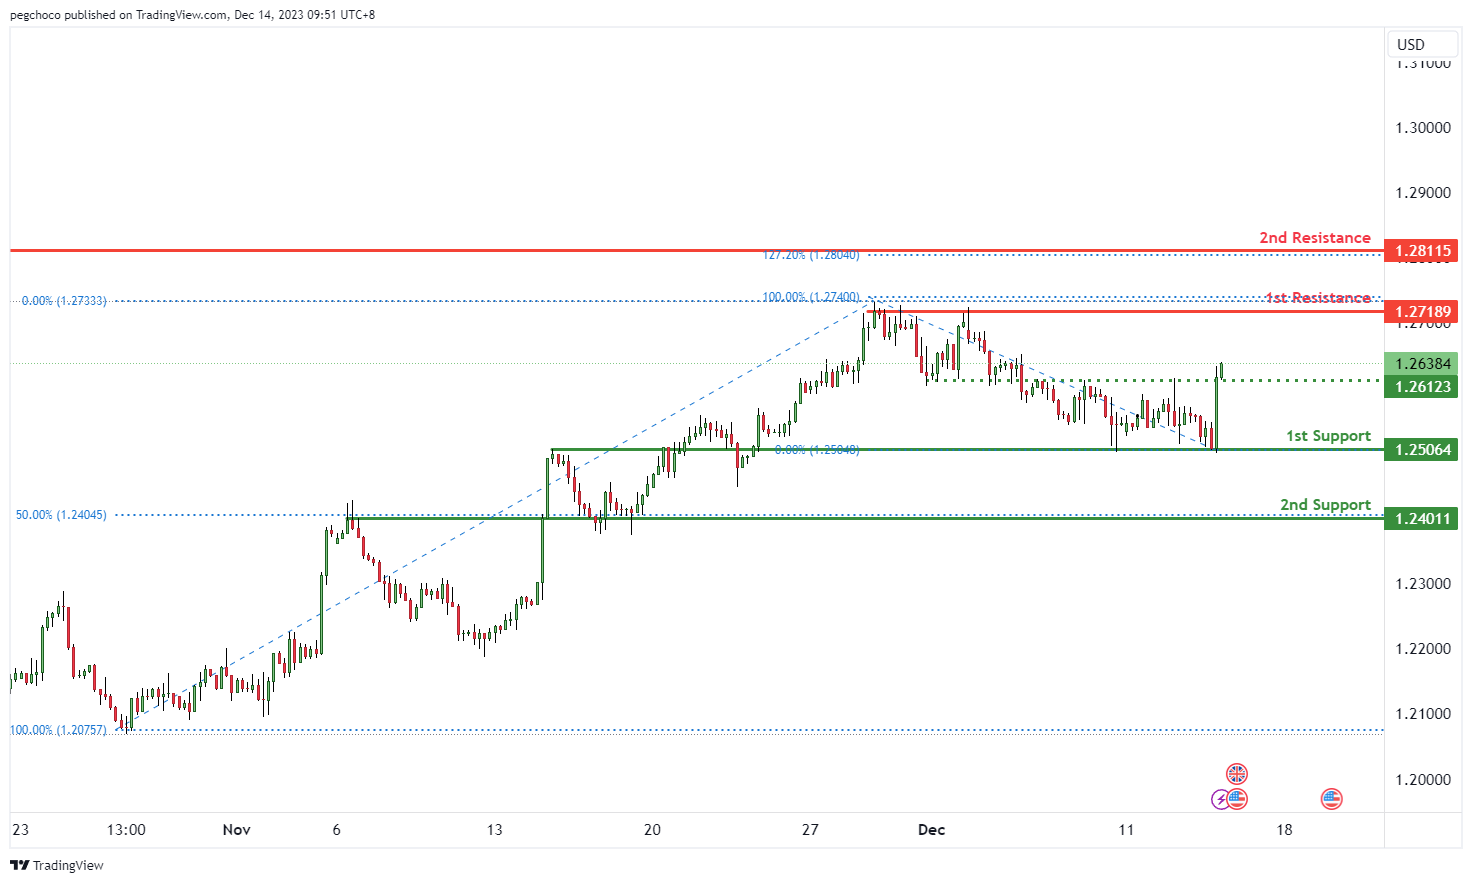
GBP/USD:
The GBP/USD chart currently exhibits a bullish overall momentum, indicating an upward trend in the British Pound against the US Dollar. Price could potentially continue this bullish movement towards the 1st resistance level.
The 1st support at 1.2506 is identified as an overlap support, which suggests that it has historical significance as a level where buying interest has emerged. This support level could provide temporary stability for the GBP/USD pair.
The 2nd support at 1.2401 coincides with the 50% Fibonacci Retracement level, further reinforcing its importance as a potential support level.
On the resistance side, the 1st resistance at 1.2718 is considered a multi-swing high resistance, indicating that it has historically acted as a significant barrier where selling interest intensified. This level is a key point to watch for potential price reactions.
The 2nd resistance at 1.2811 is also noteworthy as it coincides with the 127.20% Fibonacci Retracement level, indicating potential resistance based on Fibonacci analysis.
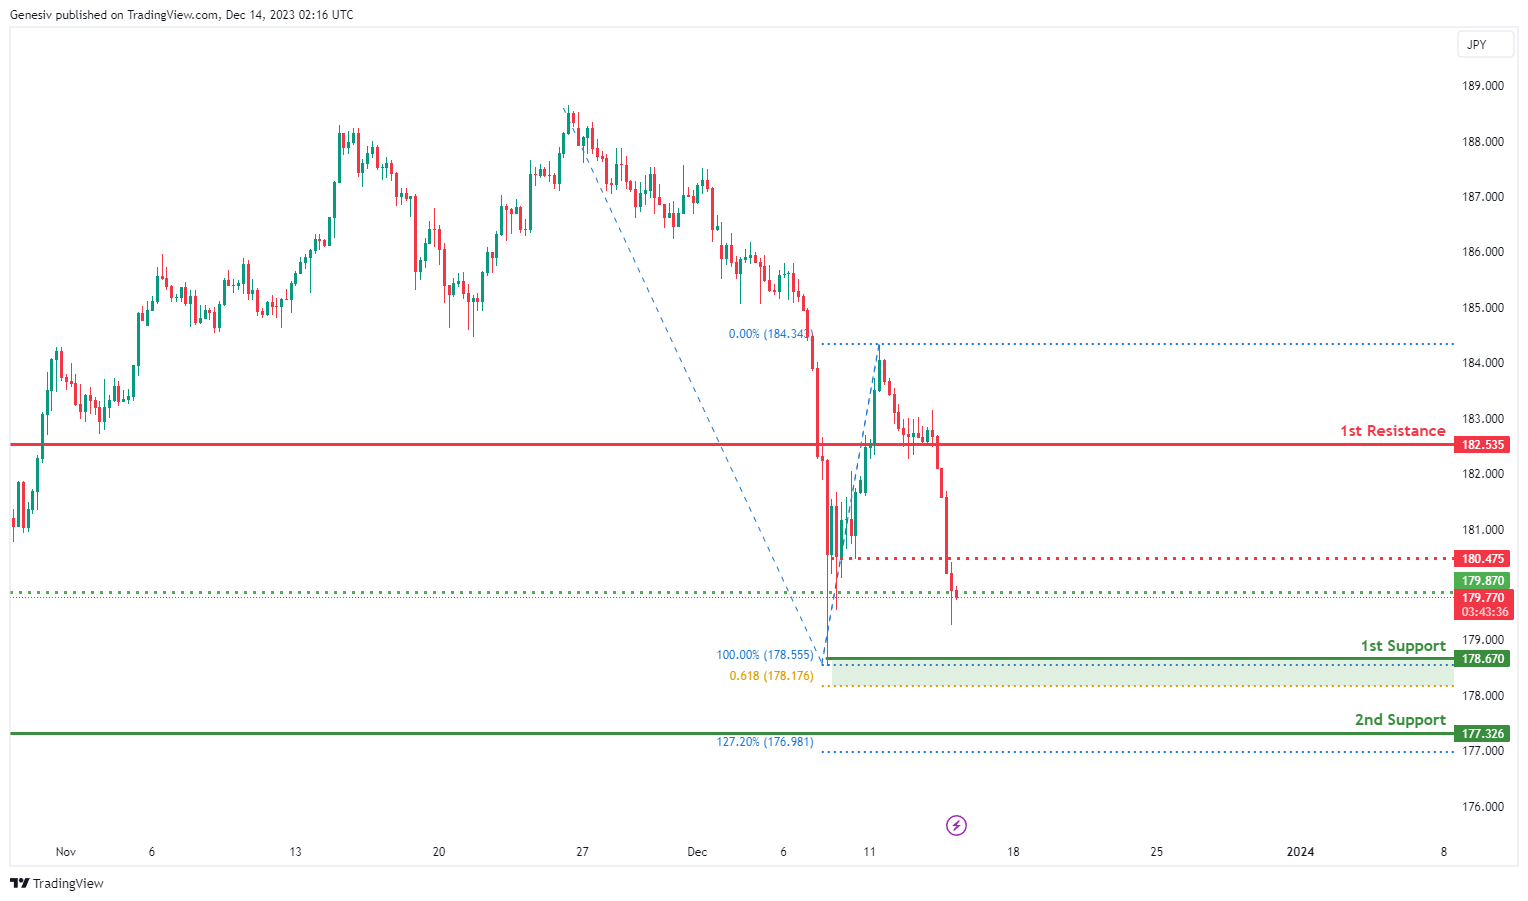
GBP/JPY:
The GBP/JPY chart currently indicates a bearish overall momentum, and there is a potential for a bearish continuation towards the 1st support.
The 1st support at 178.67 is considered significant for several reasons. Firstly, it is identified as a pullback support, suggesting a potential area where buying interest may emerge after a pullback, providing support for the currency pair. Additionally, this support level aligns with both the 100% Fibonacci Retracement and the 61.80% Fibonacci Projection, further reinforcing its importance as a potential reversal or bounce point.
Similarly, the 2nd support at 177.33 is characterized as a pullback support. This level adds to the support structure, indicating another potential zone where buying interest may be present, further supporting the potential for a bearish continuation.
On the resistance side, the intermediate resistance at 180.48 is identified as a pullback resistance. This level may act as a barrier where selling interest could intensify, potentially causing a temporary pause or reversal in the bearish trend.
Furthermore, the 1st resistance at 182.54 is associated with both a pullback resistance and an additional factor. This adds extra significance to the resistance, suggesting a potential area where selling pressure may increase, especially considering the presence of both pullback resistance and another technical factor.
Additionally, there is an intermediate support at 179.87 identified as a pullback support. This level may act as an interim support, providing a potential area for buyers before the price continues its bearish trend.
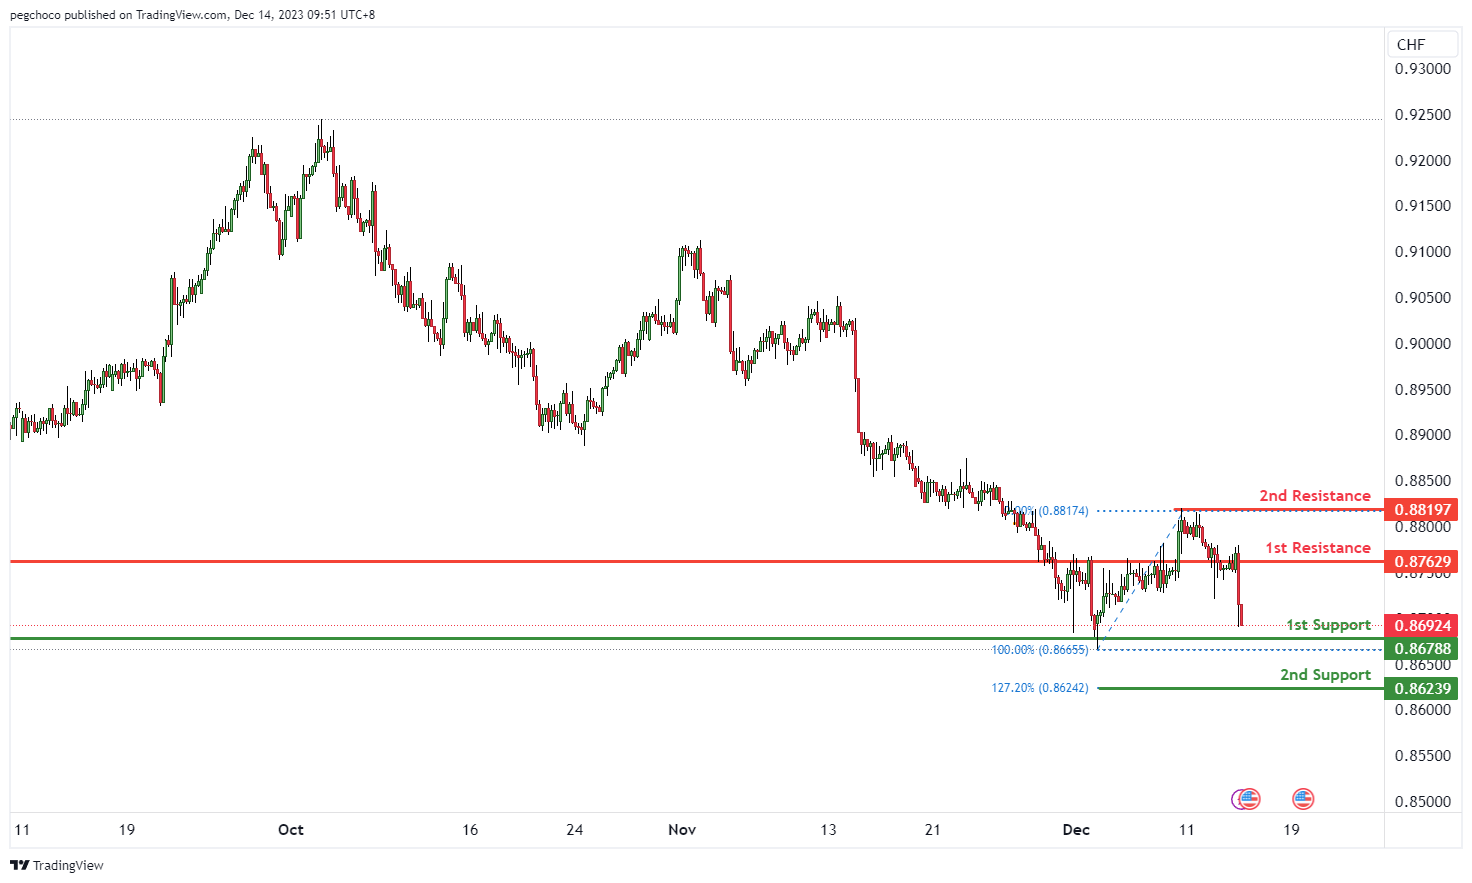
USD/CHF:
The USD/CHF chart currently exhibits a bearish overall momentum, indicating a downtrend in the US Dollar against the Swiss Franc. Price could potentially continue this bearish movement towards the 1st support level.
The 1st support at 0.8678 is identified as a pullback support, suggesting that it has historical significance as a level where buying interest has emerged temporarily. This support level could serve as a potential target for bearish traders.
The 2nd support at 0.8623 is noteworthy as it coincides with the 127.20% Fibonacci Extension level, indicating potential support based on Fibonacci analysis.
On the resistance side, the 1st resistance at 0.8762 is considered a pullback resistance, suggesting that it has historically acted as a significant barrier where selling interest intensified. This level is a key point to watch for potential price reactions.
The 2nd resistance at 0.8817 is identified as a multi-swing high resistance, indicating that it has historical significance as a level where selling pressure increased.
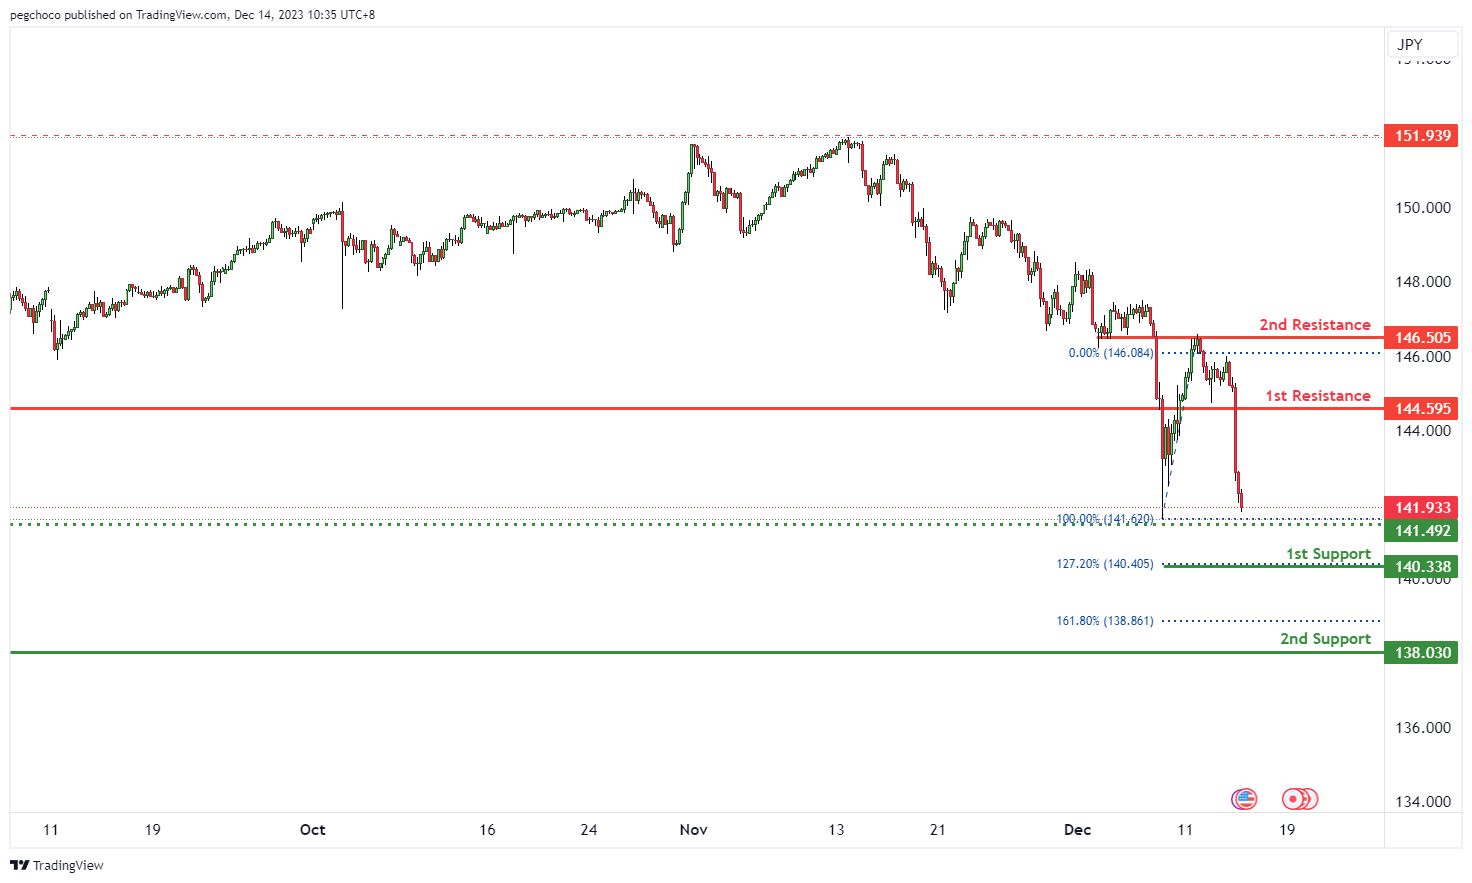
USD/JPY:
The USD/JPY chart currently exhibits a bearish overall momentum, indicating a downtrend in the US Dollar against the Japanese Yen. Price could potentially continue this bearish movement towards the 1st support level.
The 1st support at 140.33 is identified as a significant level based on the 127.20% Fibonacci Extension, suggesting potential support at this level.
The 2nd support at 138.83 is notable as it coincides with multi-swing low support, indicating historical significance as a level where buying interest has previously emerged.
On the resistance side, the 1st resistance at 144.59 is considered a pullback resistance, suggesting that it has historically acted as a substantial barrier where selling interest intensified. This level is a key point to watch for potential price reactions.
The 2nd resistance at 146.50 is identified as an overlap resistance, indicating that it has historical significance as a level where selling pressure increased.
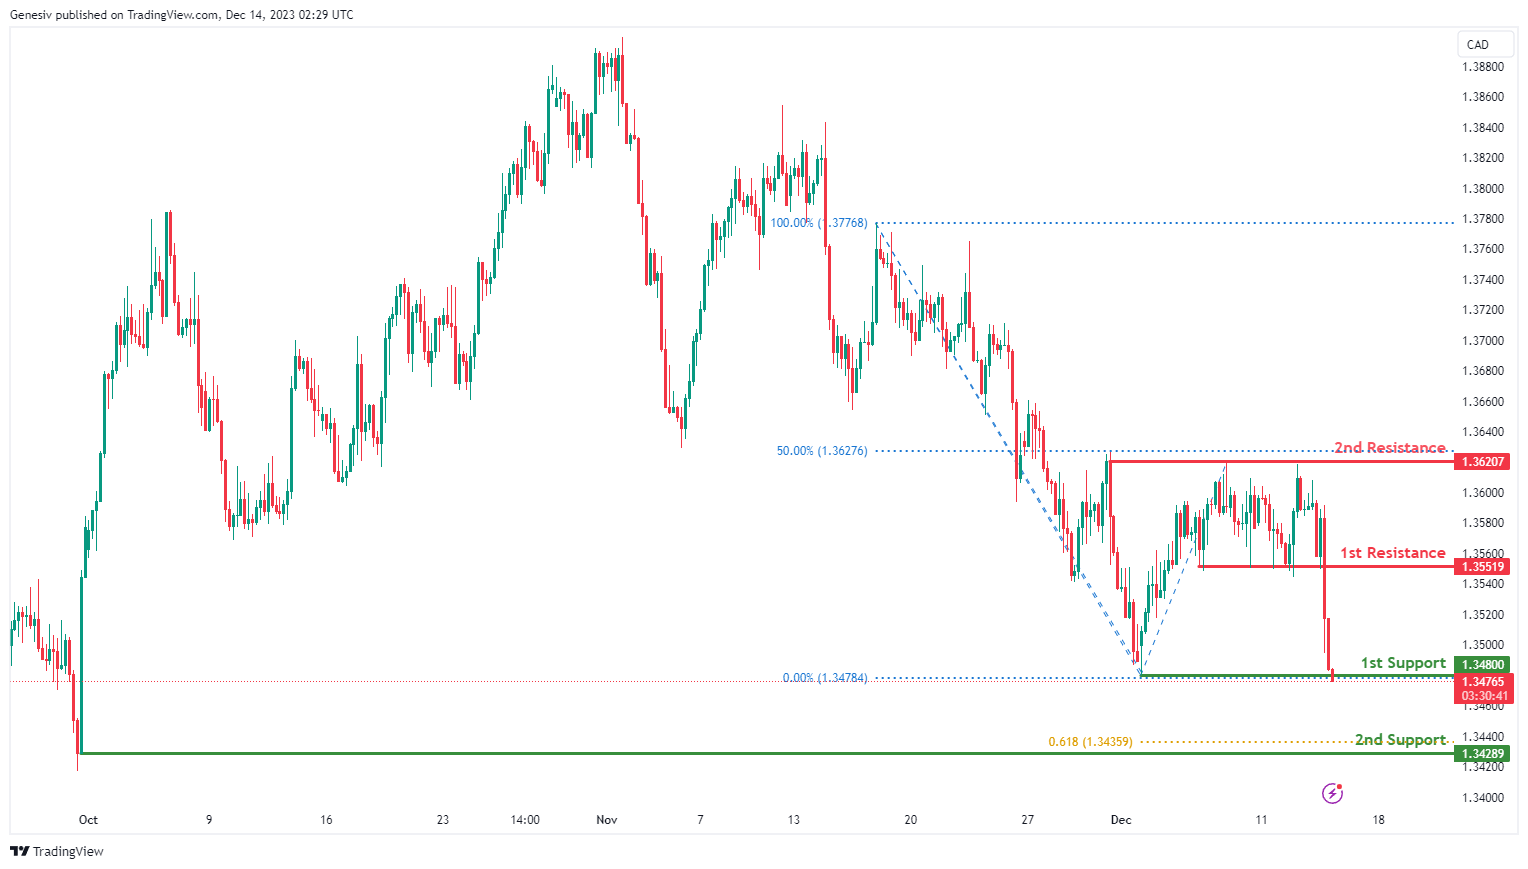
USD/CAD:
The USD/CAD chart currently exhibits an overall bearish momentum, indicating a new downward trend. In this context, there is a potential scenario for price to break under the 1st support and make a bearish continuation towards the 2nd support.
The 1st support level at 1.3480 is identified as a swing-low support. Further below, the 2nd support level at 1.3428 is also marked as a swing-low support that aligns with the 61.80% Fibonacci projection level, further reinforcing its importance as a key support level.
To the upside, the 1st resistance level at 1.3551 is identified as a pullback resistance while the 2nd resistance level at 1.3620 is also noted as a pullback resistance, suggesting a potential barrier for further upside movement.
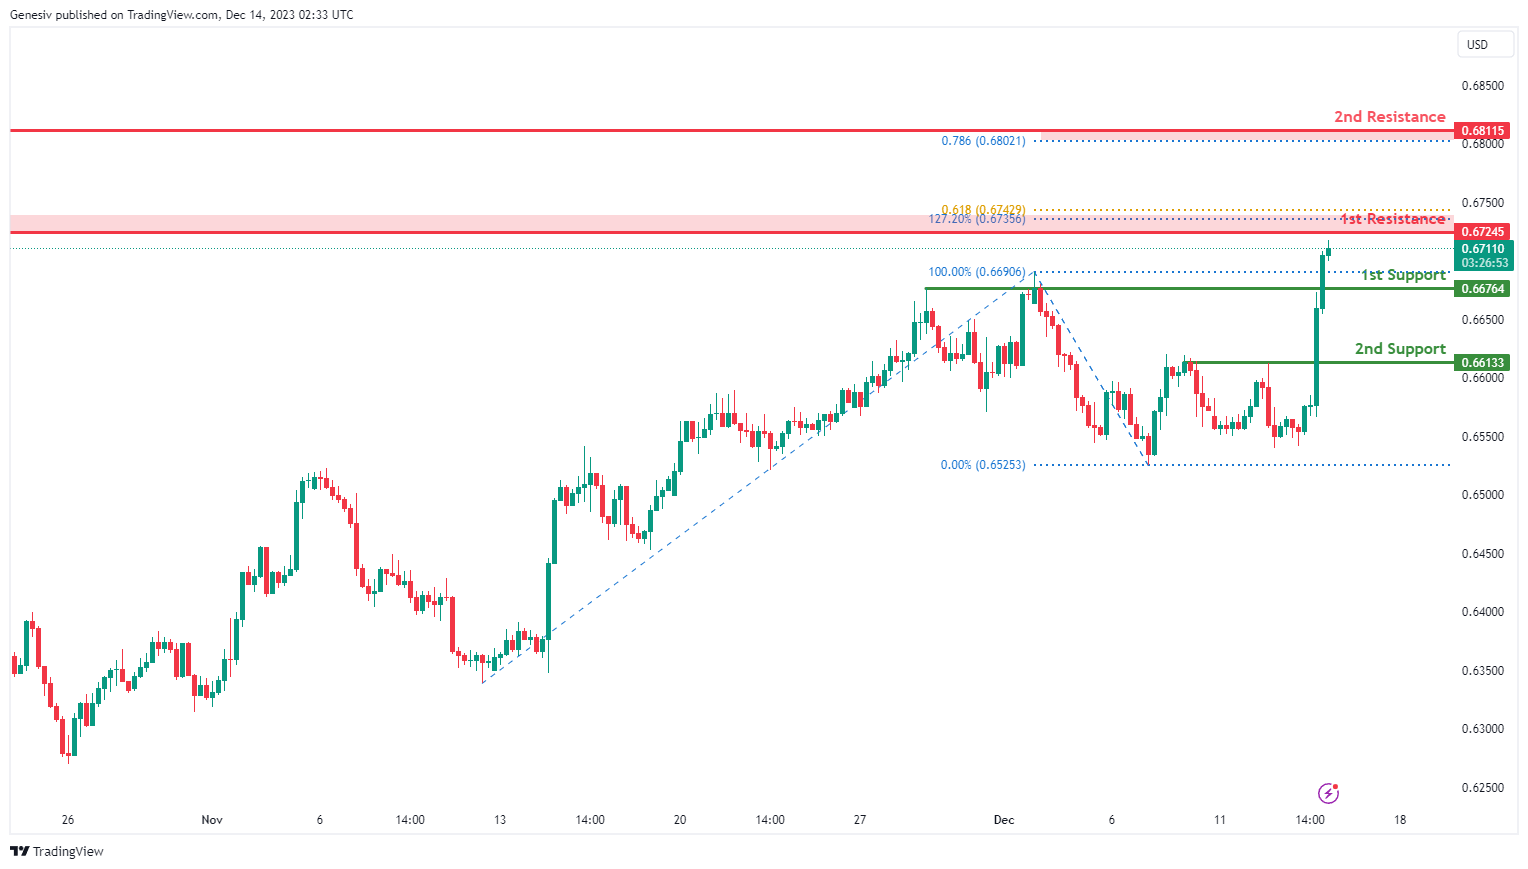
AUD/USD:
The AUD/USD chart currently exhibits an overall bullish momentum, indicating a new upward trend. In this context, there is a potential scenario for price to make a bullish continuation towards the 1st resistance.
The 1st resistance level at 0.6724 is identified as a swing-high resistance that aligns with a confluence of Fibonacci levels i.e. the 127.20% extension and the 61.80% projection levels. Higher up, the 2nd resistance level at 0.6811 is also marked as a swing-high resistance that aligns with the 78.60% Fibonacci projection level, indicating its potential significance as a barrier for further upward movement.
To the downside, the 1st support level at 0.6676 is identified as a pullback support while the 2nd support level at 0.6613 is also noted as a pullback support, further reinforcing its importance as a key support level.
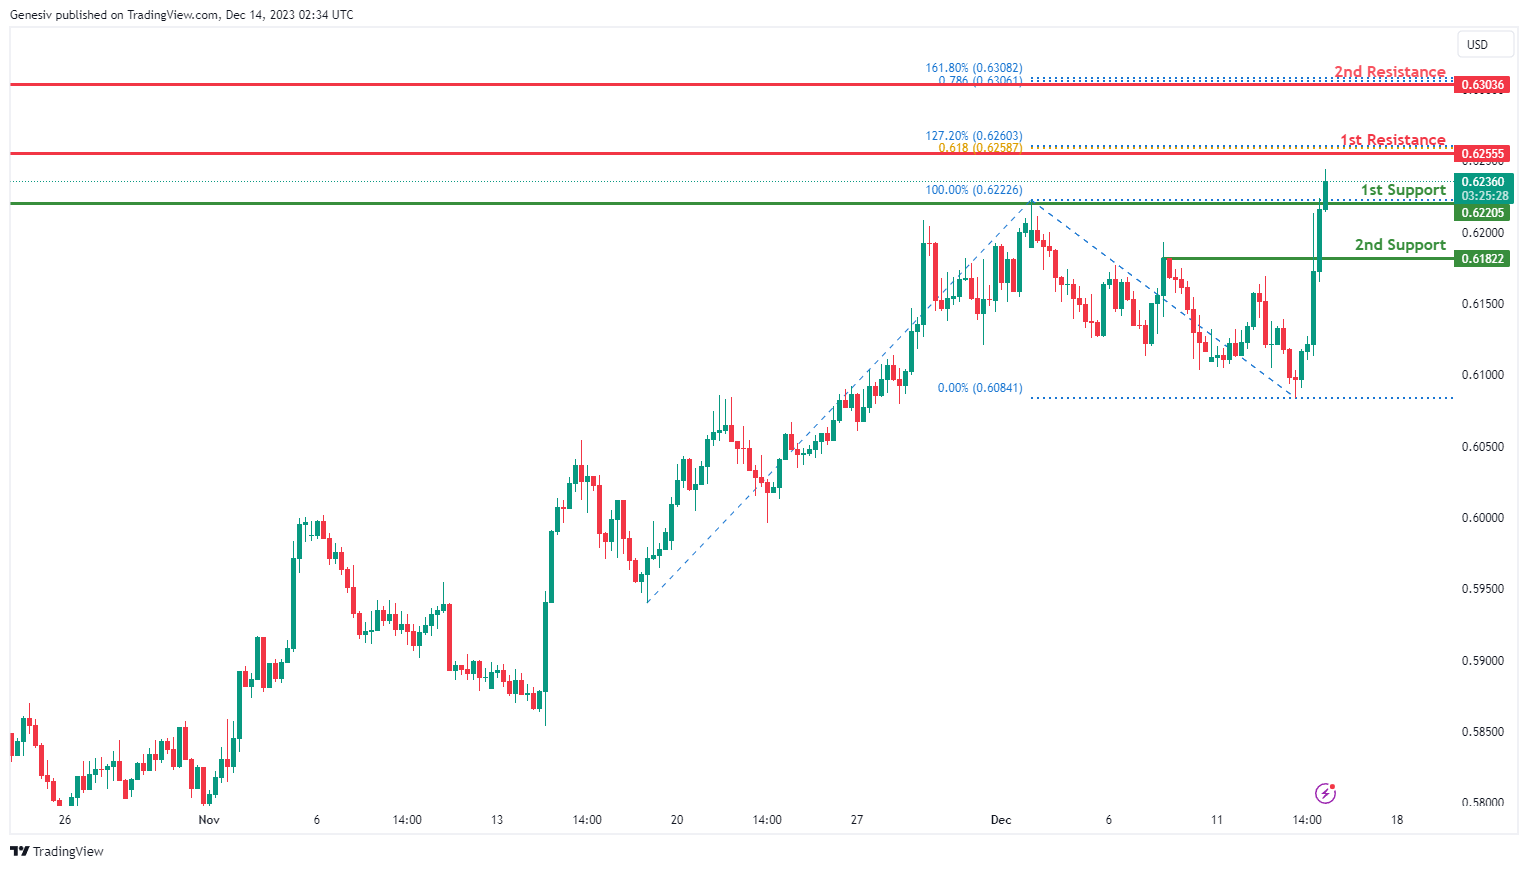
NZD/USD
The NZD/USD chart currently exhibits an overall bullish momentum, indicating a new upward trend. In this context, there is a potential scenario for price to make a bullish continuation towards the 1st resistance.
The 1st resistance level at 0.6255 is identified as a swing-high resistance that aligns with a confluence of Fibonacci levels i.e. the 127.20% extension and the 61.80% projection levels. Higher up, the 2nd resistance level at 0.6303 is also marked as a swing-high resistance that aligns with a confluence of Fibonacci levels i.e. the 161.80% extension and the 78.60% projection levels, indicating its potential significance as a barrier for further upward movement.
To the downside, the 1st support level at 0.6220 is identified as a pullback support while the 2nd support level at 0.6182 is also noted as a pullback support, further reinforcing its importance as a key support level.
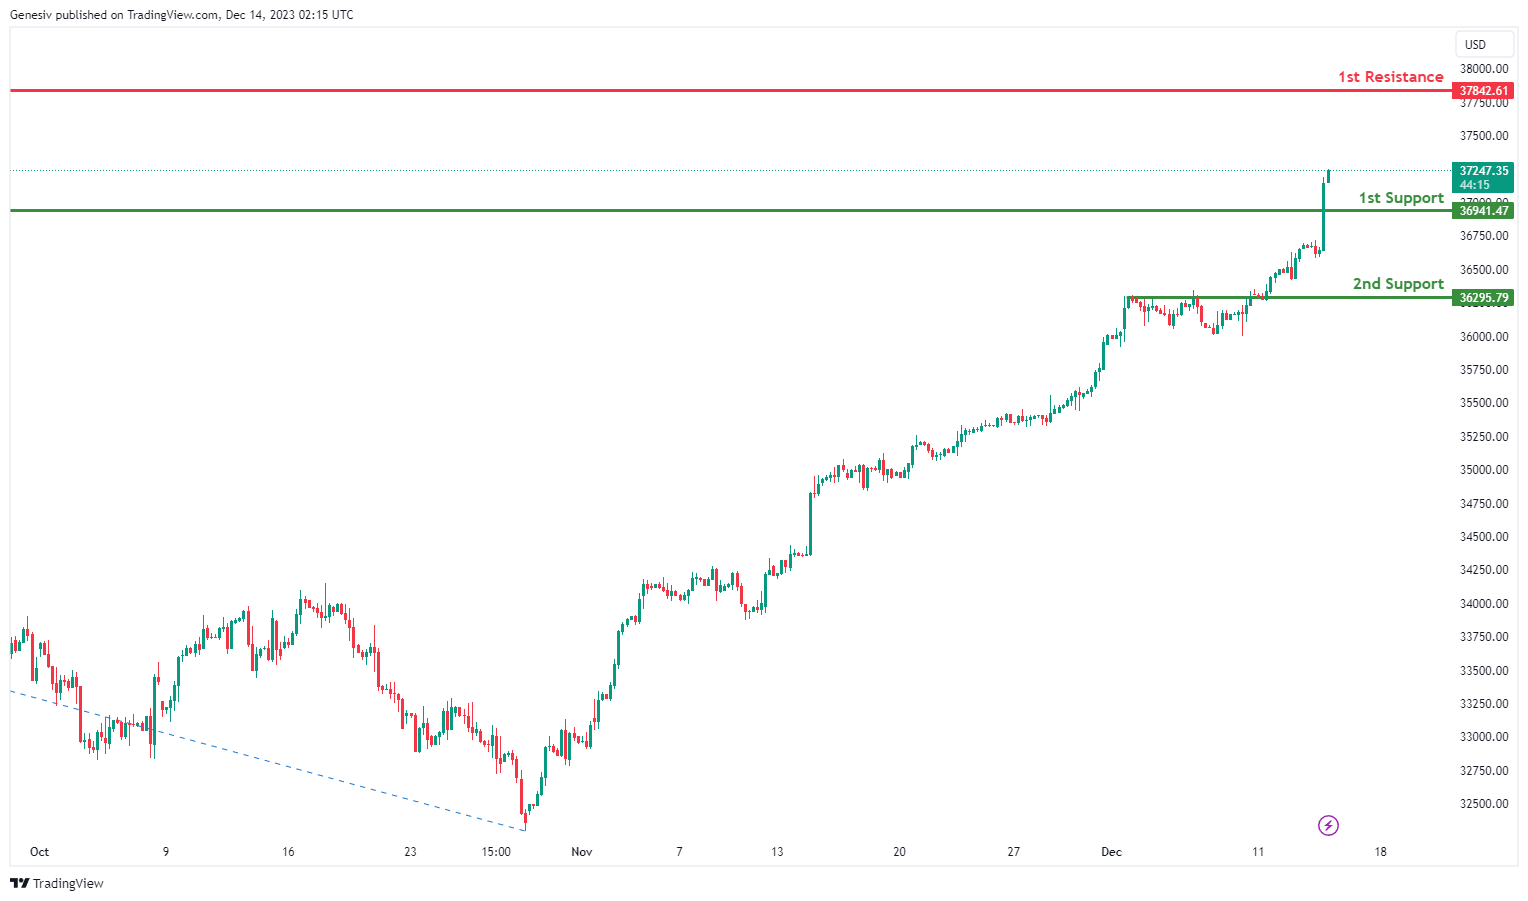
DJ30:
The DJ30 chart currently suggests a bullish overall momentum, indicating a potential for a bullish continuation towards the 1st resistance.
The 1st support at 36941.47 is considered significant as it represents a pullback support. This level indicates a potential area where buying interest may emerge after a pullback, providing support for the index and potentially leading to a continuation of the bullish trend.
Similarly, the 2nd support at 36295.79 is identified as an overlap support. This suggests a convergence of historical price points, reinforcing its potential as a crucial area where buying interest may emerge, providing additional support for the potential bullish continuation.
On the resistance side, the 1st resistance at 37842.61 is associated with a swing high resistance. This level is likely to act as a barrier where selling interest could intensify, potentially causing a temporary pause or reversal in the bullish trend.
GER40:
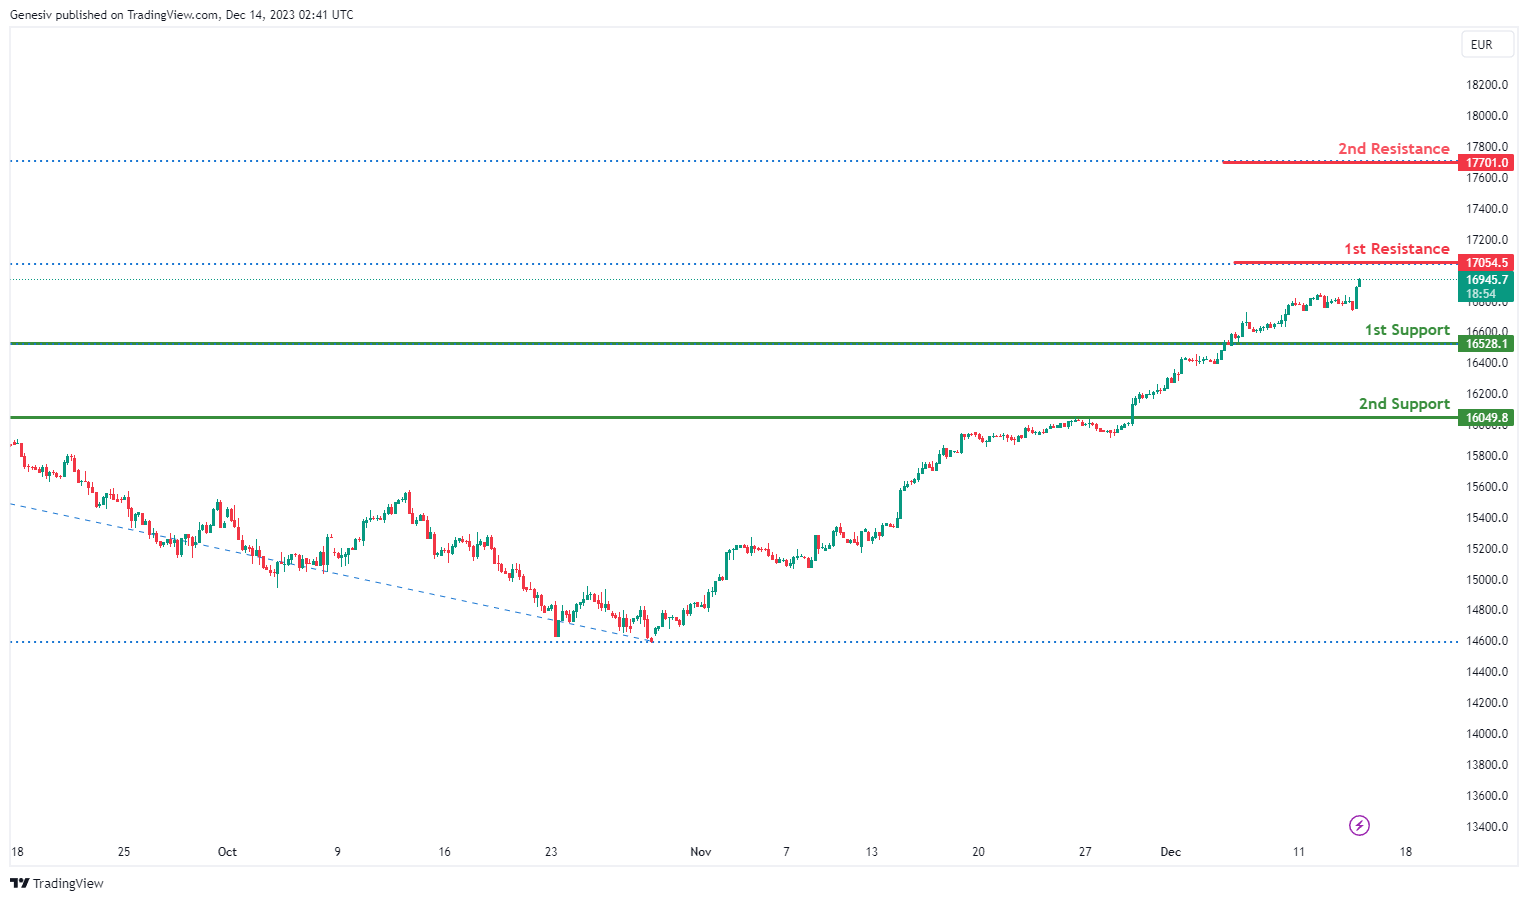
The GER40 chart currently exhibits a bullish overall momentum, and there is potential for a bullish continuation towards the 1st resistance.
The 1st support at 16528.10 is considered significant as it represents a pullback support. This level indicates a potential area where buying interest may emerge after a pullback, providing support for the index and contributing to the potential for a bullish continuation.
Similarly, the 2nd support at 16049.80 is also identified as a pullback support. This adds an additional layer of support, indicating another potential zone where buying interest may be present, further reinforcing the potential for a bullish continuation.
On the resistance side, the 1st resistance at 17054.00 is associated with the 127.20% Fibonacci Extension. This level adds significance to the resistance, suggesting a potential area where selling interest may intensify, potentially causing a temporary pause or reversal in the bullish trend.
Furthermore, the 2nd resistance at 17701.00 is linked to the 161.80% Fibonacci Extension. This adds another layer of significance to the resistance, indicating another potential area where selling pressure may increase, especially considering the alignment with the Fibonacci-based extension levels.
US500:
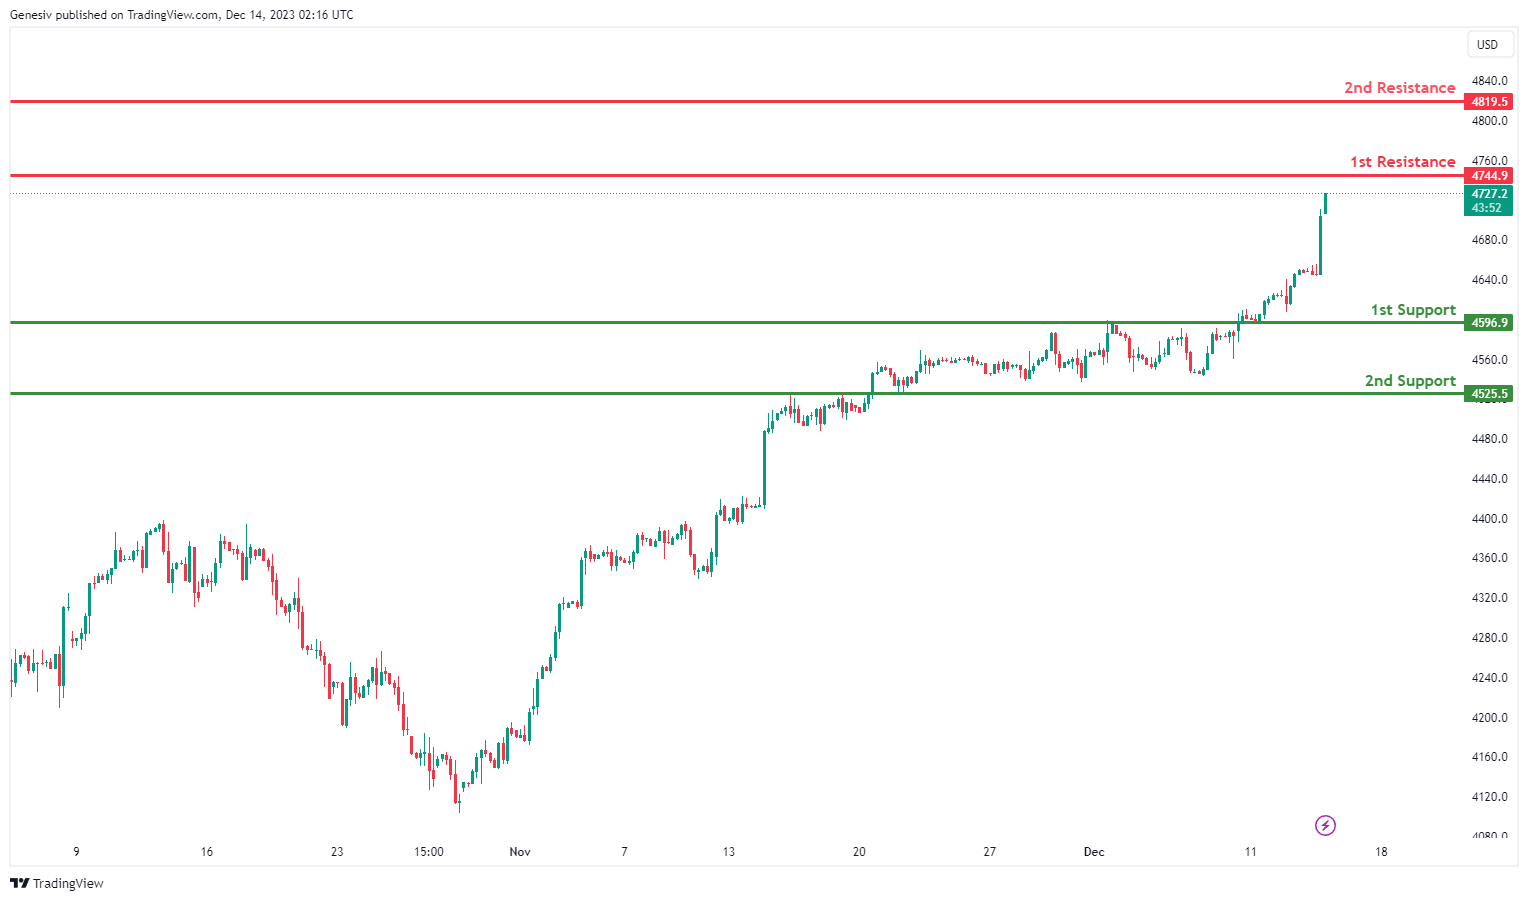
The US500 chart currently indicates a bullish overall momentum, suggesting a potential for a bullish continuation towards the 1st resistance.
The 1st support at 4596.9 is considered significant as it represents an overlap support. This level suggests a convergence of historical price points, reinforcing its potential as a crucial area where buying interest may emerge. This overlap support provides a strong foundation for a potential bounce or continuation of the bullish trend.
Similarly, the 2nd support at 5425.5 is identified as an overlap support. This adds an additional layer of significance to the support level, indicating a zone where historical price action aligns, and buyers may find significant interest.
On the resistance side, the 1st resistance at 4744.9 is associated with a pullback resistance. This level may act as a barrier where selling interest could intensify, potentially causing a temporary pause or reversal in the bullish trend.
Furthermore, the 2nd resistance at 4819.5 is characterized as a swing high resistance. This level adds further significance to the resistance, suggesting a potential area where selling pressure may increase, especially considering its alignment with a previous swing high.
BTC/USD:
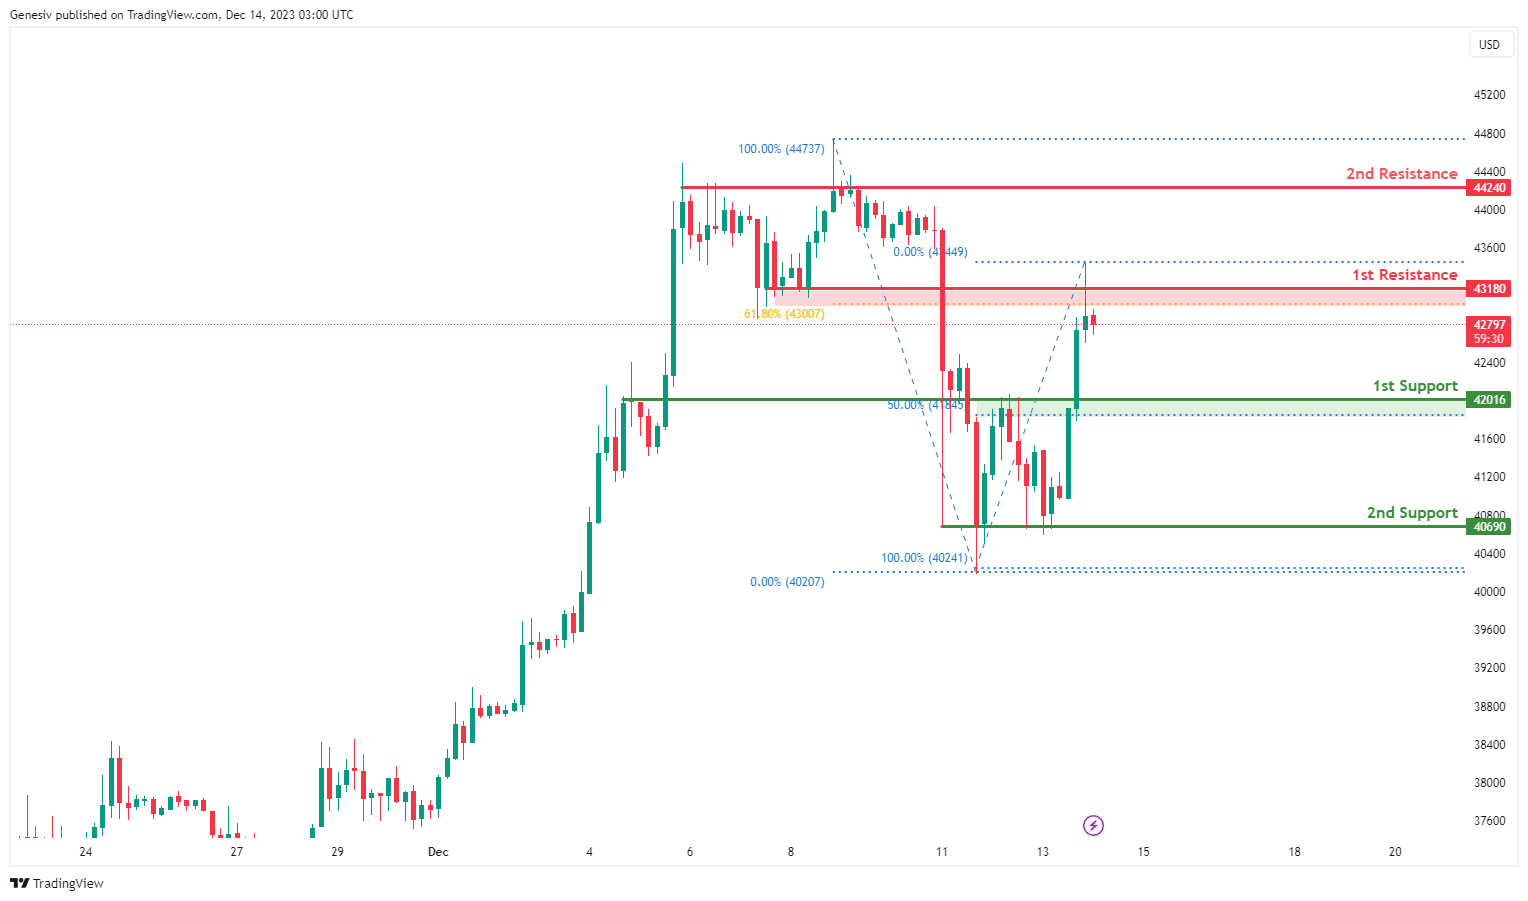
The BTC/USD chart currently indicates a neutral overall momentum, suggesting a potential scenario where the price may fluctuate between the 1st resistance and the 1st support level.
The 1st support at 42016 is considered significant for several reasons. Firstly, it is identified as an overlap support, suggesting a convergence of historical price points and reinforcing its potential as a crucial area where buying interest may emerge. Additionally, this support level aligns with the 50% Fibonacci Retracement, further enhancing its importance as a potential reversal or bounce point.
Similarly, the 2nd support at 40690 is characterized as a multi-swing low support. This adds to the support structure, indicating another potential zone where buying interest may be present, further supporting the potential for price fluctuation.
On the resistance side, the 1st resistance at 43180 is associated with both a pullback resistance and the 61.80% Fibonacci Retracement. This confluence adds weight to the resistance, suggesting a potential area where selling interest may intensify, causing a temporary pause or reversal in the neutral trend.
Furthermore, the 2nd resistance at 44240 is identified as a pullback resistance. This level may act as a barrier where selling interest could intensify, contributing to the potential price fluctuation within the established range.
ETH/USD:
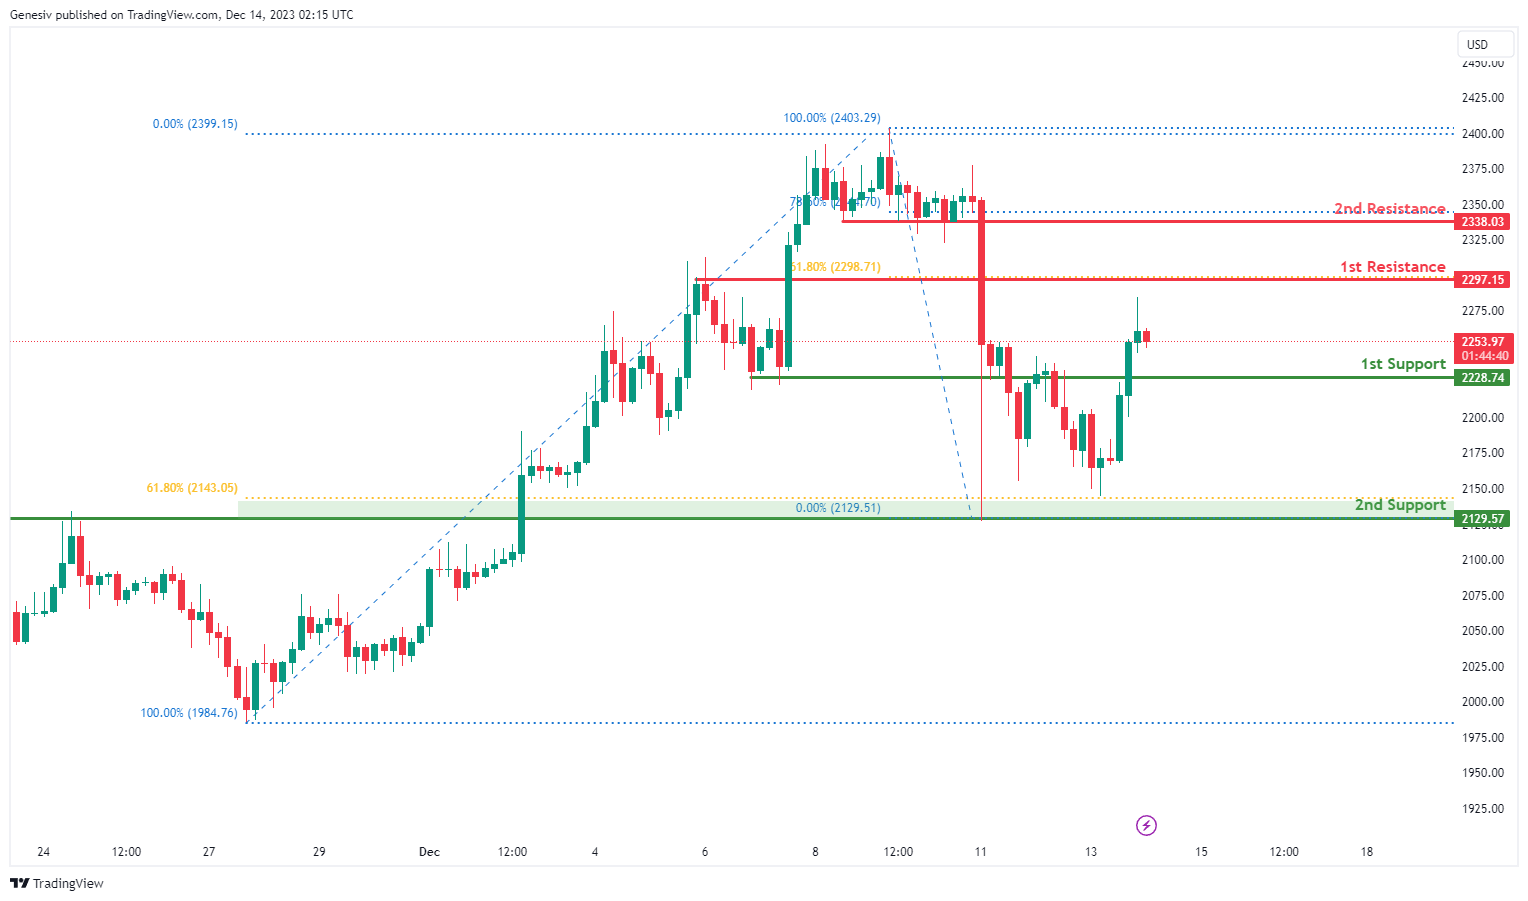
The ETH/USD chart currently indicates a bullish overall momentum, suggesting a potential for a bullish continuation towards the 1st resistance.
The 1st support at 2228.74 is considered significant as it represents an overlap support. This level indicates a convergence of historical price points, reinforcing its potential as a crucial area where buying interest may emerge. The overlap support provides a strong foundation for a potential bounce or continuation of the bullish trend.
Similarly, the 2nd support at 2129.57 is characterized as an overlap support and is associated with the 61.80% Fibonacci Retracement. This confluence strengthens the support level, indicating a zone where historical price action aligns and buyers may find significant interest, further supporting the potential for a bullish continuation.
On the resistance side, the 1st resistance at 2297.15 is identified as both a swing high resistance and the 61.80% Fibonacci Retracement. This confluence adds significance to the resistance, suggesting a potential area where selling interest may intensify, causing a temporary pause or reversal in the bullish trend.
Furthermore, the 2nd resistance at 2338.03 is associated with both swing high resistance and the 78.60% Fibonacci Retracement. This further strengthens the resistance, indicating another potential area where selling pressure may increase, especially considering the alignment with both technical and Fibonacci-based resistance.
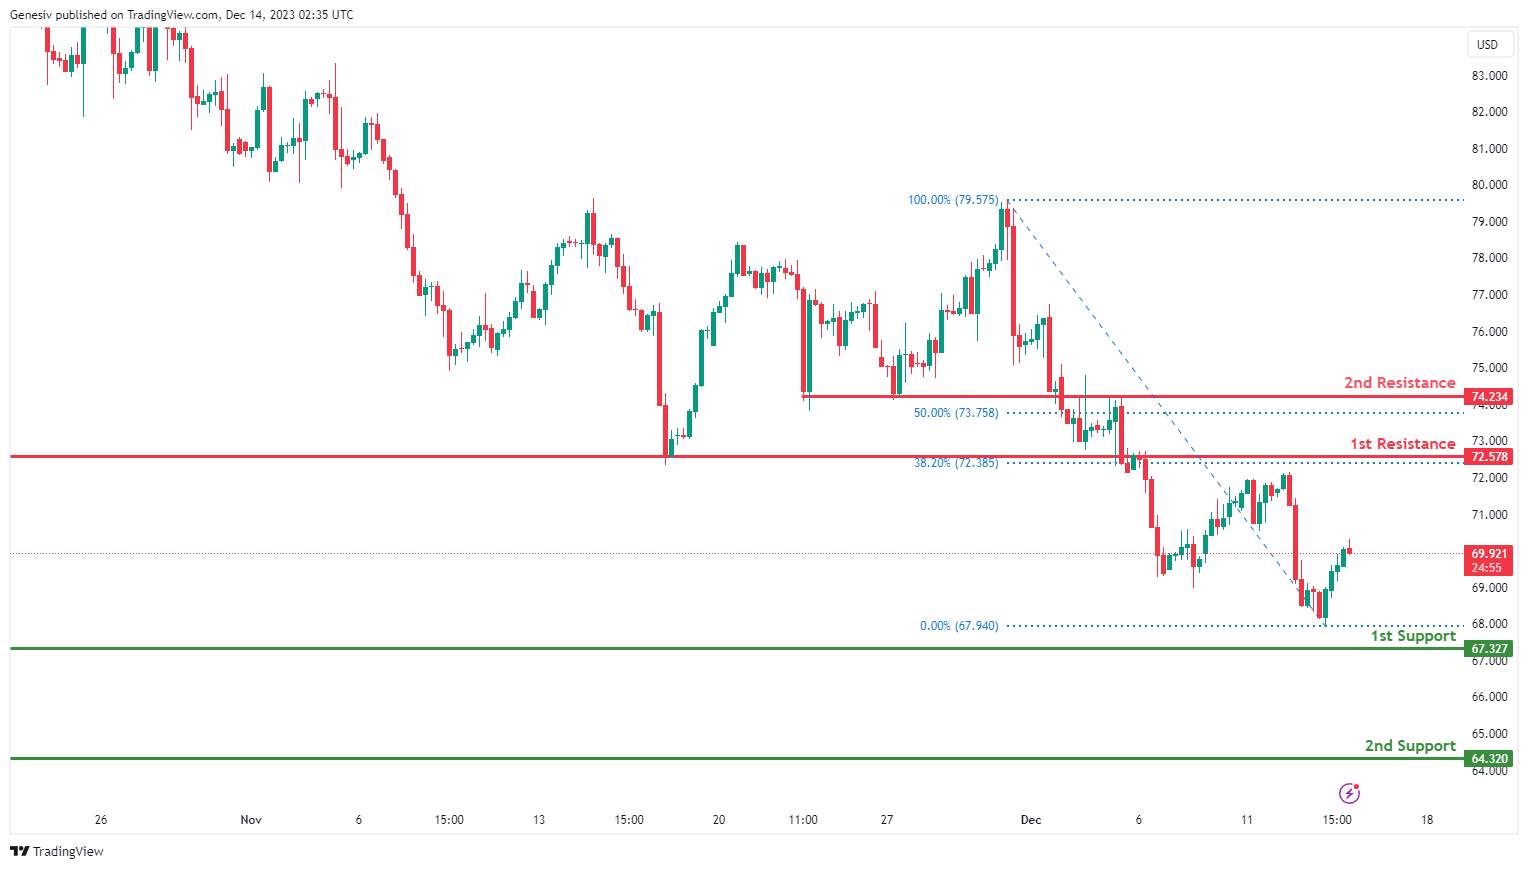
WTI/USD:
The WTI chart currently exhibits an overall bearish momentum, suggesting a prevailing downward trend. However, there is a potential for price to make a bullish movement towards the 1st resistance before resuming the downtrend and fall towards the 1st support.
The 1st resistance level at 72.57 is identified as an overlap resistance that aligns with the 38.20% Fibonacci retracement level. Higher up, the 2nd resistance level at 74.23 is also marked as an overlap resistance that aligns close to the 50.00% Fibonacci retracement level, further indicating its potential significance as a barrier for further upward movement.
To the downside, the 1st support level at 67.32 is identified as a pullback support. Further below, the 2nd support level at 64.32 is noted as multi-swing-low support, reinforcing its importance as a key support level.
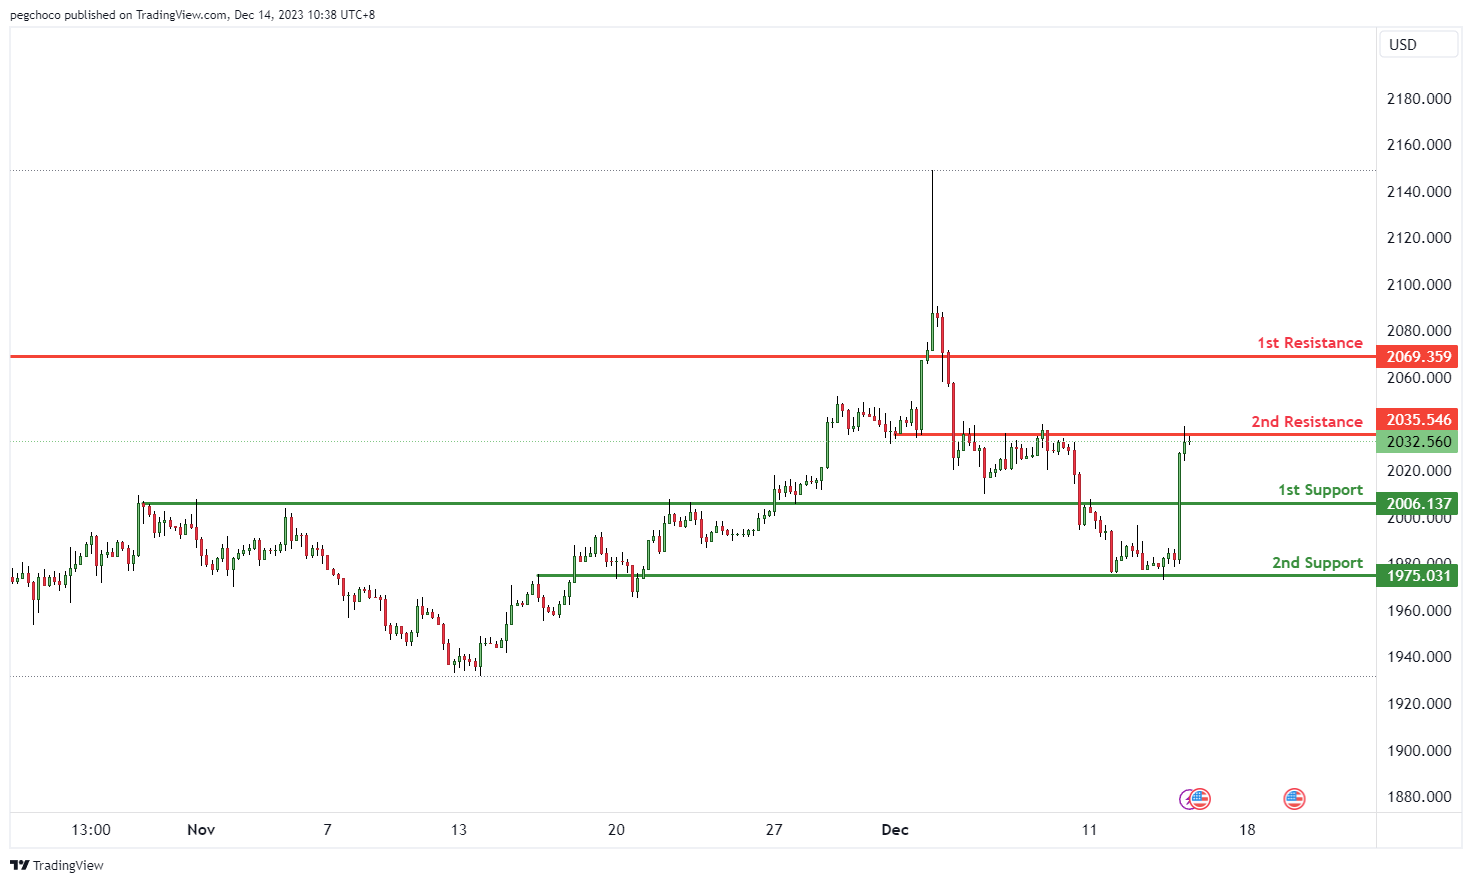
XAU/USD (GOLD):
The XAU/USD chart currently demonstrates a bearish overall momentum, indicating a downward trend in the price of gold against the US Dollar. Price could potentially continue this bearish movement towards the 1st support level.
The 1st support at 2006.13 is identified as a significant level, categorized as pullback support. This suggests that it has the potential to act as a level where buying interest may emerge temporarily, providing support for the price of gold.
The 2nd support at 1975.03 is also noteworthy as it is an overlap support. Overlap supports typically indicate areas where historical price action has found support, making this level another potential area for buying interest.
On the resistance side, the 1st resistance at 2035.54 is categorized as an overlap resistance, indicating historical significance as a level where selling pressure may intensify. This level should be closely monitored for potential price reactions.
The 2nd resistance at 2069.35 is identified as a pullback resistance, suggesting it may act as a barrier where selling interest could increase.
Will SNB, BoE, and ECB hint at upcoming rate cuts?
Three major central banks – SNB, BoE and ECB – are set to announce their policy decisions. All three will keep their interest rates unchanged. This comes in the wake of Fed's outlined plans for rate cuts in 2024 in the dot plot released overnight. Now, that raises questions about whether these central banks will follow and signal policy loosening for the next year.
SNB is expected to hold its key policy rate steady at 1.75%. This decision is supported by forecasts from Swiss State Secretariat for Economic Affairs released yesterday, projecting a slowdown in inflation to 1.9% in 2024 and further to 1.1% in 2025. Economic growth in Switzerland is also expected to decelerate to 1.1% in 2024 before rebounding to 1.7% in 2025.
BoE is anticipated to maintain interest rates at 5.25%. Traders have increased their bets on the BoE cutting rates following the unexpectedly sharp contraction in UK's monthly GDP for October. The market has fully priced in 100bps easing in monetary policy for 2024, bringing borrowing costs down to 4.25%. The first rate cut is anticipated in June. Today's voting pattern and accompanying statement from BoE will be under close scrutiny.
Similarly, the ECB is expected to keep its main refinancing rate at 4.50% and deposit rate at 4.00%. The focus will likely be on new DP and inflation forecasts and their implications for the rate path in the coming year. Money markets are currently pricing in almost 150bps of rate cuts for the next year.
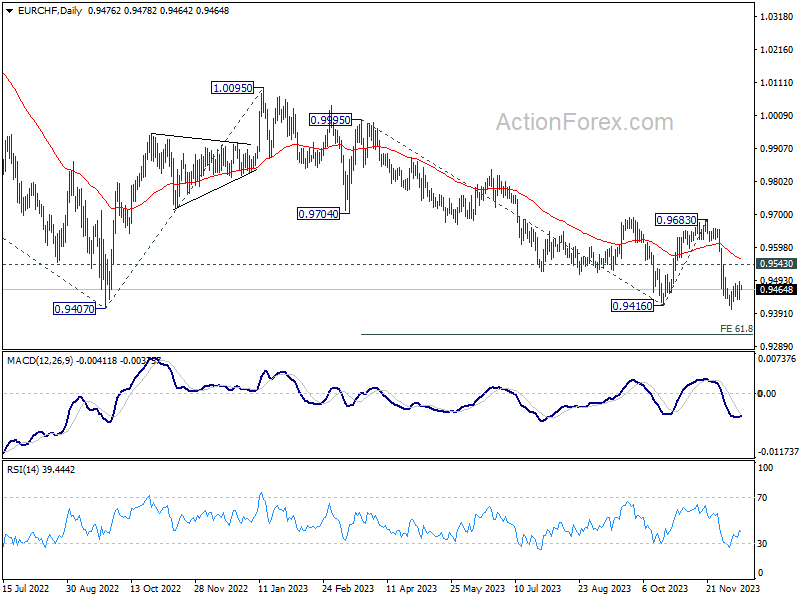
In terms of currency performance, Swiss Franc appears to be the firmer one for the near term. As long as 0.9543 resistance holds, outlook in EUR/CHF remains bearish. Decisive break of 0.9402 support will resume larger down trend to 61.8% projection of 0.9995 to 0.9416 from 0.9683 at 0.9325.
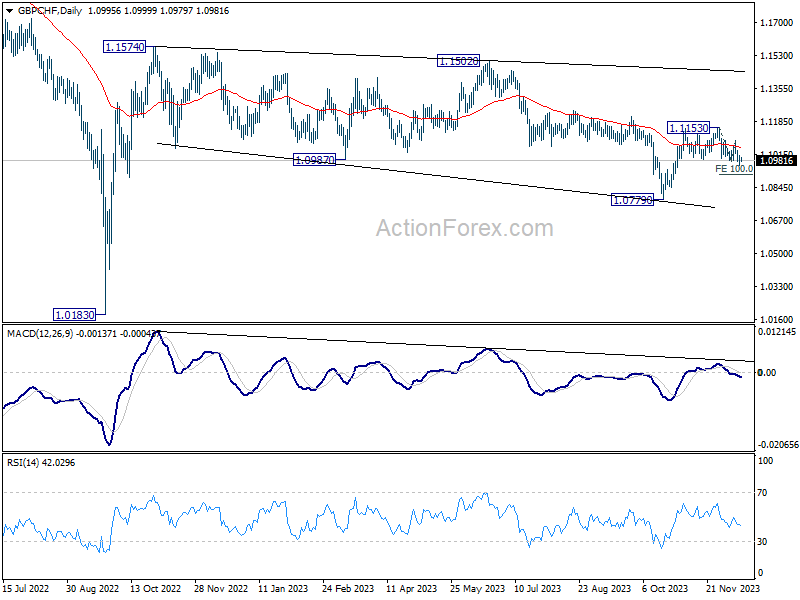
GBP/CHF's fall from 1.1153 resumed this week, and should be on track to 100% projection of 1.1153 to 1.0978 from 1.1085 at 1.0910. Sustained break there could prompt downside acceleration to 1.0779 and below, to resume larger down trend from 1.1574.
While Euro appears to be light strong then Sterling in the past few days, risk in EUR/GBP remains on the downside as long as 0.8648 resistance holds. Break of 0.8548 will likely bring deeper decline through 0.8491 to resume the medium term down trend.
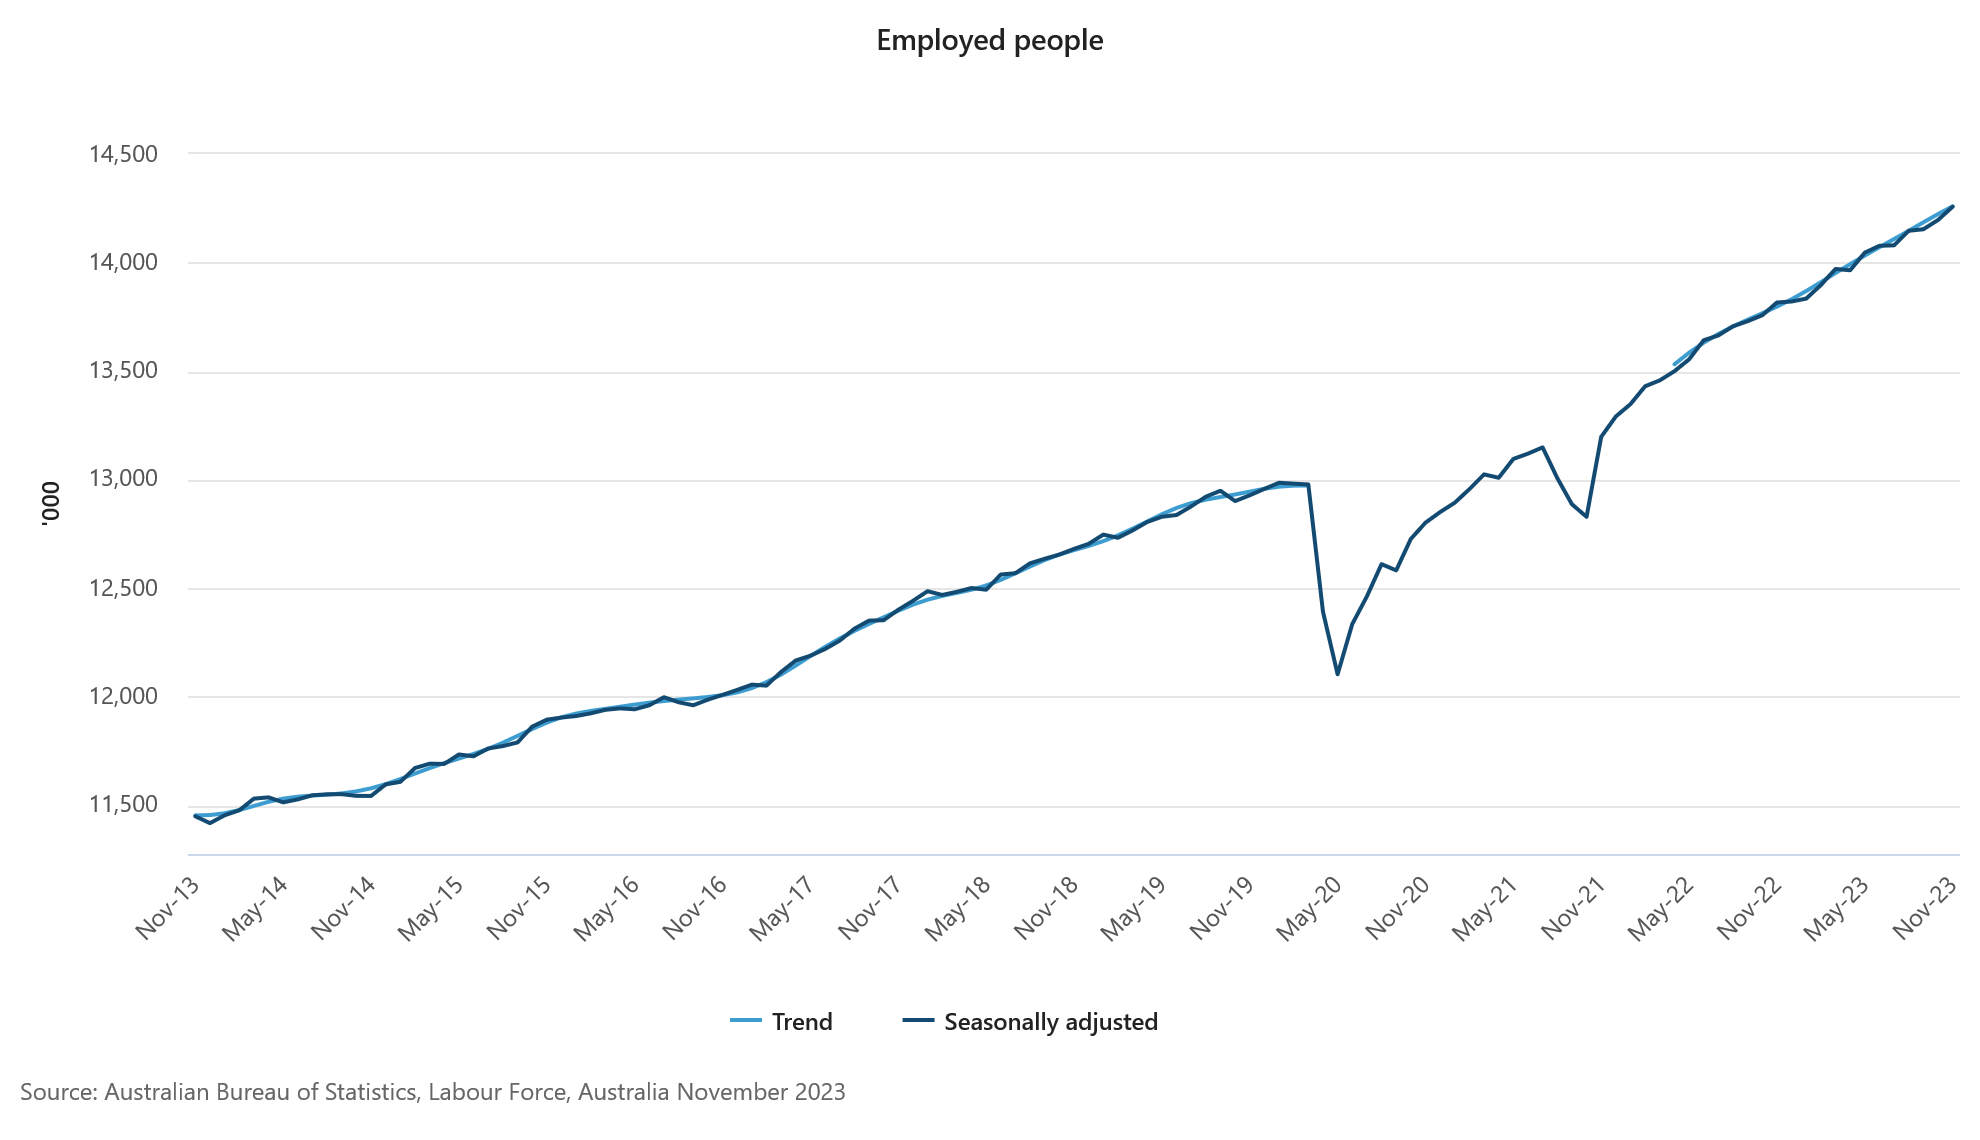
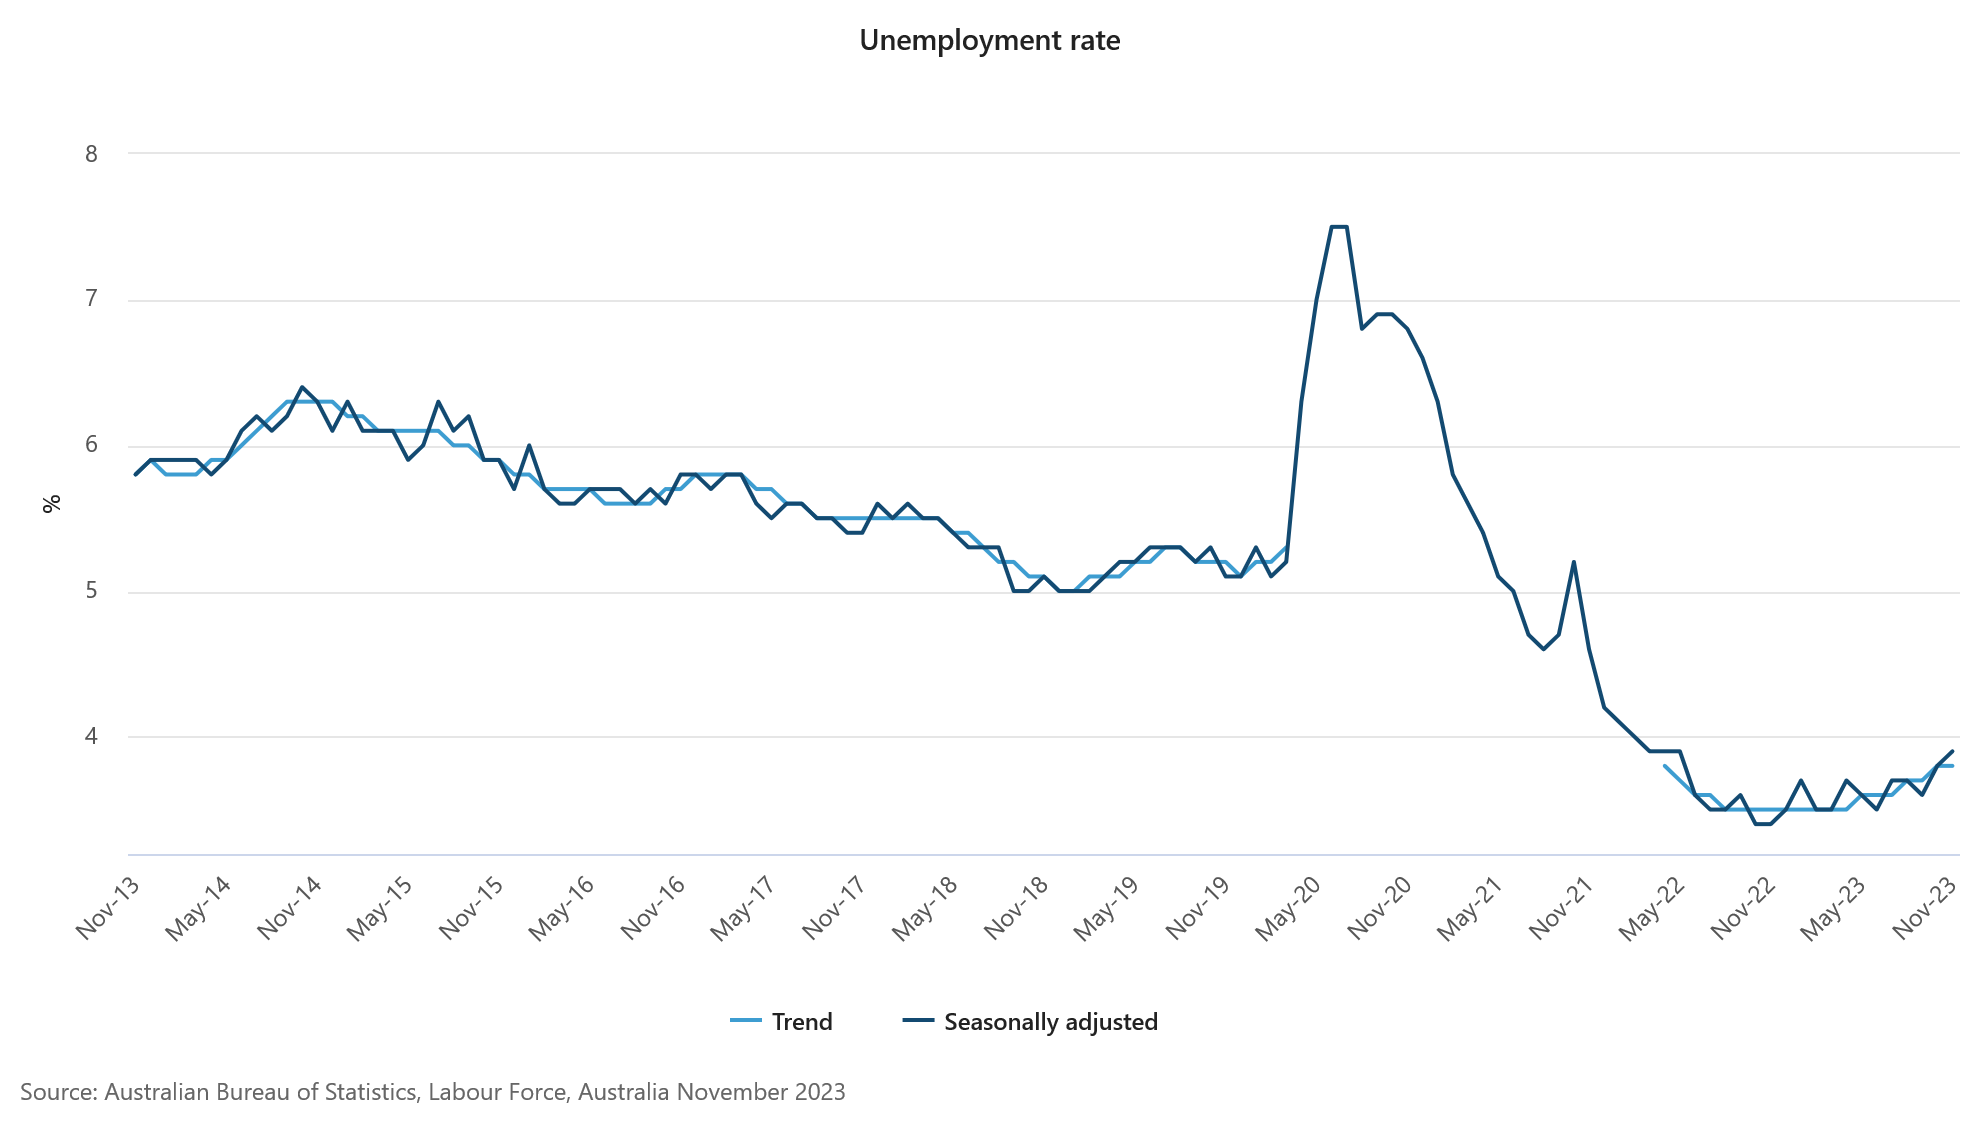
Australia’s employment rises 61.5k in Nov, unemployment rate ticks up
Australia's employment sector grew significant by 61.5k in November substantially surpassing the expected 10.0k. This growth was primarily in full-time employment, which saw an increase of 47k, while part-time employment also rose by 14.5k.
Despite these positive developments in job creation, the unemployment rate edged up slightly to 3.9%, against expectations of remaining at 3.8%. Participation rate increased by 0.2% to reach 67.2%, and monthly hours worked were flat at 0.0%.
Bjorn Jarvis, ABS head of labour statistics, stated, "The combination of strong growth in both employment and unemployment in November saw the employment-to-population ratio return to a record high of 64.6 percent and the participation rate reach a new high of 67.2 percent."
Jarvis also noted that the slowing in hours worked suggests that the overall growth rates in employment and hours worked have become more aligned over the past 18 months. This convergence indicates a "less tight" labor market than previously experienced.
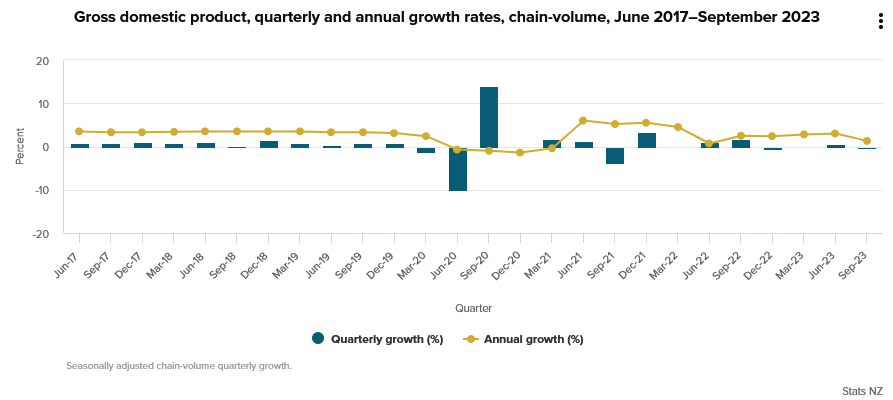
New Zealand’s Q3 GDP falls unexpectedly by -0.3%, manufacturing sector leads decline
New Zealand's GDP unexpectedly contracted by -0.3% qoq in Q3, a significant deviation from the anticipated 0.2% qoq growth. Notably, GDP per capita saw a more pronounced decrease of -0.9%. This downturn in economic activity was primarily led by -2.6% decline in the goods-producing industries. However, there were some positive aspects, with service industries experiencing growth of 0.4%, and primary industries seeing rise of 0.6%.
Ruvani Ratnayake, national accounts industry and production senior manager, pointed out, "All goods producing industries were down this quarter, led by a fall in manufacturing."
Despite the general decline in GDP, there was a silver lining as 8 out of 11 service industries recorded growth during the quarter. The most substantial improvements were observed in healthcare and social assistance, along with rental, hiring, and real estate services.
On the consumer front, household spending decreased by -0.6% during the quarter. This reduction was across all categories, with notable decline in durable goods. The fall in spending on motor vehicles, which came after a period of higher spending, was a significant factor in this overall decrease.
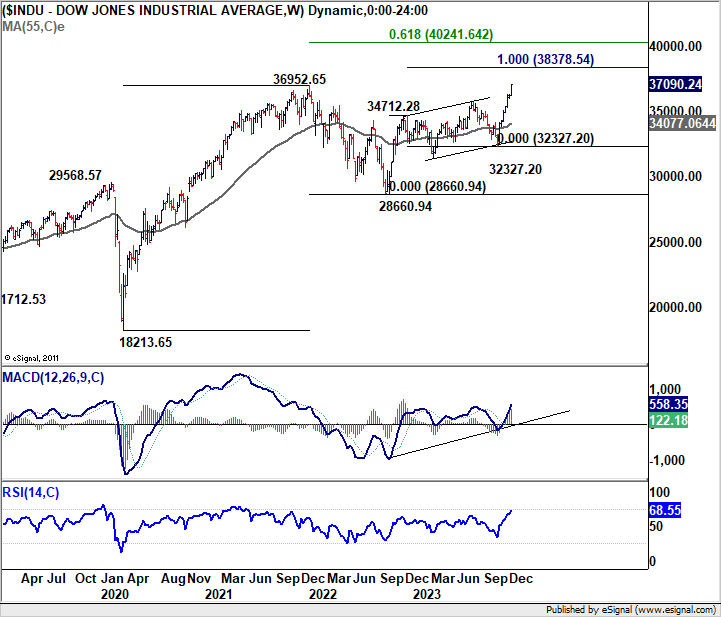
DOW hits new record post-FOMC, 10-year yield presses 4%
DOW surged 1.40% to close at new record high at 37090.24 overnight, after Fed outlined the path for interest rate cuts next year. While some volatility may be expected following this sharp increase, near term outlook will stay bullish as long as 36010.85 support holds. Next near term target is 100% projection of 28660.94 to 34712.28 from 32327.20 at 38378.54.
For the medium term, DOW would be looking at 61.8% projection of 18213.65 (2020 low) to 36952.65 (2022 high) from 28660.94 (2022 low) at 40241.64, which is close to 40k psychological level.
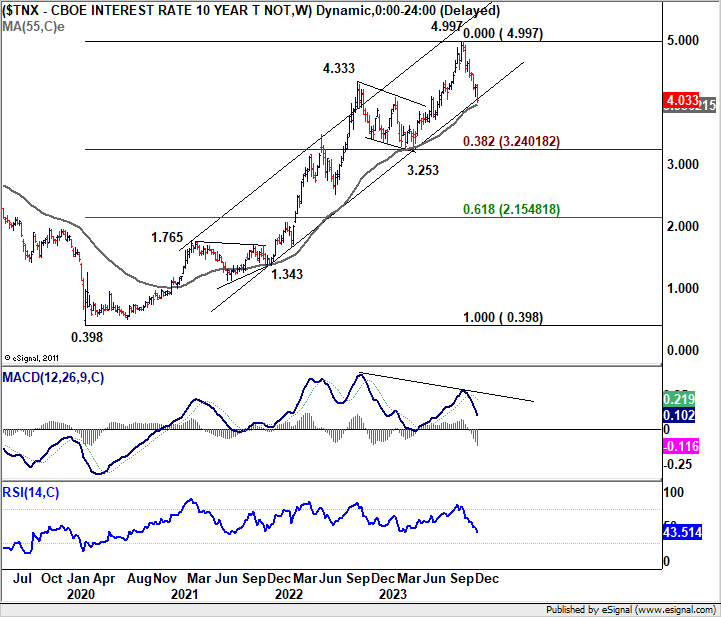
In contrast, 10-year yield lost -0.173 to 4.033, after hitting as low as 4.009, just managed to defend 4% handle. Some support could be seen from current level which is close to 55 W EMA (now at 3.956) and the long term trend line support to bring interim rebound.
However, TNX should have completed the five wave rally from 0.398 (2020 low), and a correction to this up trend is underway. Sustainable support might only be found at 3.253 cluster support level, which is close to 38.2% retracement of 0.398 to 4.997 at 3.240.
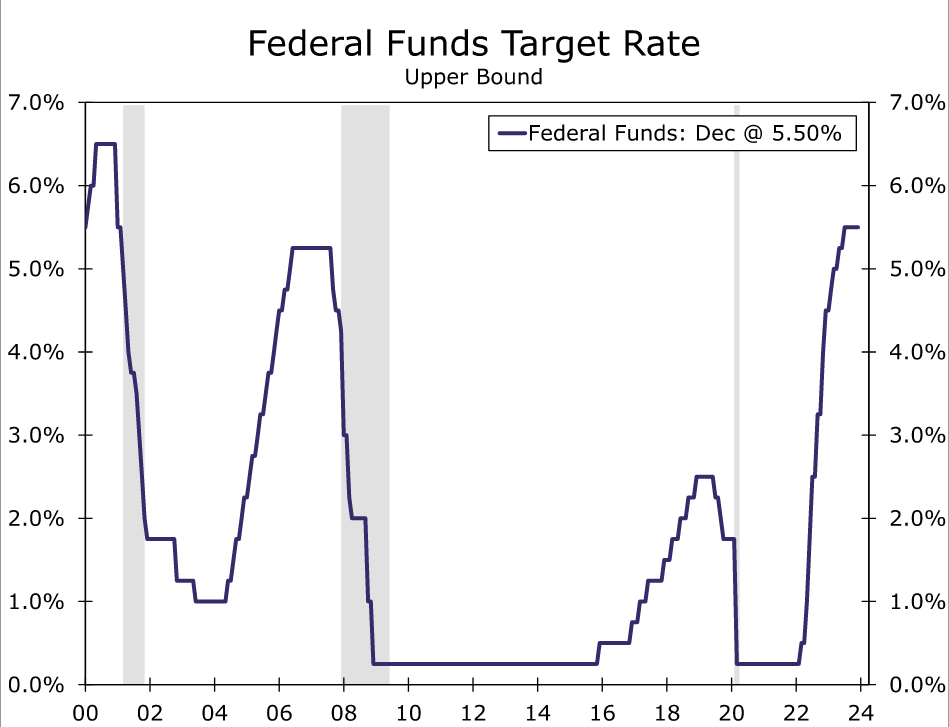
Fed signals three rate cuts in 2024, policy easing on discussion table
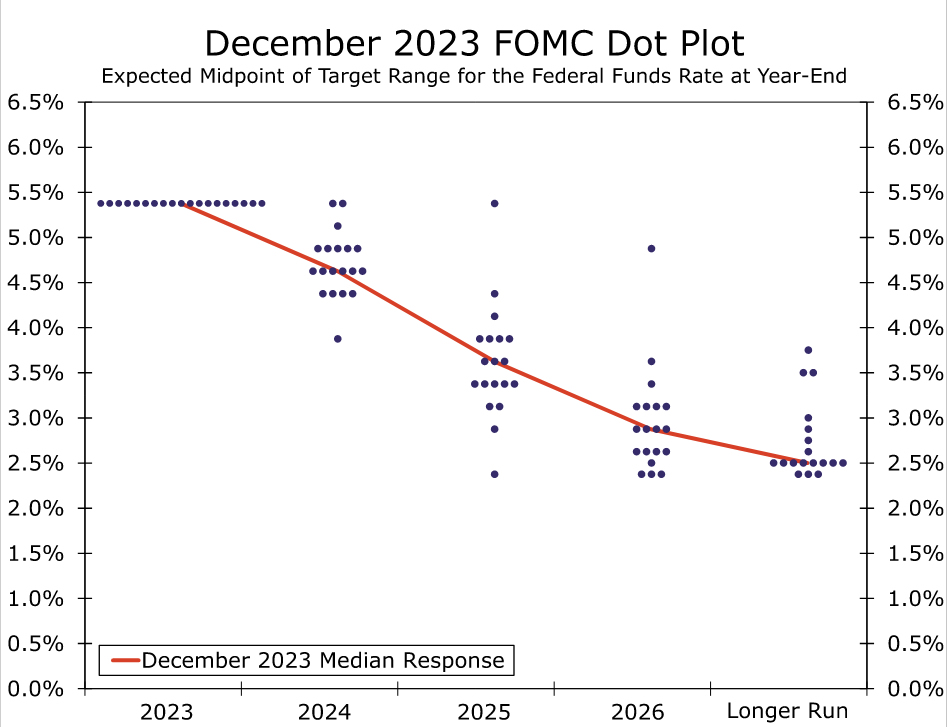
US stocks surged, with DOW hitting new record, while treasury yields and the Dollar tumbled following Fed's decision to leave interest rates unchanged at 5.25-5.50%. This decision, widely anticipated by the markets, was overshadowed by the Fed's indication of potential rate cuts in 2024. Fed suggested that three 25 bps cuts could be implemented next year, to bring federal funds rate back to 4.50-4.75%.
Fed Chair Jerome Powell, in the post-meeting press conference, acknowledged the emerging discussion within about reducing policy restraint. Powell stated, "The question of when it will be appropriate to begin dialing back the amount of policy restraint in place begins to come into view, and is clearly a topic of discussion out in the world and also of discussion for us at our meeting today." He further noted the general expectation that this issue will be a key focus for Fed going forward.
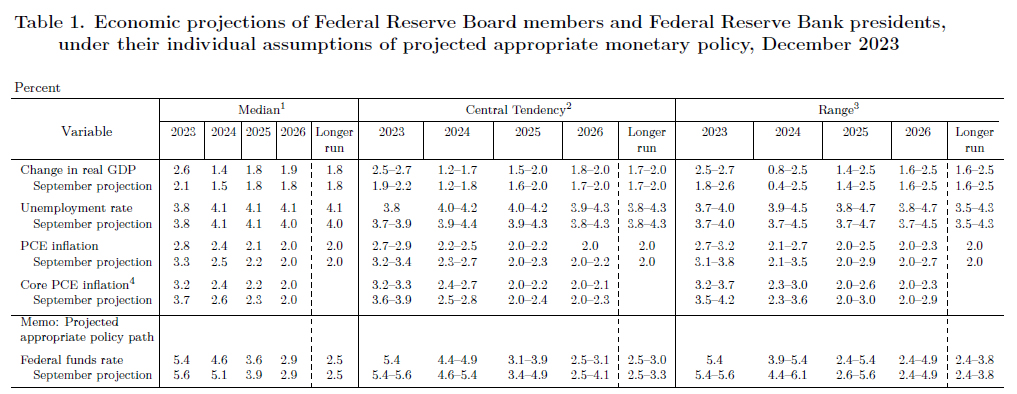
The new economic projections present a detailed outlook. The median forecasts indicate that federal funds rate will decrease from the current 5.4% to 4.6% in 2024, further reducing to 3.6% in 2025, and eventually to 2.9% in 2026. The longer-run federal funds rate is held steady at 2.50%. The central tendency for 2024 is at 4.4-4.9%, suggesting a relatively narrow range, and stable rate expectation.
The projections for GDP growth show a slowdown from 2.6% in 2023 to 1.4% in 2024, followed by a rebound to 1.8% in 2025 and 1.9% in 2026. The unemployment rate is expected to increase from 3.8% in 2023 to 4.1% in 2024 and then stabilize at this level through 2026.
Regarding inflation, headline PCE inflation is forecasted to decrease from 2023's 2.8% to 2.4% in 2024, 2.1% in 2025, and 2.0% in 2026. Similarly, core PCE inflation is projected to slow down from 3.2% in 2023 to 2.4% in 2024, and then to 2.2% in 2025 and 2.0% in 2026.
Some FOMC reviews here.
(FED) Federal Reserve Issues FOMC Statement
Recent indicators suggest that growth of economic activity has slowed from its strong pace in the third quarter. Job gains have moderated since earlier in the year but remain strong, and the unemployment rate has remained low. Inflation has eased over the past year but remains elevated.
The U.S. banking system is sound and resilient. Tighter financial and credit conditions for households and businesses are likely to weigh on economic activity, hiring, and inflation. The extent of these effects remains uncertain. The Committee remains highly attentive to inflation risks.
The Committee seeks to achieve maximum employment and inflation at the rate of 2 percent over the longer run. In support of these goals, the Committee decided to maintain the target range for the federal funds rate at 5-1/4 to 5-1/2 percent. The Committee will continue to assess additional information and its implications for monetary policy. In determining the extent of any additional policy firming that may be appropriate to return inflation to 2 percent over time, the Committee will take into account the cumulative tightening of monetary policy, the lags with which monetary policy affects economic activity and inflation, and economic and financial developments. In addition, the Committee will continue reducing its holdings of Treasury securities and agency debt and agency mortgage-backed securities, as described in its previously announced plans. The Committee is strongly committed to returning inflation to its 2 percent objective.
In assessing the appropriate stance of monetary policy, the Committee will continue to monitor the implications of incoming information for the economic outlook. The Committee would be prepared to adjust the stance of monetary policy as appropriate if risks emerge that could impede the attainment of the Committee's goals. The Committee's assessments will take into account a wide range of information, including readings on labor market conditions, inflation pressures and inflation expectations, and financial and international developments.
Voting for the monetary policy action were Jerome H. Powell, Chair; John C. Williams, Vice Chair; Michael S. Barr; Michelle W. Bowman; Lisa D. Cook; Austan D. Goolsbee; Patrick Harker; Philip N. Jefferson; Neel Kashkari; Adriana D. Kugler; Lorie K. Logan; and Christopher J. Waller.
December FOMC: Dipping Dots – The Monetary Policy of the Future
Summary
The doves won the day at the last FOMC meeting of 2023. The Federal Reserve left its policy rate unchanged at its December 12-13 meeting, a move that was widely anticipated. More important were the changes to the post-meeting statement and the latest Summary of Economic Projections (SEP). The new statement noted that inflation "has eased" over the past year, although still being elevated. The door was left ajar for additional tightening, but the "dot plot" signals that this was not the base case for most participants. The median projection in the dot plot called for 75 bps of easing in 2024 followed by another 100 bps of rate cuts in 2025. A more benign inflation outlook explains why the dots were revised lower for the first time since June 2020.
The job is not yet finished on the inflation fight, and the Committee will need to see additional data to confirm that the recent deceleration in prices is firmly entrenched. That said, the trend appears to be in place, and we expect the incoming data to confirm that inflation is gradually returning to 2%. After a period of nearly two years of rapid monetary policy tightening, a pivot to cuts next year seems like the most probable outcome. We expect the first rate cut of the easing cycle to occur at the June FOMC meeting.
A More Dovish Outlook from the FOMC Heading into 2024
As was widely expected, the FOMC left the fed funds target range unchanged at 5.25-5.50% in a unanimous decision by the 12 voting members at the conclusion of its meeting today. Having last raised the fed funds rate at the Committee's July meeting, the decision to leave the policy rate at its current setting marked the third consecutive hold. Along with a somewhat more dovish statement and rate projections, today's meeting delivered the Fed's clearest message yet that the torrid hiking cycle that began in March of last year has, in all likelihood, come to an end.
With inflation still too high and the Committee committed to bringing it down to 2%, the FOMC did not fully close the door to additional policy tightening today. The post meeting statement noted that it would continue to take into account the cumulative amount of tightening undertaken, policy lags, and economic and financial conditions when determining "additional policy firming." This phrasing suggests to us that, in the near term, the Committee's bias for future policy adjustments remains toward higher rather than lower. That message was reiterated by Chair Powell in the post-meeting press conference when he stated that the policy rate is "likely at or near its peak" and that the FOMC is "prepared to tighten policy further, if appropriate."
Yet, tweaks to the statement indicated that while further tightening remains possible, it is growing less probable. The FOMC seemed less convinced an additional hike would be necessary, noting that it was determining "the extent of any additional policy firming" rather than "the extent of additional firming" (emphasis ours). Powell confirmed in the press conference that the Committee discussed the process of bringing down rates at the meeting, in another sign that the balance of risks to the Fed's next move is shifting away from a hike and toward eventual cuts.
The more dovish guidance comes as the FOMC seems a bit more encouraged by inflation's progress back toward 2%. Core PCE inflation has slowed to a 2.4% annualized pace over the past three months, suggesting the year-over-year rate has further to fall in the coming months (chart). In the FOMC's assessment of current economic conditions, it noted that inflation "has eased over the past year" even as it continues to recognize that inflation "remains elevated." The only other adjustment to the statement was a slight downgrade to recent economic growth, noting it had slowed from its strong pace in the third quarter.
Broadly speaking, the latest Summary of Economic Projections had a dovish tone. The median 2024 dot signaled a year-end fed funds rate of 4.625%, implying 75 bps of easing next year (chart). The median dot for 2025 was 3.625%, down 25 bps from the September projections and signaling another 100 bps of easing to come in 2025. Both of these forecasts were 25 bps lower than what we anticipated in our preview report. These downward revisions were the first time the dots have fallen since June 2020.
The lower projected path for the fed funds rate was mirrored by a more benign outlook for inflation. As expected, the median forecasts for headline and core PCE inflation in 2023 were revised down, reflecting the recent run of slower inflation readings. The Committee's median participant expects PCE inflation to register 2.8% this year and 3.2% when excluding food and energy prices. In the September SEP, these projections were 3.3% and 3.7%, respectively. The median projections for inflation in 2024 and 2025 also came down, though by less than 2023.
The revisions to the Committee's projections for economic growth and unemployment were modest and consistent with a soft landing for the U.S. economy. The median projection for 2024 real GDP growth was 1.4%, a touch lower than the 1.5% from the September SEP but still not far from the Committee's longer run estimate of 1.8%. Similarly, the median projection for the unemployment rate at year-end 2024 is 4.1%, in line with their longer-run estimate.
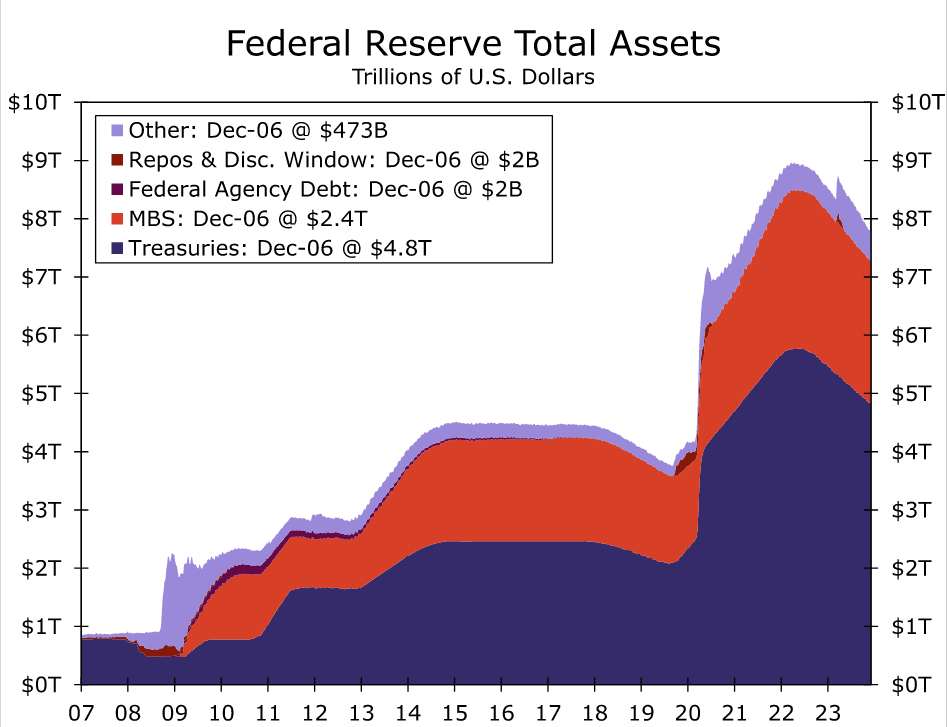
The Committee also reaffirmed its pace of quantitative tightening (QT). The FOMC is currently allowing up to $60 billion of Treasury securities and $35 billion of mortgage-backed securities to roll off of its balance sheet each month. This passive runoff has reduced the size of the Fed's balance sheet from a peak of nearly $9 trillion in Q2-2022 to roughly $7.7 trillion today (chart). We laid out our expectations for QT under a range of scenarios in a recent special report, which can be found here.
Fed Review: Rising Optimism
- The Fed maintained its monetary policy unchanged as widely anticipated.
- Lower rate and inflation projections together with more dovish wording in the statement and from Powell sparked a post-meeting rally in the markets. The Fed did not attempt to guide the market against the easing in financial conditions.
- We see this as a strong signal that the Fed is now preparing the market for rate cuts when warranted by the data. We stick to our long-held call for a first cut in March, which is now also the clear base case for the markets.
The title of our last week's Fed preview was 'low-key optimism', as we anticipated that the 2024 dots could be revised down by a modest 25bp and that Powell would not guide strongly against the market pricing in rate cuts for next year.
However, Powell & co. appeared even more confident about slowing inflation than we (or the markets) expected prior to the meeting. The 2024 dots were revised down by 50bp (now signalling a total of 3x25bp cuts), 2024 median forecast for Core PCE was revised down to just 2.4% (from 2.6%) and the wording on the statement more explicitly noted slowing growth and cooling inflation. In other words, the Fed made no effort to guide the markets towards pricing in 'higher for longer' rates anymore.
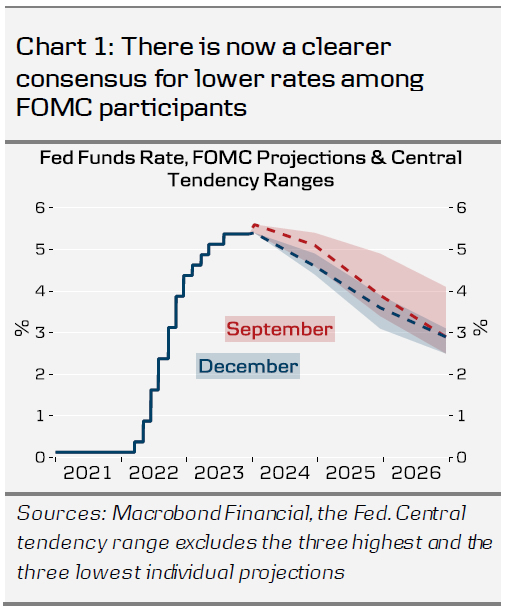
Notably, there is now a stronger consensus on the need for lower rates among FOMC participants. The central tendency range of individual rate projections narrowed, and even the upper limit now pencils in 150bp worth of rate cuts by the end of 2025 (100bp more than in September, Chart 1).
While unemployment rate remains low, both recovering labour supply and cooling demand have helped with balancing the labour market this year. Nominal wage growth is set to continue moderating, and Powell noted that there has now been 'reasonable progress in non-housing services inflation' as well. We discussed the outlook for underlying inflation earlier this week in our new flagship publication, Reading the Markets USD, 12 December.
The restrictive level of real rates has already affected credit growth and investments, but we agree with Powell's assessment that the full impact of past tightening has not yet been felt. We see risks tilted towards weaker private consumption and labour markets going forward, and while the Fed adjusted the 2024 GDP forecast lower (1.4%; from 1.5%), we still remain slightly more pessimistic in our latest Nordic Outlook, 5 December.
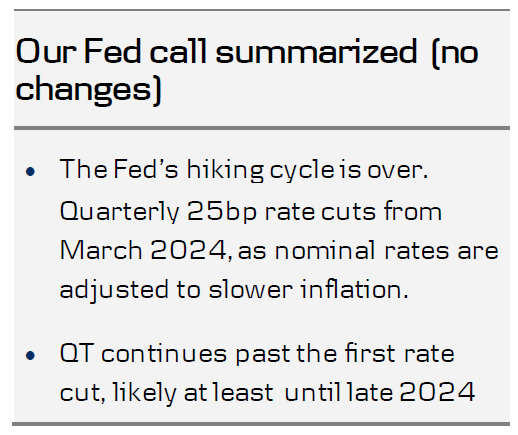
Powell did not touch upon the recent spike in SOFR in his remarks, but simply reiterated that the Fed is not discussing altering the pace of QT for now, and that QT could continue well past the first rate cut, which has been our expectation as well.
Bottom line: we see no reason to change our call for the first rate cut in March, followed by quarterly 25bp reductions through 2024-2025. Markets are pricing in a modest 15% probability for a cut already in January, but as Powell did not suggest that the rate cut talks are already imminent, and as we see no signals of the economy falling off a cliff, we still think that the Fed is likely to remain on hold in the January meeting.
Markets: Dovish reaction leaves market sensitive to disappointments in data
The dovish dot plot signal of three rate cuts next year provided the spark to a significant rally in bond markets tonight. 2Y UST yields dropped 10bp following the release of the projections, while the rally extended through the press conference with an additional decline of 10bp. Fed Funds Futures are now pricing in close to 140bp worth of cuts next year with 20bp for the March meeting. 10Y UST yields are down 15bp to 4.02%, now well below our 12M target of 4.20%. In our opinion, the aggressive pricing following today's meeting leaves the market very sensitive to the incoming data flow from here.
EUR/USD rose by a full figure after the meeting. We anticipate USD weakness to continue in the near-term due to the recent substantial easing of financial conditions, which should lend support to a general risk-on market mood. In the longer horizon, we expect USD to regain strength and see EUR/USD falling towards 1.04 in the 12M horizon. We also remain short EUR/USD via a 6M put spread as part of our FX Top Trades 2024.