

Sample Category Title
Elliott Wave View: Silver (XAGUSD) Has Scope for Further Downside
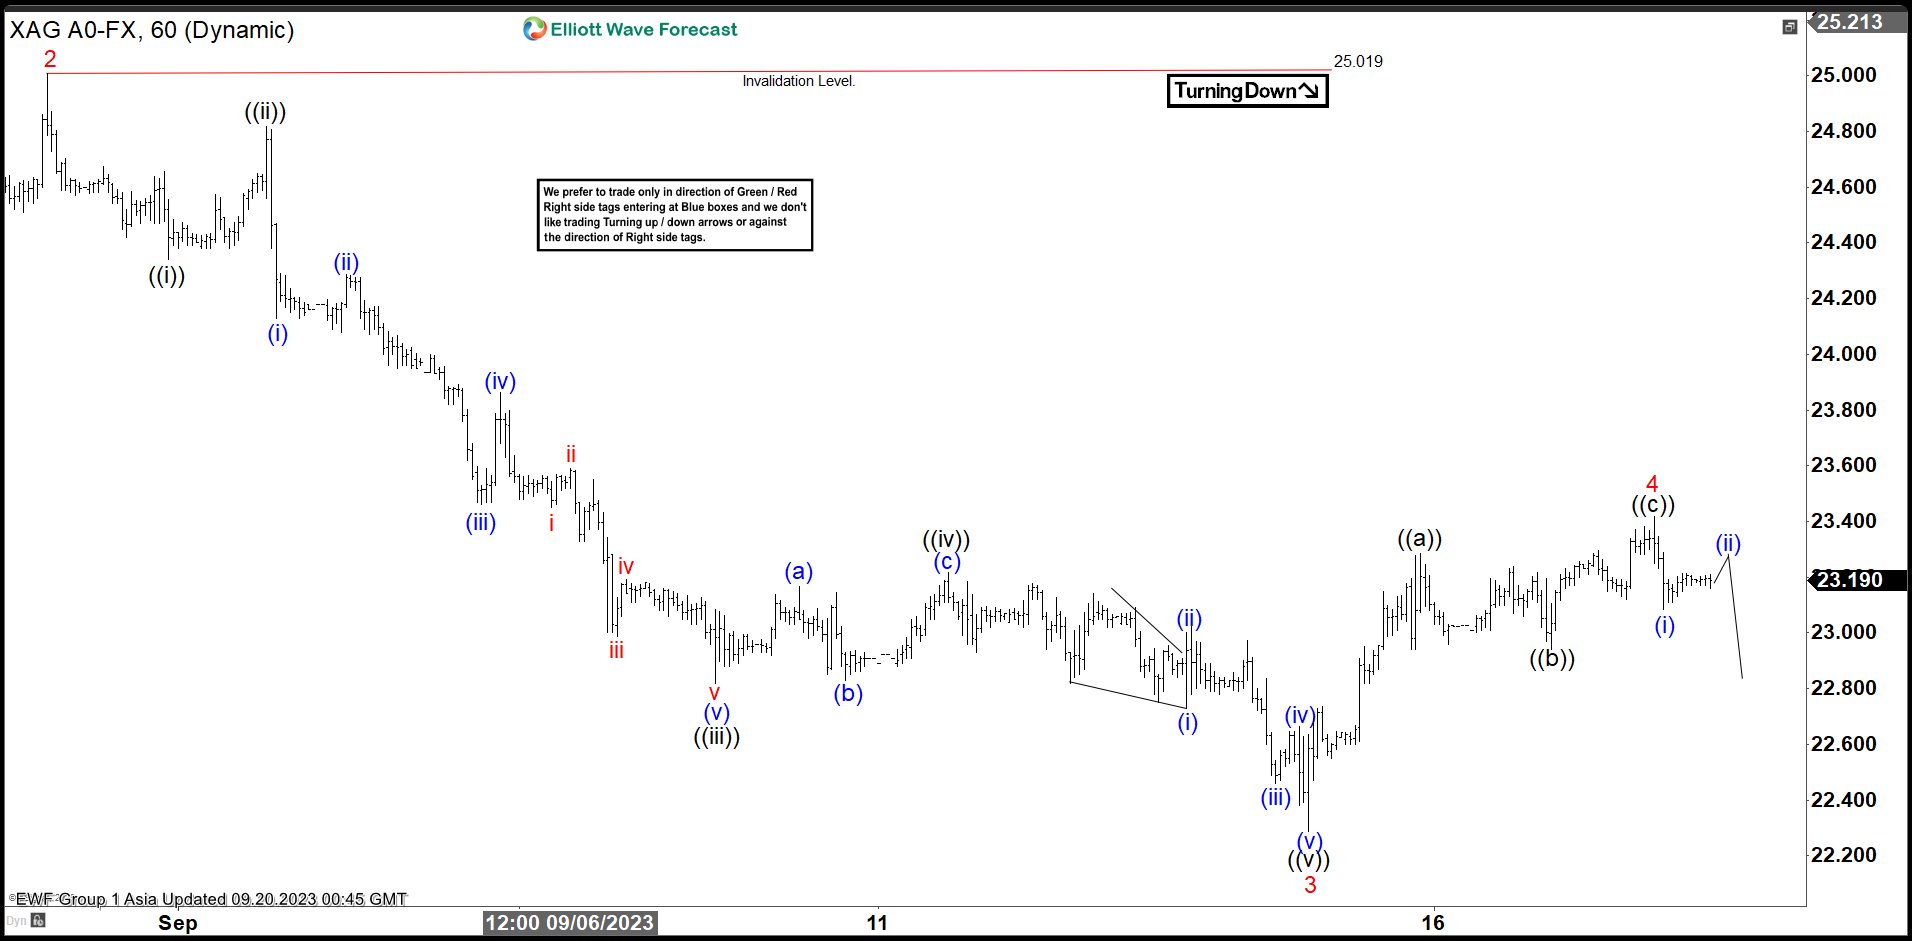
Short Term Elliott Wave View in Silver (XAGUSD) suggests decline from 7.20.2023 high is in progress as a 5 waves diagonal. Down from 7.20.2023 high, wave 1 ended at 22.608 and rally in wave 2 ended at 25. The metal extends lower in wave 3 with internal subdivision as 5 waves. Down from wave 2, wave ((i)) ended at 24.34 and rally in wave ((ii)) ended at 24.82. The metal extended lower in wave ((iii)) towards 22.82 and rally in wave ((iv)) ended at 23.21. Final leg wave ((v)) ended at 22.28 which completed wave 3.
The metal then corrected higher in wave 4 as zigzag in lesser degree. Up from wave 3, wave ((a)) ended at 23.28 and dips in wave ((b)) ended at 22.94. Final leg wave ((c)) ended at 23.41 which completed wave 4. The metal then turned lower again in wave 5. Near term, as far as pivot at 25.02 high stays intact, expect rally to fail in 3, 7, or 11 swing for further downside in wave 5. Potential target lower for wave 5 is a 100% – 161.8% Fibonacci extension from 5.5.2023 high which comes at 21 – 21.84 area.
Silver (XAGUSD) 60 Minutes Elliott Wave Chart
XAGUSD Elliott Wave Video
https://www.youtube.com/watch?v=lG8JFixkC0g
Gold is Rising Despite Inflation Returns
Gold prices are rising for three consecutive days ahead of the Federal Reserve (Fed) interest rate decision, which is expected to remain unchanged due to declining inflation and a positive economic outlook. Investors are keen on the Fed's interest rate guidance, fearing a hawkish stance that could trigger market risk aversion. The market anticipates the Fed will hold off on rate hikes until the end of the year, but concerns about rising energy prices may impact inflation. The Fed might keep interest rates high to bring inflation down to 2%, potentially affecting manufacturing and housing. Gold's technical analysis suggests a short-term bullish trend, hovering around $1,935.
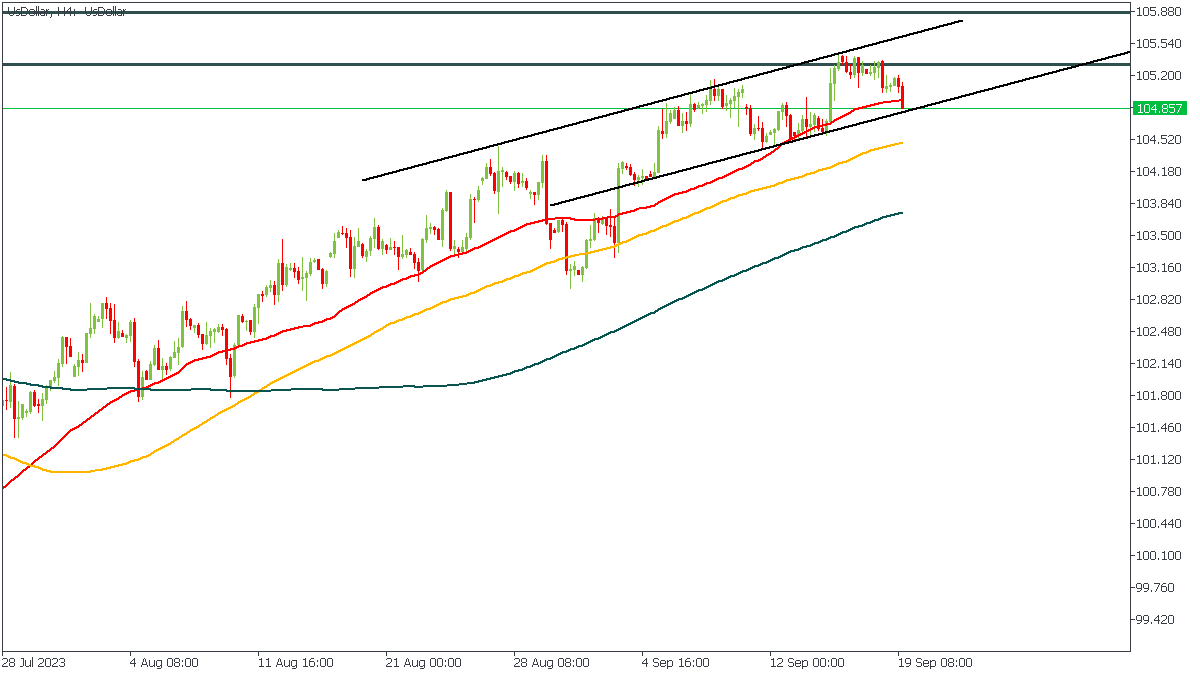
US Dollar - H4 Timeframe
The price action on the 4-hour chart of the US Dollar has been constrained within a rising channel for a while; the most recent move being a retest of the support trendline of the channel. This means we can expect to see a bounce back up from that trendline, in line with the bullish array of the moving averages and the support from the 50-period moving average.
Analyst’s Expectations:
- Direction: Bullish
- Target: 105.258
- Invalidation: 104.450
XAUUSD - D1 Timeframe
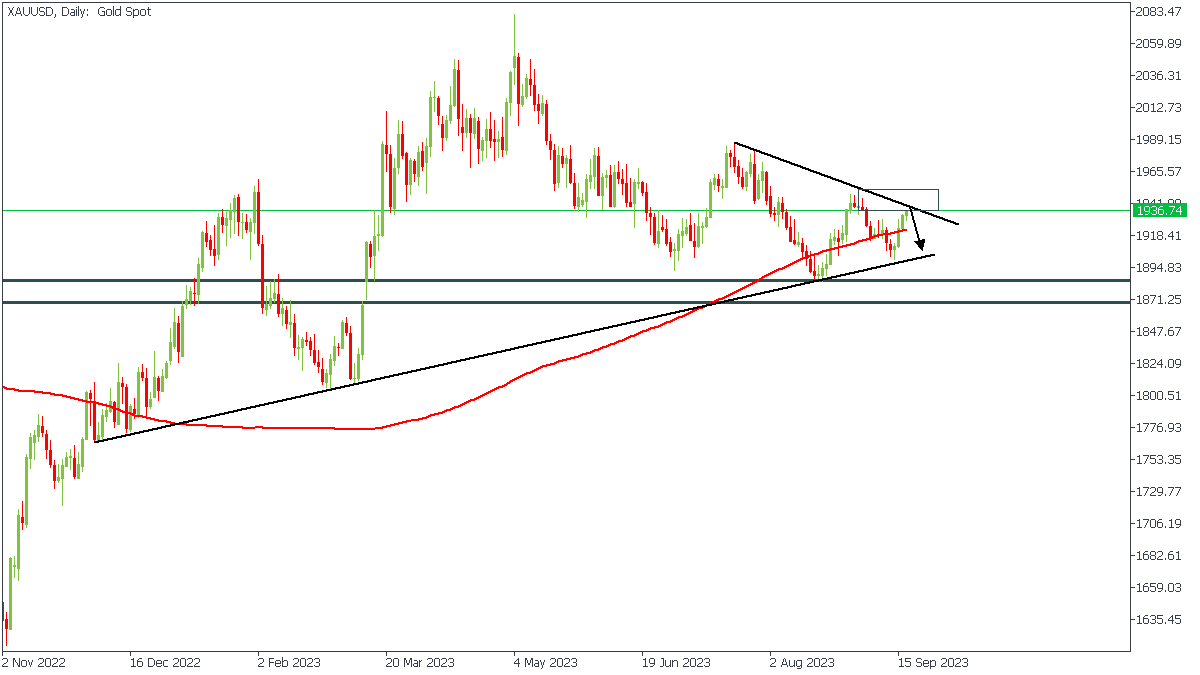
The daily timeframe of XAUUSD has had two bouts of bullish impulse, both of which have failed to deliver higher highs. This is why price can now be seen trading within the wedge pattern, with a likelihood of a rejection from the resistance trendline. The rally-base-drop supply zone is expected to contribute to the bearish outcome from the price action.
Analyst’s Expectations:
- Direction: Bearish
- Target: 1912.20
- Invalidation: 1952.00
CONCLUSION
The trading of CFDs comes at a risk. To succeed, you have to manage risks properly. To avoid costly mistakes while you look to trade these opportunities, be sure to do your due diligence and manage your risk appropriately.
FTSE 100 Wave Analysis
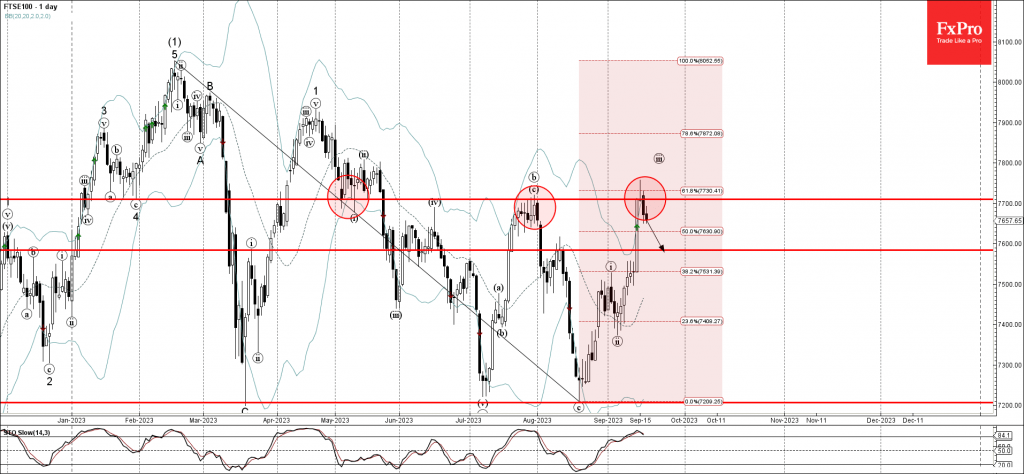
- FTSE 100 reversed from pivotal resistance level 7710,00
- Likely to fall to support level 7585,00
FTSE 100 index previously reversed down from the pivotal resistance level 7710,00 (former yearly high from July, former strong support from May) intersecting with the upper daily Bollinger Band.
The resistance level 7710,00 was strengthened by the 61.8% Fibonacci correction of the previous downward impulse from February.
Given the strength of the resistance level 7710,00 and the overbought daily Stochastic, FTSE 100 index can be expected to fall further toward the next support level 7585,00.
GBPCHF Wave Analysis
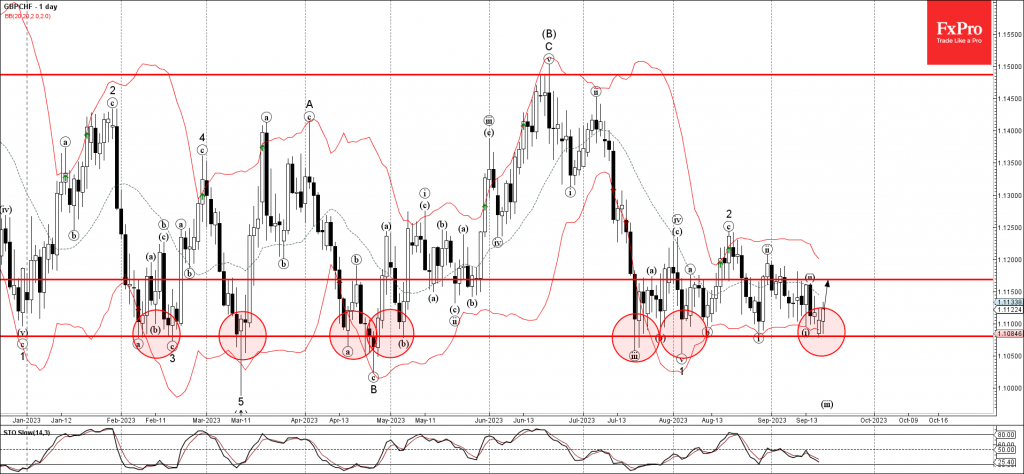
- GBPCHF reversed from multi-month support level 1.1080
- Likely to rise to resistance level 1.1170
GBPCHF currency pair recently reversed up from the major, multi-month support level 1.1080 (which has been reversing the price from February) intersecting with the lower daily Bollinger Band.
The upward reversal from the support level 1.1080 stopped the previous short-term impulse wave iii.
Given the strength of the support level 1.1080, GBPCHF can be expected to rise further toward the next resistance level 1.1170 (top of the previous correction ii).
CHFJPY Confined to Tight Range as Positive Momentum Wanes
- CHFJPY consolidates after reaching all-time high
- Short-term bias looks neutral
- But downside risk if 50-day SMA doesn’t provide support
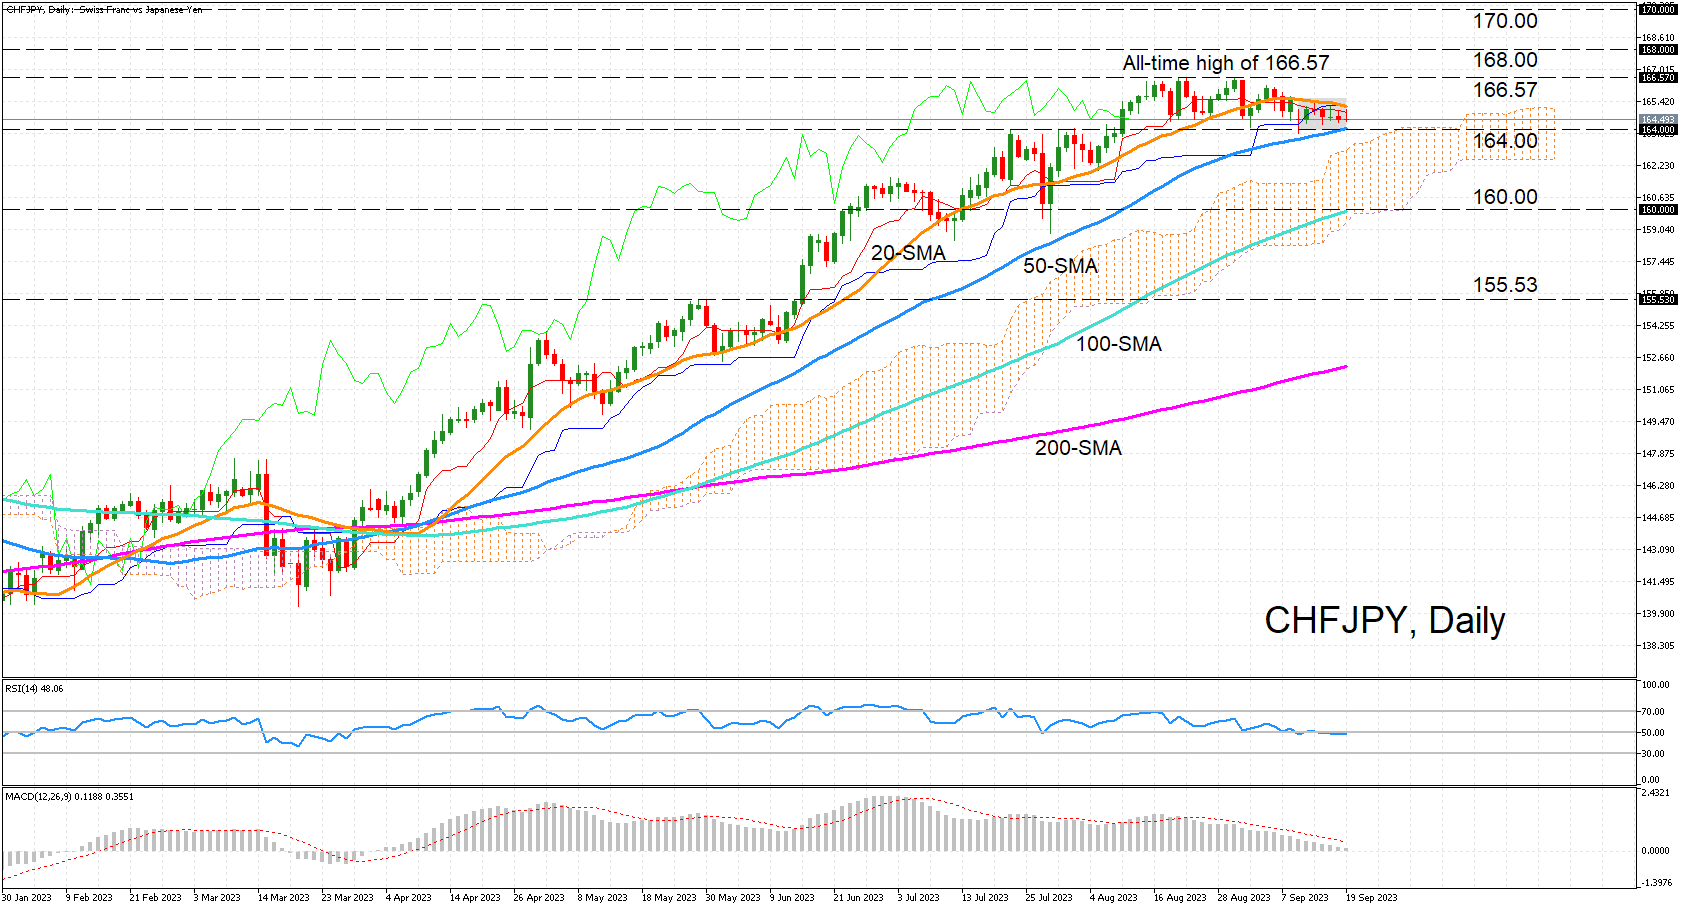
CHFJPY has been drifting somewhat lower during September as the year-to-date uptrend lost its steam after reaching an all-time high of 166.57 on August 30. The short-term picture is neutral as the RSI has flatlined just below the 50-mark and the MACD is close to turning zero below its red signal line.
The price action has been stuck in a very narrow range over the past week and is being closed in by the 20-day simple moving average (SMA) to the north and the 50-day SMA to the south. A bearish breakout seems slightly more probable at this stage given the steady decline in positive momentum, potentially creating a battleground in the 164.00 region where the 50-day SMA resides.
A break below the 164.00 floor would take the price inside the Ichimoku cloud, switching the near-time bias to bearish and the medium-term outlook to neutral. Steeper losses would draw attention to the 160.00 handle just above the 100-day SMA and the May top of 155.53.
However, if the bulls fight back and succeed in pushing the price above the 20-day SMA in the 165.20 area, the pair could attempt to surpass its all-time peak of 166.57, resuming its journey into uncharted territory. The 168.00 and 170.00 levels would then become the obvious targets before 261.8% Fibonacci extension of the September 2022-January 2023 downleg at 174.05 comes into scope.
In brief, CHFJPY could remain in a neutral phase for a while longer, but should it drop below the 50-day SMA, the longer-term bullish structure would start to look a bit shaky.
Canadian Dollar Shows Strength
The Canadian dollar reversed course to the upside a week and a half ago, and its strength is gaining momentum on the back of both a fresh wave of demand for commodities and robust economic data.
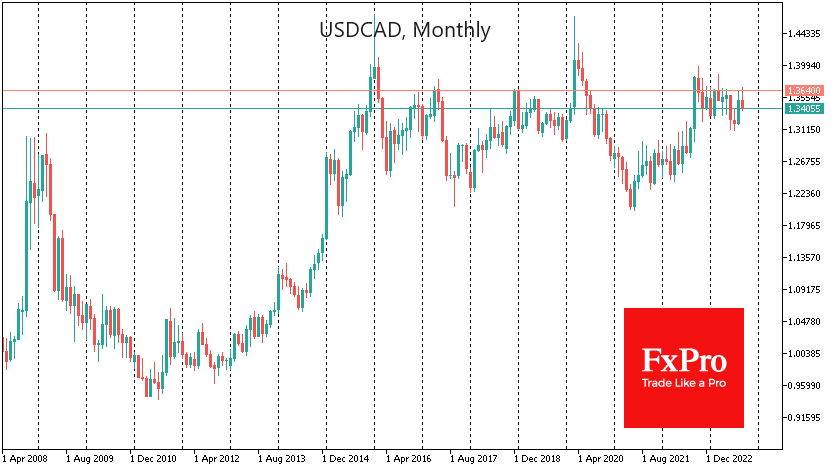
USDCAD is down 1.9% at 1.3430 since 8 September, when the pair reversed sharply lower as it approached 1.3700. Since 2003, the pair has only traded above 1.3700 for relatively short periods at the height of the crisis. The Canadian dollar became attractive for long-term buying as soon as the dust settled after the market crash during the oil collapse in 2015 and lockdowns in 2020.
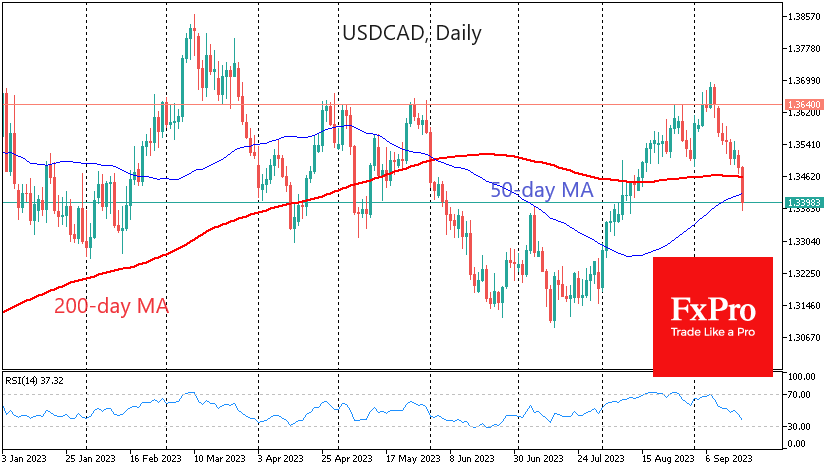
Over this and the previous years, the Canadian dollar has held back from testing multi-year lows against the USD despite the latter’s broad rally. On more than one occasion this year, we have seen the USDCAD sell-off intensify as it entered the 1.3600 area. September is no exception, as we see a similar decline in intensity to that seen in June.
The fundamental news for the Canadian dollar is the rise in oil prices and the fact that US producers are still clearly unable to close their operating deficits. Under these conditions, demand for Canadian crude, which is more expensive and “dirtier” to produce, is increasing. However, the 36% rise in crude oil prices since the end of June has convinced investors that Canadian exports will benefit from the recent price spike. Moreover, it could also be why the Bank of Canada shifted its policy towards more tightening after two months of CPI acceleration.
The latest data, which showed an acceleration in the annual pace to 4.0% from 2.8% in June and 3.3% in July, raised expectations for another rate hike by the Bank of Canada later this year.
USDCAD’s failure on Tuesday also carries an important technical signal. The pair broke above both its 50- and 200-day moving averages during the day. The last time this happened was in early June; a sell-off for almost a month followed the signal.
As well as indicating the strength of the Canadian economy, the active decline in the USDCAD may also be a sign of growing risk appetite among North American investors. This could be an important leading signal for global markets.
GBP/USD Drifting With Eye On inflation report
- UK inflation expected to rise
- Fed widely expected to pause rate increases
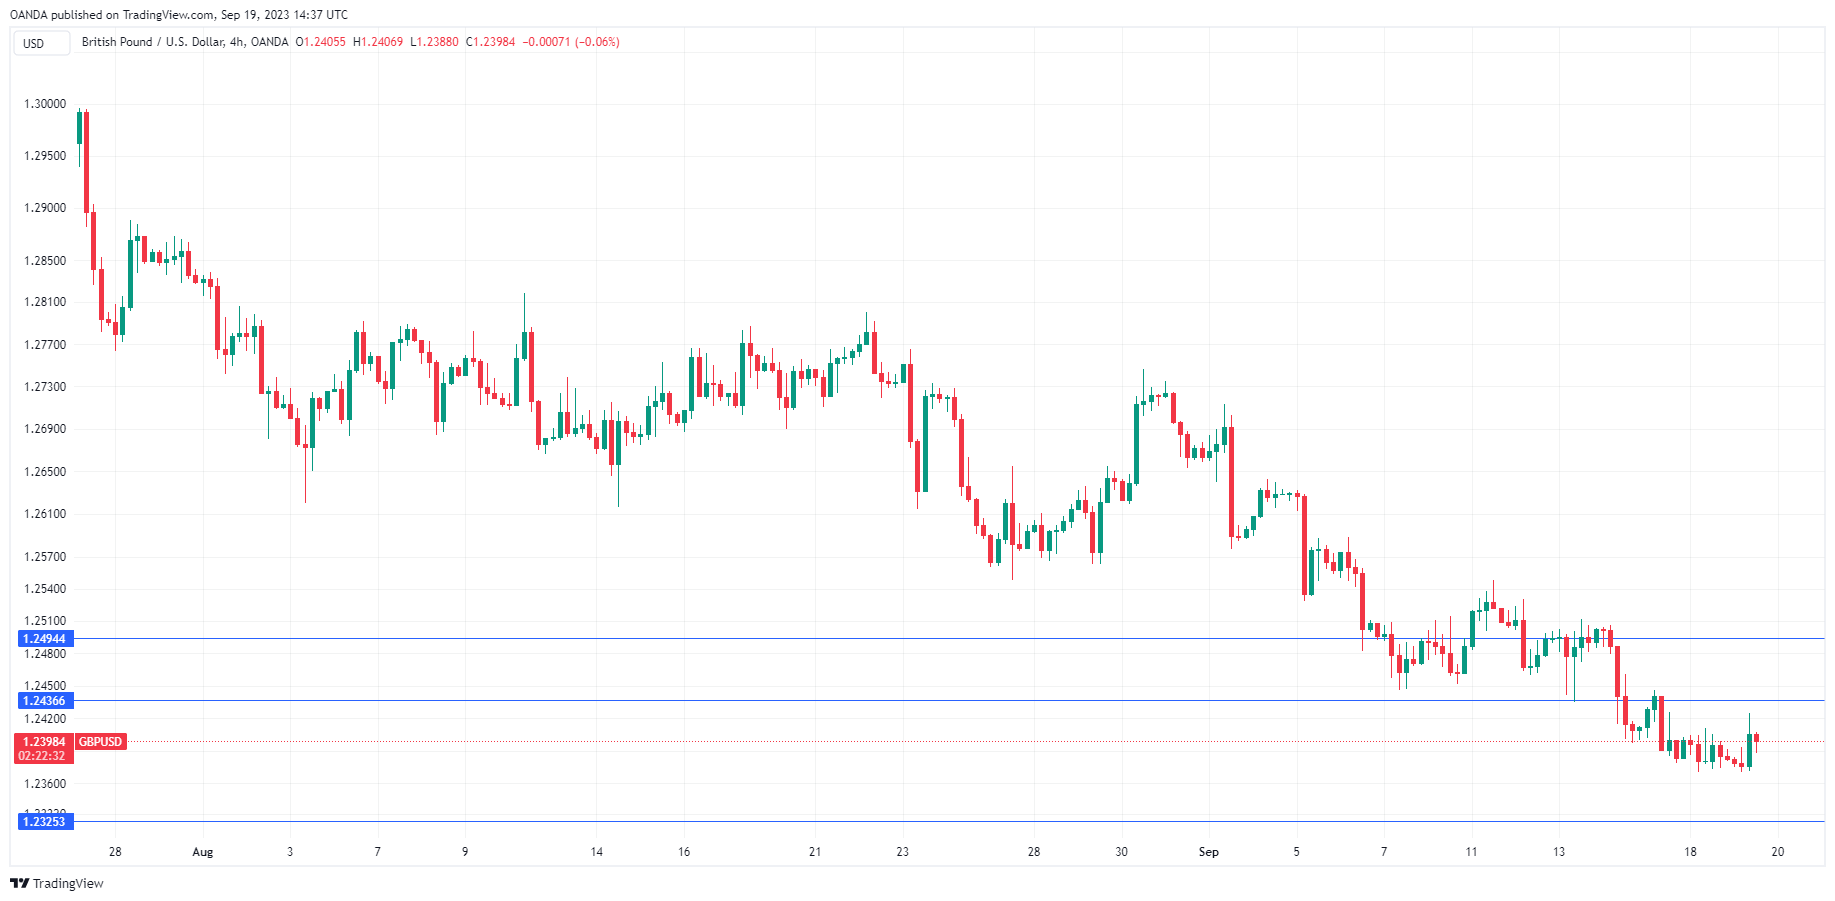
The British pound is trading quietly on Tuesday. In the European session, GBP/USD is trading at 1.2397, up 0.10%.
UK inflation expected to rise
The Bank of England has had a rough time in its battle with inflation, to put it mildly. Inflation in the UK is at a higher level than any other G-7 economy, at 6.8%. While inflation has been falling in most of the major economies, the UK is bracing for a rise in inflation in August, from 6.8% to 7.0%. The core rate is expected to drop a notch, from 6.9% to 6.8%. Unless there is a huge surprise on the downside, the inflation release will support the BoE raising rates at Thursday’s meeting, even though the economy is struggling and higher rates raise the chances of a recession.
Most of the major central banks have ended their tightening cycles or are close to it. The BoE is expected to raise rates on Thursday, but what the BoE is planning after that is unclear. If inflation is different from the forecast, it could shake up the British pound and also force a change in inflation projections.
The Fed concludes a two-day meeting on Wednesday and is virtually certain to hold rates at the target range of 5.25%-5.50%. This doesn’t mean that the rate announcement will be a sleeper. Investors will be keeping an eye on the Fed dot plot, which was last updated in June.
The dot plot indicated that the Fed expected to increase rates one more time before the end of the year. Will that projection remain in place after tomorrow’s expected pause? As well, the dot plot signalled rate cuts of 1% in 2024 but that may have changed. If the Fed delivers a ‘hawkish pause’, which would not be a surprise, the future markets will likely respond by repricing a higher likelihood of a rate hike before the end of the year. Currently, the odds of a quarter-point hike stand at 28% in November and 38% in December, according to the FedWatch Tool.
GBP/USD Technical
- GBP/USD is putting pressure on resistance at 1.2436. Above, there is resistance at 1.2495
- There is support at 1.2325 and 1.2267
Dollar Wavers as Fed’s Two-Day Policy Meeting Begins
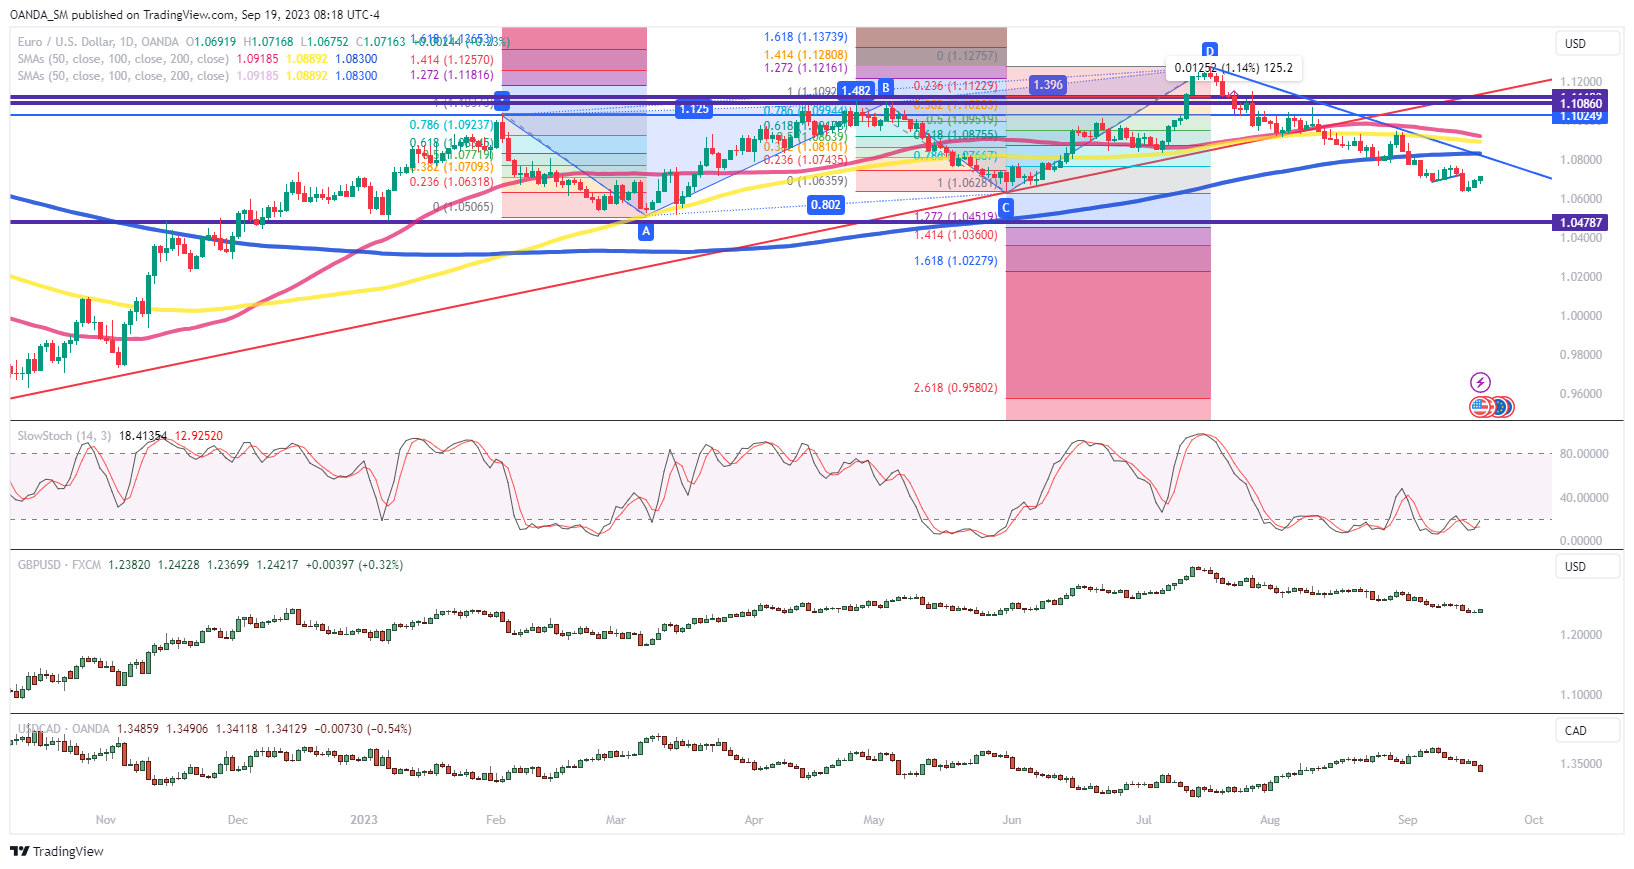
Modest dollar weakness is emerging as the Fed begins their two-day policy meeting; the euro is back above the 1.07 level, while the loonie is advancing below the 200-day SMA, and as the British pound rises above the 1.24 level. Positioning into the FOMC meeting is seeing rate options traders increase hedges, which means some traders are worried that the expected mid-year pivot could be in jeopardy.
FOMC
Inflation has come down a lot, but the Fed’s inflation isn’t quite over yet. The market is assuming that inflation will come down all the way down to the Fed’s 2% target and that rate cuts will happen before next summer starts. The risks for headline inflation to heat up over the next couple of months are rising and that should complicate what the Fed does. Do policymakers become convinced that despite a resilient labor market, pricing pressures will continue to ease? If core inflation shows it is struggling to continue to drop, the higher-for-longer rate regime will last a lot longer than the market is pricing in.
To have a weaker dollar, the Fed’s projections will need to show policymakers don’t believe inflation will be too complicated to bring prices back down close to target. For stock market bulls, it seems if optimism remains that the Fed is likely done raising rates, that could help keep equities supported a little while longer. If the peak is in place Wall Street will anticipate that peak tightness in financial conditions is here and that it will only get better going forward. The problem for stocks is that double digit earnings growth will not be easy given revenue growth will be soft given the long and variable lags from the Fed’s tightening.
Where the market is getting the stock market wrong is the current belief that a soft landing means we can just count on the AI trade, improved productivity, and economic resilience for earnings to hold up. The problem is that the risk of a soft landing becoming hard landing is there. Stocks will struggle as the fastest rate hiking cycle into a leveraged system with quantitative tightening means we might not have enough excess liquidity to keep driving real money growth and economic growth.
USD outlook
Near-term action for the dollar will depend on the Fed and if the market believes the risks are growing for higher-for-longer to last deep into next year. The dollar could be supported over the short-term if the Fed seems likely to deliver one more rate hike at the end of the year.
Bank of England Decision Could Spell Bad News for Sterling
- Bank of England set to raise interest rates this week
- Mixed economic data, so commentary could be cautious
- Risks for British pound seem tilted to the downside
- Decision expected at 11:00 GMT on Thursday
Weaker data pulse
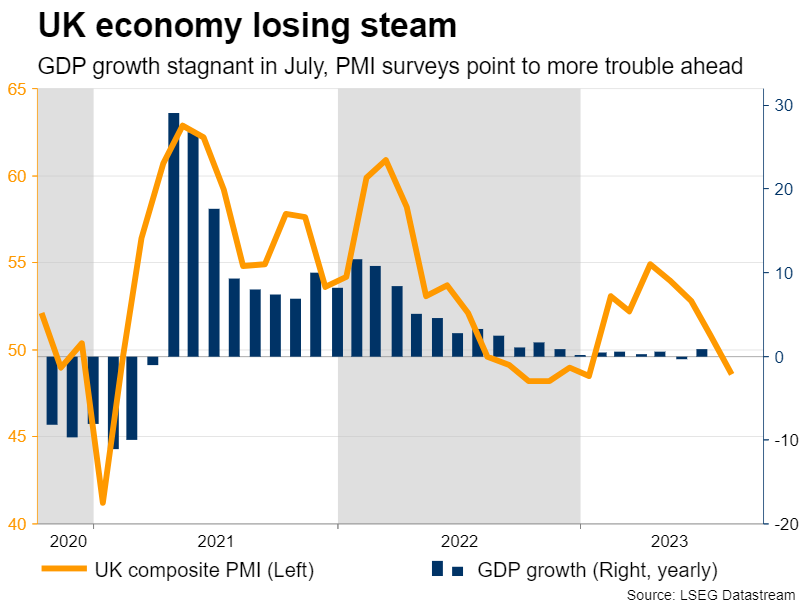
The United Kingdom economy seems to be losing steam, with recent data releases showcasing a severe slowdown in growth and a softer labor market. Economic growth was stagnant in July from a year earlier and business surveys warn the situation will get worse, putting the risk of a minor recession on the radar.
Employment data have already started to reflect this weakness. The labor market lost jobs in July, pushing the unemployment rate higher. Open job vacancies declined as well, which is a sign that labor demand has started to soften. Hence, employment trends are moving in the wrong direction and this phenomenon is likely to persist according to leading indicators.
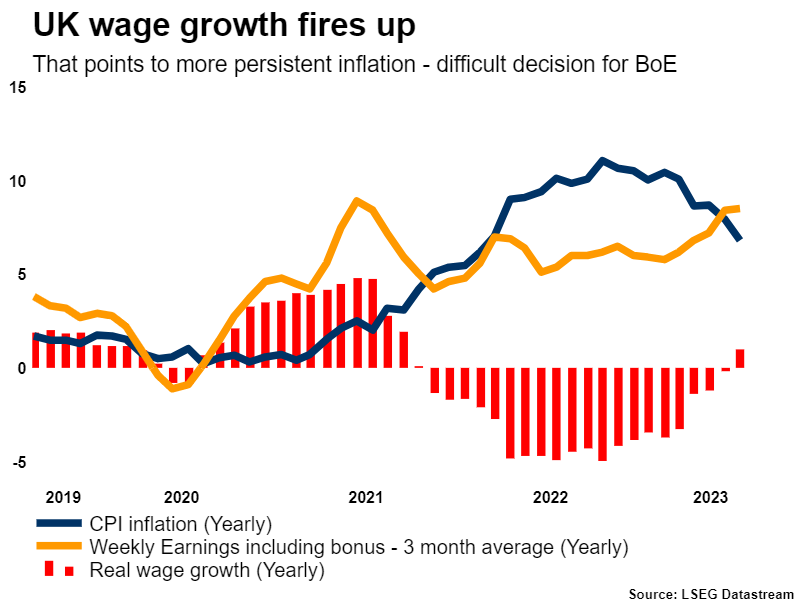
The problem for the Bank of England is that wage growth is already hot and continues to accelerate. Including bonuses, wage growth is running at 8.5% in annual terms. That suggests inflationary pressures are unlikely to cool anytime soon, and the recent rally in oil prices reinforces this notion.
BoE dilemma
As such, the BoE has a difficult decision to make. Raising rates even higher would help to bring inflation under control, but it would also dampen economic growth further, pushing the economy off the cliff towards a recession.
Market pricing points to an 80% probability of a rate increase this week, which is justified since recent remarks by BoE officials reveal a preference for further tightening. Nonetheless, it could be a closer call than investors expect. The vote count is likely to be split, with some policymakers favoring no action instead, following the streak of worrisome data.
Most importantly, the forward guidance might not include a commitment to any further action. There's a strong possibility the BoE signals this is the peak in interest rates already, similar to what the ECB did last week. Several policymakers including chief economist Huw Pill have indicated they would rather keep rates steady for a longer period of time, rather than raise them much further.
Therefore, the statement is likely to strike a cautious tone. Since this is one of the smaller meetings without updated economic forecasts or a press conference, this is where the market action will come from. Note that the nation's inflation numbers for August will be released on Wednesday ahead of the meeting and could influence the decision. The latest business surveys will follow on Friday.
Lose-lose scenario for sterling?
Turning to the market reaction, the risks surrounding the British pound from this meeting seem tilted to the downside. If the BoE raises rates, the currency could initially spike higher. However, any upside reaction might be relatively small since this is the market's baseline scenario already, and reverse quickly if there's no clear commitment to any further hikes.
That's what happened to the euro after last week's ECB decision, and the pound could suffer a similar fate as traders begin to speculate that the tightening cycle is over. And if the BoE doesn't raise rates, that would come as a shock given current market pricing, pushing the pound lower immediately.
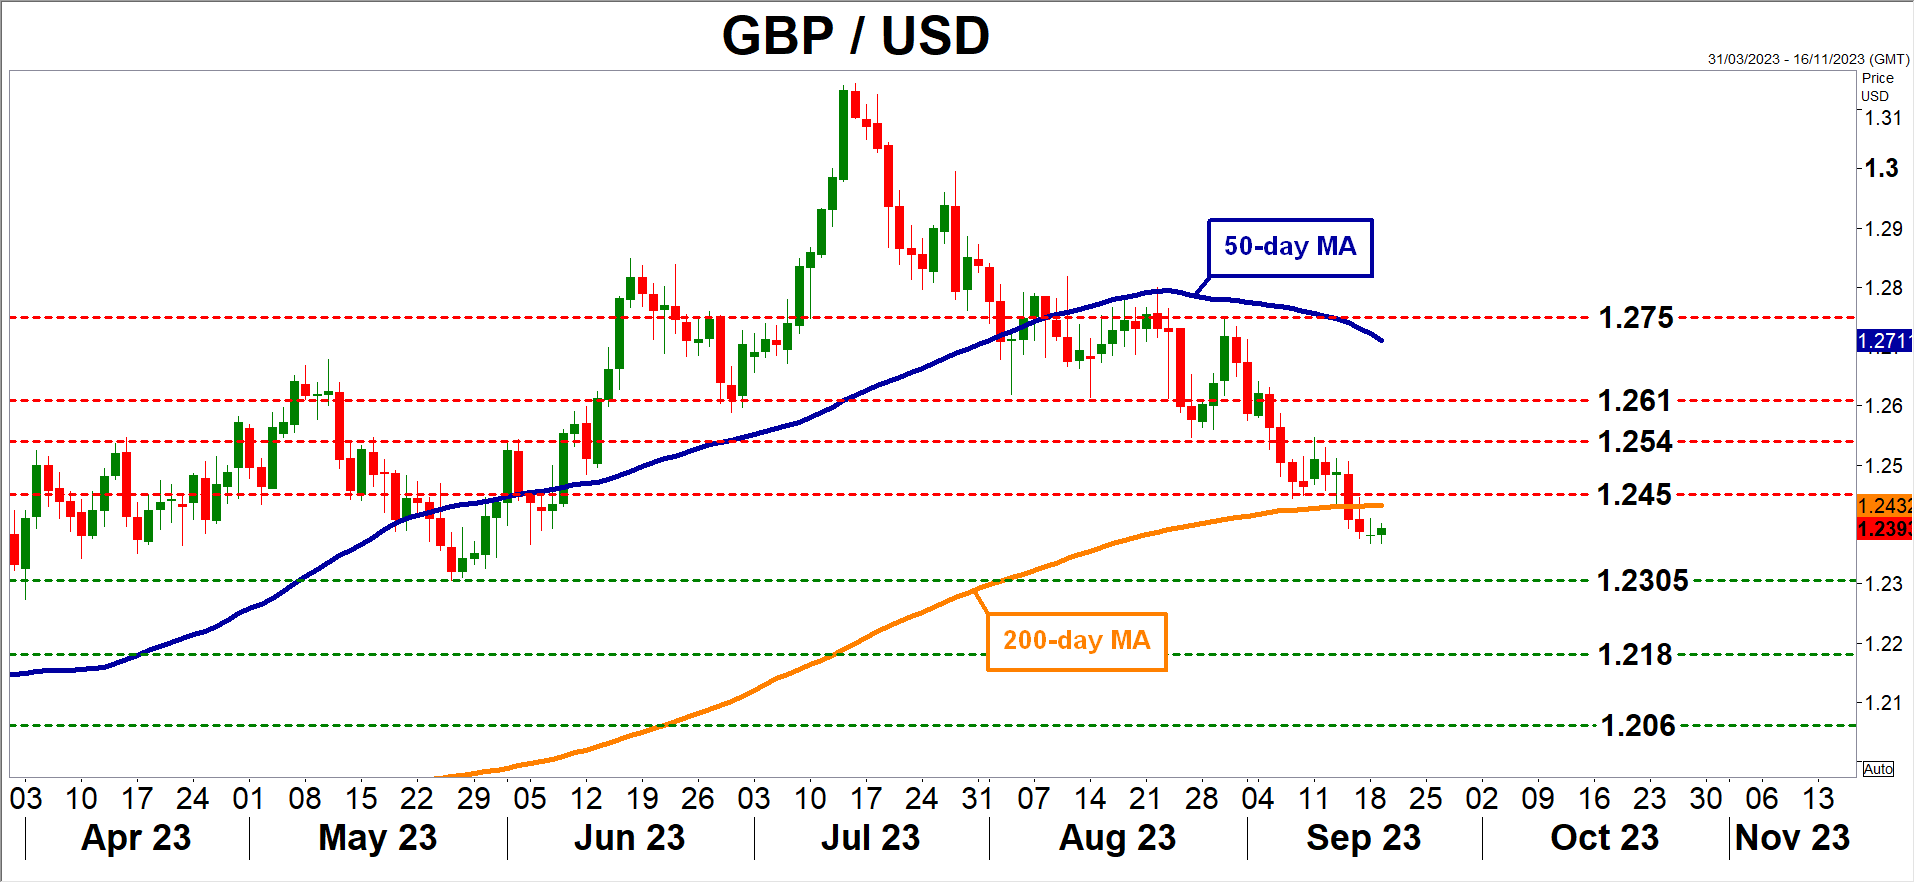
Looking at the charts, Cable has been moving lower for two months now, falling below some key moving averages. The most important area to watch on the downside is 1.2300, as any violation of this region could turn the technical picture more negative. On the upside, any advances could stall near the 1.2450 zone, which has served both as support and resistance this year.
Beyond the BoE decision, the overall trajectory of the pound will also depend on how stock markets perform, given the currency's sensitivity to global risk sentiment.