

Sample Category Title
USD/JPY Daily Outlook
Daily Pivots: (S1) 147.61; (P) 147.77; (R1) 148.02; More...
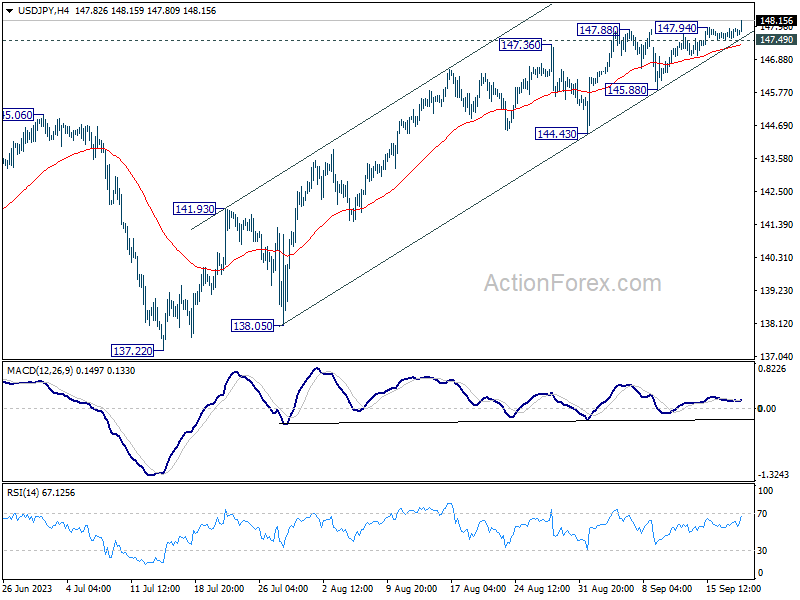
Intraday bias in USD/JPY is back on the upside, as recent rally resumed after brief consolidations. Current rise from 127.20 should target a retest on 151.93 high. On the downside, below 147.49 minor support will turn intraday bias neutral first. But outlook will stay bullish as long as 145.88 support holds, in case of retreat.
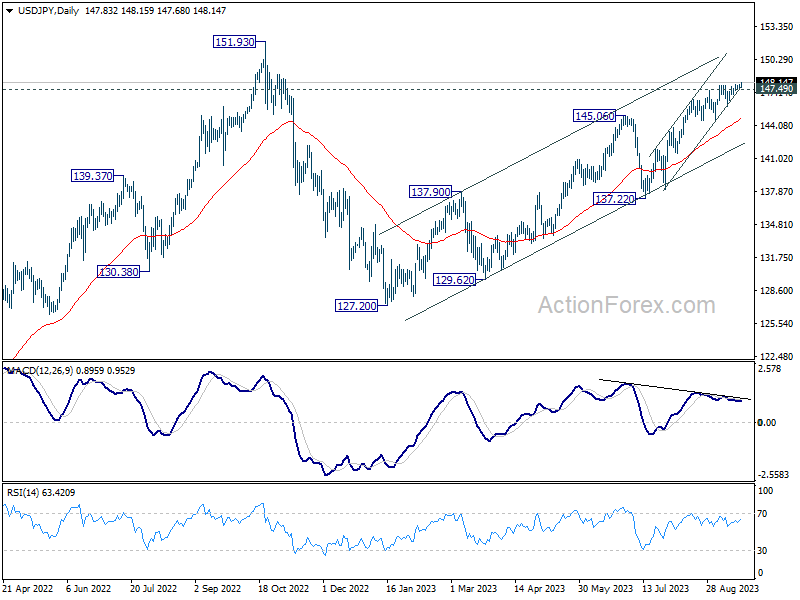
In the bigger picture, while rise from 127.20 is strong, it could still be seen as the second leg of the corrective pattern from 151.93 (2022 high). Rejection by 151.93, followed by break of 137.22 support will indicate that the third leg of the pattern has started. However, sustained break of 151.93 will confirm resumption of long term up trend.
USD/CHF Daily Outlook
Daily Pivots: (S1) 0.8956; (P) 0.8970; (R1) 0.8993; More....
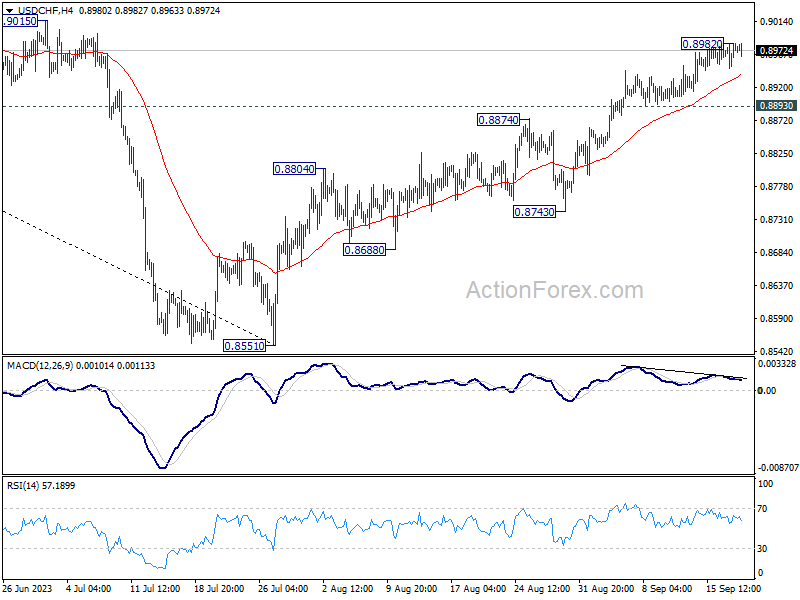
Intraday bias in USD/CHF stays neutral at this point and more consolidations could be seen. But further rally is expected as long as 0.8893 support holds. Above 0.8982 will resume the rally from 0.8551 to 0.9146 cluster resistance. However, firm break of 0.8893 will argue that a short term top is possibly formed, and turn bias back to the downside for 55 D EMA (now at 0.8858).
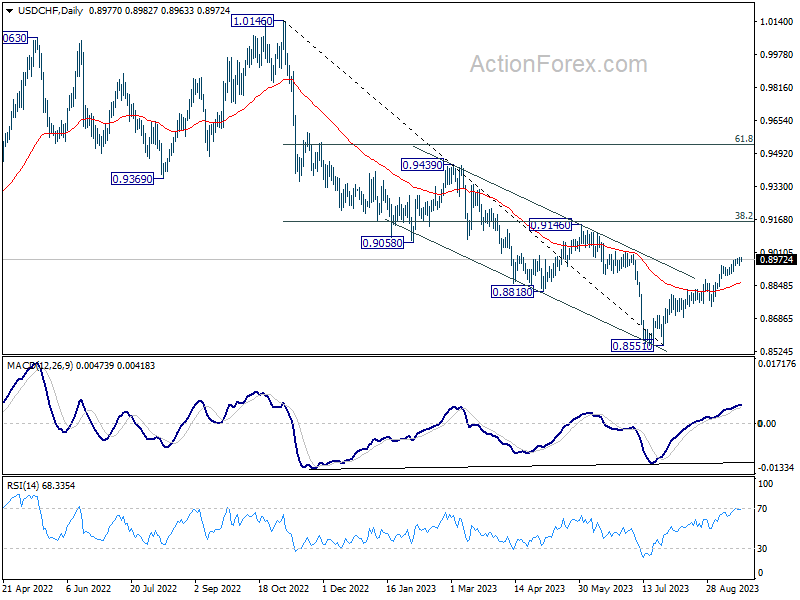
In the bigger picture, rebound from 0.8551 medium term bottom is currently seen as a correction to the downtrend from 1.0146 (2022 high). Further rally would be seen to 0.9146 cluster resistance (38.2% retracement of 1.0146 to 0.8551 at 0.9160). Strong resistance could be seen there to limit upside, at least on first attempt.
EUR/USD Daily Outlook
Daily Pivots: (S1) 1.0663; (P) 1.0691; (R1) 1.0706; More...
Intraday bias in EUR/USD remains neutral. More consolidations could be seen first. Strong rebound from current level, followed by break of 1.0767 resistance, should confirm short term bottoming. Intraday bias will be back on the upside for 1.0944 resistance. However, sustained break of 1.0609/34 support zone will carry larger bearish implication, and target 1.0515 support next.
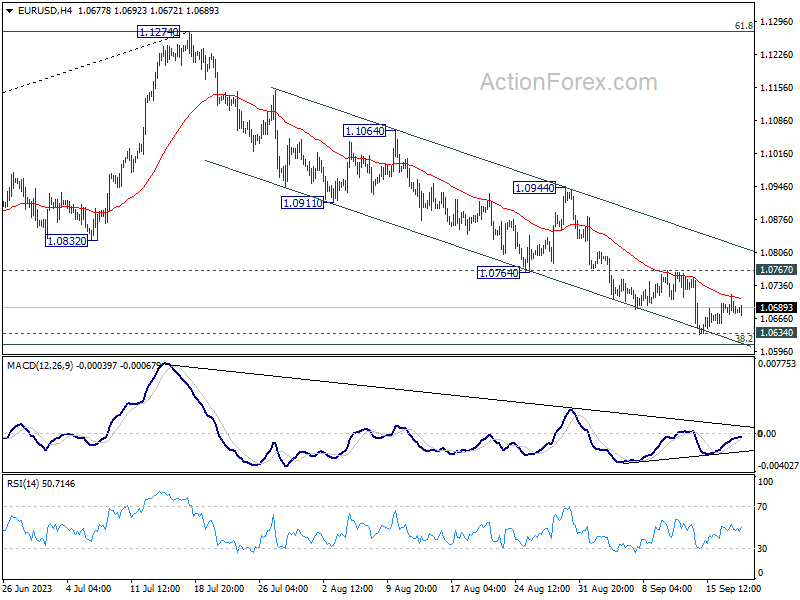
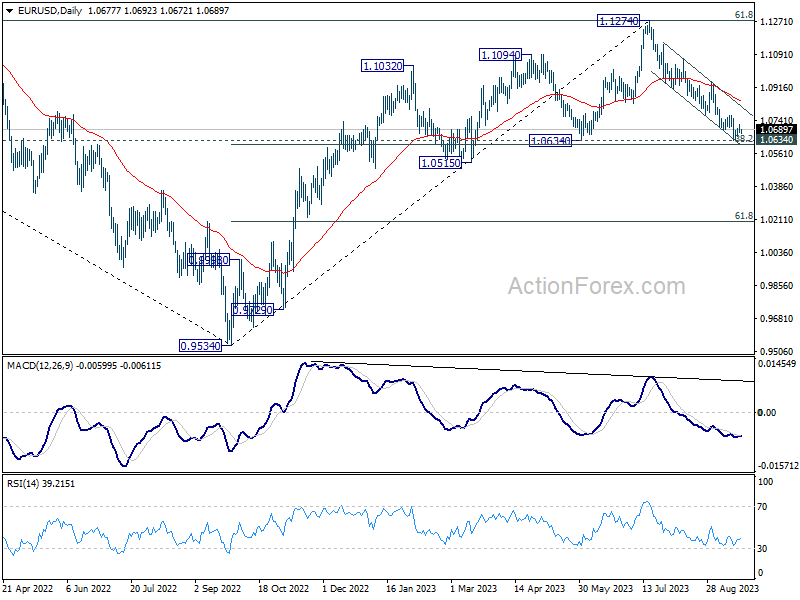
In the bigger picture, fall from 1.1274 medium term top is seen as a correction to up trend from 0.9534 (2022 low). Strong support could be seen from 1.0634 cluster support (38.2% retracement of 0.9534 to 1.1274 at 1.0609) to bring rebound, at least on first attempt. However, sustained break of 1.0609/0634 will raise the chance of bearish trend reversal, and target 61.8% retracement at 1.0199.
NZDUSD Attempts to Break Sbove 61.8% Fibonacci
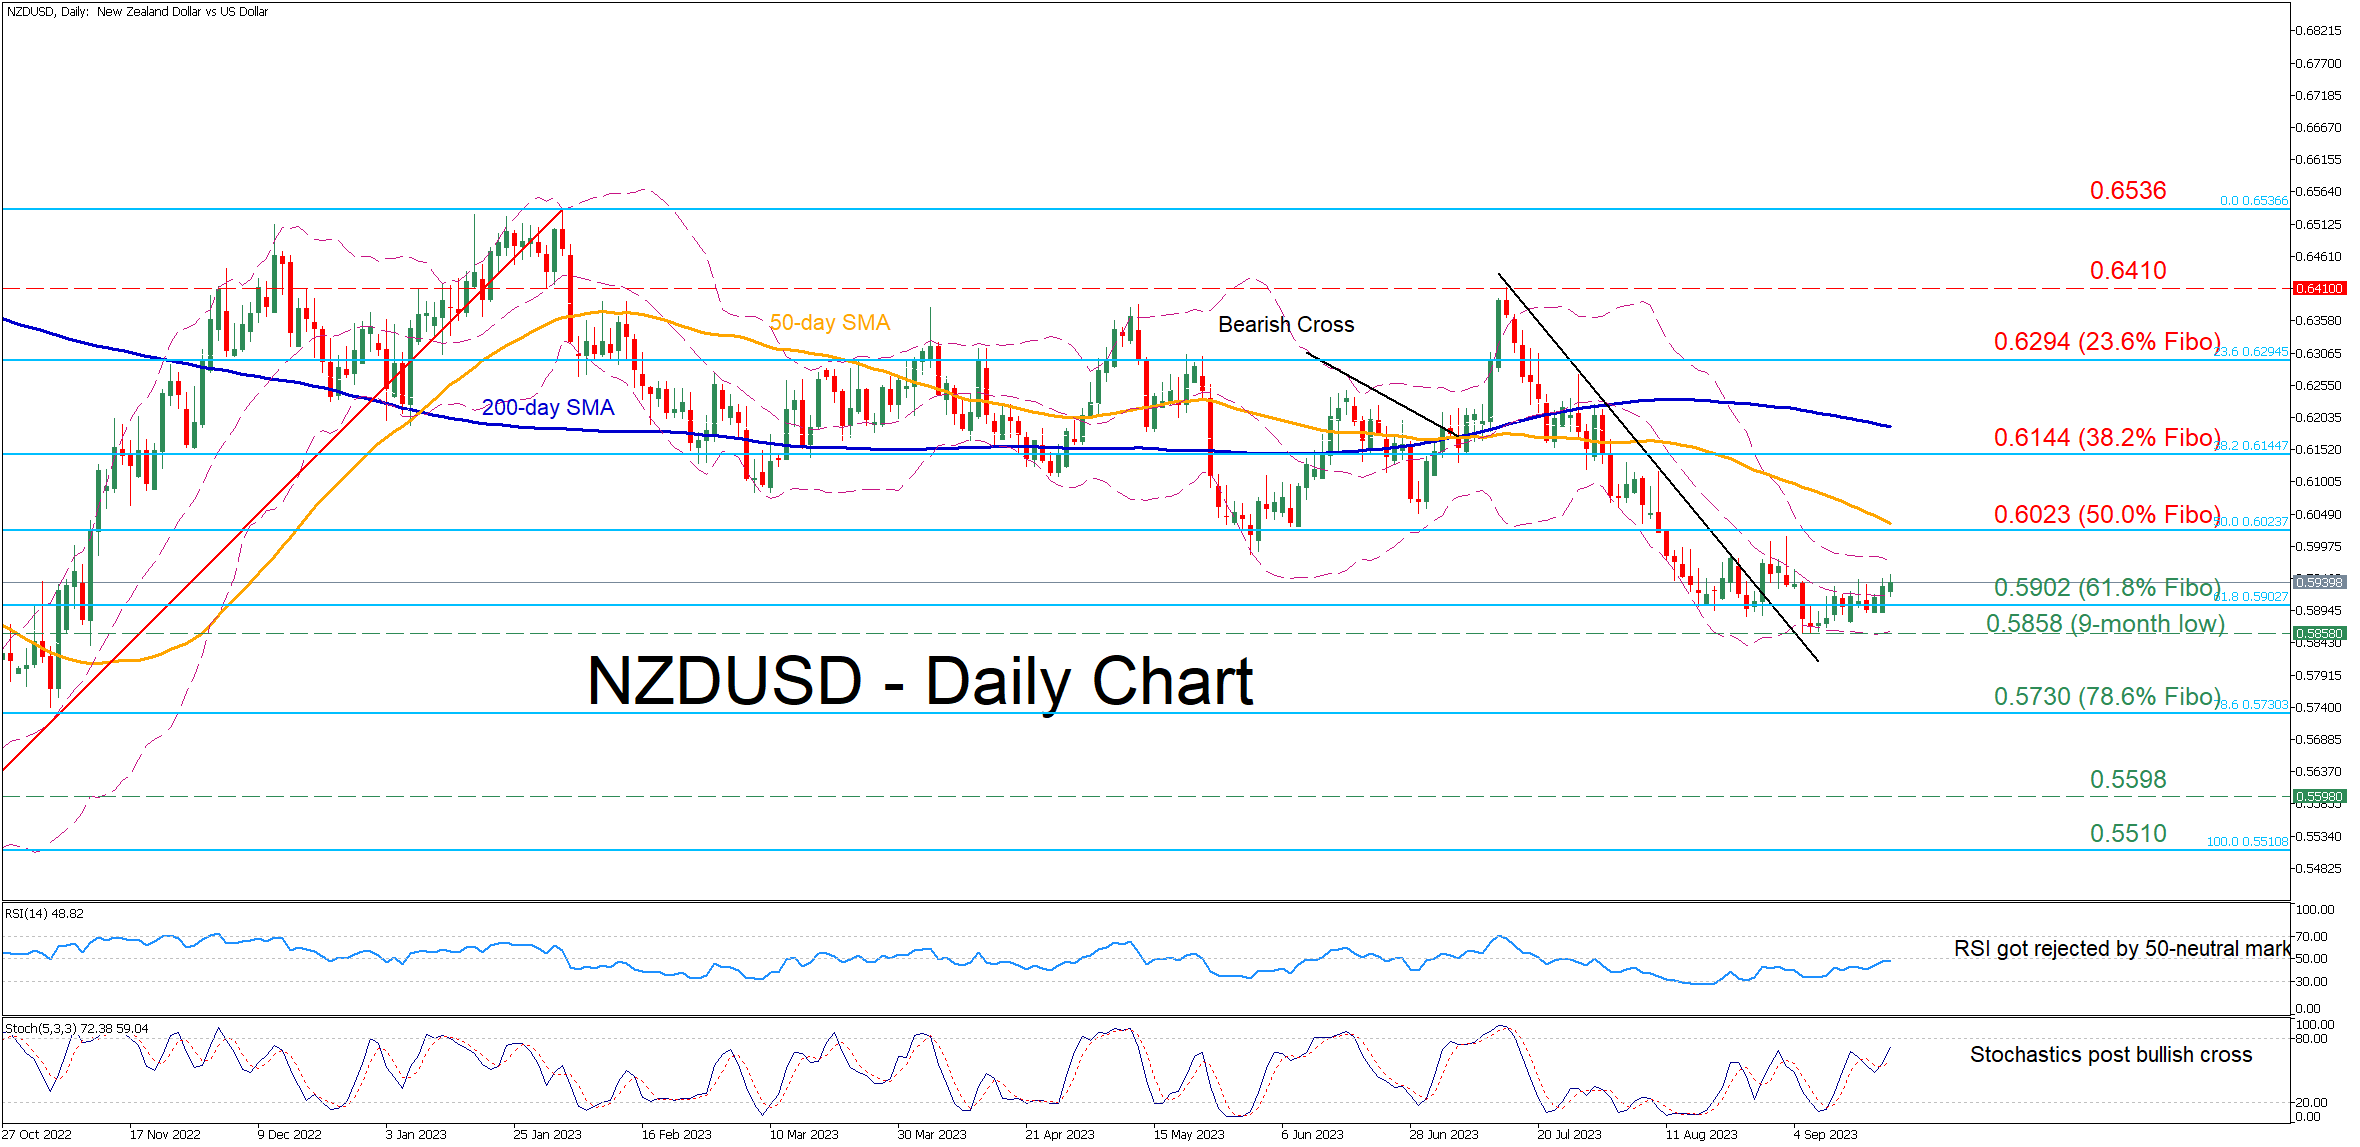
- NZDUSD halts decline at a fresh 9-month low of 0.5858
- Hovers around 61.8% Fibonacci retracement of the 0.5510-0.6535 upleg in the past three weeks
- Positive momentum is picking up, increasing odds for an upside violation of the recent range
NZDUSD had been stuck in a downtrend after posting a five-month high of 0.6410 in mid-July, which resulted in a fresh nine-month low on September 5. Since then, the pair has been consolidating around the 61.8% Fibo of 0.5902, with the momentum indicators currently pointing to an impending upside move.
Should buying interest intensify and the pair profoundly closes above the 61.8% Fibo of 0.5902, immediate resistance could be found at the 50.0% Fibo of 0.6023. Failing to halt there, the price might then ascend towards the 38.2% Fibo of 0.6144. Further advances could then cease at the 23.6% Fibo of 0.6294.
Alternatively, bearish forces could send the price to revisit its recent nine-month bottom of 0.5858. Diving below that territory, the pair could slide towards the 78.6% Fibo of 0.5730. A violation of that region could open the door for the September 2022 support of 0.5598.
Overall, NZDUSD is showing signs of life after a period of directionless trading. However, the bulls should not get excited unless the price clearly claims the 61.8% Fibo of 0.5902.
EURUSD Edges Higher, All Eyes on Fed Meeting
- EURUSD continues to exhibit low volatility ahead of today’s Fed meeting
- It tested the May 31 low and bounced higher but remains below the 1.0720 level
- Bearish sentiment lingers but the SMAs’ convergence points to an imminent strong move
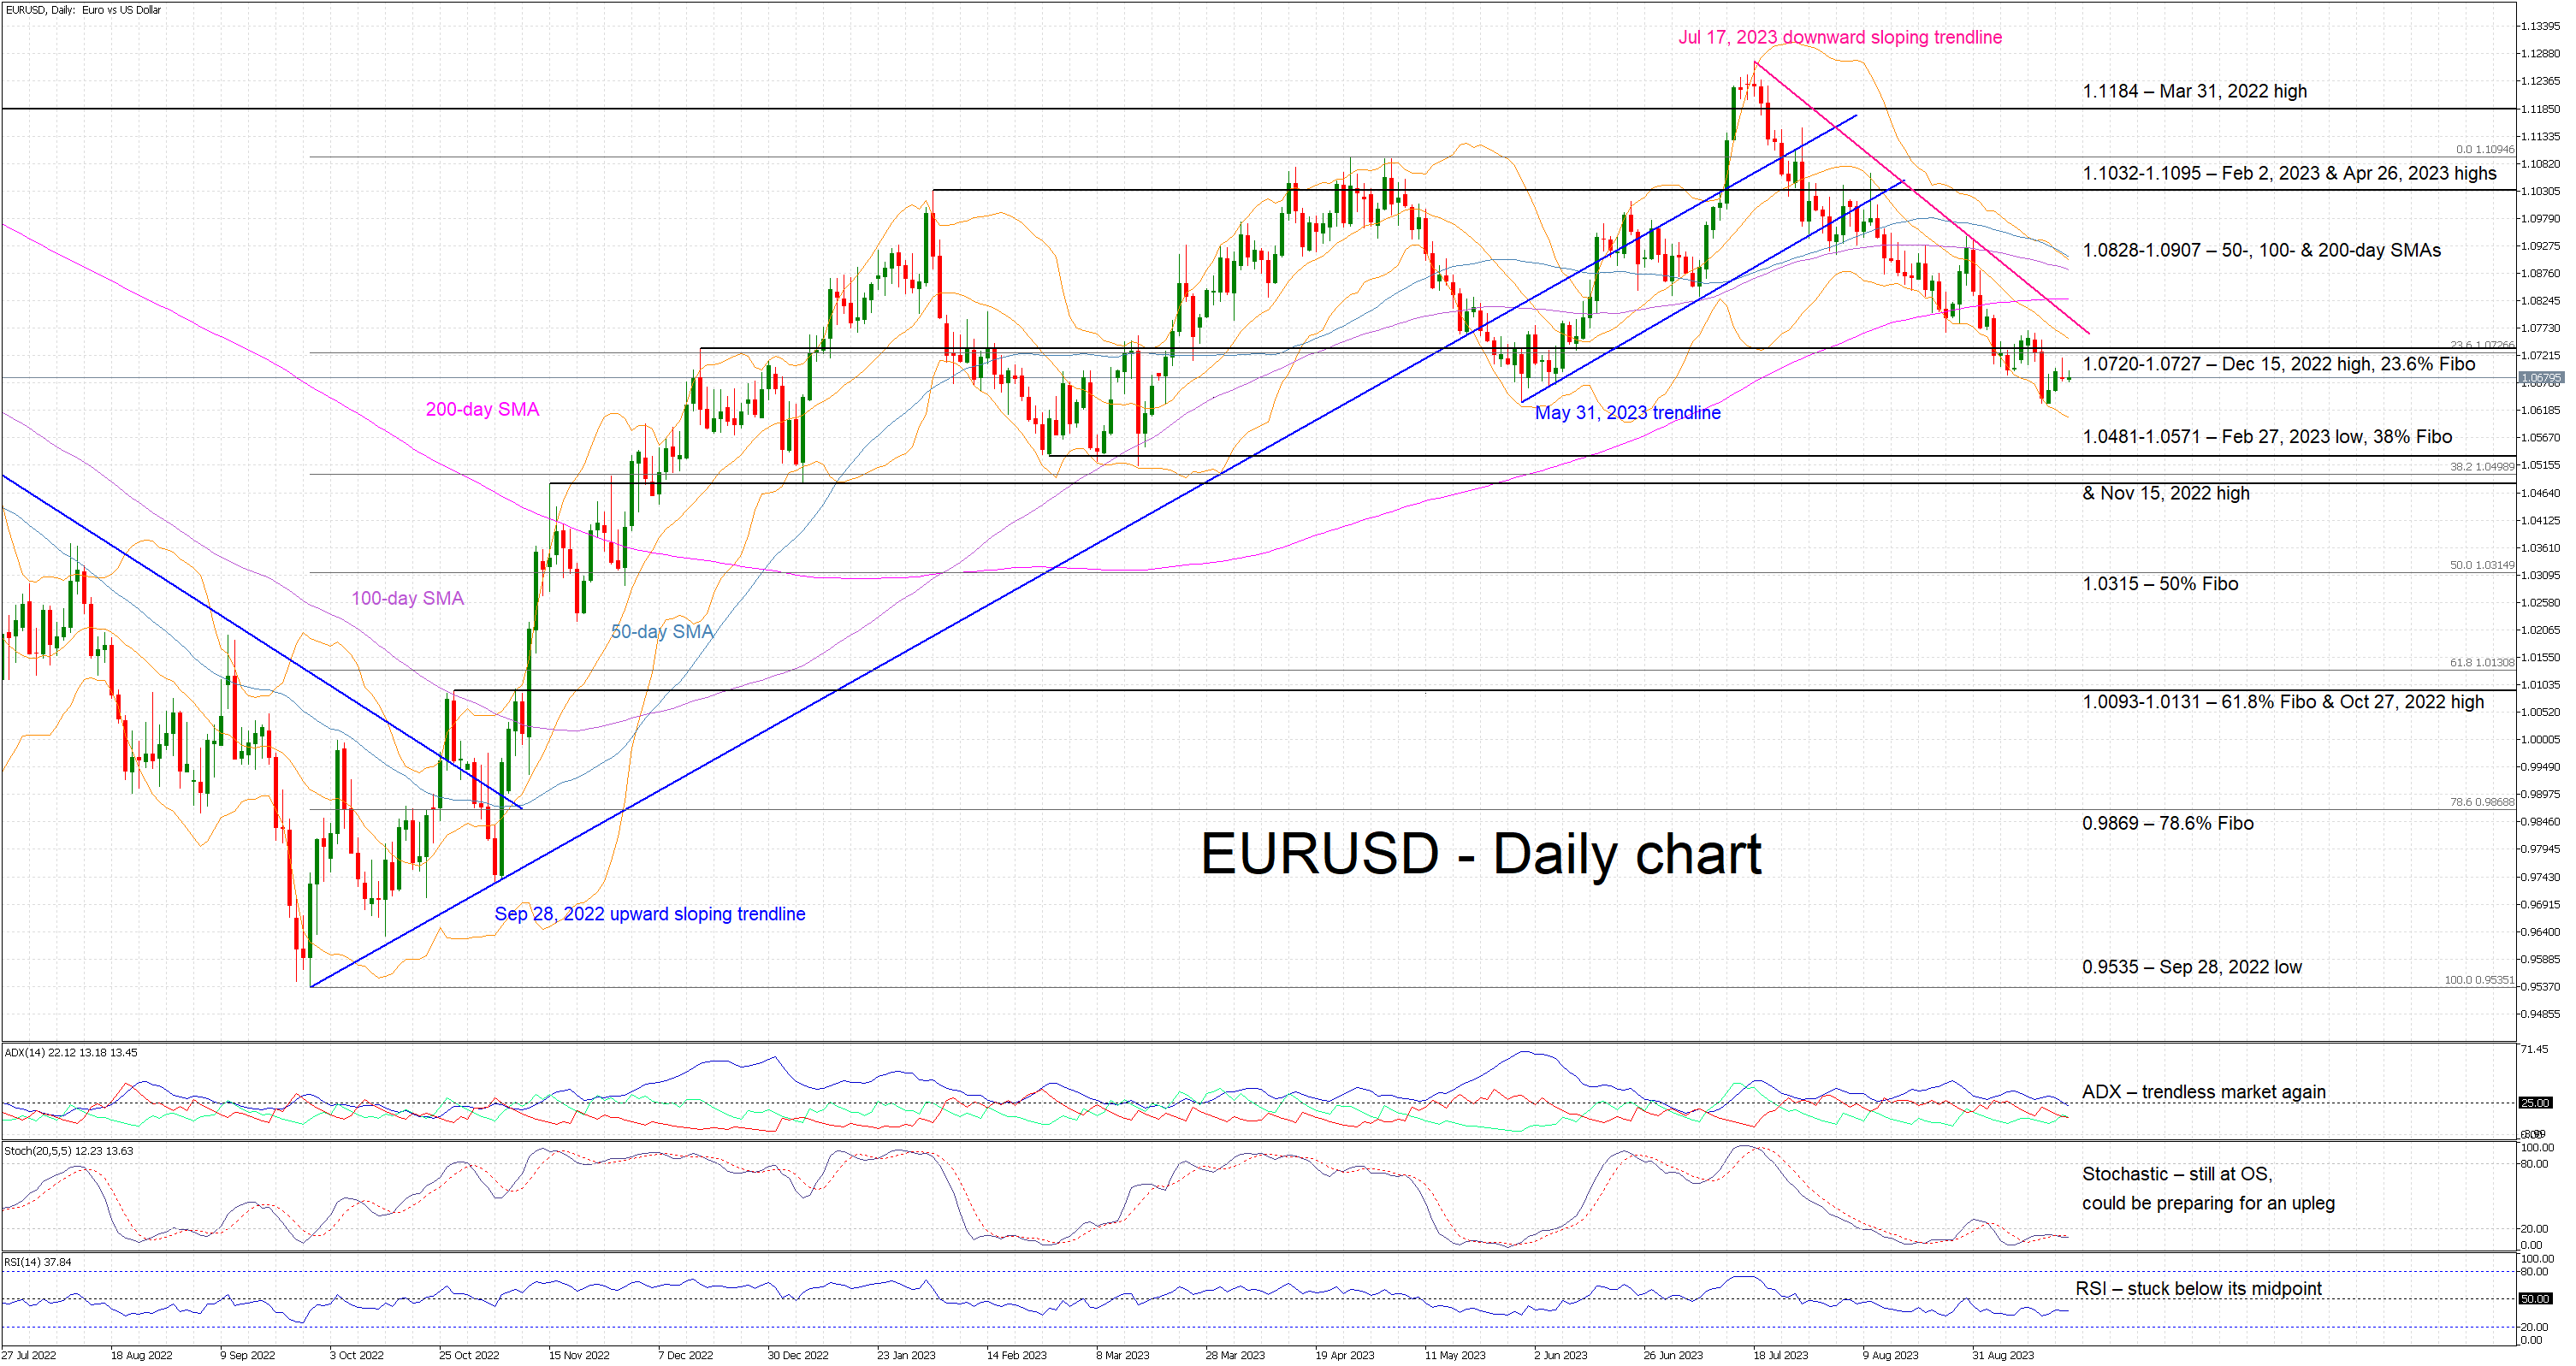
EURUSD is hovering below the 1.0720-1.0727 area as market participants are preparing for today’s significant Fed meeting. Its outcome and the overall tone of the accompanying press conference could determine the next leg in EURUSD. The bears are still in control since the July 17, 2023 trendline remains intact, supported also by the RSI trading below its 50-midpoint for a considerable amount of time.
However, the bulls are ready to jump the gun if they get the appropriate signal from the remaining momentum indicators. More specifically, the stochastic oscillator is trading in its oversold territory and hovering around moving average. A move above its 20 threshold and towards the August 31 local peak could be seen as a strong bullish signal. In the meantime, the Average Directional Movement Index (ADX) has dropped below its 25-threshold, pointing to a trendless EURUSD market and potentially preparing to signal the next trend.
Should the bulls feel energized to stage a short-term rally, they could try to overcome the busy 1.0720-1.0727 area and then test the resistance set by July 17, 2023 downward sloping trendline. Even higher, the 50-, 100- & 200-day simple moving averages (SMAs) in the 1.0828-1.0907 area could prove tougher to crack than currently envisaged.
On the flip side, the bears could take advantage of any short-term upleg and try to engineer a push towards the important 1.0481-1.0571 region, which is populated by the February 27, 2023 low, the November 15, 2022 high and the 38% Fibonacci retracement of the September 28, 2022 – April 26, 2023 uptrend. They could then have the chance of making a new 2023 low and potentially set their eyes on a bigger prize at the 1.0315 area.
To sum up, market participants are gearing up for today’s events with the SMAs’ convergence potentially pointing to a sizeable market reaction.
EUR/USD Faces Hurdles While USD/JPY Eyes Breakout
EUR/USD started a fresh decline below 1.0715. USD/JPY is rising and might climb further if it clears the 148.00 resistance zone.
Important Takeaways for EUR/USD and USD/JPY Analysis Today
- The Euro started a fresh decline below the 1.0715 support zone.
- There is a key bearish trend line forming with resistance near 1.0715 on the hourly chart of EUR/USD at FXOpen.
- USD/JPY climbed higher above the 147.20 and 147.50 levels.
- There is a connecting bullish trend line forming with support near 147.70 on the hourly chart at FXOpen.
EUR/USD Technical Analysis
On the hourly chart of EUR/USD at FXOpen, the pair started a fresh decline from the 1.0760 zone. The Euro declined below the 1.0715 support zone against the US Dollar.
The pair even settled below the 1.0680 zone and the 50-hour simple moving average. A low is formed near 1.0632 and the pair is now attempting a recovery wave above the 50% Fib retracement level of the downward move from the 1.0764 swing high to the 1.0632 low.
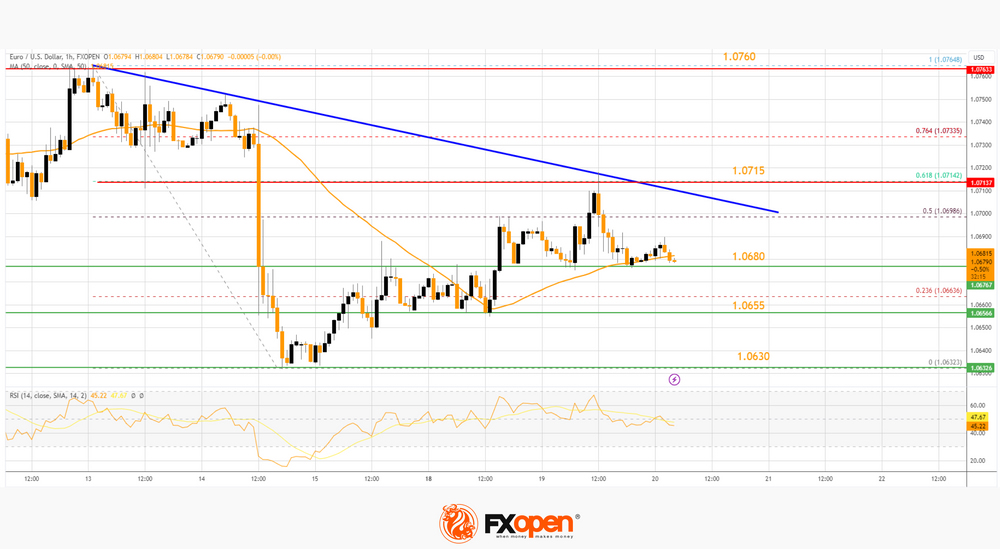
On the upside, the pair is now facing resistance near 1.0715 and a key bearish trend line. It is close to the 61.8% Fib retracement level of the downward move from the 1.0764 swing high to the 1.0632 low.
The next major resistance is near 1.0760. The main resistance is now near 1.0780. An upside break above 1.0780 could set the pace for another increase. In the stated case, the pair might rise toward 1.0840.
If not, the pair might resume its decline. The first major support on the EUR/USD chart is near 1.0680. The next key support is at 1.0655. If there is a downside break below 1.0655, the pair could drop toward 1.0630. The next support is near 1.0600, below which the pair could start a major decline.
USD/JPY Technical Analysis
On the hourly chart of USD/JPY at FXOpen, the pair started a decent increase from the 147.00 zone. The US Dollar gained bullish momentum above 147.50 against the Japanese Yen.
It settled above the 50-hour simple moving average and 147.70. A high is formed near 147.94 and the pair is now consolidating gains. On the downside, the first major support is near the trend line at 147.70 and the 50-hour simple moving average.
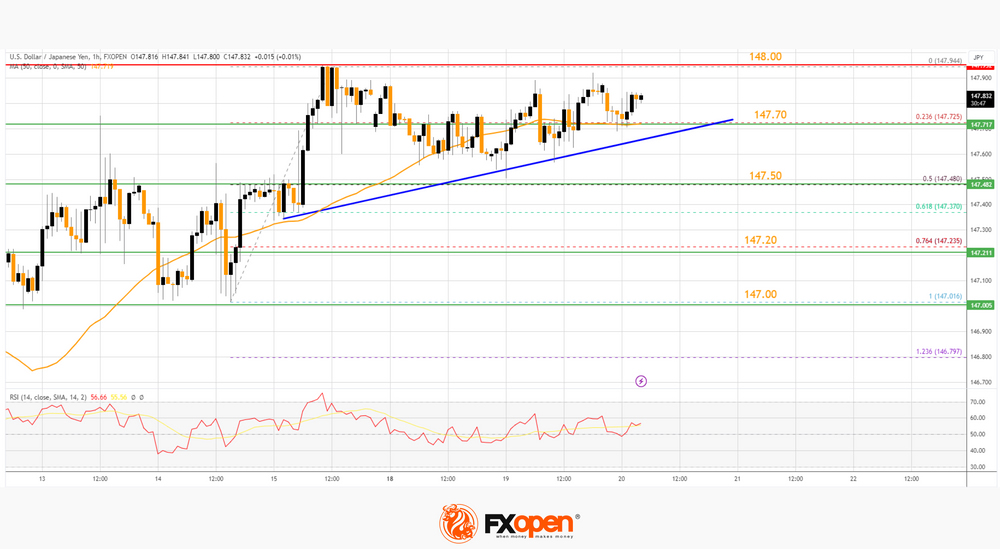
The trend line is close to the 23.6% Fib retracement level of the upward move from the 147.01 swing low to the 147.94 high. The next major support is near 147.50.
If there is a close below 147.50, the pair could decline steadily toward the 76.4% Fib retracement level of the upward move from the 147.01 swing low to the 147.94 high at 147.20. In the stated case, the pair might drop toward 147.00. The next major support sits at 146.20.
Immediate resistance on the USD/JPY chart is near 147.95. The first major resistance is near 148.00. If there is a close above the 148.00 level and the RSI moves above 60, the pair could rise toward 148.80. The next major resistance is near 149.20, above which the pair could test 150.00 in the coming days.
Trade global forex with the Innovative Broker of 2022*. Choose from 50+ forex markets 24/5. Open your FXOpen account now or learn more about trading forex with FXOpen.
* FXOpen International, Innovative Broker of 2022, according to the IAFT
This article represents the opinion of the Companies operating under the FXOpen brand only. It is not to be construed as an offer, solicitation, or recommendation with respect to products and services provided by the Companies operating under the FXOpen brand, nor is it to be considered financial advice.
Fresh Fed Signals May Jolt Markets
The FOMC is widely forecasted to leave its benchmark rates unchanged today. Fed Chair Powell is also expected to convey a hawkish hold, though such commentary unlikely to bring the US rates debate to a conclusive end.
Today's policy signals will feed into the market's ongoing obsession over the Fed policy outlook, and may well trigger heightened volatility across asset classes.
Global markets need a good reason to awake from their summer slumber, with the VIX currently near pre-pandemic lows while the JPMorgan Global FX volatility index remains near its lowest since prior to the Fed’s first rate hike of this cycle in March 2022.
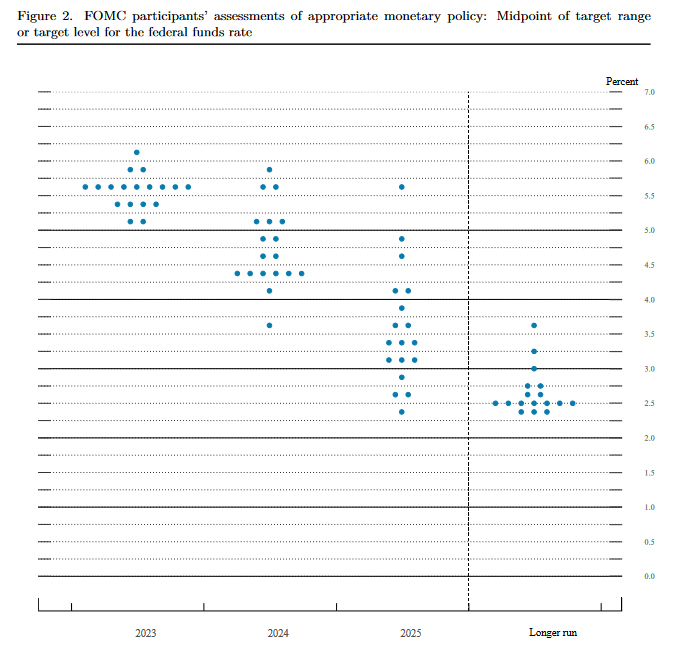
A rate hike shocker today, or an upward revision to the median dot plot, could trigger another leg up for the US dollar, and potentially drag gold and equities lower.
However, dovish surprises by way of Chair Powell declaring an end to the Fed's rate hike cycle, or even a lower median rate in the FOMC dot plot, could be deemed cause for short-term celebration for risk assets.
Fed to Deliver a Telegraphed, But Still Hawkish Skip
Markets
The recent build-up toward a hawkish Fed skip at today’s meeting resulted in an interesting technical positioning. US yields added another 6.2 (5-y) to 3.6 bps (2-y). This bring yields across the curve with striking distance of cycle peak levels. The 5-y and 10-y yield at 4.52% & 4.36% even temporarily hit a new top, reaching levels not since 2007. A higher real yield again was the main driven. It’s up to the Fed whether the market will continue a journey in ‘uncharted territory’, at least since before the financial crisis. Even after the ECB last week signaled a pause, the picture in the EMU, especially Bunds, isn’t that different. Yields also added between 3.5 bps (5-y) and 2.3 bps (30-y). Especially for longer maturities the peak levels from March are not that far away. Global bond investors continue to adapt positions for a period of policy rates to stay higher for longer, combined with an expected further reduction of global (excess) liquidity. Higher (real) core yields only had a modest negative impact on equities (S&P 500 -0.22%, EuroStoxx -0.07%). The picture for the dollar was fairly neutral. DXY closed (105.15) well off the intraday lows, but daily gains were negligible. EUR/USD failed to hold an early jumped north of 1.07 to close slightly in red at 1.0678. USD/JPY continues to challenge the 147.95 resistance, even as US Treasury Yellen indicated that any intervention in the yen aimed at smoothing volatility would be understandable. Brent oil after the recent run finally corrected back below $95 p/b (currently $93.5 p/b).
The Fed is expected to deliver a telegraphed, but still hawkish skip (5.25%/5.50% target range). However, with the decline in headline inflation at risk of slowing down, amongst others, due to a higher oil price and US economic growth holding up well, there is little reason for Fed governors to change the dot plot signalling an additional 25 bps step later this year. The higher for longer mantra might be reinforced by a further scaling back of rate cut expectations for end 2024 (4.6% in June). Fed governors also might raise their standing assessment on the 2.5% long term equilibrium rate. If so, it would be a clear confirmation that monetary policy has entered a new era. At the press conference, we don’t expected Fed Chair Powell to change its message from June in a profound way. From a bond market point of view, question is whether the tone of the Fed will be hawkish enough to force a break beyond recent cycle yield peak levels. At least the downside in yields should stay well protected. The dollar likely will stay in the drivers’ seat. We especially watch for a break higher in USD/JPY. For EUR/USD 1.0635/32 remains first reference. A strong dollar and the prospect on ongoing tighter global liquidity also gradually could put some more pressure on risky assets. Decision CET 20:00. Press Conference CET 20:30. Both UK headline (0.3% M/M; 6.7% Y/Y from 6.8%) and core inflation (6.2% vs 6.9% and 6.8% expected) this morning printed sharply lower than expected, fueling the debate on a pause within the BoE for tomorrow’s policy decision. Sterling tumbles with EUR/GBP at 0.8655 from 0.8320 before the release.
News and views
The Institute of International Finance published its quarterly debt monitor yesterday, titled “in search of sustainability”. Total debt (sovereigns, corporates and households) rose from $306.2tn in Q1 to $307.1tn in Q2, setting a new high. Total debt to GDP rose from 335% to 335.9% (vs 361.5% peak in Q1 2021). The lead author of the report, Tiftik, is concerned that countries will have to allocate more and more to interest expenses which will have long-term implications for countries’ funding costs and debt dynamics. He is especially concerned about a rise in interest expenses for local currency emerging market debt: “The traditional (debt restructuring) tools that we have are largely designed to address external debt vulnerabilities, leaving emerging markets in the middle of the vicious cycle of debt and inflation at the cost of a sharp decline in potential growth.”
Polish newswire PAP quoted National Bank of Poland governor Glapinski as saying: “After this adjustment, the room for further interest rate cuts has narrowed considerably, although it will continue to be there with incoming data”. Glapinski thus aligns with earlier comments from both government officials and other central bankers that the NBP needs to be careful with shocking rate cuts like the 75 bps move earlier this month as it leaves the Polish zloty extremely vulnerable. EUR/PLN surged from 4.45 to 4.70 in the aftermath of that decision. At the next October meeting – ahead of elections – a status quo or a max 25 bps rate cut is the likely outcome.
GBP/USD Daily Outlook
Daily Pivots: (S1) 1.2366; (P) 1.2396; (R1) 1.2421; More...
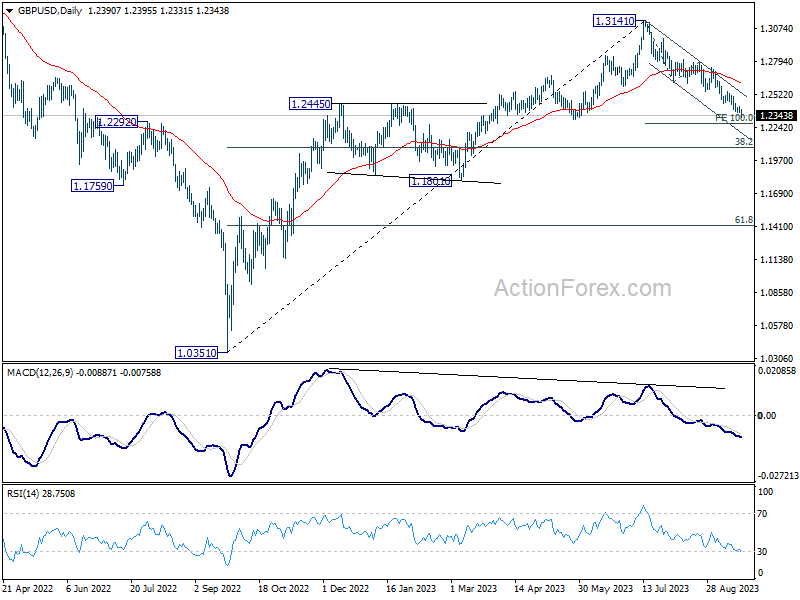
GBP/USD's fall resumed after brief consolidations and intraday bias is back on the downside. Current fall from 1.3141 should target 1.3141 to 100% projection of 1.3141 to 1.2618 from 1.2799 at 1.2276. Decisive break there will target 1.2075 fibonacci level next. On the upside, above above 1.2423 minor resistance will turn intraday bias neutral again. But near term outlook will stay bearish as long as 1.2618 support turned resistance holds, in case of strong recovery.
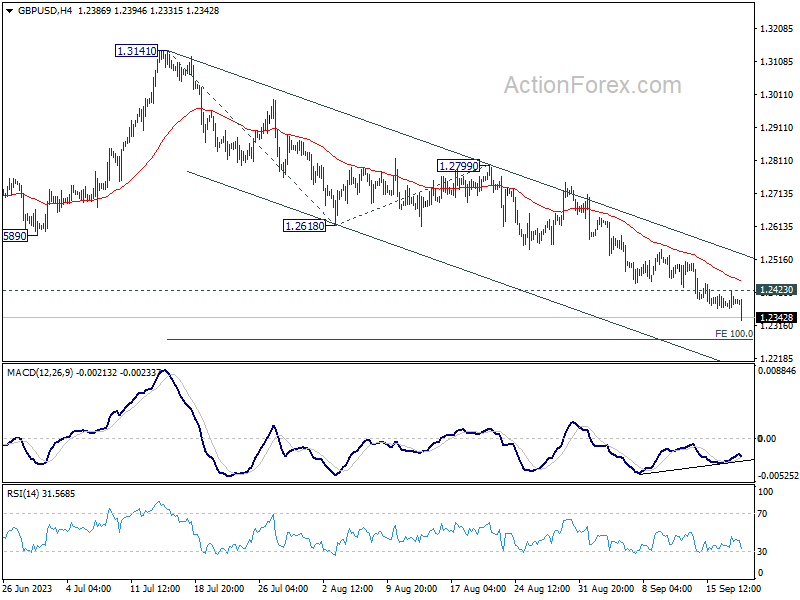
In the bigger picture, fall from 1.3141 medium term top is seen as a correction to up trend from 1.0351 (2022 low). Deeper decline would be seen to 38.2% retracement of 1.0351 to 1.3141 at 1.2075. Strong support would be seen there to bring rebound on first attempt. However, sustained break of 1.2075 will raise the chance of bearish trend reversal.
Sterling Takes a Hard Hit Following CPI; FOMC Dot Plot Awaited
Sterling finds itself under tremendous selling pressure following release of lower-than-anticipated headline and core CPI readings from the UK. This development is seen as a favorable turn of events for BoE policymakers, solidifying the anticipation that the rate hike expected to be announced tomorrow may be the last in the current cycle.
On the heels of the Pound, Canadian Dollar emerged as the second weakest, failing to sustain the momentum gained from yesterday's surge, which was propelled by robust Canadian inflation data. Meanwhile, Yen trails closely as the third weakest, with traders maintaining a cautious stance in the lead-up to BoJ decision slated for Friday. In contrast, Dollar, Euro, Swiss Franc, and Australian Dollar are exhibiting stability, with their trading ranges tightly bound against one another.
Market attention is shifting towards Fed's rate decision due later today. The new economic projections and the dot plot are expected to be the focal points of this announcement, giving investors critical insights into Fed policymakers' perspective on economic conditions and potential policy actions. Moreover, there has been a notable surge in US Treasury yields on the long end overnight, signalling the potential for further rallies should there be any hawkish surprises from Fed today.
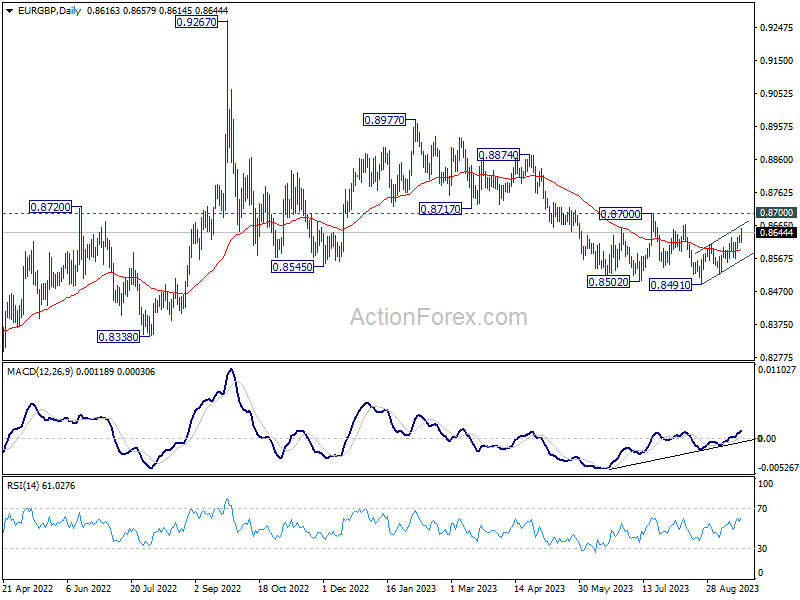
From a technical standpoint, Sterling's downturn today does not spell disaster yet. Despite the day's rally, EUR/GBP is still capped well below near-term resistance of 0.8700, maintaining neutral outlook at best for now. However, decisive break of 0.8700 will be a strong sign of medium bullish reversal, which would set up rally back towards 0.8977 resistance later in the rest of the year. BoE's decision tomorrow stands as a pivotal moment in determining the forthcoming trends.
In Asia, Nikkei closed down -0.66%. Hong Kong HSI is down -0.51%. China Shanghai SSE is down -0.51%. Singapore Strait Times is down -0.10%. Japan 10-year JGB yield rose 0.0054 to 0.724. Overnight, DOW dropped -0.31%. S&P 500 dropped -0.22%. NASDAQ dropped -0.23%. 10-year yield rose 0.046 to 4.365.
UK CPI slowed to 6.7%, BoE's hike tomorrow could be the last
Sterling is facing headwinds after release of UK's CPI inflation data, which came in lower than market forecasts. This development strengthens the speculation that BoE might be drawing curtains on its tightening cycle, with the one more hike expected tomorrow potentially being the concluding move.
The reported data illustrated deceleration in CPI from of 6.8% yoy to 6.7% yoy in August, a result that fell short of the projected escalation to 7.1% yoy. This is the lowest rate witnessed since February 2022.
A deeper dive into the components reveals that this softening of annual CPI into August 2023 emerged from six out of the 12 sectors. Notably, restaurants and hotels, along with food and non-alcoholic beverages, played a pivotal role in pulling down the numbers. However, the motor fuels category within the transport sector exerted upward pressure, somewhat counterbalancing the decline.
Furthermore, core CPI, which is calculated by excluding variables such as energy, food, alcohol, and tobacco, followed suit, decelerating from 6.9% yoy to 6.2% yoy. This stands significantly below anticipated rate of 6.8% yoy.
Breaking it down further, while CPI goods noted a slight acceleration from 6.1% yoy to 6.3% yoy, CPI services delineated a slowdown from 7.4% yoy to 6.8% yoy.
For the month. CPI rose 0.3% mom, below expectation of 0.7% mom.
Japan's exports to China tumble further, trade with US flourishes
Japan's economic data shows a dwindling momentum in the country's export sector, registering a decline of -0.8% yoy to JPY 7994B in August, with a particularly notable decrease in its trading activities with China.
The continued dip in exports is largely attributed to diminishing overseas demand and the trade restrictions imposed by China, which have significantly impacted Japan's trade balance.
A striking example is seen in the sharp -11.0% yoy decline in exports to China, to a total of JPY 1.44T. This downturn marks the third consecutive month of double-digit drops in export activities to China, severely affected by the -41.2% yoy plunge in food exports due to China's ban on Japanese seafood.
However, a beacon of positivity trading rapport with US, which saw a growth spurt of 5.1% yoy, aggregating to a record JPY 1.62T for the month of August. This surge has been primarily fueled by a heightened demand for Japanese cars, mining, and construction machinery.
On the import front, Japan noted a considerable -17.8% yoy reduction to JPY 8925B, with imports from China dipping -12.1% to JPY 1.93T, and those from US falling -9.5% yoy to JPY 967.39B. The nation's trade balance has consequently been reported at a deficit of JPY -930.5B.
When analyzed in seasonally adjusted terms, both exports and imports showcase a month-on-month decrease, registering -1.7% mom to JPY 8267.8B and -2.1% mom to JPY 8823.6B, respectively. Thankfully, there is a silver lining as the trade deficit has slightly narrowed compared to the previous month, standing at JPY -555.7B.
Australia Westpac leading index edged up to -0.5%, growth struggles despite population boom
Westpac Leading Index for Australia indicates that the nation's growth outlook remains subdued. The index inched up marginally from -0.56% to -0.50% in August, marking a year since it began registering negative readings. These figures suggest that the prospect of per capita GDP advancing in the coming 3–9 months appears bleak.
Westpac's forecasts for the next year resonate with the index's gloomy narrative, anticipating an economic growth of less than 1% for the year leading up to June 2024. Interestingly, there's a potential silver lining: with predictions pointing to population growth surpassing 2% in 2023, this could introduce some upside risks to the otherwise somber economic projections.
However, despite this population surge, the economy is projected to trail behind, as evident from the March and June quarter results. Both quarters witnessed a contraction of -0.3% in GDP per capita, a pattern that's predicted to persist in the forthcoming year.
Regarding next RBA rate decision on October 3, Westpac said it's "almost certain to hold rates steady for another month". The crucial data for the next move would be September quarter inflation report, which will not be available until the November RBA meeting.
BoC Kozicki speaks on recent swings in inflation
BoC Deputy Governor Sharon Kozicki acknowledged in a speech that CPI inflation has seen "ups and downs of the size we've seen in the past couple of months," highlighting a decrease from a high of 8.1% in June 2022 to 2.8% in June this year. However, this decrease was followed by a surge to 3.3% in July and 4.0% in August (as released yesterday). Despite this decrease and subsequent rise, she affirmed that such fluctuations are "not that unusual."
She emphasized the Bank's approach to monitoring inflation, which includes a focus on measures of core inflation that exclude more volatile price movement components to get a true sense of underlying inflation.
"Measures of core inflation have eased," she noted, yet underlined that "inflationary pressures are still broad-based." She continued to express concern over the number of CPI components with price increases exceeding 5%, which, despite being lower than before, remains "much higher than it usually is when inflation is stable and close to 2%."
Acknowledging that "underlying inflation is still well above the level that would be consistent with achieving our target of 2% CPI inflation," Kozicki emphasized the Bank's commitment to continuous evaluation of several factors such as "the evolution of excess demand, inflation expectations, wage growth and corporate price-setting behaviour" to ensure alignment with the 2% inflation target.
To maintain economic stability amidst the dynamic inflationary environment, Kozicki emphasized that the Bank is "prepared to raise the policy interest rate further if needed."
US treasury yields hit 16-Year peaks as markets await Fed's insights
As anticipation builds around Fed impending monetary policy decision today, US 5- and 10-year Treasury yields surged to levels not seen in 16 years. With market expectations firming around a hold in the range of 5.25-5.50% – a forecast that has been in place for over a month – the possibility of any shock moves by the Fed is remote.
Nevertheless, investors will keenly dissect any subtle hints from Fed that might suggest another rate hike this year, or provide clues about the timing and speed of monetary easing in 2024. The forthcoming "dot plot" will be of particular significance.
To recall, in their June meeting, 12 out of 18 policymakers envisioned at least one more rate hike in the calendar year. 10 anticipated interest rates to fall back to 4.50-4.75% by the close of 2024. The evolving position of these dots is bound to sculpt market sentiments for the forthcoming months.
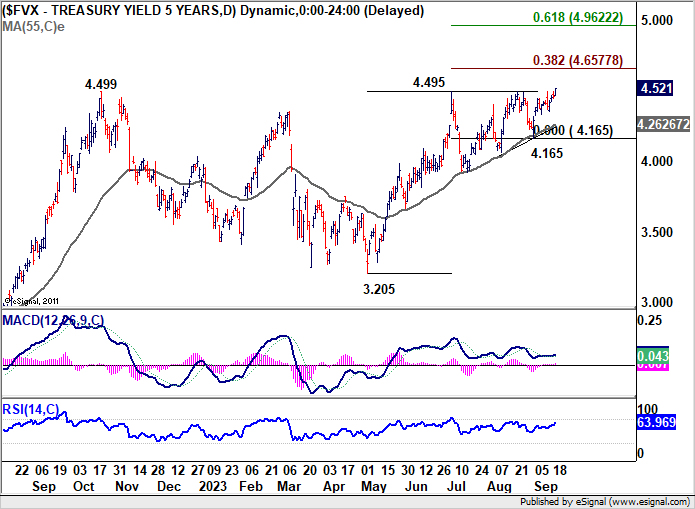
Five-year yield exhibited a strong close overnight, at an unmatched zenith since 2007, recording a 4.521. This surge found an ally in the WTI crude oil, which leaped, touching the 93-mark.
On the technical front, FVX looks ready to resume is long term up trend to finally get rid of resistance zone at around 4.5. The next hurdle is 38.2% projection of 3.205 to 4.495 from 4.165 at 4.657.
Any upside surprises in today's Fed inflation projections could potentially steer FVX towards the 4.657 projection level. Yet, surpassing this level might necessitate a sustained WTI oil rally, breaking the 95 mark and advancing towards 100.
GBP/USD Daily Outlook
Daily Pivots: (S1) 1.2366; (P) 1.2396; (R1) 1.2421; More...
GBP/USD's fall resumed after brief consolidations and intraday bias is back on the downside. Current fall from 1.3141 should target 1.3141 to 100% projection of 1.3141 to 1.2618 from 1.2799 at 1.2276. Decisive break there will target 1.2075 fibonacci level next. On the upside, above above 1.2423 minor resistance will turn intraday bias neutral again. But near term outlook will stay bearish as long as 1.2618 support turned resistance holds, in case of strong recovery.
In the bigger picture, fall from 1.3141 medium term top is seen as a correction to up trend from 1.0351 (2022 low). Deeper decline would be seen to 38.2% retracement of 1.0351 to 1.3141 at 1.2075. Strong support would be seen there to bring rebound on first attempt. However, sustained break of 1.2075 will raise the chance of bearish trend reversal.
Economic Indicators Update
| GMT | Ccy | Events | Actual | Forecast | Previous | Revised |
|---|---|---|---|---|---|---|
| 22:45 | NZD | Current Account (NZD) Q2 | -4.21B | -4.40B | -5.22B | -4.66B |
| 23:50 | JPY | Trade Balance (JPY) Aug | -0.56T | -0.44T | -0.56T | -0.60T |
| 00:30 | AUD | Westpac Leading Index M/M Aug | 0.00% | 0.00% | ||
| 06:00 | EUR | Germany PPI M/M Aug | 0.30% | 0.20% | -1.10% | |
| 06:00 | EUR | Germany PPI Y/Y Aug | -12.60% | -12.80% | -6.00% | |
| 06:00 | GBP | CPI M/M Aug | 0.30% | 0.70% | -0.40% | |
| 06:00 | GBP | CPI Y/Y Aug | 6.70% | 7.10% | 6.80% | |
| 06:00 | GBP | Core CPI Y/Y Aug | 6.20% | 6.80% | 6.90% | |
| 06:00 | GBP | RPI M/M Aug | 0.60% | 0.90% | -0.60% | |
| 06:00 | GBP | RPI Y/Y Aug | 9.10% | 9.30% | 9.00% | |
| 06:00 | GBP | PPI Input M/M Aug | 0.40% | 0.20% | -0.40% | |
| 06:00 | GBP | PPI Input Y/Y Aug | -2.30% | -2.70% | -3.30% | -3.20% |
| 06:00 | GBP | PPI Output M/M Aug | 0.20% | 0.20% | 0.10% | 0.20% |
| 06:00 | GBP | PPI Output Y/Y Aug | -0.40% | -0.80% | -0.70% | |
| 06:00 | GBP | PPI Core Output M/M Aug | -0.10% | 0.10% | ||
| 06:00 | GBP | PPI Core Output Y/Y Aug | 1.60% | 2.30% | 2.20% | |
| 07:00 | CHF | SECO Economic Forecasts | ||||
| 14:30 | USD | Crude Oil Inventories | -1.3M | 4.0M | ||
| 18:00 | USD | Fed Rate Decision | 5.50% | 5.50% | ||
| 18:30 | USD | FOMC Press Conference |