Sample Category Title
USD/CHF Mid-Day Outlook
Daily Pivots: (S1) 0.8956; (P) 0.8970; (R1) 0.8993; More....
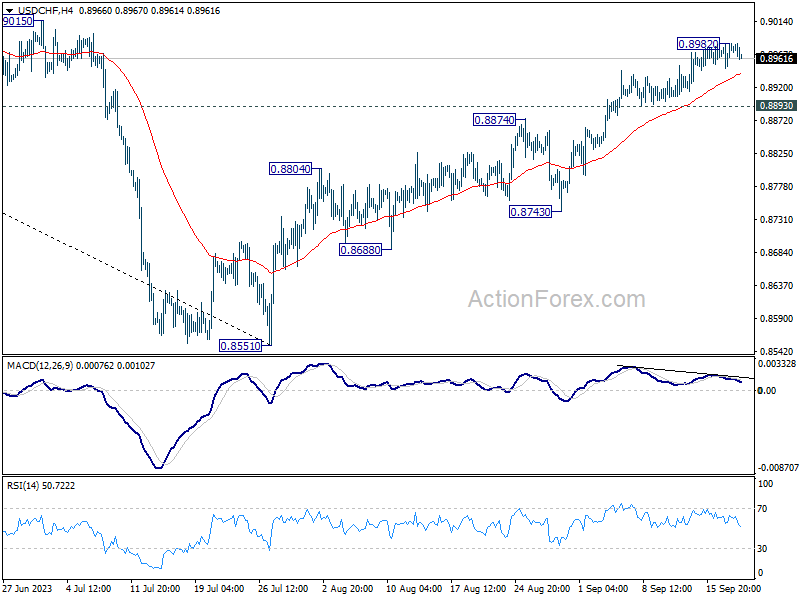
USD/CHF is staying in consolidation from 0.8982 and intraday bias remains neutral. Further rally is expected as long as 0.8893 support holds. Above 0.8982 will resume the rally from 0.8551 to 0.9146 cluster resistance. However, firm break of 0.8893 will argue that a short term top is possibly formed, and turn bias back to the downside for 55 D EMA (now at 0.8858).
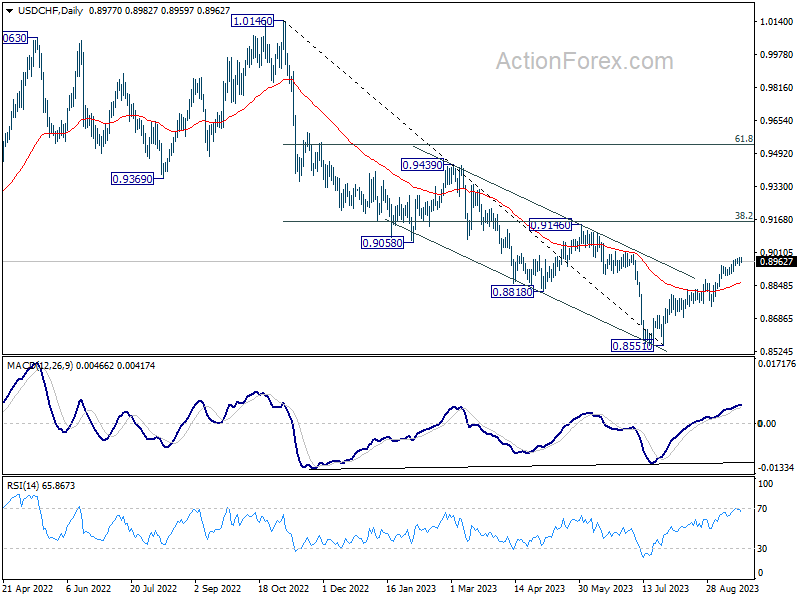
In the bigger picture, rebound from 0.8551 medium term bottom is currently seen as a correction to the downtrend from 1.0146 (2022 high). Further rally would be seen to 0.9146 cluster resistance (38.2% retracement of 1.0146 to 0.8551 at 0.9160). Strong resistance could be seen there to limit upside, at least on first attempt.
GBP/USD Mid-Day Outlook
Daily Pivots: (S1) 1.2366; (P) 1.2396; (R1) 1.2421; More...
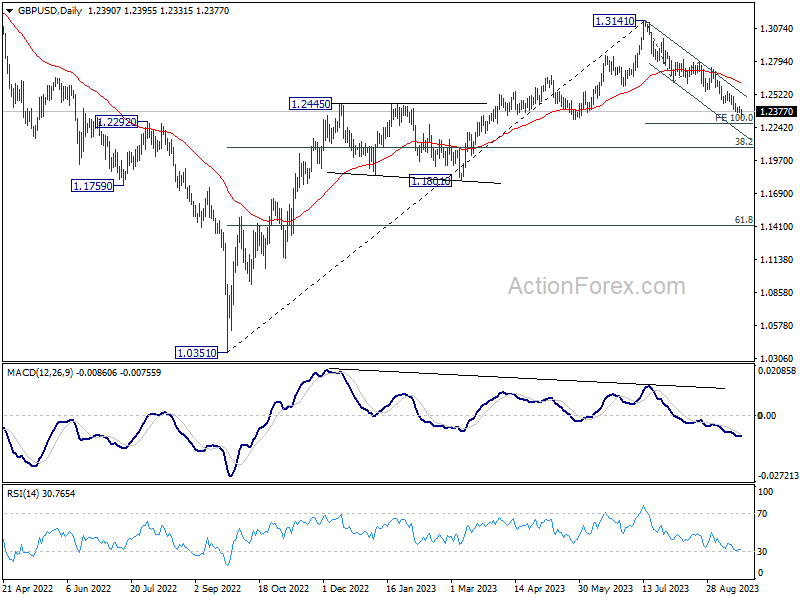
Intraday bias in GBP/USD stays on the downside for the moment. Current fall from 1.3141 should target 1.3141 to 100% projection of 1.3141 to 1.2618 from 1.2799 at 1.2276. Decisive break there will target 1.2075 fibonacci level next. On the upside, above above 1.2423 minor resistance will turn intraday bias neutral again. But near term outlook will stay bearish as long as 1.2618 support turned resistance holds, in case of strong recovery.
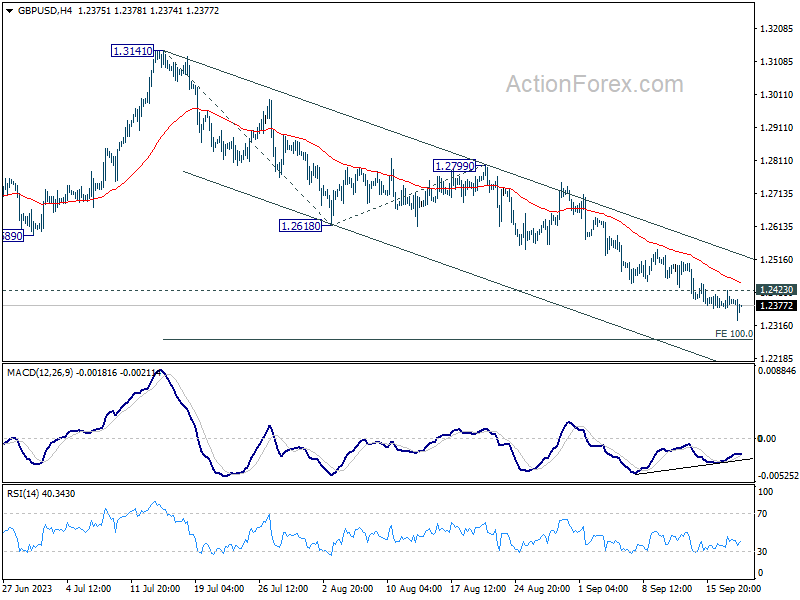
In the bigger picture, fall from 1.3141 medium term top is seen as a correction to up trend from 1.0351 (2022 low). Deeper decline would be seen to 38.2% retracement of 1.0351 to 1.3141 at 1.2075. Strong support would be seen there to bring rebound on first attempt. However, sustained break of 1.2075 will raise the chance of bearish trend reversal.
EUR/USD Mid-Day Outlook
Daily Pivots: (S1) 1.0663; (P) 1.0691; (R1) 1.0706; More...
EUR/USD is still bounded in established range and intraday bias remains neutral. Strong rebound from current level, followed by break of 1.0767 resistance, should confirm short term bottoming. Intraday bias will be back on the upside for 1.0944 resistance. However, sustained break of 1.0609/34 support zone will carry larger bearish implication, and target 1.0515 support next.
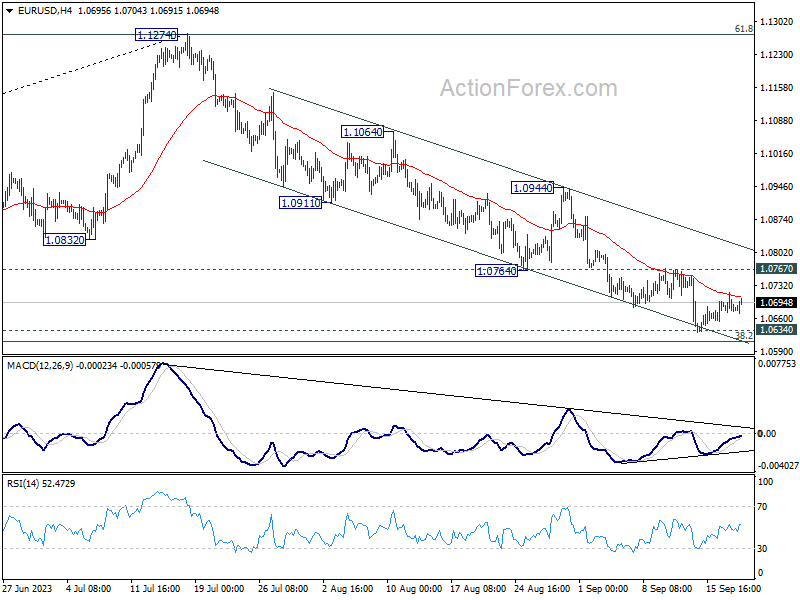
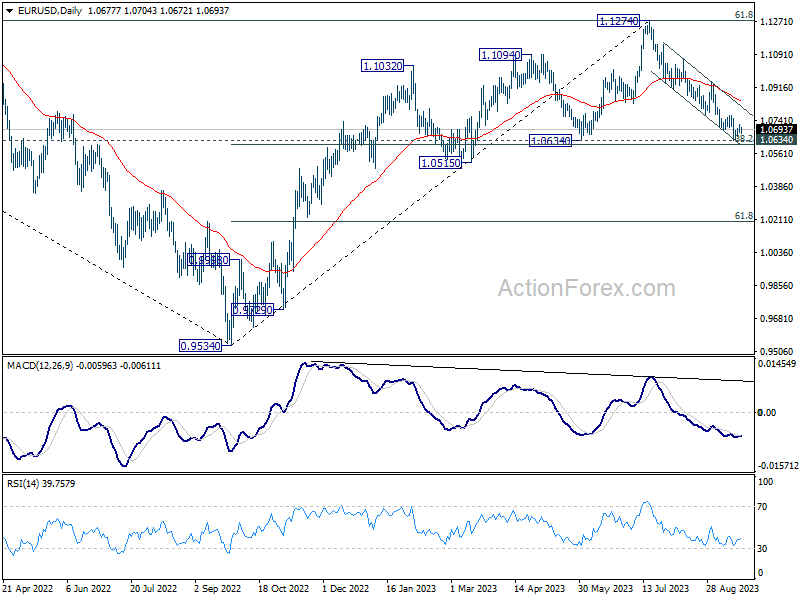
In the bigger picture, fall from 1.1274 medium term top is seen as a correction to up trend from 0.9534 (2022 low). Strong support could be seen from 1.0634 cluster support (38.2% retracement of 0.9534 to 1.1274 at 1.0609) to bring rebound, at least on first attempt. However, sustained break of 1.0609/0634 will raise the chance of bearish trend reversal, and target 61.8% retracement at 1.0199.
FOMC Rate Decision Looms, Dollar Softens Slightly
Dollar is slightly softer today as the financial world holds its breath for FOMC rate decision. With the market strongly anticipating a hold, eyes will turn to the dot plot for insights. The pivotal question remains: Will there be hints of another rate hike slated for this year? Furthermore, how the dot plot for 2024 maps out the anticipated timeline and pace of rate cuts will be under close observation. Complementing the dot plot, growth and inflation projections will offer a clearer lens on Fed's viewpoint.
Across the pond, Sterling has taken a hit, emerging as the day's weakest performer in the wake of weaker than expected consumer inflation figures. This has led the market to rapidly adjust its expectations, with the possibility of a BoE rate hike tomorrow now seeming less likely. Current swap-market data places this chance at under 50%. Historically, however, BoE's voting in tight situations has been unpredictable. Regardless of the outcome, the consensus is that UK interest rates will probably reach their upper limit post the decision.
Elsewhere in the currency markets, Australian Dollar stands out as the top performer, closely trailed by New Zealand Dollar and then Euro. Canadian Dollar's position is mixed, with Japanese Yen and Swiss Franc trailing behind as weaker contenders.
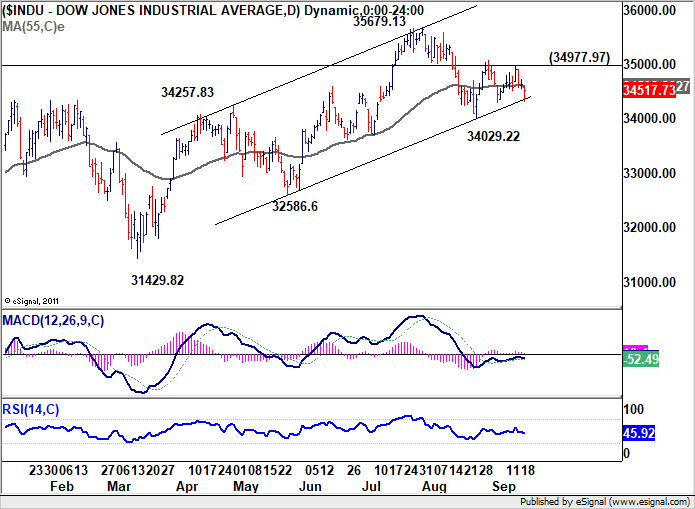
Looking at the technical aspects, investor sentiment toward Fed's decision and projections would be significantly illuminated by DOW's performance. To confirm a positive reception, DOW would need to convincingly break 34977.97 resistance level. Should this occur, it would suggest that the corrective fall from 35679.13 has concluded, paving the way for resumption of the larger uptrend. Conversely, should 34029.22 support threshold be breached, it would signify a more negative investor sentiment. As is customary, the direction of Dollar will likely move inversely to market risk sentiment.
In Europe, at the time of writing, FTSE is up 0.77%. DAX is up 0.60%. CAC is up 0.52%. Germany 10-year yield is down -0.016 at 2.726. Earlier in Asia, Nikkei dropped -0.66%. Hong Kong HSI dropped -0.62%. China Shanghai SSE dropped -0.52%. Japan 10-year JGB yield rose 0.0064 to 0.725.
Swiss SECO downgrades 2024 growth forecast, raises inflation
In the update to Swiss State Secretariat for Economic Affairs economic forecasts, a marginal upgrade has been bestowed upon Switzerland's 2023 GDP outlook, leveraging the robust performance in the first quarter. The forecast, adjusted for sporting events, now stands at 1.3%, a slight increase from the 1.1% predicted in June.
Despite this adjustment, outlook for 2024 has experienced a cut, settling at 1.2% as opposed to the earlier estimation of 1.5%. This renders the prospects for economic growth considerably below-average for both 2023 and 2024.
Shifting focus to CPI forecasts, the estimation for 2023 have been marginally trimmed down to 2.2%, a -0.1% decrease from June forecast. Conversely, 2024 projection experiences a hike, ascending from 1.5% to 1.9%.
SECO points towards substantial economic risks looming on the horizon. A pressing concern is the international persistence of inflation. The panorama of economic challenges also encompasses escalating risks tied to the global debt scenario fluctuations in property and financial markets. Monetary policy transmission could also be stronger than assumed.
Furthermore, the evolving situations in Germany and China emerge as potent risk factors, not just for the global economy but significantly impacting Swiss foreign trade.
UK CPI slowed to 6.7%, BoE's hike tomorrow could be the last
Sterling is facing headwinds after release of UK's CPI inflation data, which came in lower than market forecasts. This development strengthens the speculation that BoE might be drawing curtains on its tightening cycle, with the one more hike expected tomorrow potentially being the concluding move.
The reported data illustrated deceleration in CPI from of 6.8% yoy to 6.7% yoy in August, a result that fell short of the projected escalation to 7.1% yoy. This is the lowest rate witnessed since February 2022.
A deeper dive into the components reveals that this softening of annual CPI into August 2023 emerged from six out of the 12 sectors. Notably, restaurants and hotels, along with food and non-alcoholic beverages, played a pivotal role in pulling down the numbers. However, the motor fuels category within the transport sector exerted upward pressure, somewhat counterbalancing the decline.
Furthermore, core CPI, which is calculated by excluding variables such as energy, food, alcohol, and tobacco, followed suit, decelerating from 6.9% yoy to 6.2% yoy. This stands significantly below anticipated rate of 6.8% yoy.
Breaking it down further, while CPI goods noted a slight acceleration from 6.1% yoy to 6.3% yoy, CPI services delineated a slowdown from 7.4% yoy to 6.8% yoy.
For the month. CPI rose 0.3% mom, below expectation of 0.7% mom.
Japan's exports to China tumble further, trade with US flourishes
Japan's economic data shows a dwindling momentum in the country's export sector, registering a decline of -0.8% yoy to JPY 7994B in August, with a particularly notable decrease in its trading activities with China.
The continued dip in exports is largely attributed to diminishing overseas demand and the trade restrictions imposed by China, which have significantly impacted Japan's trade balance.
A striking example is seen in the sharp -11.0% yoy decline in exports to China, to a total of JPY 1.44T. This downturn marks the third consecutive month of double-digit drops in export activities to China, severely affected by the -41.2% yoy plunge in food exports due to China's ban on Japanese seafood.
However, a beacon of positivity trading rapport with US, which saw a growth spurt of 5.1% yoy, aggregating to a record JPY 1.62T for the month of August. This surge has been primarily fueled by a heightened demand for Japanese cars, mining, and construction machinery.
On the import front, Japan noted a considerable -17.8% yoy reduction to JPY 8925B, with imports from China dipping -12.1% to JPY 1.93T, and those from US falling -9.5% yoy to JPY 967.39B. The nation's trade balance has consequently been reported at a deficit of JPY -930.5B.
When analyzed in seasonally adjusted terms, both exports and imports showcase a month-on-month decrease, registering -1.7% mom to JPY 8267.8B and -2.1% mom to JPY 8823.6B, respectively. Thankfully, there is a silver lining as the trade deficit has slightly narrowed compared to the previous month, standing at JPY -555.7B.
Australia Westpac leading index edged up to -0.5%, growth struggles despite population boom
Westpac Leading Index for Australia indicates that the nation's growth outlook remains subdued. The index inched up marginally from -0.56% to -0.50% in August, marking a year since it began registering negative readings. These figures suggest that the prospect of per capita GDP advancing in the coming 3–9 months appears bleak.
Westpac's forecasts for the next year resonate with the index's gloomy narrative, anticipating an economic growth of less than 1% for the year leading up to June 2024. Interestingly, there's a potential silver lining: with predictions pointing to population growth surpassing 2% in 2023, this could introduce some upside risks to the otherwise somber economic projections.
However, despite this population surge, the economy is projected to trail behind, as evident from the March and June quarter results. Both quarters witnessed a contraction of -0.3% in GDP per capita, a pattern that's predicted to persist in the forthcoming year.
Regarding next RBA rate decision on October 3, Westpac said it's "almost certain to hold rates steady for another month". The crucial data for the next move would be September quarter inflation report, which will not be available until the November RBA meeting.
EUR/USD Mid-Day Outlook
Daily Pivots: (S1) 1.0663; (P) 1.0691; (R1) 1.0706; More...
EUR/USD is still bounded in established range and intraday bias remains neutral. Strong rebound from current level, followed by break of 1.0767 resistance, should confirm short term bottoming. Intraday bias will be back on the upside for 1.0944 resistance. However, sustained break of 1.0609/34 support zone will carry larger bearish implication, and target 1.0515 support next.
In the bigger picture, fall from 1.1274 medium term top is seen as a correction to up trend from 0.9534 (2022 low). Strong support could be seen from 1.0634 cluster support (38.2% retracement of 0.9534 to 1.1274 at 1.0609) to bring rebound, at least on first attempt. However, sustained break of 1.0609/0634 will raise the chance of bearish trend reversal, and target 61.8% retracement at 1.0199.
Economic Indicators Update
| GMT | Ccy | Events | Actual | Forecast | Previous | Revised |
|---|---|---|---|---|---|---|
| 22:45 | NZD | Current Account (NZD) Q2 | -4.21B | -4.40B | -5.22B | -4.66B |
| 23:50 | JPY | Trade Balance (JPY) Aug | -0.56T | -0.44T | -0.56T | -0.60T |
| 00:30 | AUD | Westpac Leading Index M/M Aug | 0.00% | 0.00% | ||
| 06:00 | EUR | Germany PPI M/M Aug | 0.30% | 0.20% | -1.10% | |
| 06:00 | EUR | Germany PPI Y/Y Aug | -12.60% | -12.80% | -6.00% | |
| 06:00 | GBP | CPI M/M Aug | 0.30% | 0.70% | -0.40% | |
| 06:00 | GBP | CPI Y/Y Aug | 6.70% | 7.10% | 6.80% | |
| 06:00 | GBP | Core CPI Y/Y Aug | 6.20% | 6.80% | 6.90% | |
| 06:00 | GBP | RPI M/M Aug | 0.60% | 0.90% | -0.60% | |
| 06:00 | GBP | RPI Y/Y Aug | 9.10% | 9.30% | 9.00% | |
| 06:00 | GBP | PPI Input M/M Aug | 0.40% | 0.20% | -0.40% | |
| 06:00 | GBP | PPI Input Y/Y Aug | -2.30% | -2.70% | -3.30% | -3.20% |
| 06:00 | GBP | PPI Output M/M Aug | 0.20% | 0.20% | 0.10% | 0.20% |
| 06:00 | GBP | PPI Output Y/Y Aug | -0.40% | -0.80% | -0.70% | |
| 06:00 | GBP | PPI Core Output M/M Aug | -0.10% | 0.10% | ||
| 06:00 | GBP | PPI Core Output Y/Y Aug | 1.60% | 2.30% | 2.20% | |
| 07:00 | CHF | SECO Economic Forecasts | ||||
| 14:30 | USD | Crude Oil Inventories | -1.3M | 4.0M | ||
| 18:00 | USD | Fed Rate Decision | 5.50% | 5.50% | ||
| 18:30 | USD | FOMC Press Conference |
WTI Oil: Oil Price Eases from New 2023 High Ahead of Fed
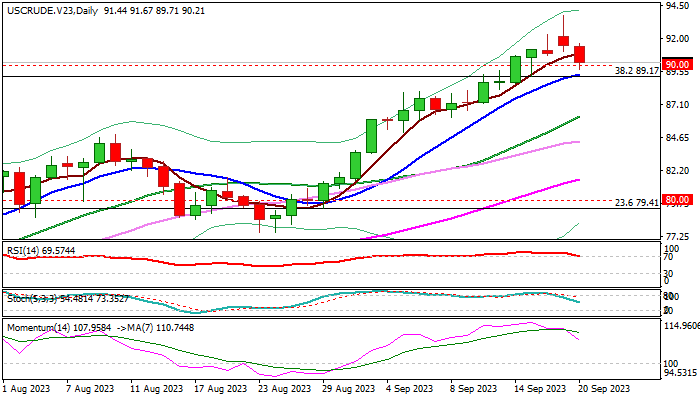
WTI oil price extends pullback from new 2023 high ($93.71) into second consecutive day (down around 2% in Asian / European trading today) as traders partially collected profits and positioning for the Fed policy decision.
Overall picture remains bullish, with the price being underpinned by tighter supply (Saudi Arabia and Russia extended production cut until the end of the year) and brightening demand outlook, as China’s economic recovery gains traction.
Traders look for more details about the US economic growth outlook and its subsequent reflection on demand, which will contribute to oil’s near-term direction signals.
The Fed is widely expected to stay on hold this time, with focus to be on the central bank’s projections for the policy path in coming months, as well as signals whether the US economy is heading towards soft or hard landing.
Technical indicators on daily chart also point to correction (fading bullish momentum / RSI emerging from overbought territory) though larger picture is bullish and suggesting limited correction before bulls resume.
Broken psychological $90 resistance (reinforced by daily Tenkan-sen) and $89.17 (broken Fibo 38.2% of $130.48/$63.63) reverted to solid supports which should ideally contain dips.
In such scenario, bulls could be revived quickly for fresh push towards pivotal barriers at $93.71 / $94.00 (Sep 19 high / top of thick weekly cloud), violation of which would spark stronger rally.
Initial warning on loss of $89.17 support, but increased downside risk to be expected od drop and close below $87.56 (Fibo 38.2% of $77.60/$93.71 bull-leg).
Res: 91.67; 92.32; 93.71; 94.00.
Sup: 89.71; 89.17; 88.27; 87.56.
GBP/USD: Falls on Softer than Expected UK Inflation Data
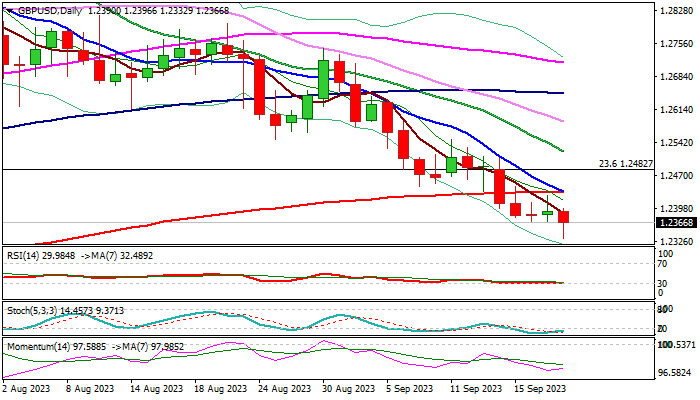
Cable fell to new multi-month low (the lowest since May 26) early Tuesday, hit by softer than expected UK inflation readings in August.
Annualized CPI dropped to 6.7% (the lowest since Feb 2022) from 6.8% in July and beating forecast for 7.0% increase, while core inflation (excluding volatile components) was down to 6.2% y/y in August, compared to 6.8% forecast and 6.9% previous month.
Although inflation remains high (over three times above 2% target) August data bring some optimism and provides relief to the Bank of England which was widely expected to raise interest rates for the 15th consecutive time in a policy meeting on Thursday, as bets now stand at 50-50 chance for staying on hold this time.
However, there is a risk of fresh increase in inflationary pressure, as oil and food prices continue to rise, maintaining inflationary pressure and keeping in play risk of further policy tightening.
Technical picture on daily chart is bearish (bear-cross 5/200DMA’s / strong negative momentum) but oversold conditions produce headwinds as the price is approaching key short-term support at 1.2307 (May 25 trough).
Upticks should be capped by broken 200DMA (1.2432) to keep larger bears intact for attack at 1.2307 pivot, break of which would open way for deeper correction of a larger 1.0348/1.3141 uptrend and expose targets at 1.2074 (Fibo 38.2% of 1.0348/1.3141) and 1.2000 (psychological).
Conversely, sustained break above 200DMA would signal stronger correction, with lift above pivotal 1.2500 zone to generate initial signal of reversal.
Market await Fed’s verdict (due later today and expected to stay on hold) and more significant decision of the Bank of England on Thursday.
Sterling is likely to come under fresh pressure if BoE pauses this time, while bulls may gain traction if the central bank opts for another rate hike and keeps hawkish stance.
Res: 1.2432; 1.2482; 1.2504; 1.2522.
Sup: 1.2332; 1.2307; 1.2274; 1.2190.
USDJPY Struggles to Break Past 148.00 Despite Bullish Momentum
- 148.00 barrier proving difficult to overcome
- Still plenty of upside to achieve a break higher
- But bullish bias is showing signs of abating
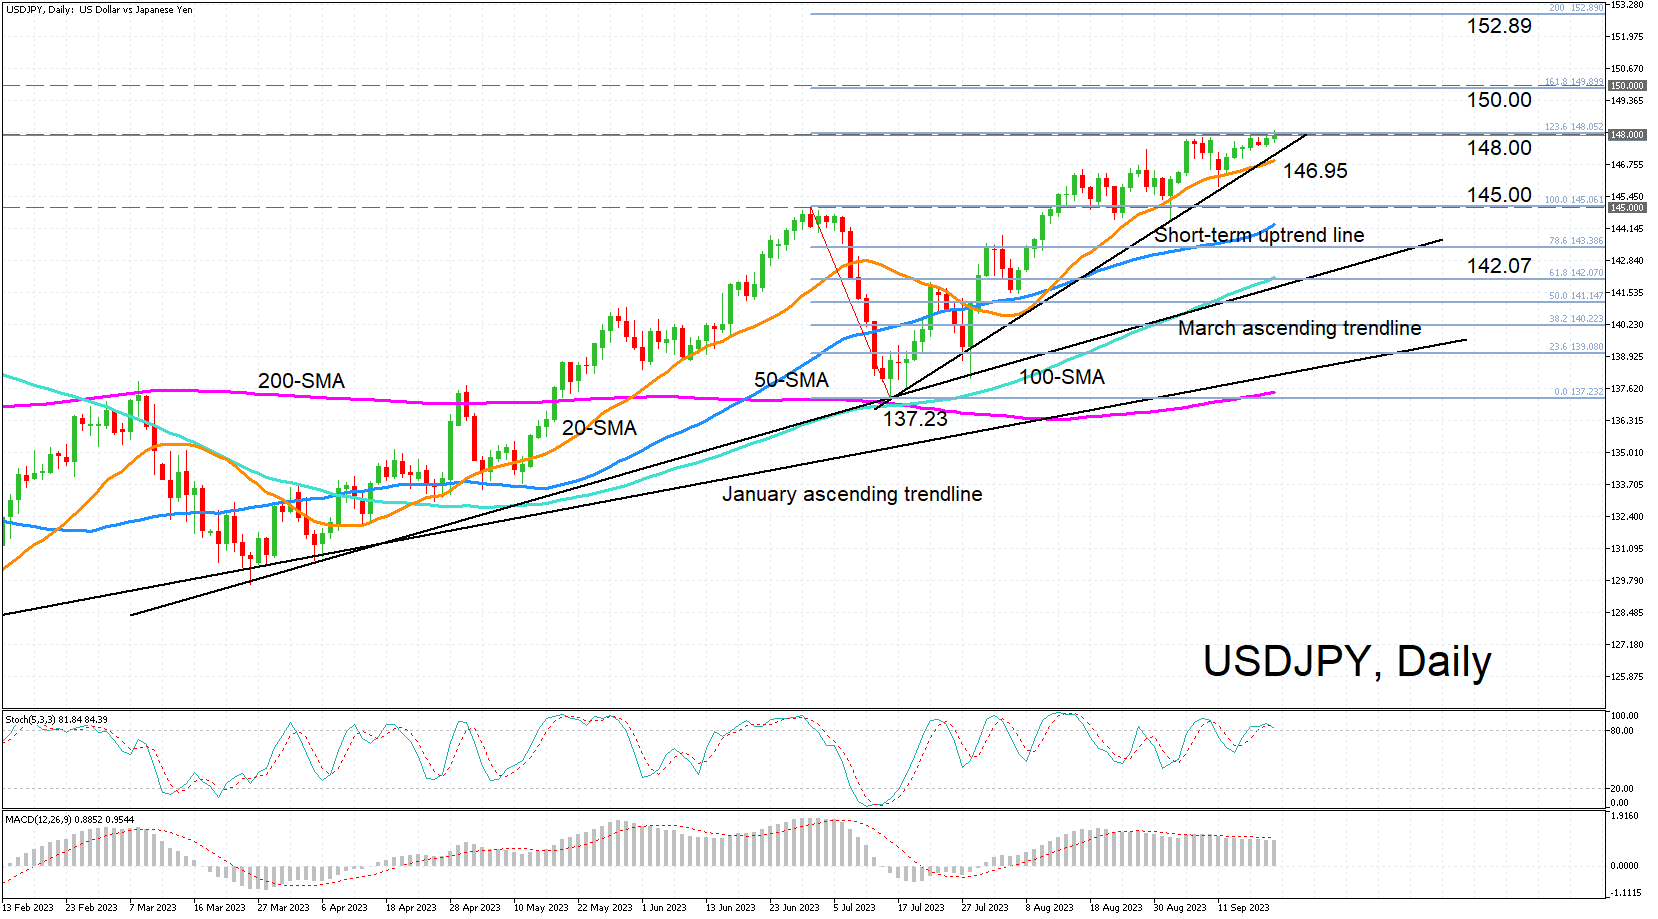
USDJPY has been knocking on the door of the 148.00 handle for the past couple of weeks but to no avail. It’s made somewhat more progress today, crawling slightly above that level. However, whilst the technical indicators remain positive, momentum does appear to be easing.
The stochastic oscillator has flatlined inside the overbought region, suggesting a possible near-term correction is on the cards. The MACD on the other hand has been in a very gentle decline over the past week or so after it failed to rise above its red signal line, in a further indication that the upside forces are weakening.
Should USDJPY make a convincing break above 148.00, the bulls might then aim for crucial 150.00 zone that contains the 161.8% Fibonacci extension level of the July downleg at 149.90. Higher up, the 200% Fibo of 152.89 would likely come into focus.
However, if the 148.00 resistance holds, the pair could initially fall back to the 20-day simple moving average (SMA) at 146.95 before retreating towards the 145.00 level where prices peaked at the end of June. Steeper losses could see the pair head for the 100-day SMA in the 142.00 region, which is positively aligned with the ascending trendline taken from the March low. Even lower, the price could slip until the July trough of 137.23, which is within close proximity of the 200-day SMA.
To sum up, USDJPY could yet succeed in clearing the 148 hurdle, reinforcing the long-term uptrend. But should it come under selling pressure, the uptrend is secure as long as the price holds above the shallower ascending trendline taken from the January low.
Bitcoin Shy to Rise Before the Fed
Market picture
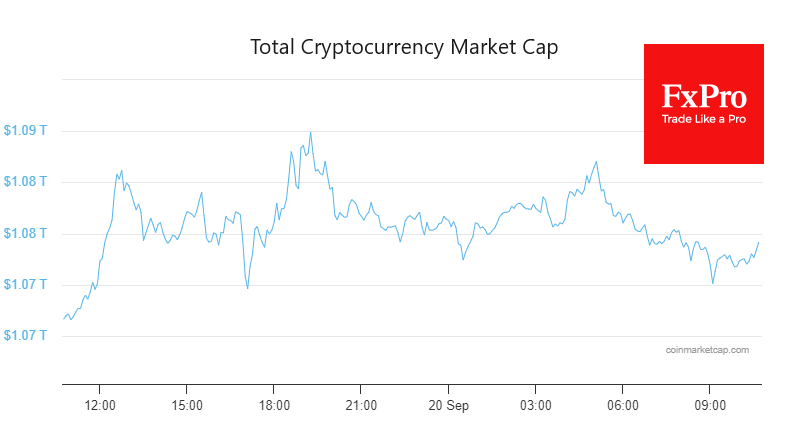
The crypto market has been trading around 1.08 trillion over the last day. The trading range is narrowing as the Fed decision approaches. However, it is worth highlighting the pressure on the markets early on Wednesday and the intensification of cryptocurrency selling as the cap rises towards 1.09 trillion.
Bitcoin encountered resistance at $27.4K. Attempts to break above the 50-day moving average for the third day met strong resistance. All financial markets have taken a wait-and-see approach ahead of monetary policy decisions in the US, Switzerland, the UK, and Japan.
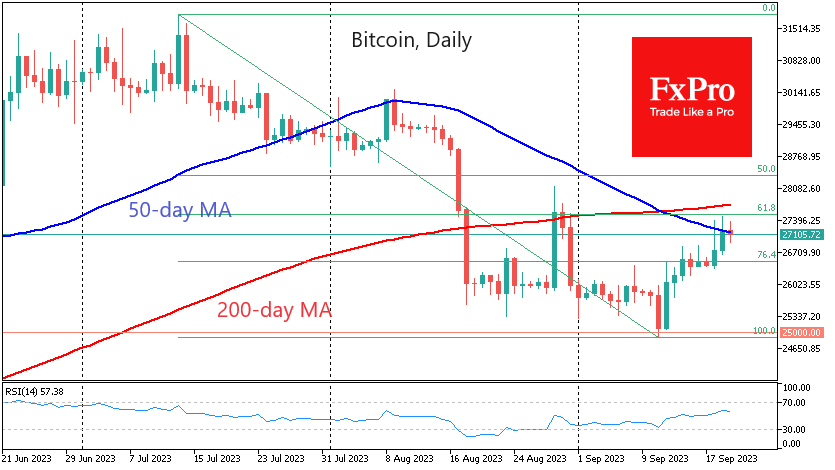
The situation for Bitcoin is bearish if one looks solely at the technical picture on the chart. The corrective bounce in BTC is formally over; the price has fallen below the moving averages, and the short-term oversold condition is complete.
In another recalculation, bitcoin’s mining difficulty rose 5.48% to 57.12 T. According to Glassnode, the smoothed 7-day moving average hit a high of 423.4 EH/s.
News background
According to K33, trading volumes on the Binance exchange fell by 57% over the week. Users are moving to other trading platforms that have not yet been subject to regulatory crackdowns.
The court declined to order Binance’s US unit to provide the SEC with more information about handling customer funds. Instead, the district judge urged the two sides to work together.
SEC Commissioner Esther Pierce urged cryptocurrency companies not to leave the US. She said she was frustrated by the agency’s reluctance to clarify cryptocurrency regulation.
Massive applications to launch spot bitcoin ETFs are revitalising the crypto market and could be a catalyst for bitcoin’s growth, Matrixport believes. BTC’s cryptocurrency market dominance is approaching 50 per cent and is set to grow.
Laser Digital Asset Management, a subsidiary of Japan’s largest investment firm, Nomura, launched a Bitcoin fund for long-term institutional investment.
Citigroup launches Citi Token for business-to-business payments and trade finance based on blockchain technology and smart contracts.
CAD/JPY Coming Higher Out of Projected Bullish Triangle Pattern
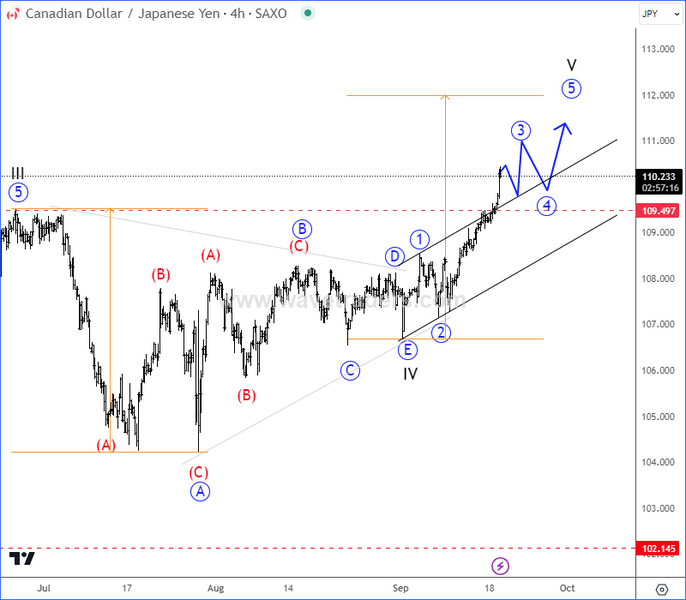
CADJPY was trading sideways for the last couple of months, where we were tracking a bullish triangle pattern within higher degree wave IV before a bullish continuation for wave V. On september 04, we have spotted a completion of a bullish triangle pattern, as subwave E of IV found the support with a spike.

As you can see today on September 20, CADJPY is breaking yearly highs for a higher degree wave V as expected and there can be room for more upside within that projected five-wave cycle for a higher degree wave V towards 111 – 112 area, just be aware of short-term wave 4 pullback.
EUR/GBP Daily Outlook
Daily Pivots: (S1) 0.8610; (P) 0.8622; (R1) 0.8645; More...
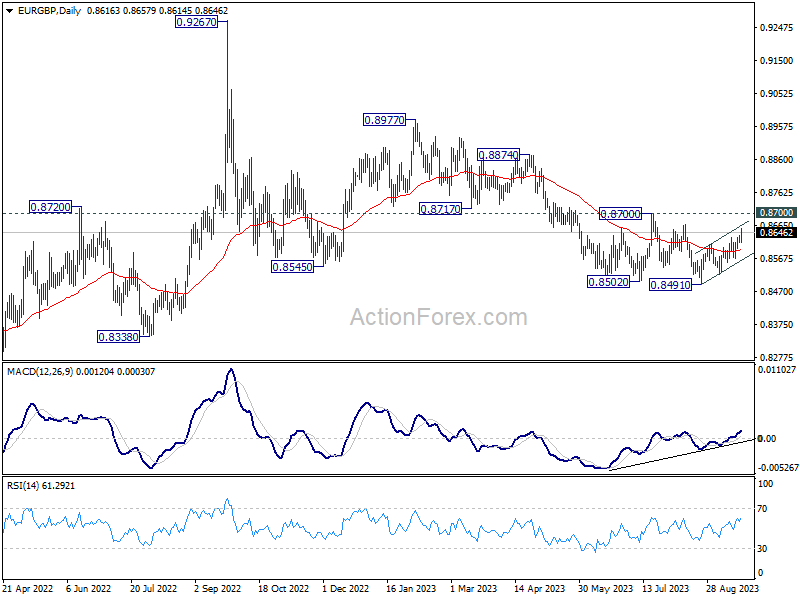
Intraday bias in EUR/GBP stays on the upside as rise from 0.8491 extends higher today. While further rally could be seen, this rise is seen as the third leg of the corrective pattern from 0.8502. Upside should be limited by 0.8667/8700 resistance zone. On the downside, below 0.8614 minor support will turn intraday bias neutral first. Further break of 0.8568 support will turn bias back to the downside for retesting 0.8491 low.
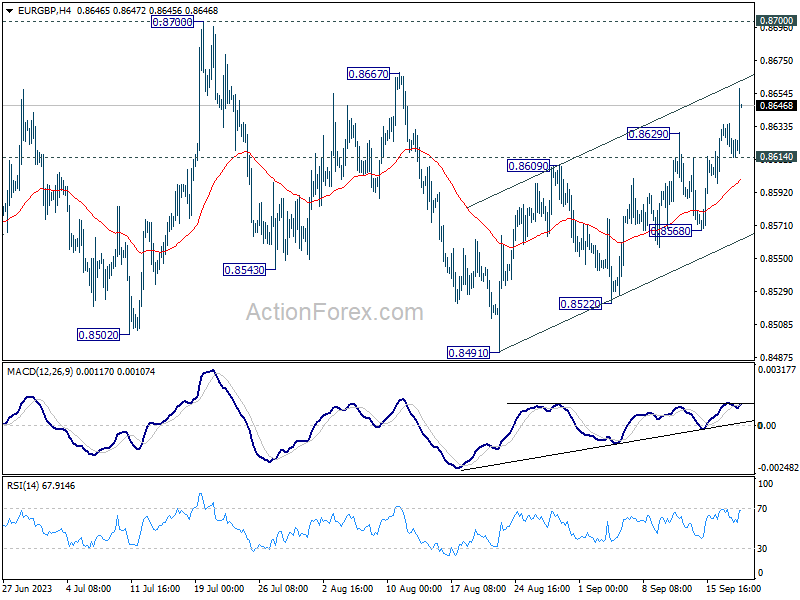
In the bigger picture, the down trend from 0.9267 (2022 high) is seen as part of the long term range pattern from 0.9499 (2020 high). Fall from 0.8977 is seen as the third leg. As long as 0.8700 resistance holds, further decline is still expected. Break of 0.8491 will resume the fall towards 0.8201 (2022 low). Nevertheless, firm break of 0.8700 will now be a sign of bullish reversal.