

Sample Category Title
UK CPI slowed to 6.7%, BoE’s hike tomorrow could be the last
Sterling is facing headwinds after release of UK's CPI inflation data, which came in lower than market forecasts. This development strengthens the speculation that BoE might be drawing curtains on its tightening cycle, with the one more hike expected tomorrow potentially being the concluding move.
The reported data illustrated deceleration in CPI from of 6.8% yoy to 6.7% yoy in August, a result that fell short of the projected escalation to 7.1% yoy. This is the lowest rate witnessed since February 2022.
A deeper dive into the components reveals that this softening of annual CPI into August 2023 emerged from six out of the 12 sectors. Notably, restaurants and hotels, along with food and non-alcoholic beverages, played a pivotal role in pulling down the numbers. However, the motor fuels category within the transport sector exerted upward pressure, somewhat counterbalancing the decline.
Furthermore, core CPI, which is calculated by excluding variables such as energy, food, alcohol, and tobacco, followed suit, decelerating from 6.9% yoy to 6.2% yoy. This stands significantly below anticipated rate of 6.8% yoy.
Breaking it down further, while CPI goods noted a slight acceleration from 6.1% yoy to 6.3% yoy, CPI services delineated a slowdown from 7.4% yoy to 6.8% yoy.
For the month. CPI rose 0.3% mom in August, below expectation of 0.7% mom.
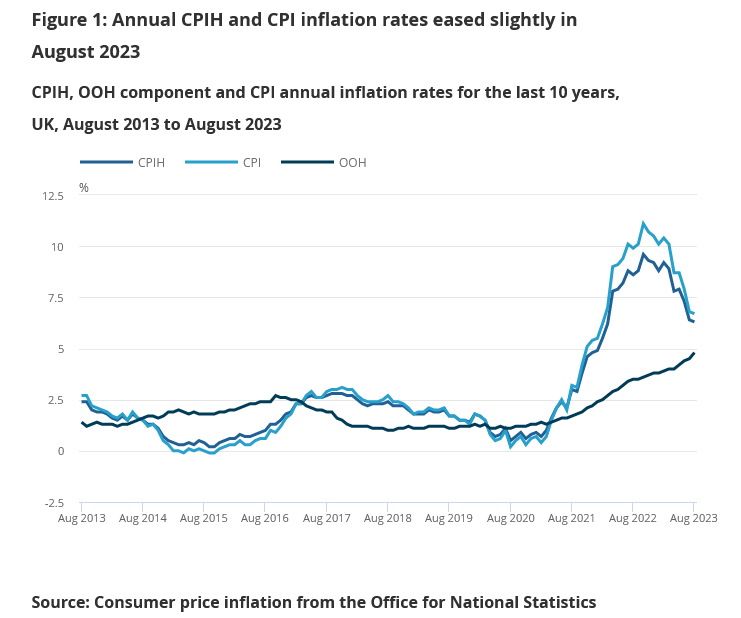
British Inflation Unexpectedly Falls
Freshly out of the oven this morning, the British inflation unexpectedly eased from 6.8% to 6.7% in August, core inflation fell from 6.9% to 6.2%. The surprise fall in UK inflation triggered a kneejerk selloff in sterling, as today’s data cements the expectation that the Bank of England’s (BoE) next rate hike could also be its last.
Everyone be quiet, Fed is speaking
Later today, the Federal Reserve (Fed) will announce its latest policy decision and reveal revised growth and inflation forecasts.
The Fed is broadly expected to keep the interest rates unchanged; the policymakers will likely sound satisfied with the progress on inflation, and they could revise their growth forecasts significantly higher. Strong growth forecast could trigger a fresh wave of hawkish trades across stock, bond, and currency markets.
But the latest projections should be taken with a pinch of salt, given that the Fed has been utterly wrong about its projections both for inflation, unemployment, and growth. It said inflation would be transitory, it was not. It said growth will slow, it did not. It said the labour market should weaken, the US labour market remains – magically – strong, Americans continue spending, and growth is resilient. So maybe - they think - it’s time to revise that forecast. But if they did that, they will be wrong once again, because underneath the shiny picture, the US savings are melting, the credit card delinquencies are rising, student debt repayments will start in October – that should put some pressure on spending, hence on growth, then the Detroit strikes threaten to further destabilize growth. Even though we don’t talk much about the banks, net share of banks that said to have tightened standards for commercial and industrial loans rose to the toughest levels since the 2008 GFC, if we don’t count the pandemic times, and the current levels are said to be consistent with recession. The 2-10-year portion of the US yield curve remains heavily inverted. The same is true for the 3-month to 10-year portion of the US yield curve. These inversions cry recession, as they have been good at predicting recessions in the past. And the OECD now forecasts that the world economy will grow 2.7% next year – at the slowest pace since Covid – due to Chinese worries, but also corporations that should pick a side in a world that has been torn apart by the war in Ukraine. And the US cannot do well just by itself.
All this to say that even if the Fed revises its growth forecast higher today, they may not even achieve a soft landing as they pretend that they will. Worse, they may not even achieve their inflation goal, because unfortunately, energy prices have a great influence on overall inflation.
The dot plot will likely show a median expectation of one more rate hike before this year ends, and a higher median rate throughout next year. And that’s enough to bring the Fed hawks back to the market. If that’s the case, we shall see the US dollar index strengthen further. Watch the 105.40 level, the major 38.2% Fibonacci retracement on the dollar’s meltdown since September last year. A move above that level could mark the end of the US dollar’s bearish trend and open the door of a medium-term bullish consolidation zone.
All Eyes on FOMC Dot Plot
Market movers today
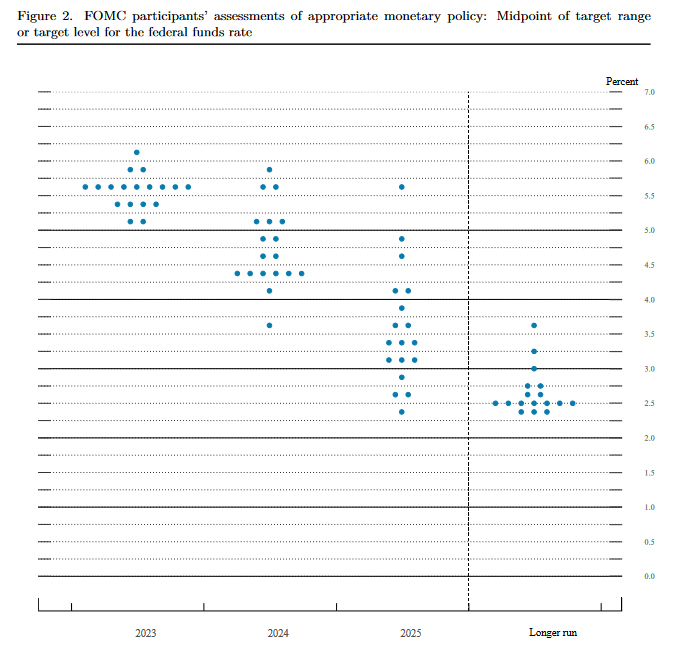
Today's main event will be the FOMC meeting where we expect no changes in policy rate, in line with consensus. The focus will instead be on the updated dot plot, i.e. how the policymakers see the future rate path.
In Germany, we receive the producer price index from August. The yearly growth rate will likely show a large decline as producer prices peaked last year in August/September and have since then reverted in line with energy prices.
In the euro area, new car registrations for August will be released. New car registrations have rebounded over the last months in line with consumer confidence following the declines in the winter.
In Sweden, we get unemployment data and government budget, see more below.
The 60 second overview
EA inflation: The final euro area inflation figures for August were revised down to 5.2% y/y from 5.3% y/y in the flash estimate. The final release confirmed core inflation at 5.3% y/y and headline at 5.2% (pr. 5.3%). Note that the revision of headline inflation was due to a change down to 5.244% so very close to unchanged at the first decimal. Service prices are still sticky at 5.5% y/y while inflation in goods continue to grind lower albeit still recording increases of 4.7% y/y. Like goods, food price inflation is also coming down, but is still at a high level of 9.7% compared to 10.8% in July.
US: The US Congress continues to struggle to pass a funding bill to avert a looming government shutdown on 30 September. On Sunday, the leaders of the hardline republican House Freedom Caucus struck a deal with representatives from the more moderate Main Street Caucus on a short-term 'continuing resolution' funding bill until 30 October, which House speaker McCarthy will bring to the House floor on Thursday. But as the bill contains an immediate 8% spending cuts to several federal agencies and excludes further aid to Ukraine as well as disaster relief it will have a very difficult time passing the Senate, which is controlled by the Democrats, even if it passes the House vote. Eventually, we think the most likely option is that Congress approves a set of bi-partisan funding bills which have been prepared in the Senate. While they still face some hurdles, the bills (with funding in line with the debt ceiling agreement from May) generally have broad bi-partisan support in the Senate as well as among House democrats and moderate House republicans. On the downside, McCarthy can only pass it through the House with support from the Democrats, which could lead to hardline republicans challenging his position as a speaker. It remains to be seen what happens to McCarthy after that.
Equities: Equity investors remained cautious on Tuesday, with defensives outperforming and equities slightly lower. It was a quiet session and we therefore saw only a small difference between sectors and styles. However, quality defensives were overall in favour, such as health care or big tech. S&P closed down -0.2% and Europe around unchanged. Banks performed well in the Nordic session. Both US futures and Asian markets are drifting lower this morning again.
FI: Euro rates ended higher by 2-3bp across maturities, with a slight intra-euro area spread tightening reflecting comments from ECB's Villeroy who said that the current 4% deposit rate level should be maintained for sufficiently long to bring inflation in line with target. Market pricing is still slightly skewed for one additional hike at 7bp through December.
FX: FX markets are clearly in waiting mode ahead of the perceived hawkish hold decision by the Fed tonight. EUR/USD has erased some of the losses after the dovish hike by the ECB last week and the next leg will crucially depend on forward guidance, that is, the dot plots and Powell's press conference. The same goes for the rates sensitive USD/JPY. Scandies were generally in a better mood with EUR/SEK dipping below 11.90 and EUR/NOK below 11.50. The crosses closed the US session slightly above these respective levels.
Credit: Credit markets ended the day on a slightly negative note yesterday with iTraxx main widening 0.4bp to 69.8bp and Xover widening marginally by 0.1bp to 390.
Tomorrow, trading will commence in the new iTraxx series (index rolls from series 39 to 40) where there are quite large changes to index constituents leading to technical widenings in the standard indices.
Nordic macro
In Sweden, the August unemployment and Government 2024 budget are both due at 08.00 CET. We expect the unemployment rate to show a minor uptick in seasonally adjusted terms from the July 7.0 % print. That said, the labour market remains solid and "labour hoarding" is till the dominant theme for a majority of Swedish firms.
Previous leaks suggest we know most of the SEK 40bn reforms to come in the budget this morning: welfare transfers to municipalities, reduced income and car fuel taxes and increased housing renovation subsidies. This is too little to have any impact on inflation and too little to give any significant stimulus. The budget is basically taking the backseat with Riksbank in the driver's seat.
WTI Oil Technical: Bullish Exhaustion Sighted Below US$93.80 Key Resistance
- Recent 4 weeks of bullish movement in WTI crude oil has flashed out bullish exhaustion conditions.
- At the risk of shaping a bearish counter-trend/mean reversion movement within a major uptrend phase.
- Key resistance will be at US93.80 with intermediate support zone of US$86.30/US$84.90
West Texas Oil (a proxy of WTI crude oil futures)’s relentless medium-term uptrend move of +19% from the 24 August 2023 low of US$77.00/barrel to yesterday’s 19 September high of US$93.05/barrel has flashed out sights of bullish exhaustion where the next set of price actions are likely to be a bearish counter-trend/mean reversion movement within its major uptrend phase that is still intact since 4 May 2023 low of US$63.67/barrel.
Bearish “Shooting Star” formed right below key resistance
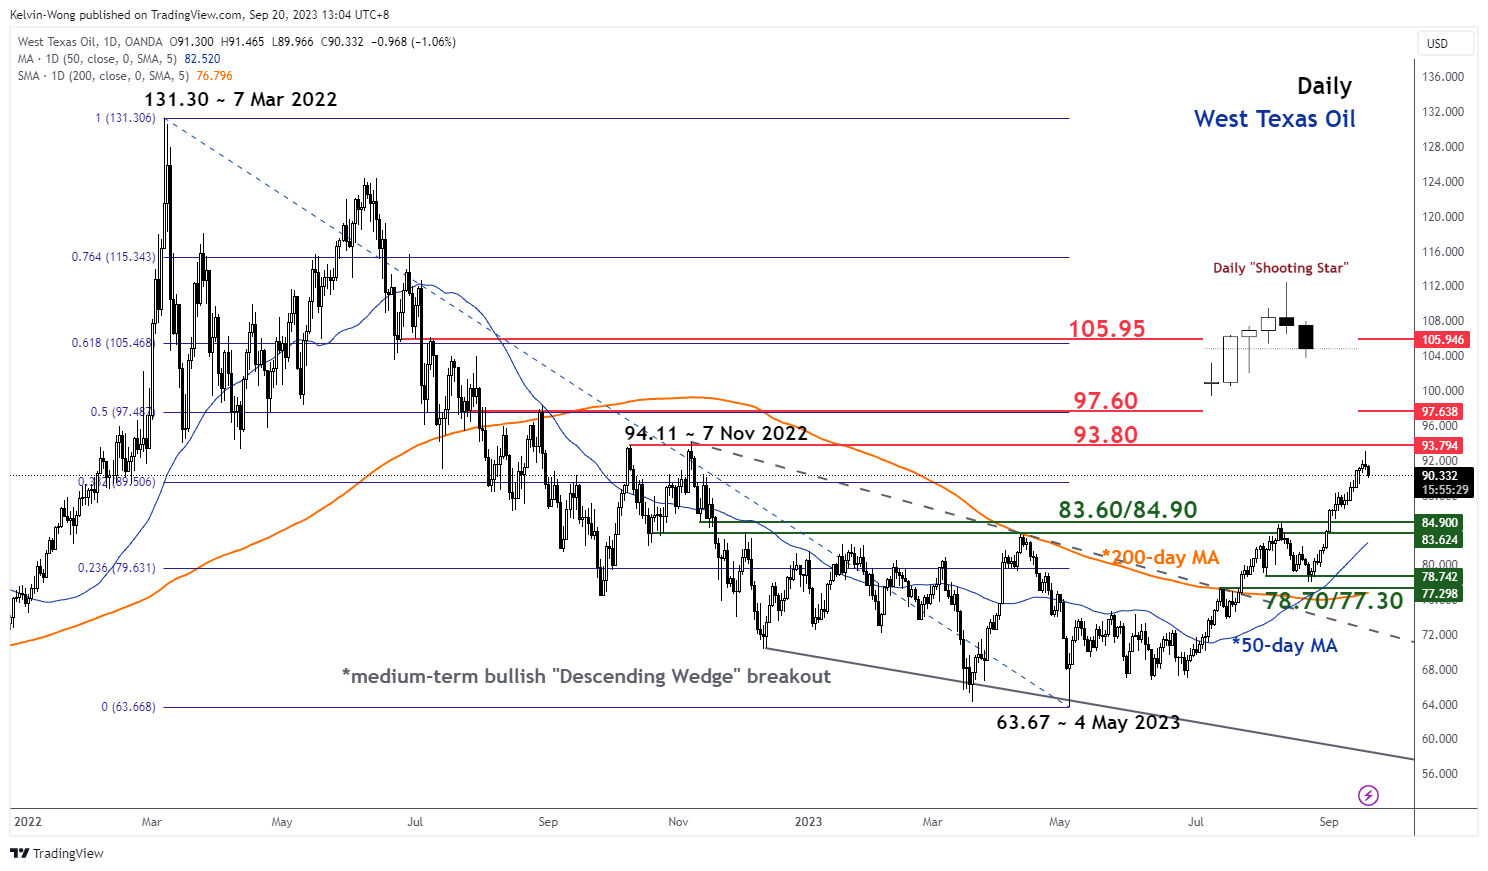
Fig 1: West Texas Oil medium-term trend as of 20 Sep 2023 (Source: TradingView, click to enlarge chart)
During yesterday’s intraday session, price actions continued their bullish impulsive movement during the Asian and European sessions but sizzled out throughout the US session as it closed near the low (US$90.93) of the day, 19 September.
This set of intraday price action behaviours culminated into a daily “Shooting Star”, a bearish reversal Japanese candlestick pattern and the appearance of such candlestick right below a key resistance of US$93.80 (medium-term swing highs of 10 October/7 November 2022 & a Fibonacci extension cluster) increases the odds of bearish counter-trend movement next.
Bearish breakdown below minor ascending channel support
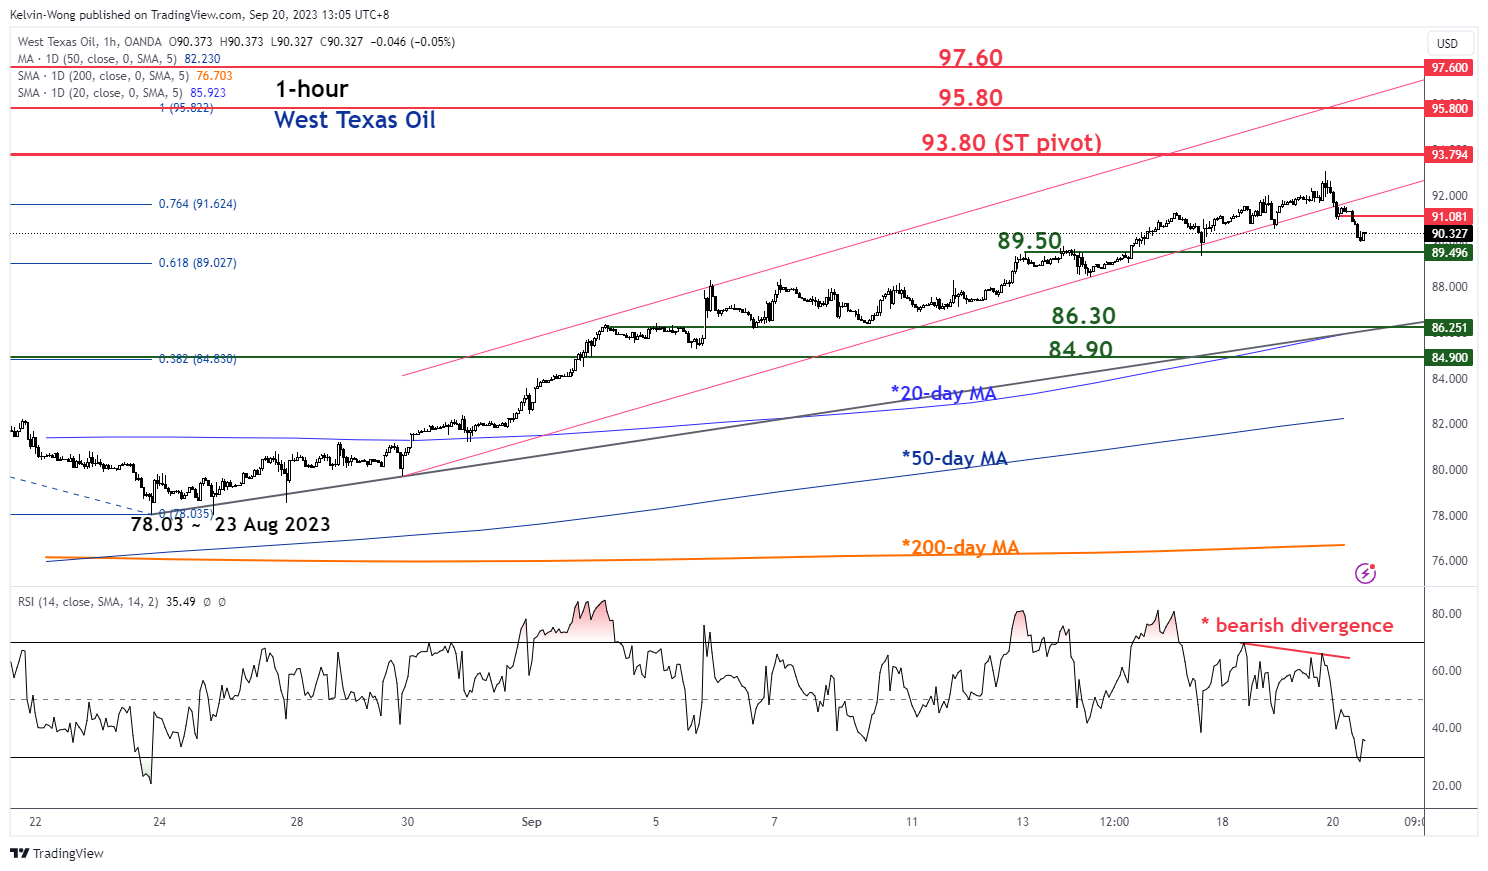
Fig 2: West Texas Oil minor short-term trend as of 20 Sep 2023 (Source: TradingView, click to enlarge chart)
As seen on the shorter time frame 1-hour chart, yesterday’s intraday price actions movement has also staged a bearish breakdown below a minor ascending channel support which indicates the recent minor uptrend phase from the 23 August 2023 low of US$78.03 is likely to have reached a terminal point.
The next set of price actions is likely to be bearish at least in the short term supported by a bearish divergence condition at the overbought zone seen in the hourly RSI that advocates an emergence of bearish momentum.
If the US$93.80 key pivotal resistance holds and a break below the near-term support of US$89.50, the price actions of West Texas Oil are likely to slide further in the context of a bearish counter-trend movement towards the intermediate support zone of US$86.30/US$84.90 (also the upward slopping 20-day moving average).
However, a clearance above US$93.80 invalidates the minor bearish scenario for a continuation of the bullish impulsive up move sequence towards the next resistances at US$95.80 and US$97.60 (congestion area of 23 June 2022 to 9 July 2022 & the 50% Fibonacci retracement of the prior major downtrend from 7 March 2022 high to 4 May 2023 low).
Technical Outlook and Review
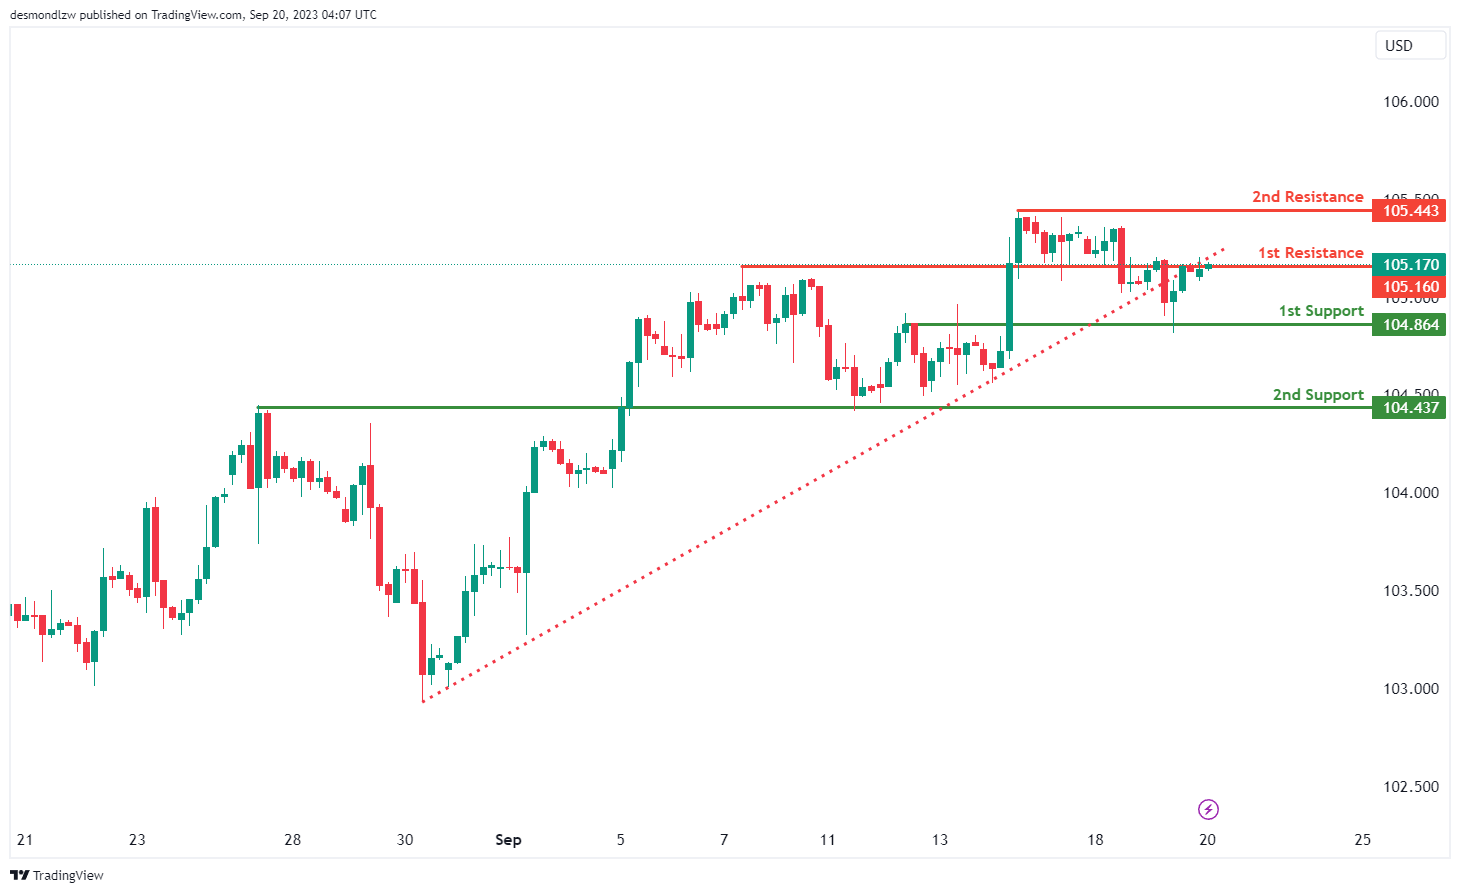
DXY:
The DXY (US Dollar Index) chart currently reflects a bearish overall momentum, driven by several factors contributing to its downward trajectory. A significant factor in this bearish sentiment is the recent break below an ascending support line, which has triggered the potential for a bearish move. In this context, there’s a plausible scenario where the price may experience a bearish reaction upon reaching the 1st resistance level at 105.16, subsequently declining towards the 1st support at 104.86. The 1st support is of notable importance, classified as an overlap support, signifying its historical relevance as a potential strong support zone. Similarly, the 2nd support at 104.43 is identified as an overlap support, reinforcing its role as a key support level.
On the resistance side, the 1st resistance at 105.16 is pivotal, categorized as an overlap resistance, and it carries the potential to act as a resistance barrier. Beyond the 1st resistance, the 2nd resistance at 105.44 is also characterized as a multi-swing high resistance, further emphasizing its significance.
EUR/USD:
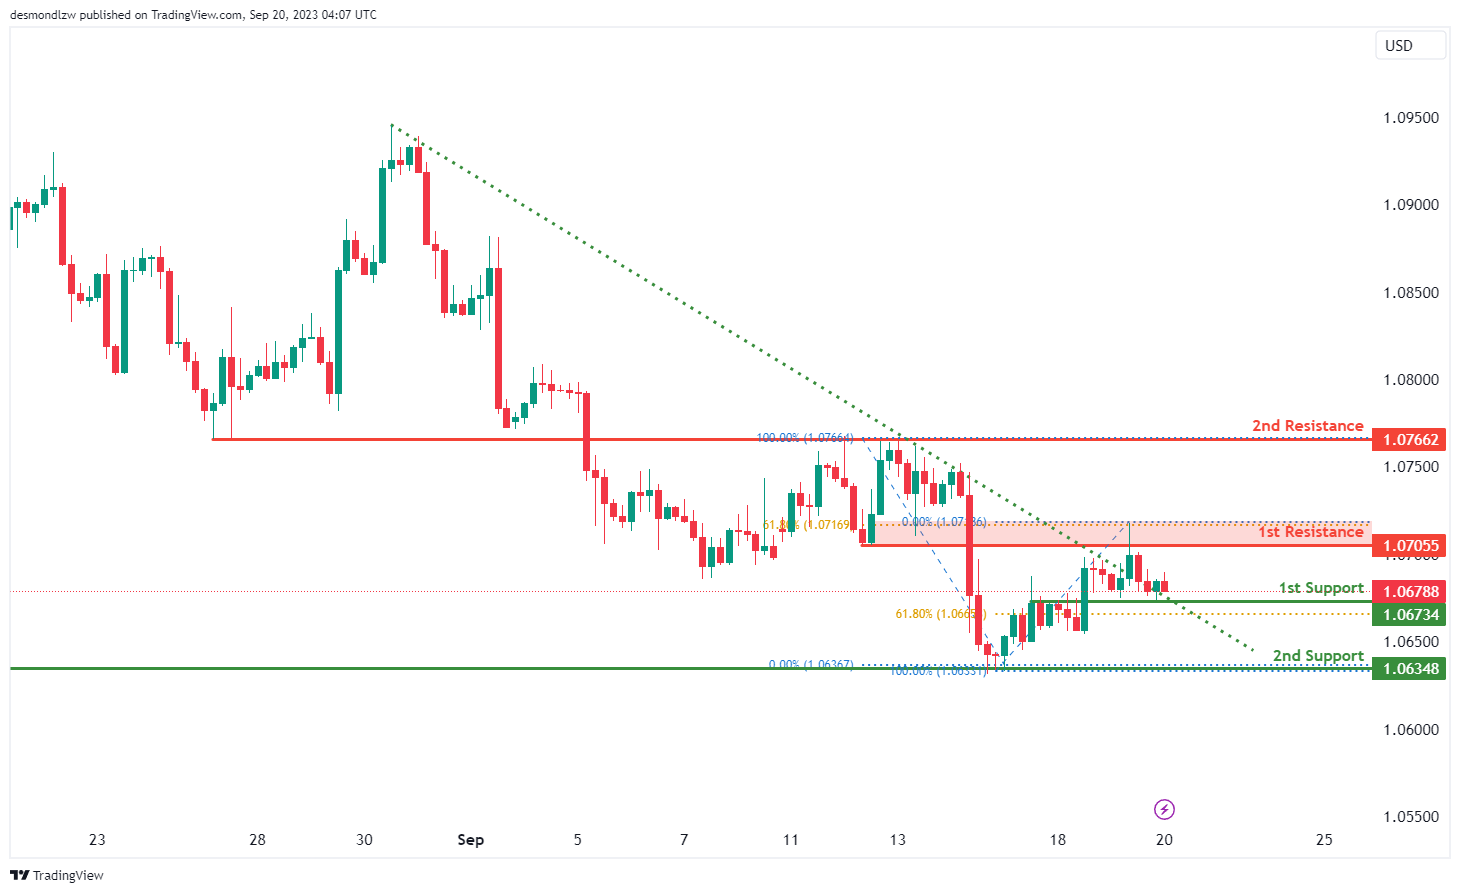
The EUR/USD chart currently exhibits a bullish overall momentum, with several factors contributing to its upward trajectory. One notable factor is the recent break above a descending resistance line, which has triggered the potential for a bullish move. In this context, there’s a plausible scenario where the price may experience a bullish bounce upon reaching the 1st support level at 1.0673 before advancing towards the 1st resistance at 1.0705.
The 1st support at 1.0673 is considered significant, characterized as an overlap support, and it also aligns with the presence of the 61.80% Fibonacci Retracement, highlighting its potential as a strong support zone. Similarly, the 2nd support at 1.0634 is identified as a multi-swing low support, further emphasizing its role as a key support level.
On the resistance side, the 1st resistance at 1.0705 plays a pivotal role, categorized as an overlap resistance and aligning with the 61.80% Fibonacci Retracement, underscoring its potential as a barrier to further upward movement. Beyond the 1st resistance, the 2nd resistance at 1.0766 is also identified as an overlap resistance, further highlighting its significance.
EUR/JPY:
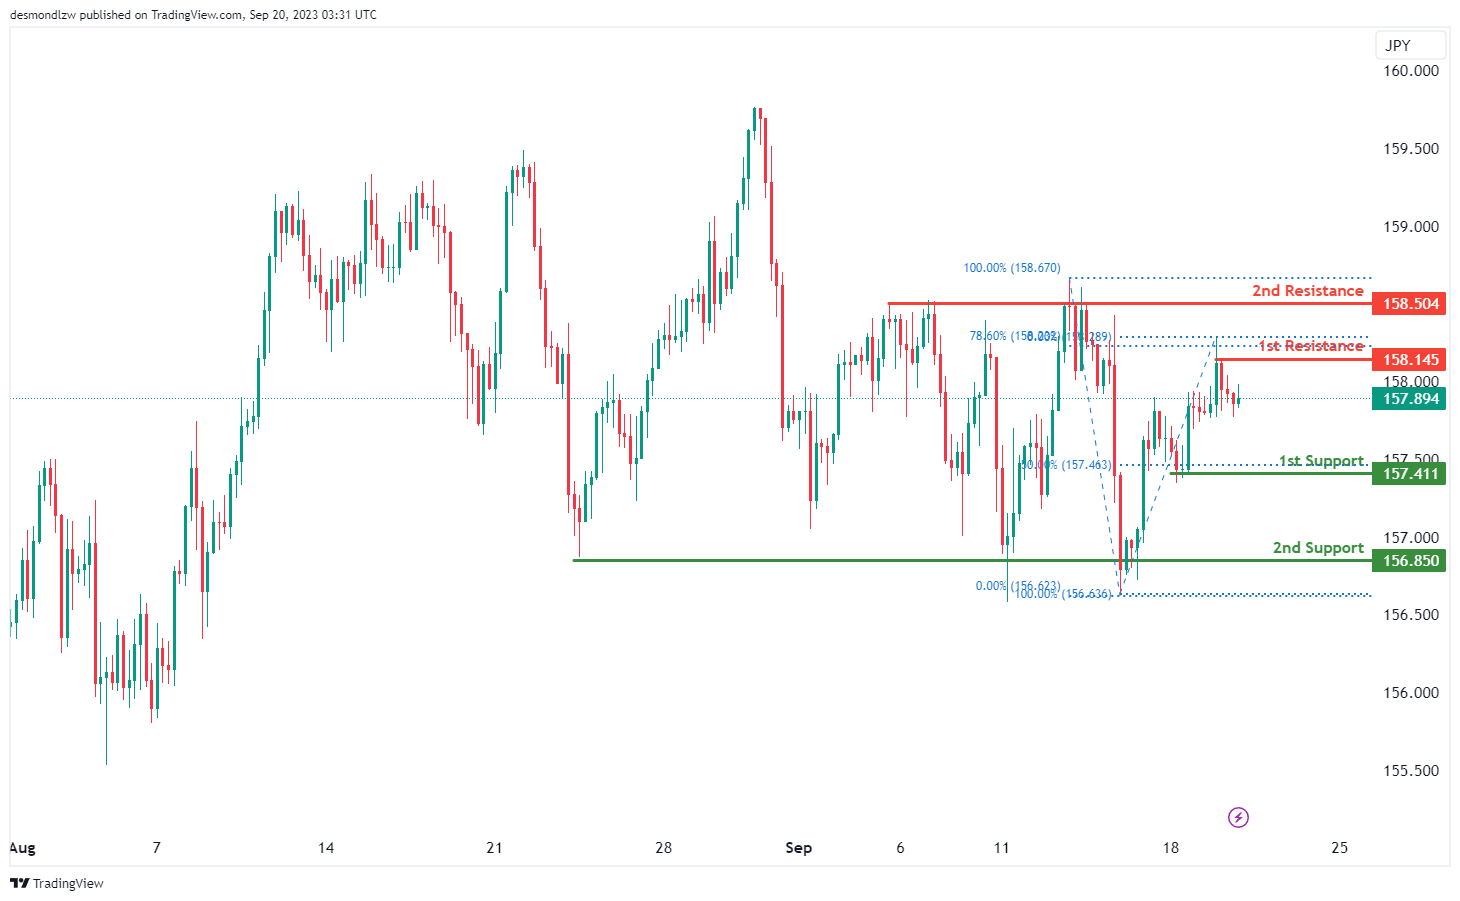
The instrument EUR/JPY currently shows a bearish overall momentum on the chart. There’s potential for a bearish continuation towards the 1st support at 157.41, which is considered good due to its nature as a swing low support and its association with the 50% Fibonacci Retracement.
The 2nd support at 156.85 is also notable as it acts as a multi-swing low support, providing an additional level of potential support.
On the resistance side, we have the 1st resistance at 158.14, which is significant because it represents a swing high resistance and is linked to the 78.60% Fibonacci Retracement.
Meanwhile, the 2nd resistance at 158.50 is noteworthy as it functions as a multi-swing high resistance, indicating a potential barrier to price movement at this level.
EUR/GBP:
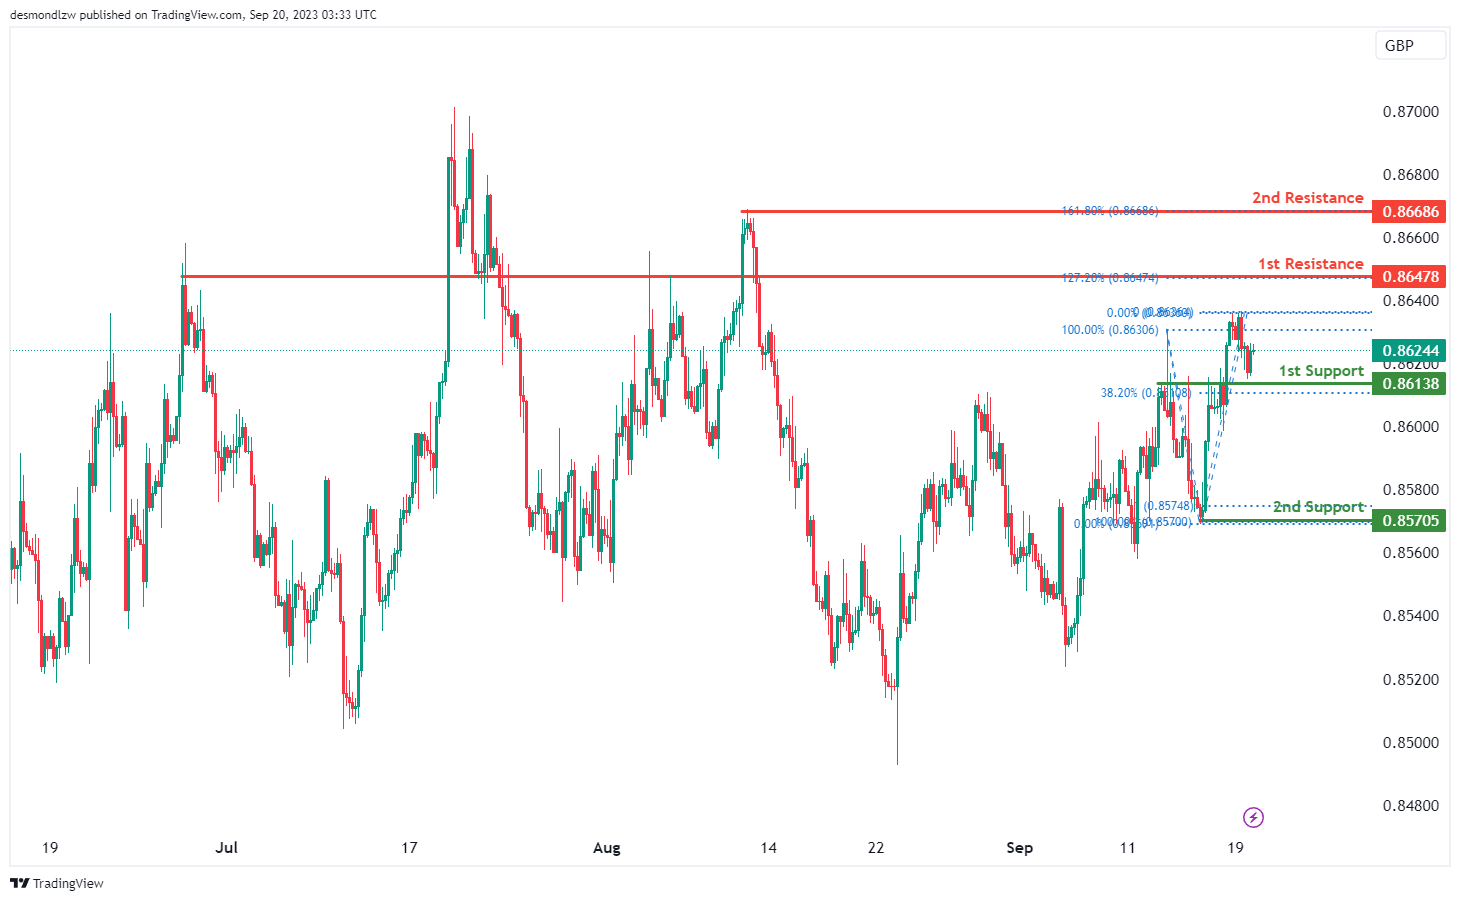
The instrument EUR/GBP currently indicates a bullish overall momentum on the chart. There’s potential for a bullish bounce off the 1st support at 0.8613, which is considered favorable due to its nature as a pullback support and its association with the 38.20% Fibonacci Retracement. The price may then head towards the 1st resistance.
The 2nd support at 0.8570 is also noteworthy as it acts as a swing low support, providing an additional level of potential support.
On the resistance side, we have the 1st resistance at 0.8647, which is significant because it represents a pullback resistance and is associated with the 127.20% Fibonacci Extension.
Meanwhile, the 2nd resistance at 0.8668 is noteworthy as it functions as a swing high resistance and is linked to the 161.80% Fibonacci Extension, indicating a potential barrier to further bullish movement at this level.
GBP/USD:
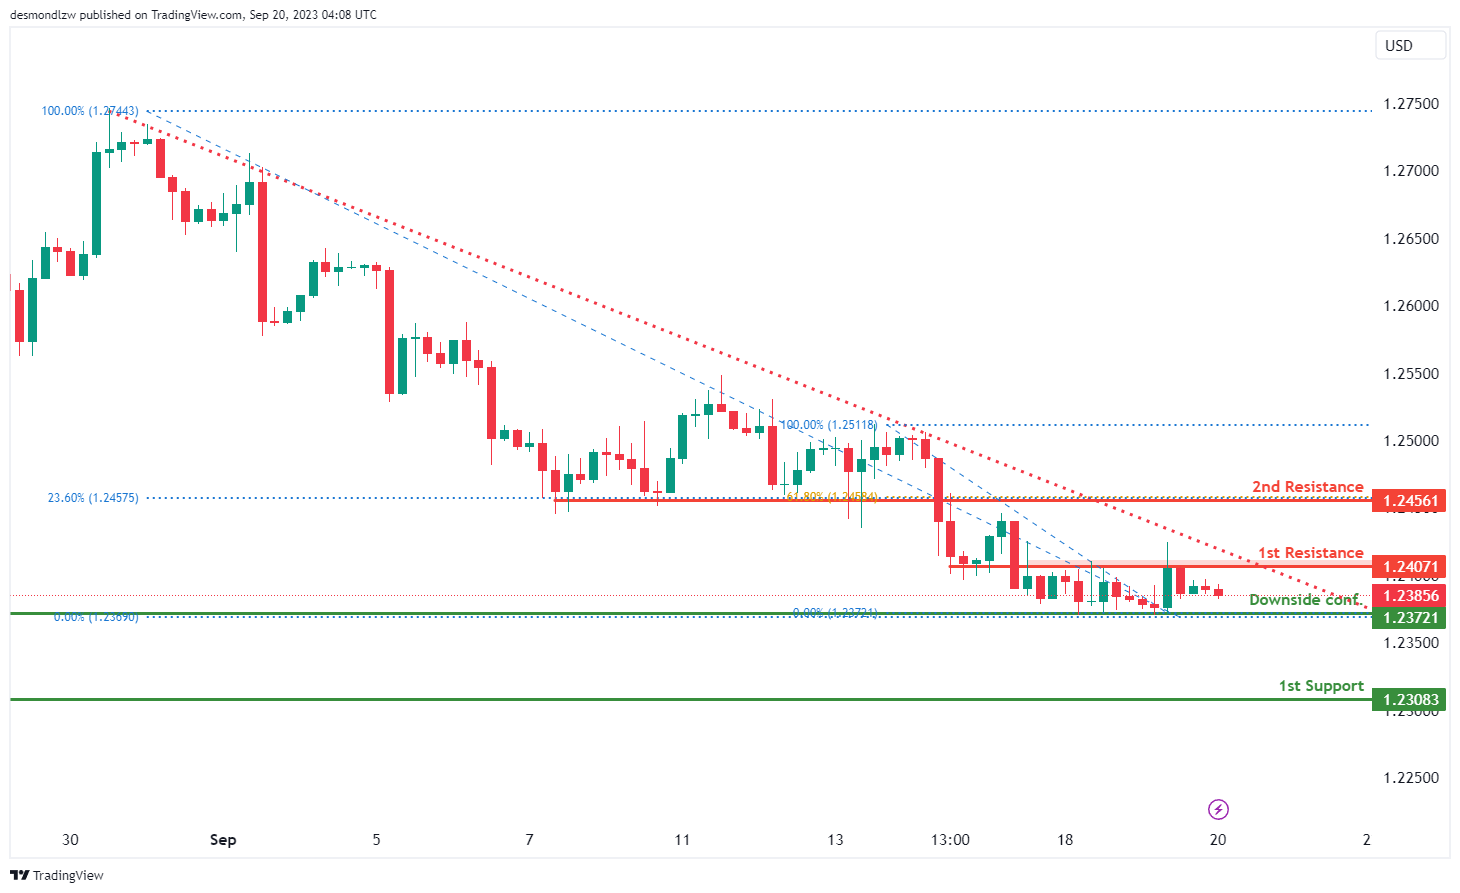
The GBP/USD chart currently exhibits a bearish overall momentum, influenced by several factors contributing to its downward trajectory. A key contributor to this bearish sentiment is the price’s position below a major descending trend line, signaling the potential for continued bearish momentum in the market. However, in the short term, there’s a potential scenario where the price may experience a temporary rise towards the 1st resistance level at 1.2407 before reversing and heading downwards towards the 1st support at 1.2305.
The 1st support at 1.2305 is a significant consideration, identified as a swing low support, highlighting its role as a key support level. Additionally, the downside confirmation level at 1.2372 is marked as an overlap support, signifying its historical relevance as a potential strong support zone.
On the resistance side, the 1st resistance at 1.2407 assumes a pivotal role, categorized as an overlap resistance, and it serves as a potential point of resistance in the short term. Beyond the 1st resistance, the 2nd resistance at 1.2456 is also identified as an overlap resistance, further emphasizing its importance. Moreover, this resistance level aligns with both the 23.60% and 61.80% Fibonacci Retracement levels, indicating a significant level of Fibonacci confluence.
GBP/JPY:
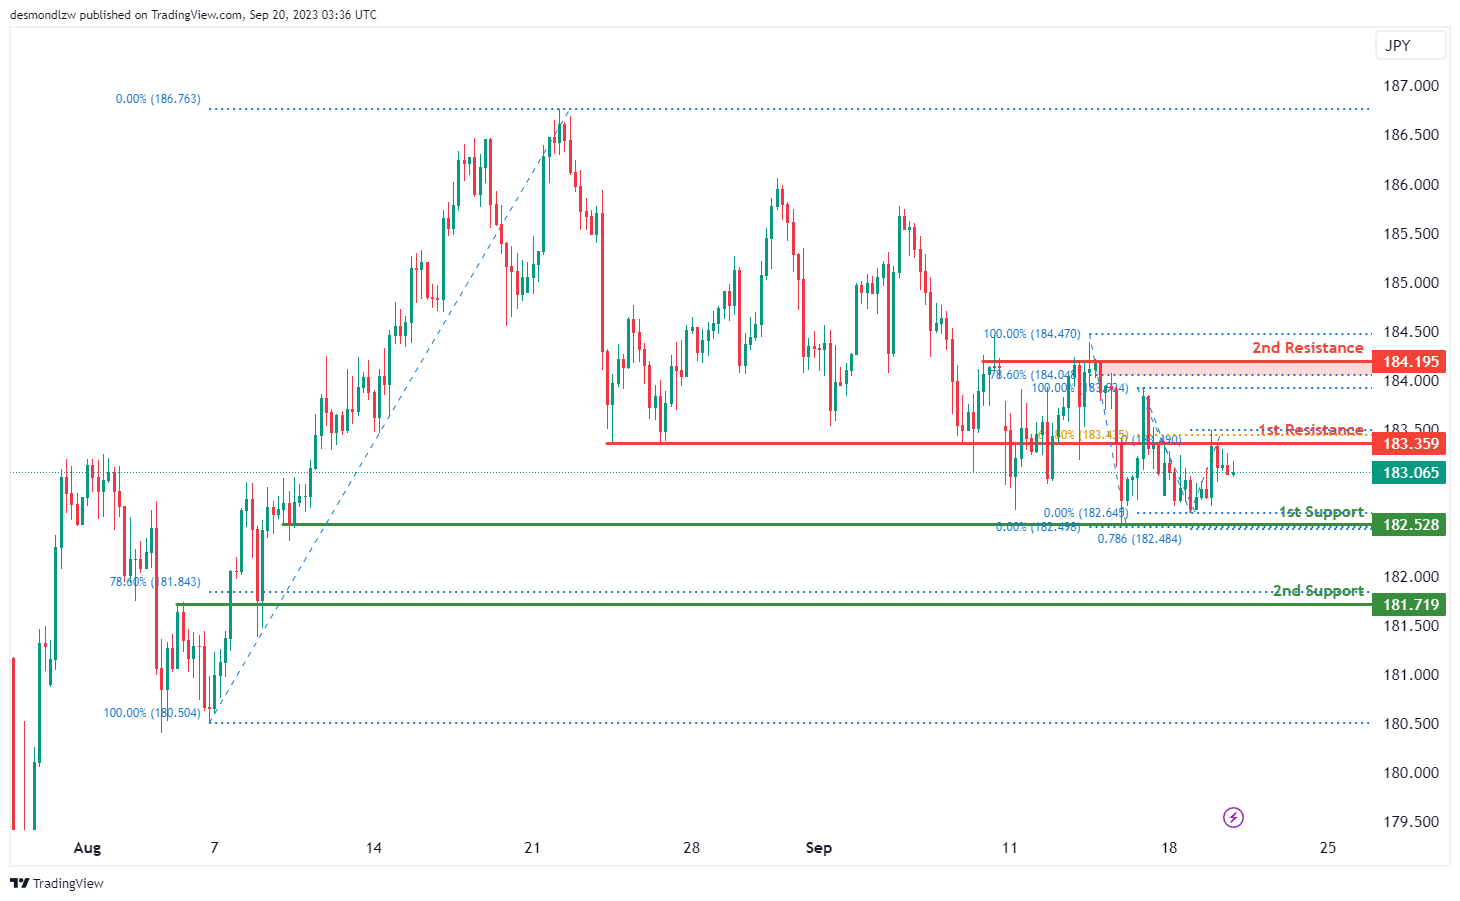
The instrument GBP/JPY currently indicates a bearish overall momentum on the chart. There’s potential for a bearish continuation towards the 1st support at 182.52, which is considered favorable due to its nature as a multi-swing low support and its association with the 78.60% Fibonacci Projection.
The 2nd support at 181.71 is also notable as it acts as an overlap support and is associated with the 78.60% Fibonacci Retracement, providing an additional level of potential support.
On the resistance side, we have the 1st resistance at 183.35, which is significant because it represents an overlap resistance and is linked to the 61.80% Fibonacci Retracement.
Meanwhile, the 2nd resistance at 184.19 is noteworthy as it functions as a multi-swing high resistance and is associated with the 78.60% Fibonacci Retracement, suggesting a potential barrier to further bearish movement at this level.
USD/CHF:
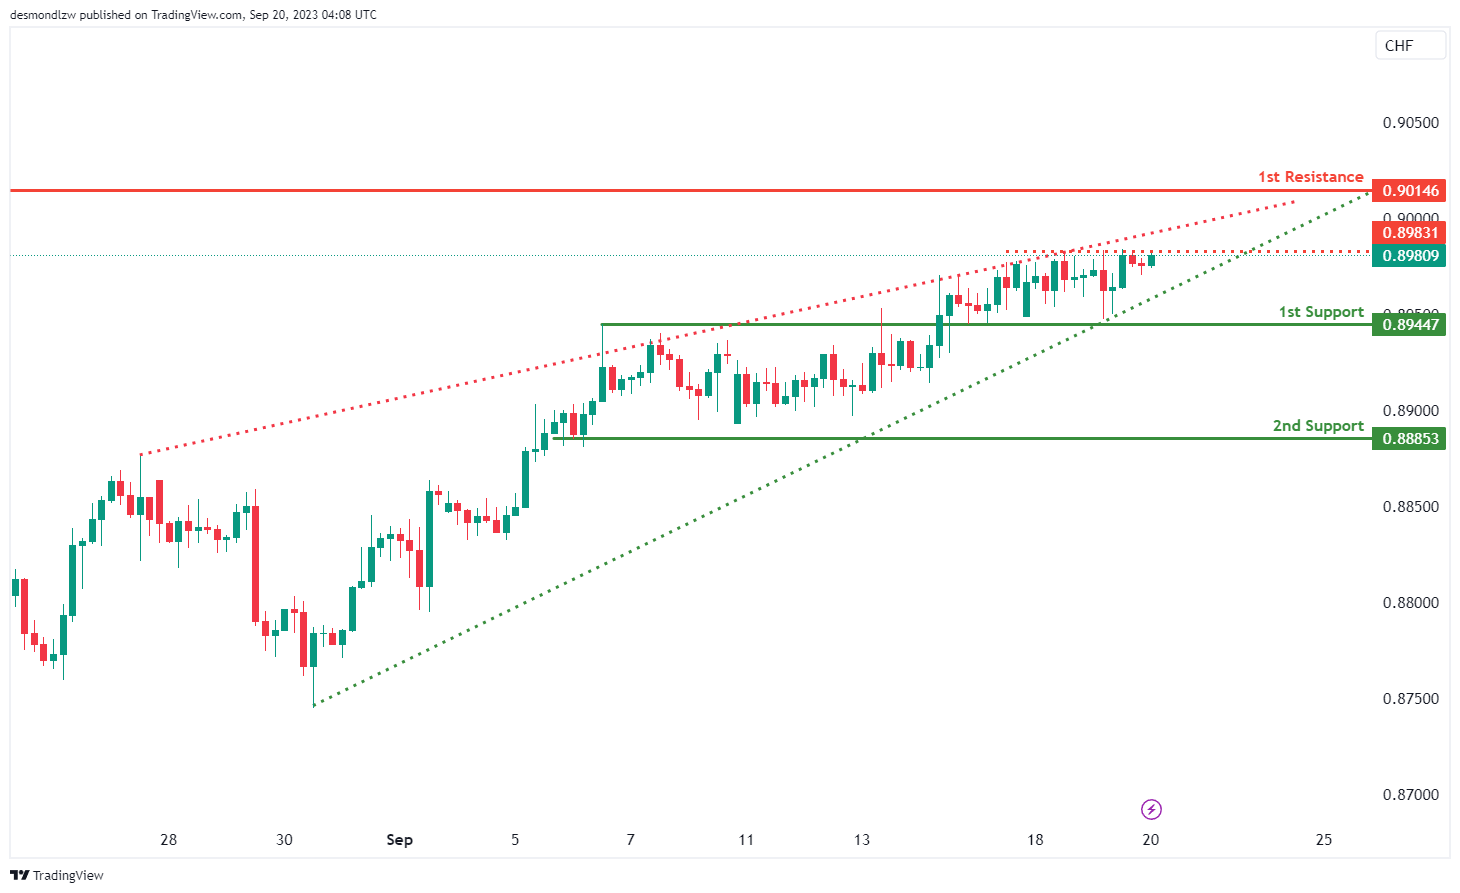
The USD/CHF chart currently displays a bearish overall momentum, with a potential scenario indicating a bearish reaction upon reaching the 1st resistance level at 0.9014, followed by a decline towards the 1st support at 0.8944.
The 1st support at 0.8944 holds significance as an overlap support, signifying its historical importance as a potential strong support zone. Similarly, the 2nd support at 0.8885 is identified as a multi-swing low support, further reinforcing its role as a key support level.
On the resistance side, the 1st resistance at 0.9014 is pivotal, characterized as a multi-swing high resistance, and it is a potential point of resistance. Additionally, there’s an intermediate resistance level at 0.8981, also characterized as a multi-swing high resistance.
Furthermore, it’s worth noting the presence of a Bearish Rising Wedge pattern on the chart. This pattern is considered bearish and typically signals an impending price drop in the downward direction.
USD/JPY:
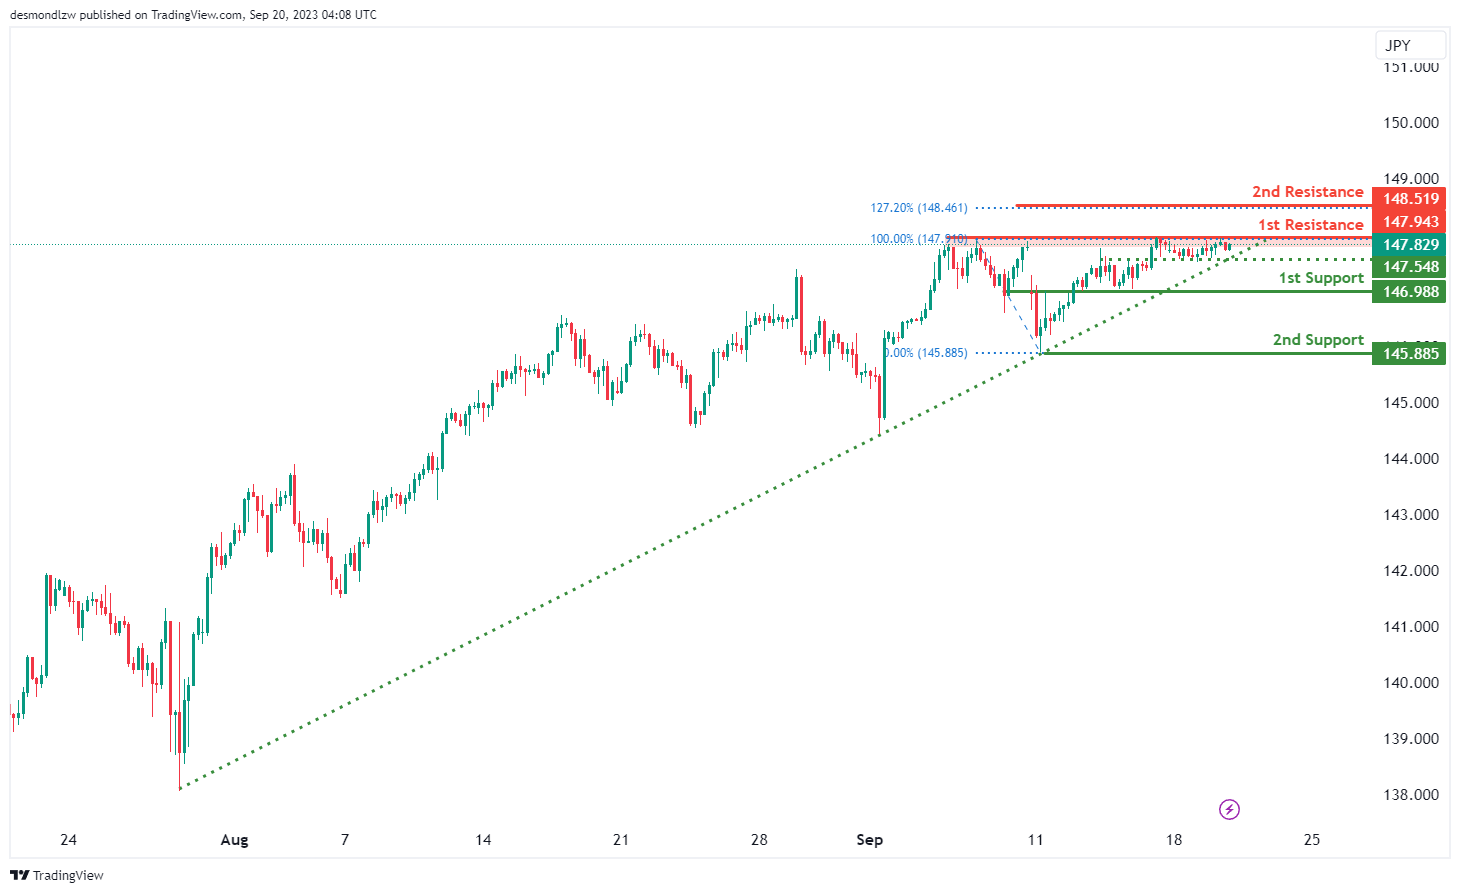
The USD/JPY chart currently maintains a bullish overall momentum, primarily due to its positioning above a major ascending trend line, suggesting the potential for further bullish movement in the market. However, there’s a plausible scenario where the price may experience a bearish reaction upon reaching the 1st resistance level at 147.94, subsequently declining towards the 1st support at 146.98.
The 1st support at 146.98 is considered significant, characterized as an overlap support, and it underscores its historical relevance as a potential strong support zone. Similarly, the 2nd support at 145.88 is identified as a swing low support, further emphasizing its role as a key support level.
On the resistance side, the 1st resistance at 147.94 assumes a pivotal role, categorized as a multi-swing high resistance, and it may serve as a point of resistance. Beyond the 1st resistance, the 2nd resistance at 148.51 is also identified as a swing high resistance and aligns with the presence of the 127.20% Fibonacci Extension, adding an extra layer of significance to its potential resistance role.
USD/CAD:
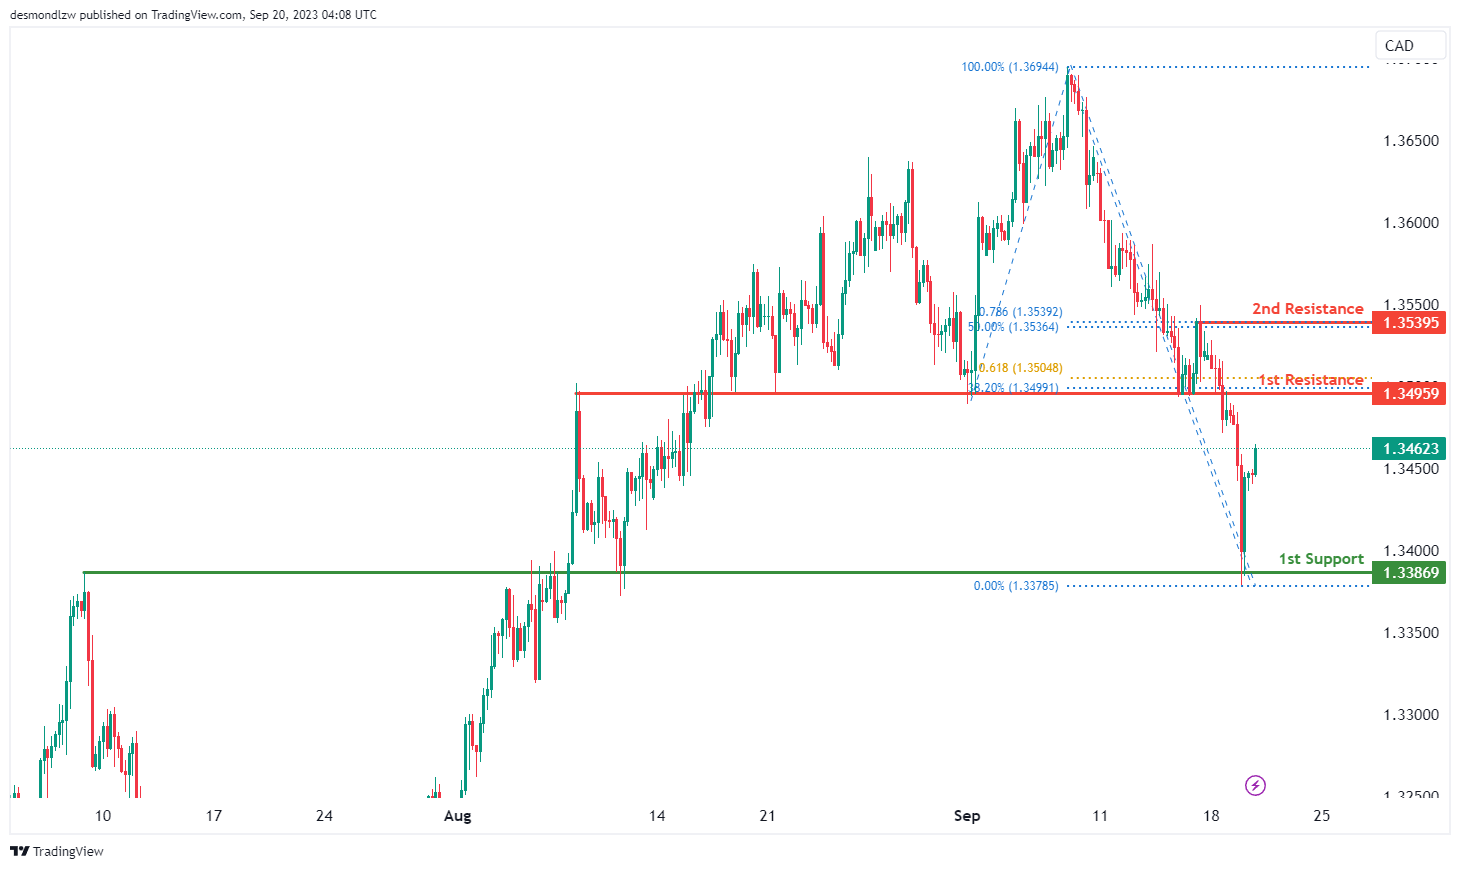
The USD/CAD chart is currently exhibiting an overall bullish momentum, indicating an upward trend with price making a bullish continuation towards the 1st resistance level.
The 1st resistance level at 1.3496 is identified as an overlap resistance that aligns with a confluence of Fibonacci levels i.e. the 38.20% retracement and the 61.80% projection levels. Additionally, the 2nd resistance level at 1.3539 is marked as a pullback resistance that also aligns with confluence of Fibonacci levels i.e. the 50% retracement and the 78.60% projection levels.
To the downside, the 1st support level at 1.3387 is identified as an overlap support, potentially acting as a strong support zone for price.
AUD/USD:
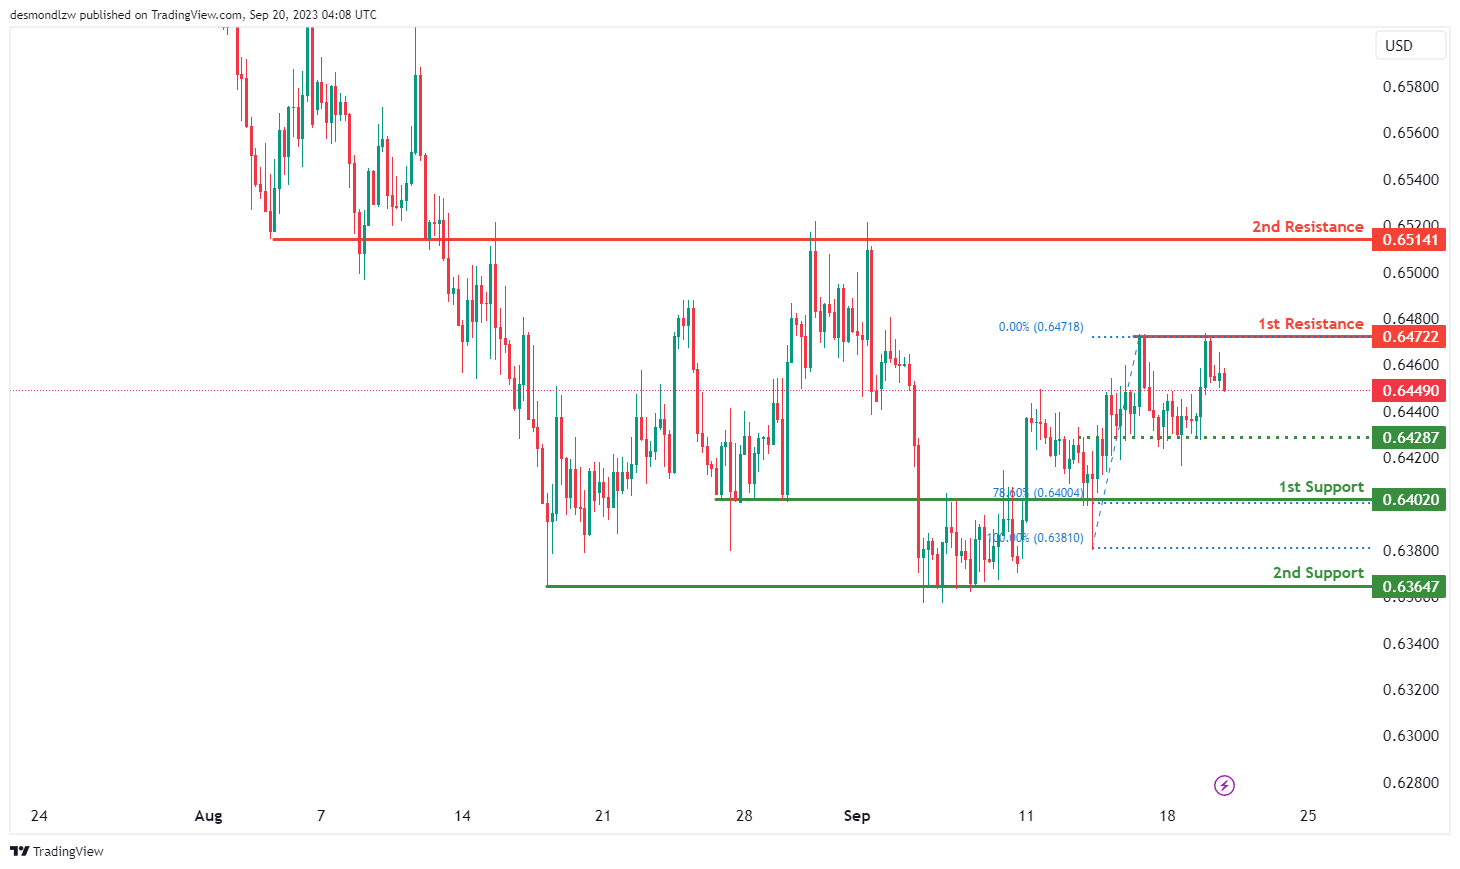
The AUD/USD chart is currently displaying an overall bearish momentum, suggesting a bearish continuation towards the 1st support level.
The intermediate support level at 0.6429 is identified as an overlap support while the 1st support level at 0.6402 is also marked as an overlap support that aligns with the 78.60% Fibonacci retracement level.
Further down, the 2nd support level at 0.6365 is identified as a pullback support, acting as a potential bounce for price.
To the upside, the 1st resistance level at 0.6472 is identified as a swing-high resistance while the 2nd resistance level at 0.6514 is noted as an overlap resistance.
NZD/USD
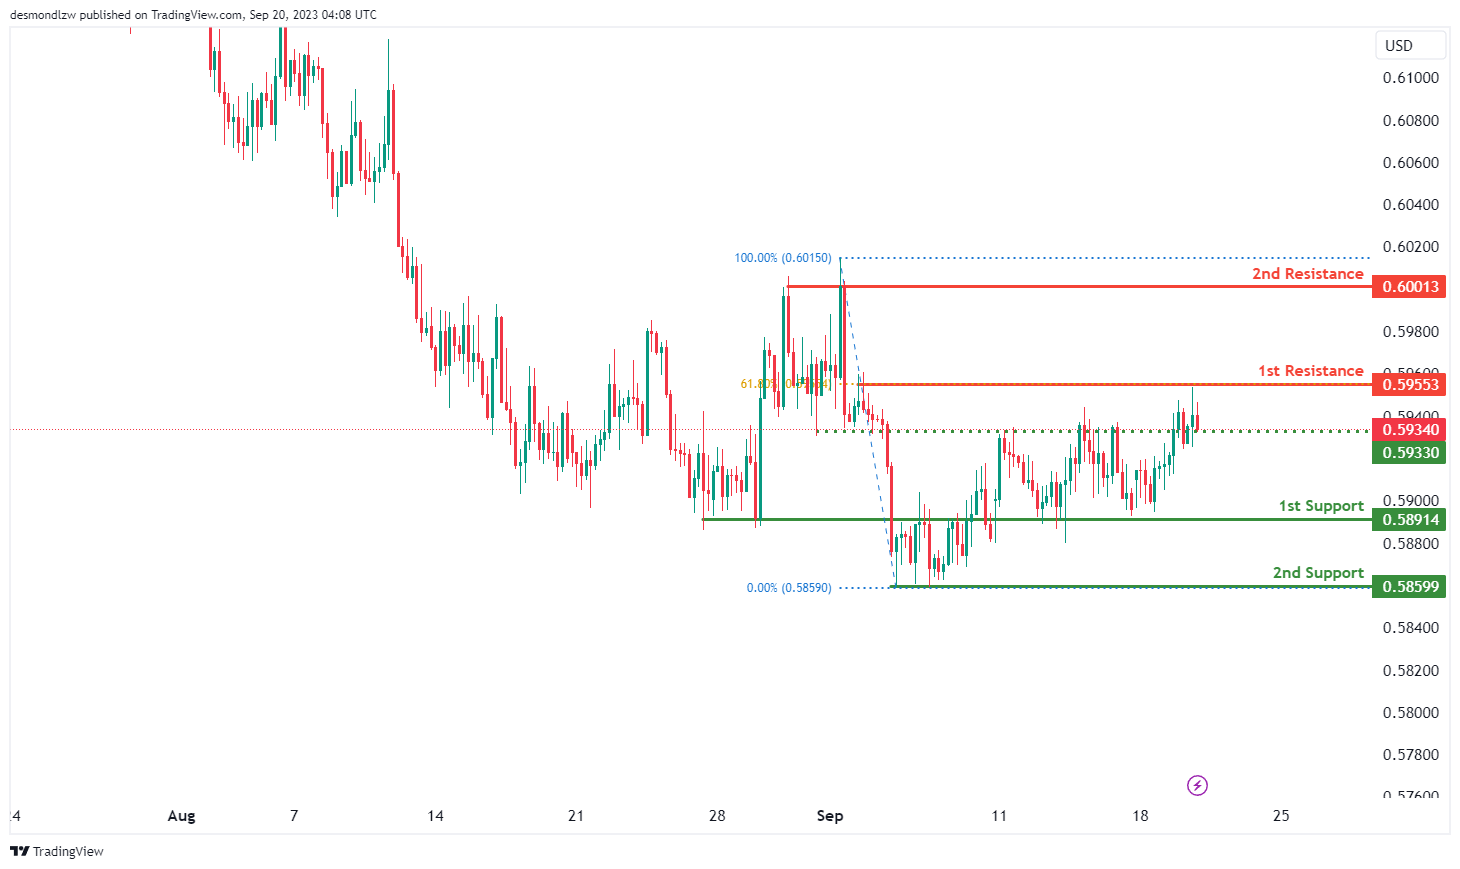
The NZD/USD chart currently exhibits a weak bearish momentum, potentially dropping towards the 1st support level should price break below the intermediate support level at 0.5933 which is identified as an overlap support.
The 1st support level at 0.5891 is identified as an overlap support while the 2nd support level at 0.5859 is marked as pullback.
The 1st resistance level at 0.5955 is identified as a pullback resistance that aligns with the 61.80% Fibonacci retracement level. Further up, the 2nd resistance level at 0.6001 is marked as a multi-swing-high resistance.
DJ30:
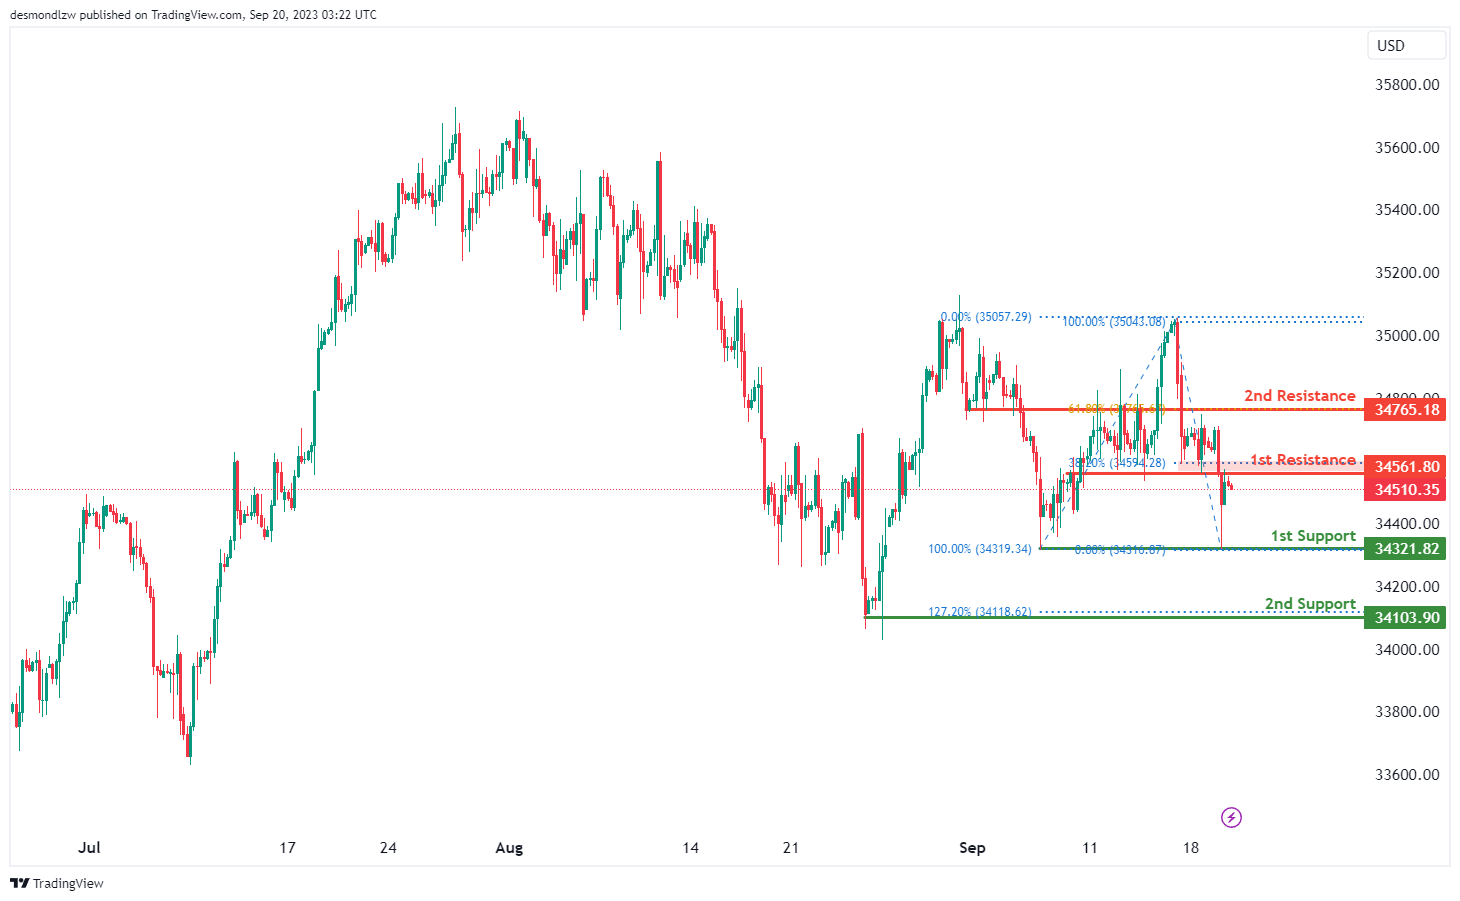
The instrument DJ30 is currently showing a bearish overall momentum on the chart. There’s potential for a bearish continuation towards the 1st support at 34321.82, which is considered good due to its status as a multi-swing low support.
The 2nd support at 34103.90 is also notable as it acts as a swing low support and is associated with the 127.20% Fibonacci Extension, making it a strong level of potential support.
On the resistance side, we have the 1st resistance at 34561.80, which is significant because it represents an overlap resistance and is also associated with the 38.20% Fibonacci Retracement.
Meanwhile, the 2nd resistance at 34765.18 is noteworthy as it functions as a pullback resistance and is linked to the 61.80% Fibonacci Retracement, making it a key level of potential resistance.
GER30:
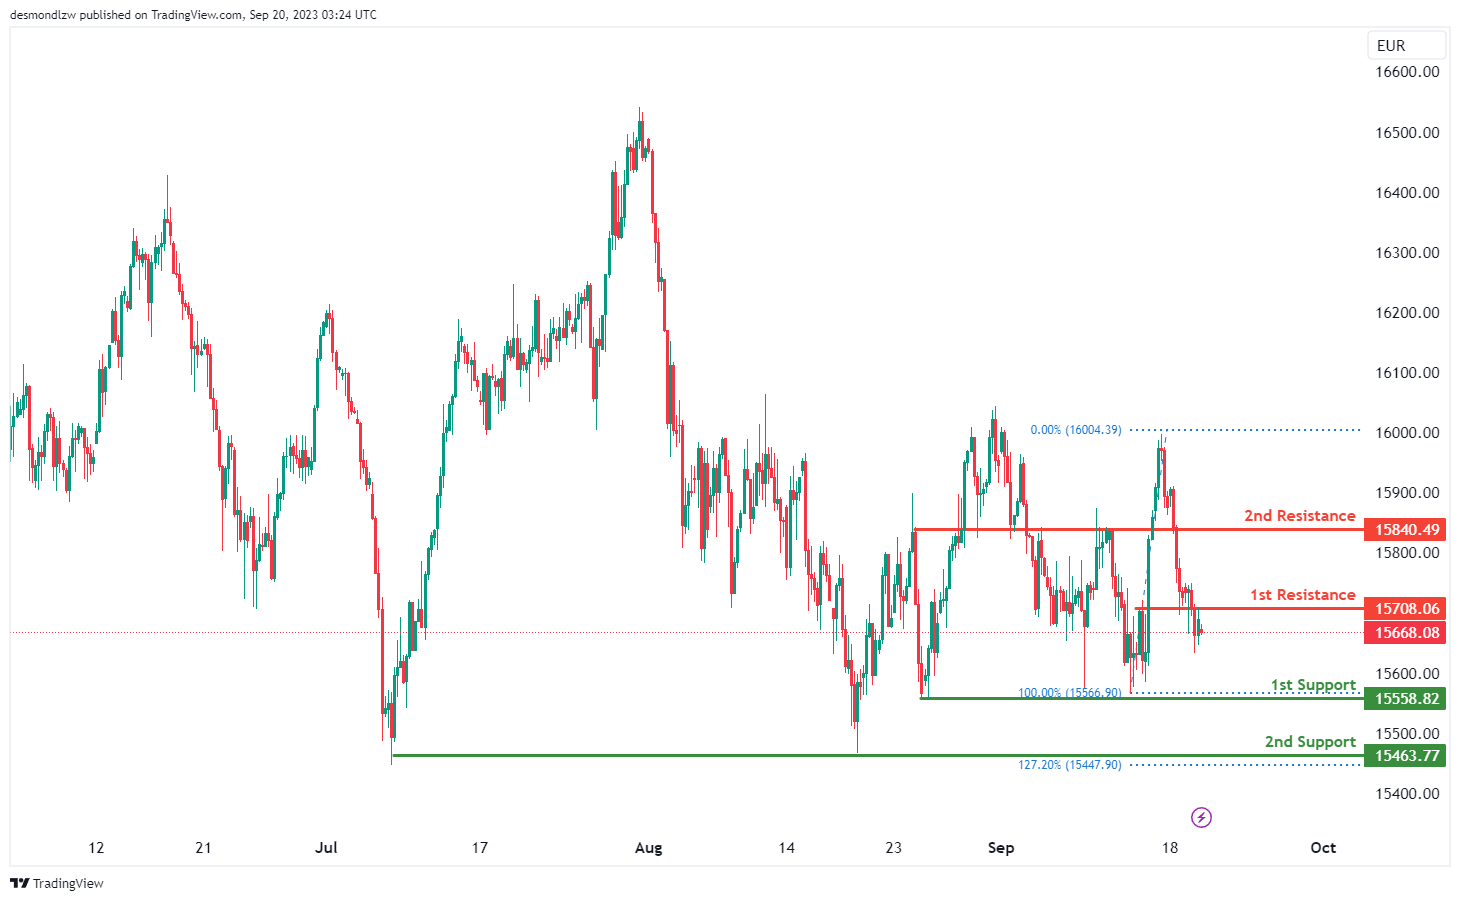
The instrument GER30 currently exhibits a bearish overall momentum on the chart. There’s potential for a bearish continuation towards the 1st support at 15558.82, which is considered good due to its status as a multi-swing low support.
The 2nd support at 15463.77 is also notable as it acts as a multi-swing low support and is associated with the 127.20% Fibonacci Extension, making it a strong level of potential support.
On the resistance side, we have the 1st resistance at 15708.06, which is significant because it represents a pullback resistance.
Meanwhile, the 2nd resistance at 15840.49 is noteworthy as it functions as another pullback resistance, indicating potential resistance at this level.
US500
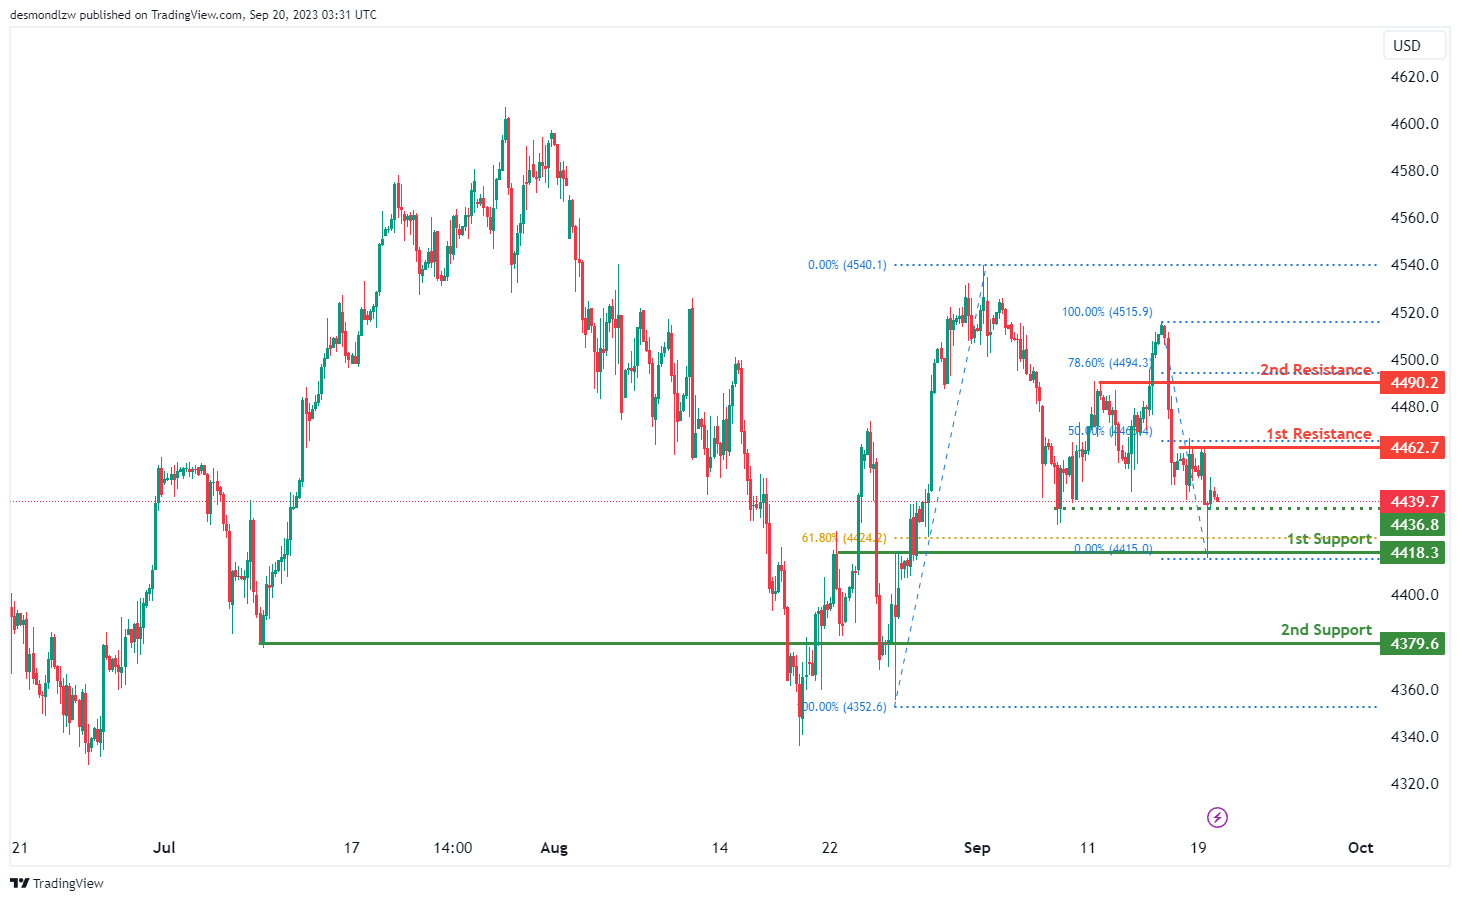
The instrument US500 is currently exhibiting a bearish overall momentum on the chart. There’s potential for a bearish continuation towards the 1st support at 4418.3, which is considered good due to its nature as a pullback support and its association with the 61.80% Fibonacci Retracement.
The 2nd support at 4379.6 is also notable as it acts as an overlap support, providing an additional level of potential support.
On the resistance side, we have the 1st resistance at 4462.7, which is significant because it represents a swing high resistance and is linked to the 50% Fibonacci Retracement.
Meanwhile, the 2nd resistance at 4490.2 is noteworthy as it functions as a pullback resistance and is associated with the 78.60% Fibonacci Retracement.
Additionally, there is an intermediate support at 4436.8, which is considered good due to its status as a multi-swing low support, providing an extra layer of potential support.
BTC/USD:
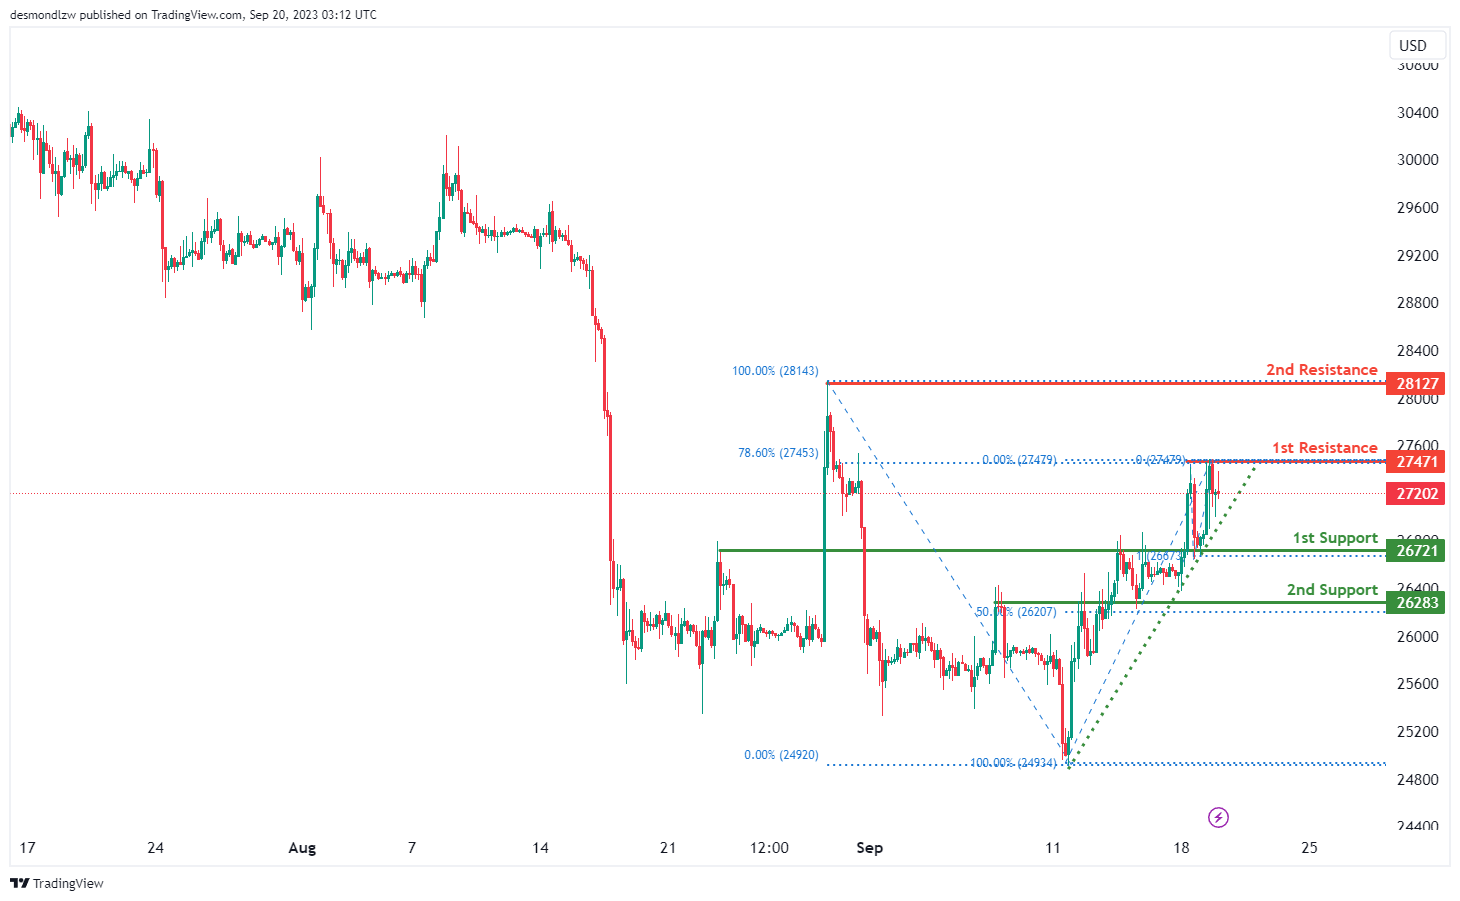
For BTC/USD, the overall momentum of the chart is currently bullish, and factors contributing to this momentum include the price being above a major ascending trend line, suggesting further bullish potential.
The potential scenario you’ve mentioned is for a bullish continuation towards the 1st resistance level at 27471. This resistance level is significant as it aligns with a multi-swing high resistance, indicating a potential barrier for further upward movement.
If the bullish momentum continues, the 2nd resistance level at 28127 is another level to watch. This resistance represents a swing high resistance and could act as a significant hurdle if the price attempts to move higher.
On the downside, the 1st support level at 26721 is a key level to consider. It is characterized as an overlap support and coincides with the 100% Fibonacci Projection, making it a strong potential support zone.
Additionally, the 2nd support level at 26283 aligns with an overlap support and the 50% Fibonacci Retracement, making it another important support area.
ETH/USD:
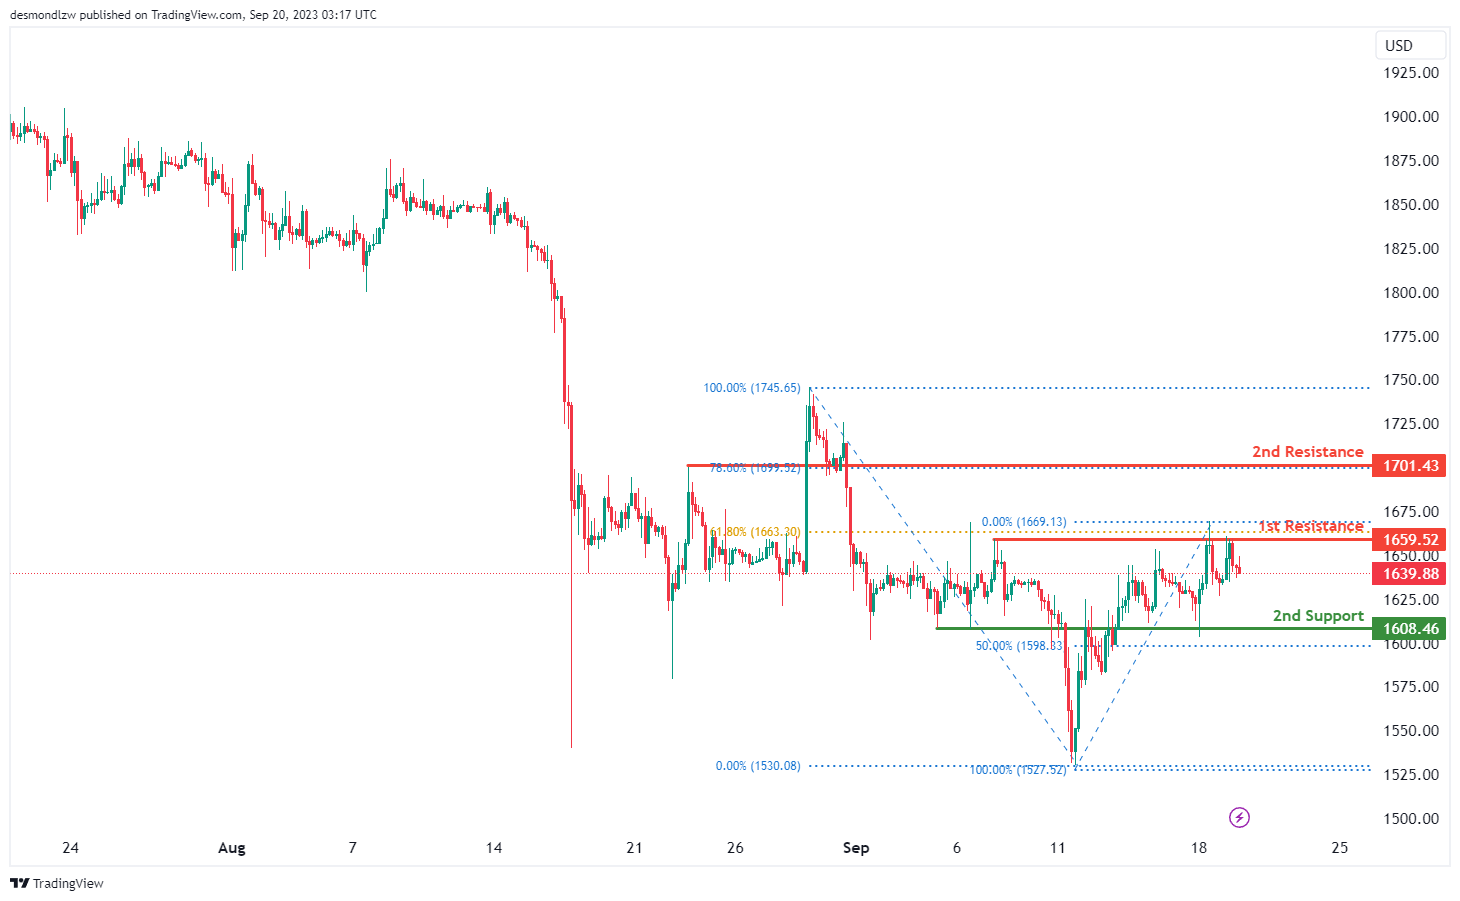
The instrument ETH/USD currently shows a bearish overall momentum on the chart. There’s potential for a bearish continuation towards the 1st support at 1608.46, which is considered good due to its overlap support at 50% Fibonacci Retracement. The 2nd support at 1540.15 is also notable for being a multi-swing low support.
On the resistance side, we have the 1st resistance at 1659.52, which is significant because it represents a multi-swing high resistance at 61.80% Fibonacci Retracement. Meanwhile, the 2nd resistance at 1701.43 is noteworthy as it acts as a pullback resistance at 78.60% Fibonacci Retracement.
WTI/USD:
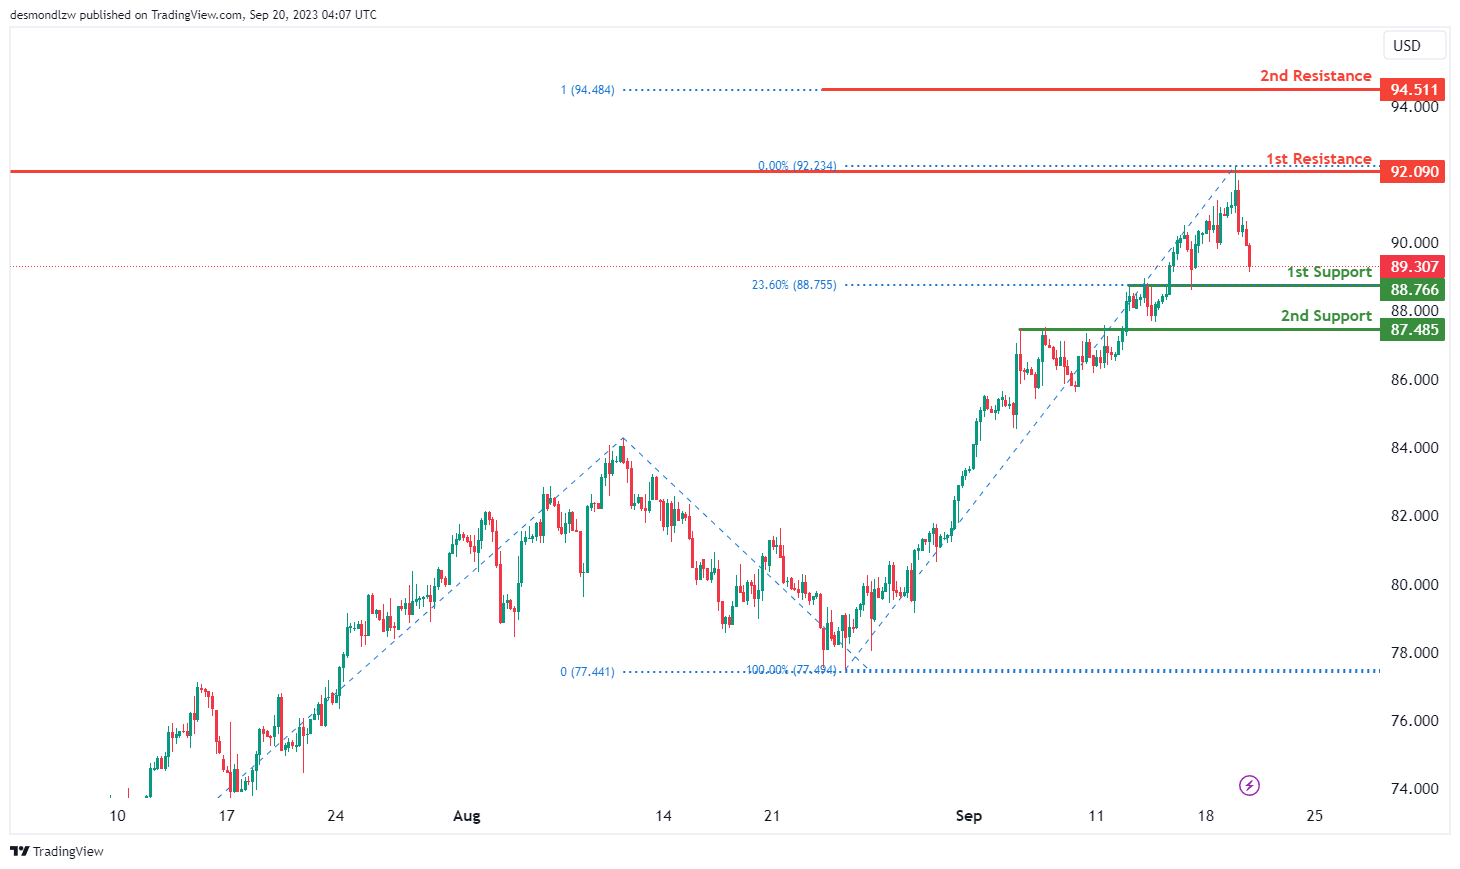
The WTI (West Texas Intermediate) chart currently exhibits a weak bullish momentum with low confidence. The short-term price action could involve a drop towards the 1st support level before potentially bouncing off this support to climb higher.
The 1st support level at 88.77 is identified as an overlap support that aligns with the 23.60% Fibonacci retracement level while the 2nd support level at 87.49 is also marked as an overlap support.
To the upside, the 1st resistance level at 92.09 is identified as a recent swing-high resistance. Further up, the 2nd resistance level at 94.51 is noted as a resistance that aligns with the 100.00% Fibonacci projection level.
XAU/USD (GOLD):
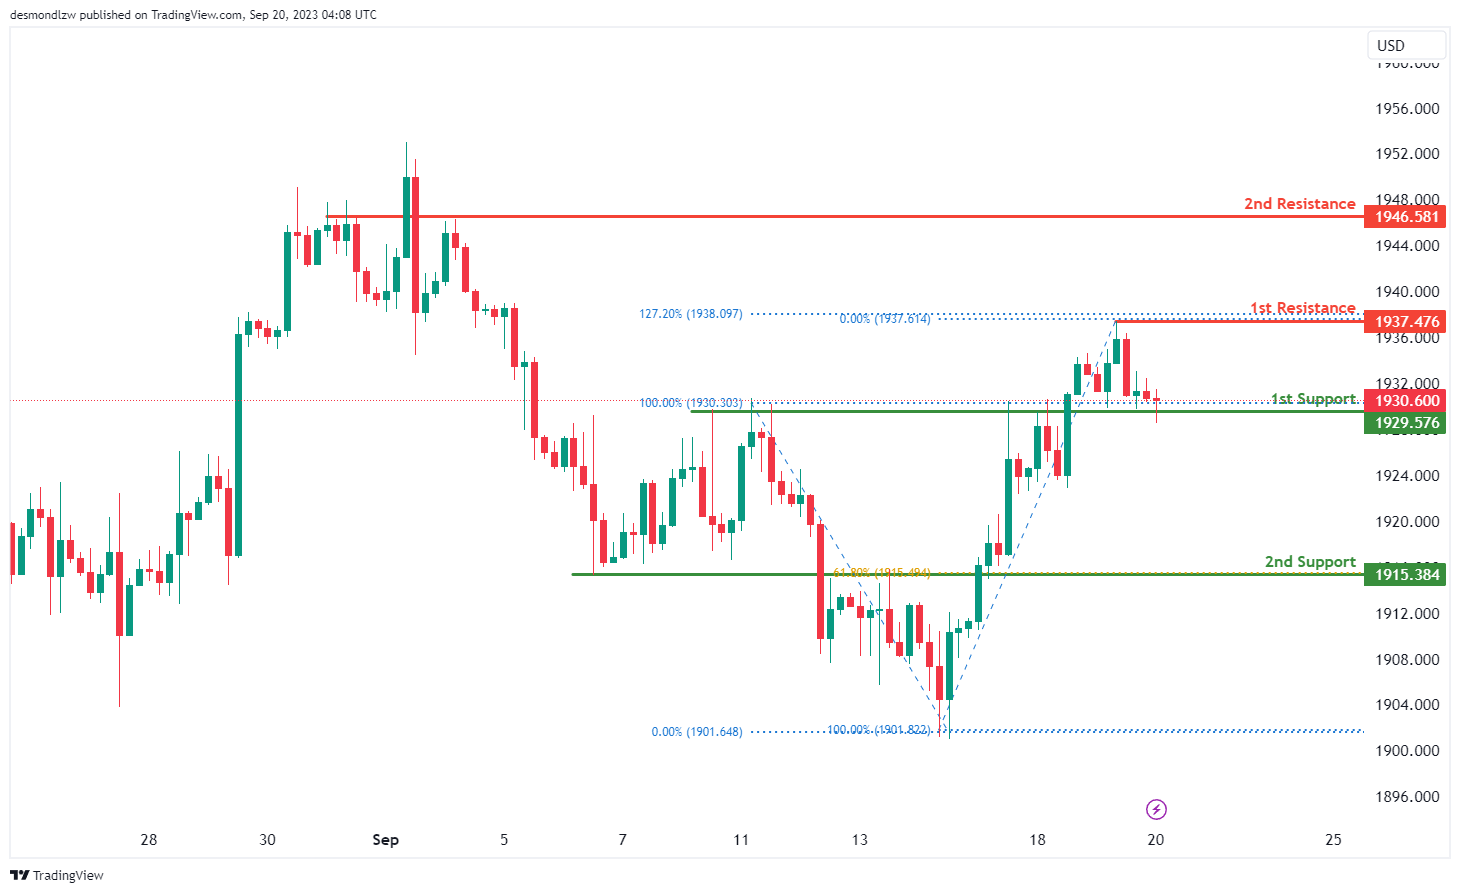
The XAU/USD chart currently exhibits a bullish overall momentum, presenting a potential scenario where the price may experience a bullish bounce upon reaching the 1st support level at 1929.57 and subsequently advance towards the 1st resistance at 1937.47.
The 1st support at 1929.57 is considered significant, characterized as an overlap support, and it carries historical relevance as a potential strong support zone. Additionally, the 2nd support at 1915.38 is identified as an overlap support and aligns with the presence of the 61.80% Fibonacci Retracement, further emphasizing its role as a key support level.
On the resistance side, the 1st resistance at 1937.47 plays a pivotal role, categorized as a swing high resistance and associated with the 127.20% Fibonacci Extension, indicating its potential as a point of resistance. Beyond the 1st resistance, the 2nd resistance at 1946.58 is also characterized as an overlap resistance, further highlighting its significance.
US treasury yields hit 16-Year peaks as markets await Fed’s insights
As anticipation builds around Fed impending monetary policy decision today, US 5- and 10-year Treasury yields surged to levels not seen in 16 years. With market expectations firming around a hold in the range of 5.25-5.50% – a forecast that has been in place for over a month – the possibility of any shock moves by the Fed is remote.
Nevertheless, investors will keenly dissect any subtle hints from Fed that might suggest another rate hike this year, or provide clues about the timing and speed of monetary easing in 2024. The forthcoming "dot plot" will be of particular significance.
To recall, in their June meeting, 12 out of 18 policymakers envisioned at least one more rate hike in the calendar year. 10 anticipated interest rates to fall back to 4.50-4.75% by the close of 2024. The evolving position of these dots is bound to sculpt market sentiments for the forthcoming months.
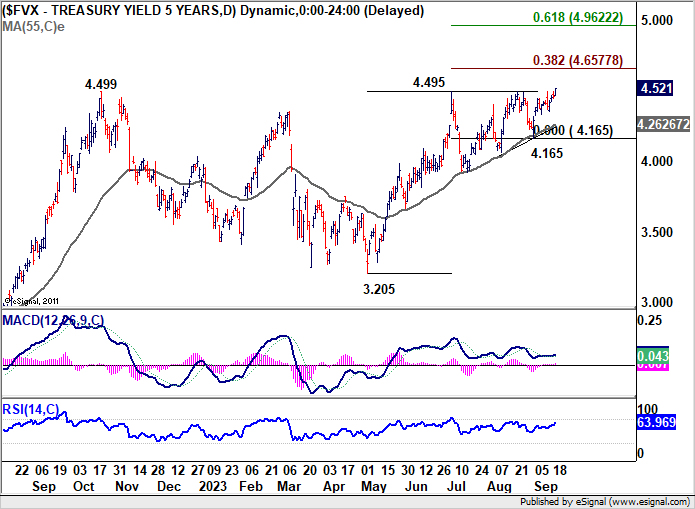
Five-year yield exhibited a strong close overnight, at an unmatched zenith since 2007, recording a 4.521. This surge found an ally in the WTI crude oil, which leaped, touching the 93-mark.
On the technical front, FVX looks ready to resume is long term up trend to finally get rid of resistance zone at around 4.5. The next hurdle is 38.2% projection of 3.205 to 4.495 from 4.165 at 4.657.
Any upside surprises in today's Fed inflation projections could potentially steer FVX towards the 4.657 projection level. Yet, surpassing this level might necessitate a sustained WTI oil rally, breaking the 95 mark and advancing towards 100.
Australia Westpac leading index edged up to -0.5%, growth struggles despite population boom
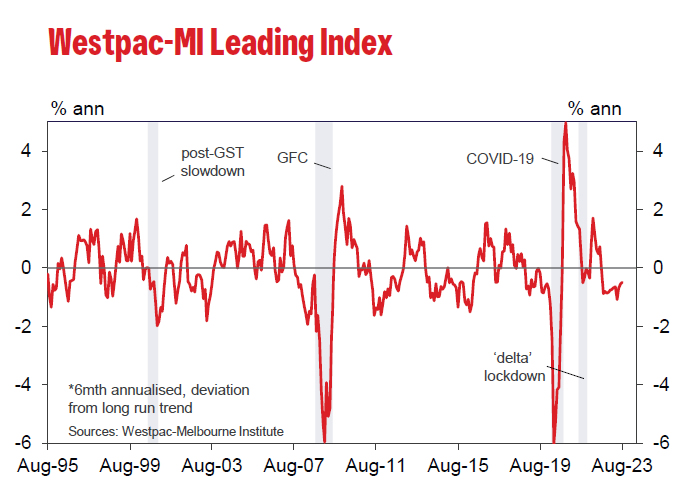
Westpac Leading Index for Australia indicates that the nation's growth outlook remains subdued. The index inched up marginally from -0.56% to -0.50% in August, marking a year since it began registering negative readings. These figures suggest that the prospect of per capita GDP advancing in the coming 3–9 months appears bleak.
Westpac's forecasts for the next year resonate with the index's gloomy narrative, anticipating an economic growth of less than 1% for the year leading up to June 2024. Interestingly, there's a potential silver lining: with predictions pointing to population growth surpassing 2% in 2023, this could introduce some upside risks to the otherwise somber economic projections.
However, despite this population surge, the economy is projected to trail behind, as evident from the March and June quarter results. Both quarters witnessed a contraction of -0.3% in GDP per capita, a pattern that's predicted to persist in the forthcoming year.
Regarding next RBA rate decision on October 3, Westpac said it's "almost certain to hold rates steady for another month". The crucial data for the next move would be September quarter inflation report, which will not be available until the November RBA meeting.
Japan’s exports to China tumble further, trade with US flourishes
Japan's economic data shows a dwindling momentum in the country's export sector, registering a decline of -0.8% yoy to JPY 7994B in August, with a particularly notable decrease in its trading activities with China.
The continued dip in exports is largely attributed to diminishing overseas demand and the trade restrictions imposed by China, which have significantly impacted Japan's trade balance.
A striking example is seen in the sharp -11.0% yoy decline in exports to China, to a total of JPY 1.44T. This downturn marks the third consecutive month of double-digit drops in export activities to China, severely affected by the -41.2% yoy plunge in food exports due to China's ban on Japanese seafood.
However, a beacon of positivity trading rapport with US, which saw a growth spurt of 5.1% yoy, aggregating to a record JPY 1.62T for the month of August. This surge has been primarily fueled by a heightened demand for Japanese cars, mining, and construction machinery.
On the import front, Japan noted a considerable -17.8% yoy reduction to JPY 8925B, with imports from China dipping -12.1% to JPY 1.93T, and those from US falling -9.5% yoy to JPY 967.39B. The nation's trade balance has consequently been reported at a deficit of JPY -930.5B.
When analyzed in seasonally adjusted terms, both exports and imports showcase a month-on-month decrease, registering -1.7% mom to JPY 8267.8B and -2.1% mom to JPY 8823.6B, respectively. Thankfully, there is a silver lining as the trade deficit has slightly narrowed compared to the previous month, standing at JPY -555.7B.
BoC Kozicki speaks on recent swings in inflation
BoC Deputy Governor Sharon Kozicki acknowledged in a speech that CPI inflation has seen "ups and downs of the size we've seen in the past couple of months," highlighting a decrease from a high of 8.1% in June 2022 to 2.8% in June this year. However, this decrease was followed by a surge to 3.3% in July and 4.0% in August (as released yesterday). Despite this decrease and subsequent rise, she affirmed that such fluctuations are "not that unusual."
She emphasized the Bank's approach to monitoring inflation, which includes a focus on measures of core inflation that exclude more volatile price movement components to get a true sense of underlying inflation.
"Measures of core inflation have eased," she noted, yet underlined that "inflationary pressures are still broad-based." She continued to express concern over the number of CPI components with price increases exceeding 5%, which, despite being lower than before, remains "much higher than it usually is when inflation is stable and close to 2%."
Acknowledging that "underlying inflation is still well above the level that would be consistent with achieving our target of 2% CPI inflation," Kozicki emphasized the Bank's commitment to continuous evaluation of several factors such as "the evolution of excess demand, inflation expectations, wage growth and corporate price-setting behaviour" to ensure alignment with the 2% inflation target.
To maintain economic stability amidst the dynamic inflationary environment, Kozicki emphasized that the Bank is "prepared to raise the policy interest rate further if needed."
Gold Price Targets Fresh Monthly High, Fed Decision Next
Key Highlights
- Gold price is moving higher from the $1,900 support.
- It could gain pace if it clears the $1,940 resistance on the 4-hour chart.
- Crude oil prices rallied further and even spiked above $92.50 before correcting lower.
- The Fed interest rate decision is scheduled today (forecast - no change from 5.5%).
Gold Price Technical Analysis
Gold price started a decent increase from the $1,900 zone against the US Dollar. The price gained pace above the $1,920 and $1,925 resistance levels.
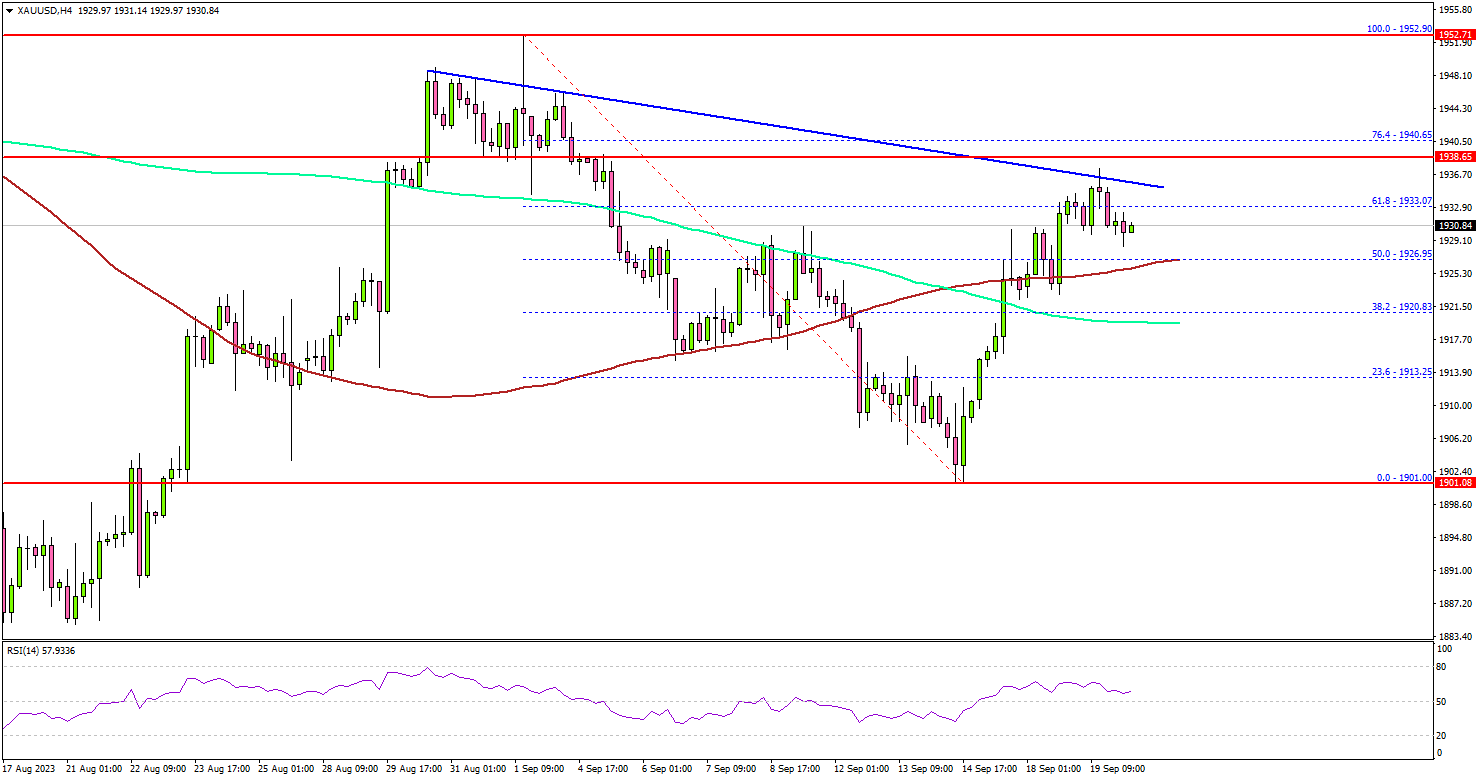
The 4-hour chart of XAU/USD indicates that the price settled above the $1,925 level, the 200 Simple Moving Average (green, 4 hours), and the 100 Simple Moving Average (red, 4 hours).
The price cleared the 50% Fib retracement level of the downward move from the $1,952 swing high to the $1,901 low. It is now facing resistance near the $1,938 and $1,940 levels. The next major resistance is near the $1,950 level, above which Gold could revisit the key $1,965 resistance zone.
On the downside, the price might find support near the $1,925 level and the 100 Simple Moving Average (red, 4 hours). The next key support is near $1,920 and the 200 Simple Moving Average (green, 4 hours).
If the bulls fail to protect the $1,920 support, there is a risk of a major decline. In the stated case, the price could decline toward the $1,900 level.
Looking at crude oil prices, there was a sustained upward move, and the price even broke the $92.50 resistance zone.
Economic Releases to Watch Today
- UK Consumer Price Index for August 2023 (YoY) – Forecast +7.1%, versus +6.8% previous.
- UK Core Consumer Price Index for August 2023 (YoY) – Forecast +6.8%, versus +6.9% previous.
- Fed Interest Rate Decision - Forecast 5.5%, versus 5.5% previous.