Sample Category Title
Markets Cautious Ahead Of Central Bank Decisions
Investors will likely remain cautious ahead of a week packed with key data and policy decisions from major central banks.
Asian shares declined on Tuesday as concerns about the Chinese property sector hit risk appetite. This negative sentiment, coupled with overall caution was reflected in European markets this morning. In the currency space, the dollar is drawing some support from the tense mood while in the commodity arena, Brent touched $95 and gold retreated from a two-week high.
Fed decision in focus
The Federal Reserve is widely expected to leave interest rates unchanged at 5.25 - 5.50% at this week’s meeting. However, much focus will be on what clues the economic projections, dot plots, and Jerome Powell's press conference offer on future rate hikes. The key question is whether the updated dot plot will still forecast one more 25-basis point rate hike this year. As of writing, traders are currently pricing in a 32% probability of a 25-basis point hike by November with this jumping to 47% by December.
Currency spotlight – GBPUSD
It could be especially volatile for GBPUSD which has to contend with the Fed/UK CPI/BoE combo over the space of 30 hours.
The day before the BoE decision, the latest UK inflation figures will be published with economists forecasting CPI to rise 7.0%, up from the July print of 6.8%. Core inflation is projected to cool 6.8% year-on-year, down from 6.9% in the previous month.
Markets widely expect the BoE to raise interest rates by 25-basis points, marking the 15th straight hike and taking the key rate to 5.5%. The main question is whether this will be the final rate hike as policymakers weigh sticky inflation against stagnant economic growth.
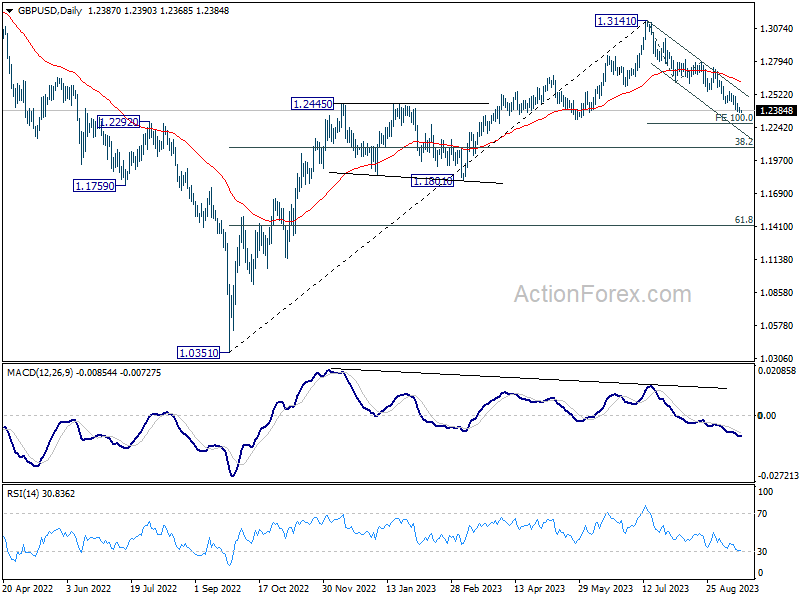
Talking technicals, GBPUSD remains under pressure on the daily charts with 1.2430 acting as a key level of interest.
S&P 500 Under Pressure ahead of Federal Reserve Meeting
The decision on the base interest rate will be published tomorrow at 21:00 GMT+3, and Powell will hold a press conference at 21:30. Although most experts, as reported by the media, expect that the current rate will remain, market participants will closely monitor the Federal Reserve's assessment of the current situation, which includes new data on inflation and the labour market. It is possible that there will be another rate increase before the end of the year.
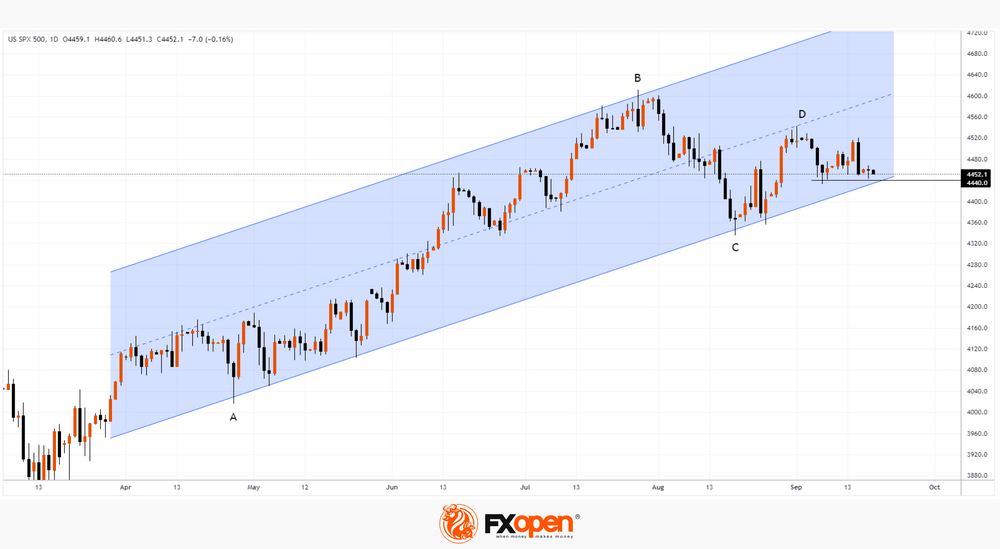
Meanwhile, the S&P 500 chart shows the market under pressure in mid-September, although the overall picture appears balanced.
The balance of supply and demand is indicated by the fact that the movement B→C is approximately 50% of the movement A→B. And the C→D movement is approximately 50% of the B→C movement. That is, fluctuations die out as buyers and sellers converge.
The price is still within the ascending channel (shown in blue), but it is possible that during tomorrow's news announcement from the Federal Reserve there will be an attempt by the bears to break through it.
Bearish arguments:
→ On August 31 - September 1, on the CME exchange, where E-mini futures for the S&P 500 index are traded, volumes below average were recorded, after which the price decreased with an increase in volumes on September 6 — this can be interpreted as if above 4,560 the market is experiencing a shortage of demand. And the revival of the market with a decrease in price is a sign of bearish sentiment.
→ Level 4,560 was tested last week, on Thursday. After which there was a sharp decline with an increase in volume on Friday. Similar dynamics indicating that the market is under bearish pressure ahead of the meeting.
If the pressure leads to a new downward impulse, the 4,440 level could become resistance for the bulls' attempts to return the price to the ascending channel.
This article represents the opinion of the Companies operating under the FXOpen brand only. It is not to be construed as an offer, solicitation, or recommendation with respect to products and services provided by the Companies operating under the FXOpen brand, nor is it to be considered financial advice.
Cryptocurrency Prices Rise on SEC Rumours
Various media outlets report the opinion that SEC Chairman Gary Gensler expressed in a personal conversation. He allegedly intends to approve applications for the creation of ETFs related to the cryptocurrency spot markets. Such applications were submitted by BlackRock, Invesco, WisdomTree, Valkyrie and other respectable funds. But for now, the SEC's decision on the applications has been delayed.
At the same time, it is reported that by giving the go-ahead to applications, Gary Gensler can thereby gain loyalty from the funds, and after the end of his period as head of the SEC, go to work for one of them.
Against the backdrop of the information mentioned, the crypto markets perked up — the prices of bitcoin, Ether and other assets rose by approximately 3% in a few hours. However, it is unlikely that such rumors can become a driver for creating a sustainable trend.
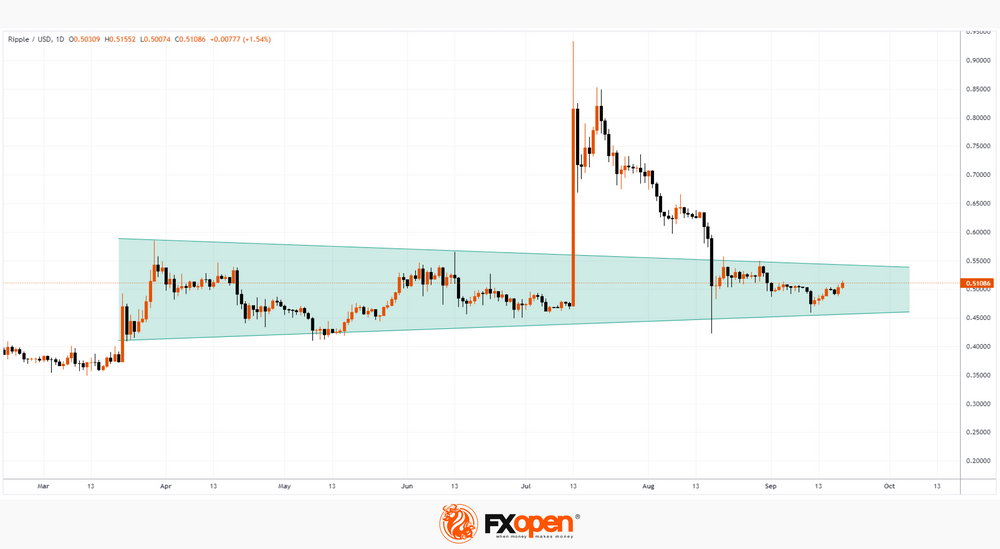
Pay attention to the XRP/USD chart. After the court ruling in favour of Ripple Labs in a dispute with the SEC, the price of the XRP token soared to 0.9. However, when the strong positive emotions dissipated, the price of the token again returned to the area from which it took off. At the same time, at the moment the price even dropped below that area, piercing the level of 0.45 (constituting about 50% of the price recorded at the peak of growth), which probably led to the activation of a large number of stop losses set under the wide bullish candle.
This course of events indicates that, under the influence of faith, hope and news, the price of an exchange asset can make significant deviations from its fair intrinsic value. But when the momentum fades, the pendulum will swing in the opposite direction, which is quite clearly evident in the cryptocurrency markets.
Regarding XRP/USD, the price of the token may continue its consolidation movement within the triangle shown in green. Perhaps the half-dollar level for XRP is close to the current fair value of the asset.
This article represents the opinion of the Companies operating under the FXOpen brand only. It is not to be construed as an offer, solicitation, or recommendation with respect to products and services provided by the Companies operating under the FXOpen brand, nor is it to be considered financial advice.
EUR/USD Daily Outlook
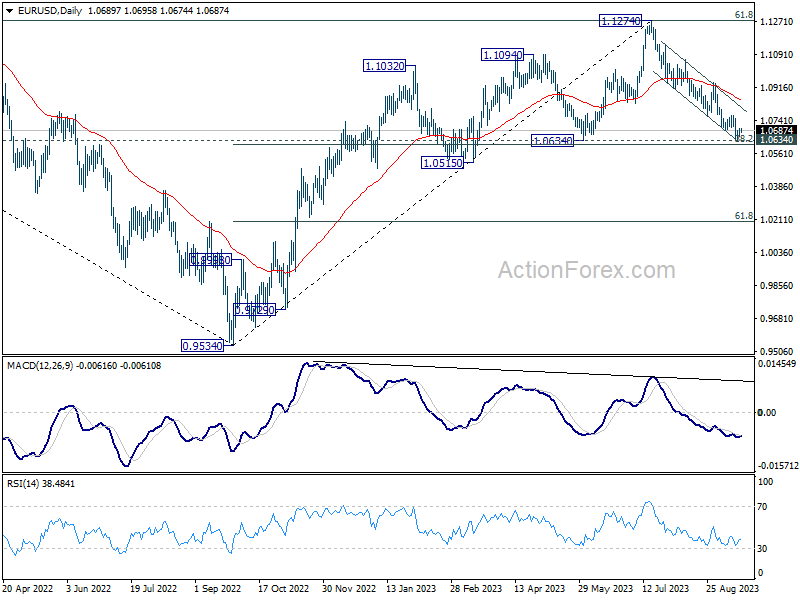
Daily Pivots: (S1) 1.0666; (P) 1.0682; (R1) 1.0710; More...
Intraday bias in EUR/USD remains neutral at this point. Strong rebound from current level, followed by break of 1.0767 resistance, should confirm short term bottoming. Intraday bias will be back on the upside for 1.0944 resistance. However, sustained break of 1.0609/34 support zone will carry larger bearish implication, and target 1.0515 support next.
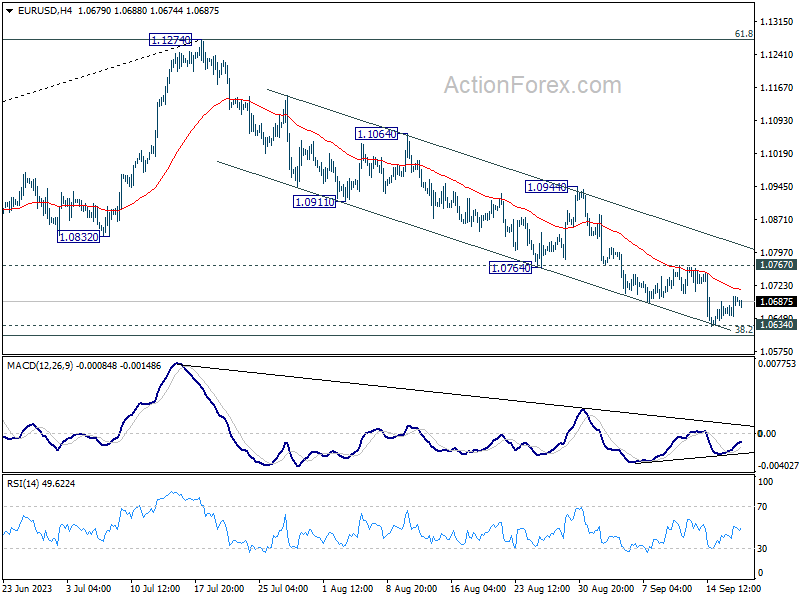
In the bigger picture, fall from 1.1274 medium term top is seen as a correction to up trend from 0.9534 (2022 low). Strong support could be seen from 1.0634 cluster support (38.2% retracement of 0.9534 to 1.1274 at 1.0609) to bring rebound, at least on first attempt. However, sustained break of 1.0609/0634 will raise the chance of bearish trend reversal, and target 61.8% retracement at 1.0199.
GBP/USD Daily Outlook
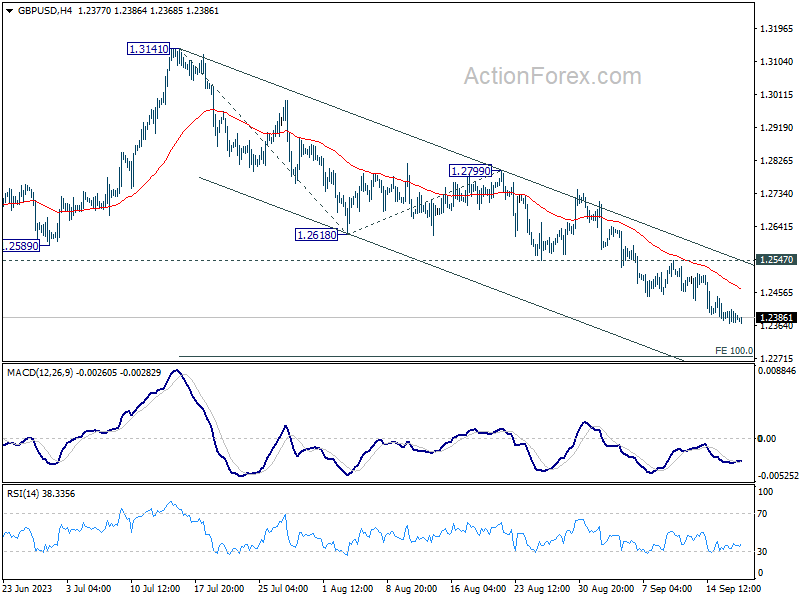
Daily Pivots: (S1) 1.2367; (P) 1.2389; (R1) 1.2407; More...
Intraday bias in GBP/USD remains on the downside for the moment. Current fall from 1.3141 is in progress for 100% projection of 1.3141 to 1.2618 from 1.2799 at 1.2276. On the upside, though, firm break of 1.2547 resistance will now indicate short term bottoming, and bring stronger rebound.
In the bigger picture, fall from 1.3141 medium term top is seen as a correction to up trend from 1.0351 (2022 low). Deeper decline would be seen to 38.2% retracement of 1.0351 to 1.3141 at 1.2075. Strong support would be seen there to bring rebound on first attempt. However, sustained break of 1.2075 will raise the chance of bearish trend reversal.
USD/CHF Daily Outlook
Daily Pivots: (S1) 0.8955; (P) 0.8969; (R1) 0.8984; More....
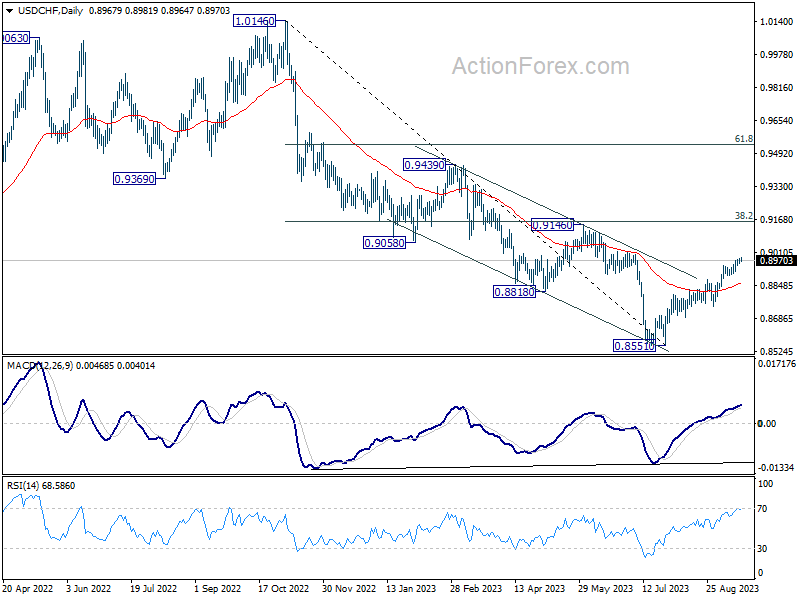
Intraday bias in USD/CHF stays on the upside for the moment. Current rise from 0.8551 is in progress for 0.9146 cluster resistance. On the downside, however, break of 0.8893 support will argue that a short term top is possibly formed, and turn bias back to the downside for 55 D EMA (now at 0.8858).
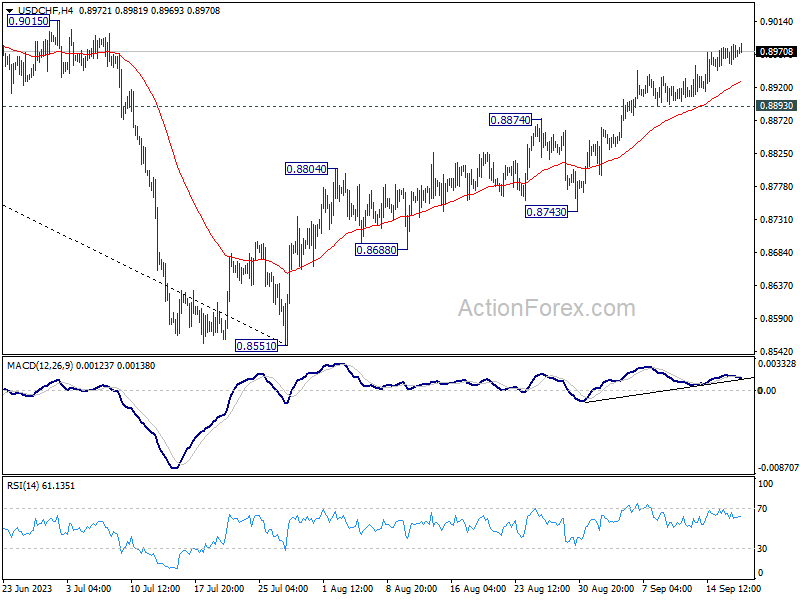
In the bigger picture, rebound from 0.8551 medium term bottom is currently seen as a correction to the downtrend from 1.0146 (2022 high). Further rally would be seen to 0.9146 cluster resistance (38.2% retracement of 1.0146 to 0.8551 at 0.9160). Strong resistance could be seen there to limit upside, at least on first attempt.
USD/JPY Daily Outlook
Daily Pivots: (S1) 147.48; (P) 147.68; (R1) 147.80; More...
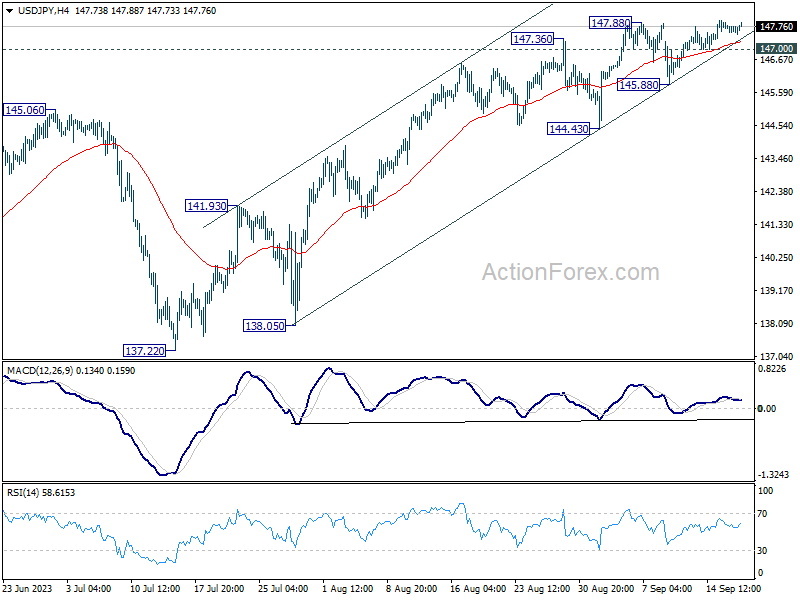
Intraday bias in USD/JPY stays mildly on the upside despite loss of momentum. Current rise is part of the whole rally from 127.20, and should target 151.93 high. On the downside, below 147.00 minor support will turn intraday bias neutral again first. But outlook will remain bullish as long as 145.88 support holds.
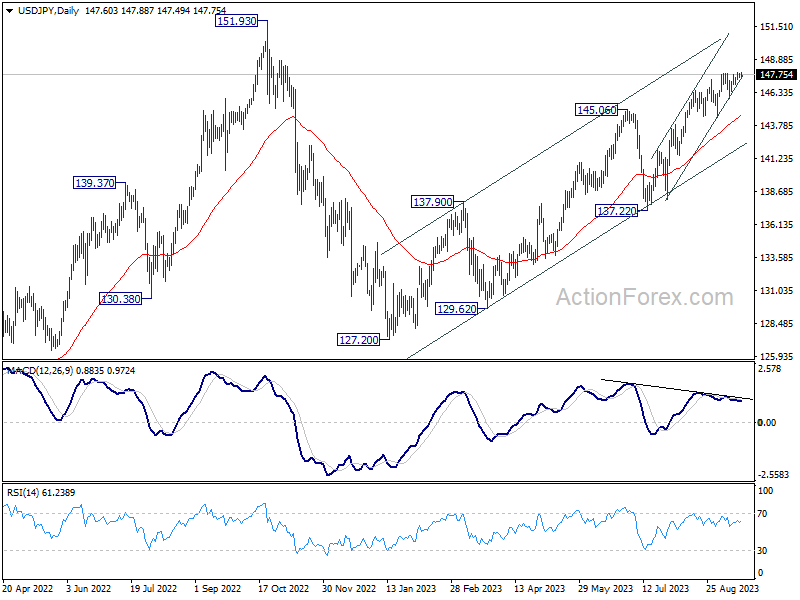
In the bigger picture, while rise from 127.20 is strong, it could still be seen as the second leg of the corrective pattern from 151.93 (2022 high). Rejection by 151.93, followed by break of 137.22 support will indicate that the third leg of the pattern has started. However, sustained break of 151.93 will confirm resumption of long term up trend.
ECB’s Villeroy advocates for sustained 4% deposit rate to counter inflation
In an interview with BFM television, ECB Governing Council member Francois Villeroy de Galhau emphasized the pivotal role of interest rates in curbing inflation, which he starkly referred to as a "disease." Drawing a clear line of action against inflationary pressures, he advocated for maintaining a firm grip on the existing measures.
Villeroy underscored the effectiveness of the current strategy by stating, "Inflation is a disease and rates are the medicine. The medicine is starting to work." T
Diving into specifics, he highlighted the appropriateness of the 4% deposit rate level, voicing his opinion that this rate should be upheld for a "sufficiently long time" to ensure that it effectively counters inflationary trends.
Looking to the future, Villeroy elucidated that once the inflation rate cools down to hover around 2% target, it would then be feasible to consider a reduction in ECB rate.
GBPUSD Drops to Fresh 3-month Low
- GBPUSD in a steady decline since mid-July
- Records consecutive multi-month lows and falls below the 200-day SMA
- Given that momentum indicators approach oversold conditions, can the price bounce back?
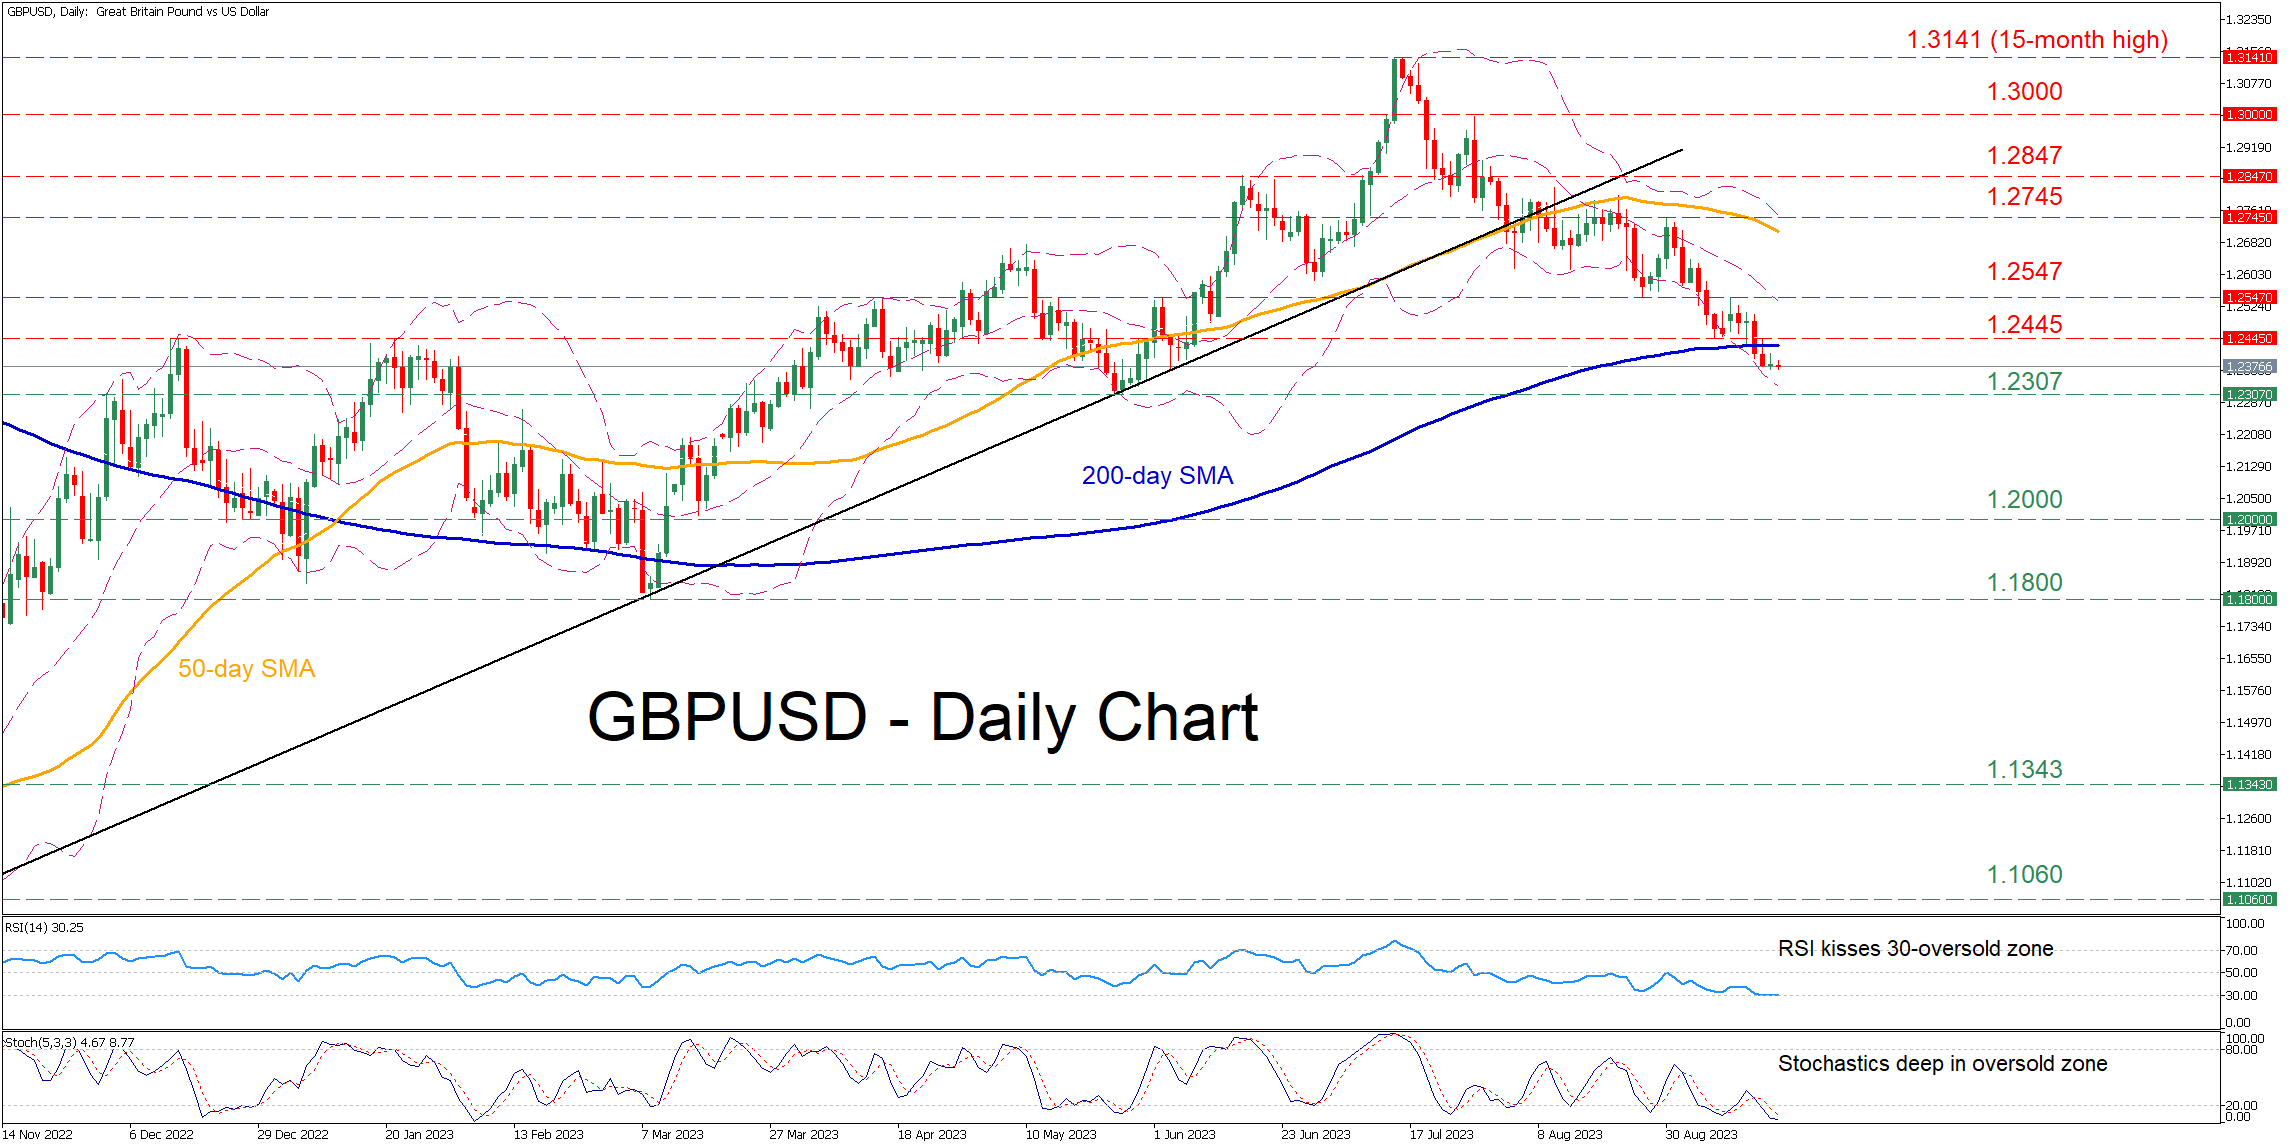
GBPUSD has been forming a structure of lower highs and lower lows since its 15-month peak of 1.3141. Meanwhile, the RSI is touching its 30-oversold mark and the stochastic oscillator is within its 20-oversold territory, both suggesting that the recent decline might be overstretched.
Should the bulls re-emerge and push the price higher, the pair could face the December-January resistance zone of 1.2445, which also served as support in September 2023. A violation of that zone could trigger an advance towards 1.2547. Even higher, the August resistance of 1.2745 may cap further upside attempts.
On the flipside, if the downtrend extends, the May bottom of 1.2307 could act as the first line of defense. Sliding beneath that floor, the price might slide towards the 1.2000 psychological mark. Should that floor collapse, the spotlight could turn to the March low of 1.1800.
In brief, GBPUSD seems to be in a relentless decline, but its end could be approaching as the pair has reached oversold conditions. Hence, traders should not rule out an impending bounce, which could initially bring the 200-day simple moving average (SMA) under scrutiny.
USD/CAD Daily Outlook
Daily Pivots: (S1) 1.3462; (P) 1.3496; (R1) 1.3519; More....
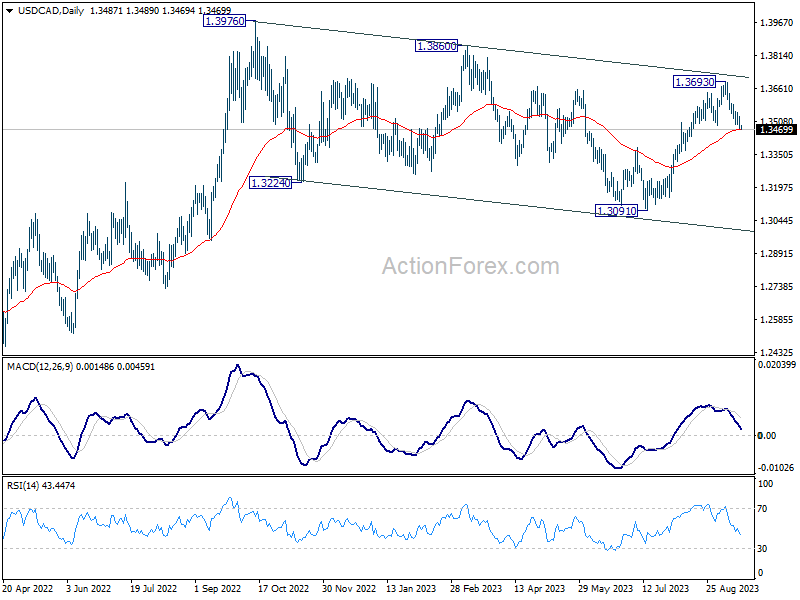
USD/CAD's break of 1.3488 support argues that rise from 1.3091 might have completed at 1.3693. Intraday bias is mildly on the downside at this point. Sustained trading below 55 D EMA (now at 1.3467) will target 61.8% retracement of 1.3091 to 1.3693 at 1.3321, as another leg of the corrective pattern from 1.3976. Nevertheless, break of 1.3693 will revive near term bullishness for 1.3860/3876 resistance zone.
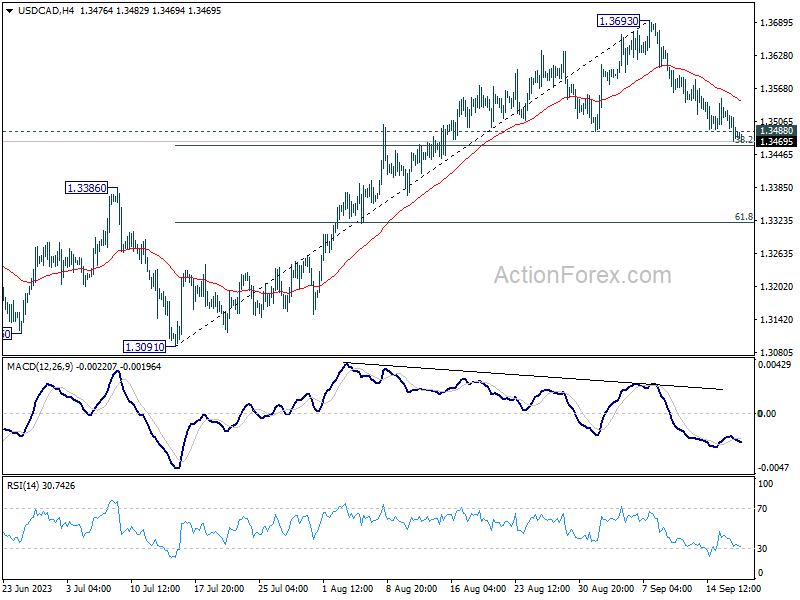
In the bigger picture, price actions from 1.3976 are viewed as a corrective pattern. Strong support from 55 D EMA (now at 1.3467) will solidify the case that it has completed with three waves down to 1.3091 already. Break of 1.3976 will target 61.8% projection of 1.2005 to 1.3976 from 1.3091 at 1.4309. However, sustained break of 55 D EMA will indicate that the pattern is extending with another falling leg before completion.