Sample Category Title
Asian Markets Tilt Cautious, Canada CPI Watched
Asian markets manifested mild risk-off sentiments today, with Nikkei weighing down the broader region. As Japanese investors made their way back from an extended holiday weekend, notable sell-off in chip stocks took place. This reaction was prompted by reports that Taiwan's premier chipmaker, TSMC, had requested its major vendors to postpone deliveries. Adding to the mix, there's speculation that Japanese investors are aligning their portfolios in anticipation of a possible hawkish shift by BoJ set for this Friday. However, before that unfolds, other significant determinants remain, particularly FOMC rate decision and economic forecasts due tomorrow.
As of now, Canadian Dollar stands out as the dominant performer, with market participants keenly waiting on Canada's CPI data, wherein another uptick in headline figures is widely anticipated. The prospect of another rate hike by the BoC later this year largely depends on the magnitude and endurance of inflationary forces, with a special focus on the services sector. Meanwhile, Dollar attempts a rally, though it lacks firm backing. Euro and Yen are trailing as the day's laggards, with Sterling not far behind. Australian Dollar portrays a mixed picture post the release of RBA minutes.
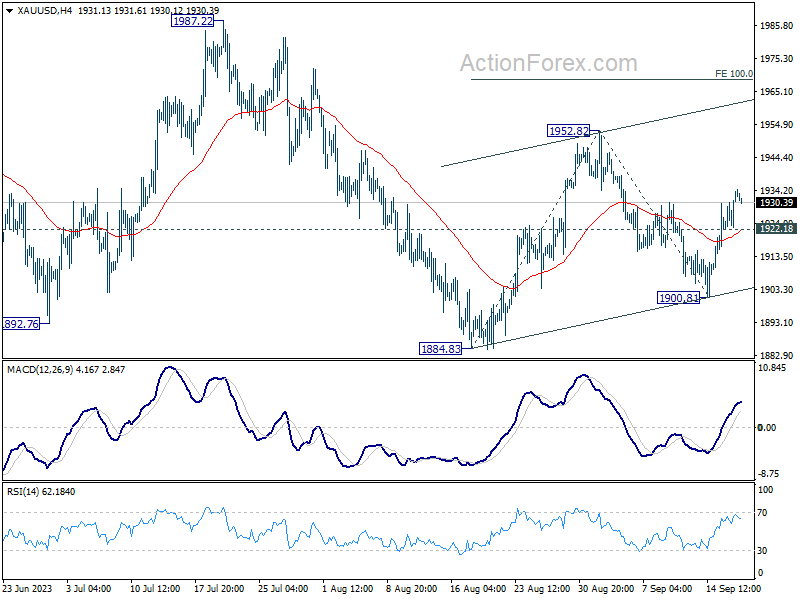
Following up on Gold, the break of 1930.56 resistance is a tentative sign that rise from 1884.83 is resume to resume. Further rally is now mildly in favor to 1952.82 resistance first. Firm break there will target 100% projection of 1884.83 to 1952.82 from 1900.81 at 1968.80 in the near term. Nevertheless, break of 1922.18 minor support will dampen this bullish case. Critical insights into Gold's next direction could emerge in the next 48 hours, which will also serve to validate any movements in Dollar, as is traditionally observed.
In Asia, Nikkei closed down -1.07%. Hong Kong HSI is down -0.16%. China Shanghai SSE is down -0.15%. Singapore Strait Times is down -0.65%. Japan 10-year JGB yield is up 0.0077 at 0.718. Overnight, DOW rose 0.02%. S&P 500 rose 0.07%. NASDAQ rose 0.01%. 10-year yield dropped -0.003 to 4.319.
RBA minutes flag risks on growth, consumption and China
RBA's meeting held on September 5, the minutes revealed that officials weighed two courses for monetary policy: increasing cash rate target by 25 bps or standing pat.
After a thorough consideration of the prevailing economic circumstances, members resolved that maintaining the current cash rate was the more compelling choice, highlighting the necessity to allot more time to gauge the comprehensive impacts of monetary policy tightening enacted since May 2022. This consensus is grounded in an understanding of the substantial delays that characterize transmission of policy repercussions through the economy.
Amid these considerations, members also highlighted potential risks. Specifically, there were concerns regarding the possibility that "the economy could slow more sharply than forecast." Factors like potentially weaker consumption and mounting downside risks to the Chinese economy were flagged.
However, the minutes reflected a cautiously optimistic tone, with members deducing that "recent developments had not materially altered the outlook." The general consensus remained that the economy still seems to be on a balanced path where inflation is poised to return to the target range, and employment growth is anticipated to sustain its momentum.
Canada's CPI looms, can CAD/JPY sustain bullish momentum?
Today, eyes are on Canada's CPI data, with projections pointing towards an uptick. Expectations peg the headline inflation at 3.8% yoy, an increase from July's 3.3% yoy. Should this materialize, it would represent a consecutive monthly acceleration, with inflation rate soaring to its pinnacle since April, and significantly surpassing BoC's 2% target. Nevertheless, monthly CPI growth is projected at 0.2% mom, decelerating from the previous 0.6% mom noted in July.
The inflation surge in August is attributed to an interplay of base effects paired with escalating energy prices. Yet, the most pronounced upside risks are to stem from an array of service prices. The spotlight will undeniably be on the core inflation metrics. Also, a surge in three-month inflation will naturally amplify the likelihood of another rate hikes by BoC, potentially as proximate as October.
BoC's Governor, Tiff Macklem, elucidated the bank's stance in a September 7 speech, stating that while "monetary policy may be sufficiently restrictive", the bank aspires to witness "less-generalized price increases" alongside a dip in the average price rise. Failing to observe such a trend might compel the bank to contemplate elevating the policy rate again, particularly if inflationary tendencies persist.
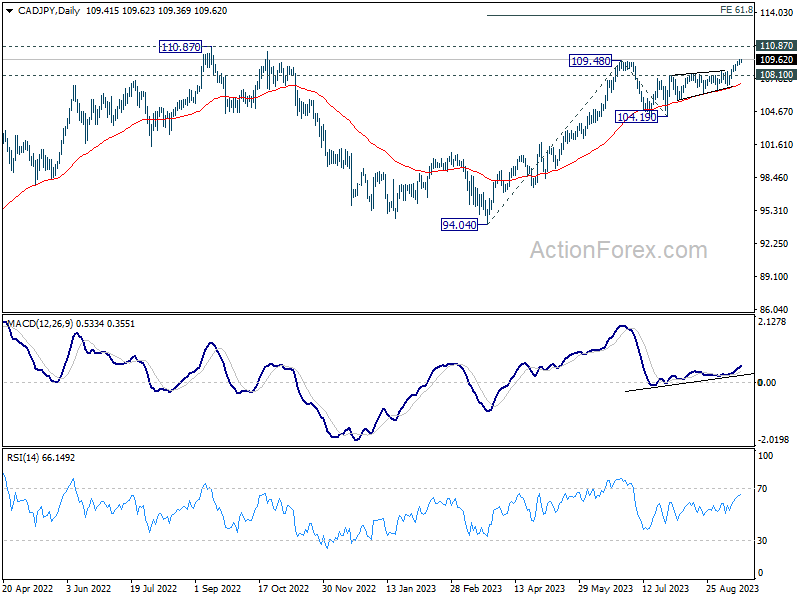
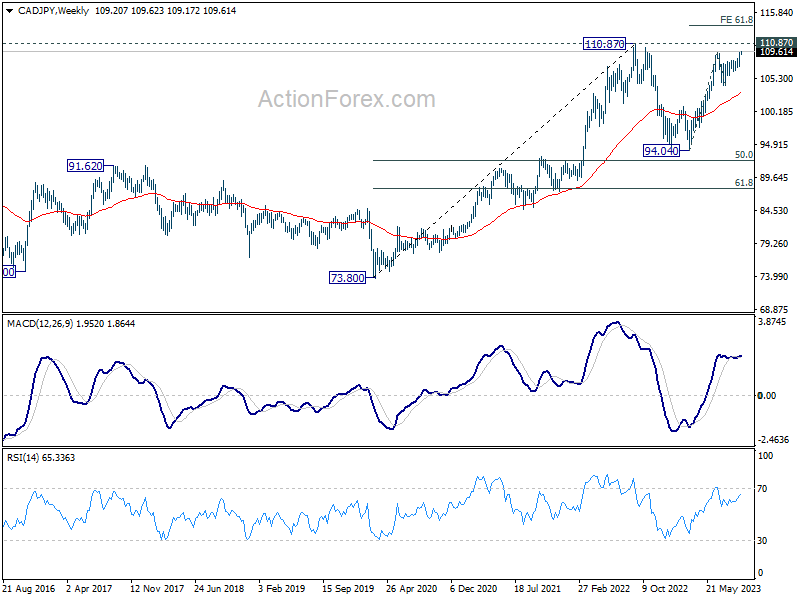
On the currency front, the Canadian Dollar has showcased commendable strength this month, propelled by a spike in oil prices. CAD/JPY's break of 109.46 resistance this week argues that rise from 94.04 is resuming for a test on 110.87 key resistance (2022 high). Firm break there will confirm larger up trend resumption. Next target will be 61.8% projection of 94.04 to 109.48 from 104.19 at 113.73. In any case, near term outlook will stay bullish as long as 108.10 resistance turned support holds.
Looking ahead
Eurozone CPI final will be released in European session. In the US session, US will release building permits and housing starts. Canada CPI will be the main focus.
EUR/GBP Daily Outlook
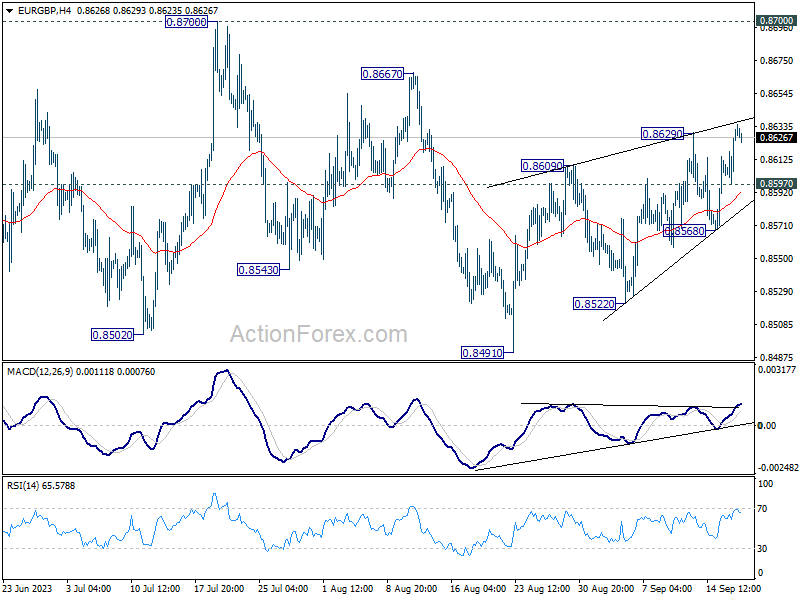
Daily Pivots: (S1) 0.8610; (P) 0.8622; (R1) 0.8645; More...
EUR/GBP's rebound from 0.8491 resumed by breaking 0.8629 and intraday bias is back on the upside. This rise is seen as the third leg of the corrective pattern from 0.8502. Upside should be limited by 0.8667/8700 resistance zone. On the downside, below 0.8597 minor support will turn intraday bias neutral first. Further break of 0.8568 support will turn bias back to the downside for retesting 0.8491 low.
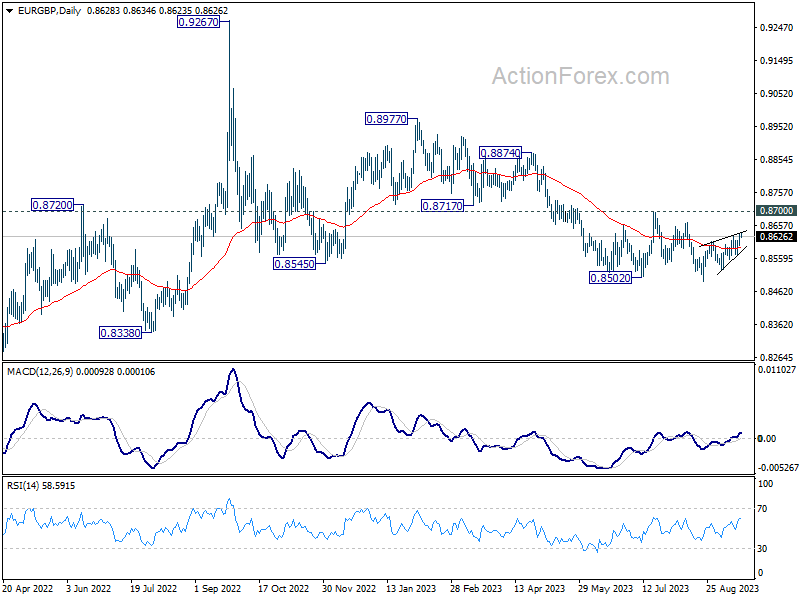
In the bigger picture, the down trend from 0.9267 (2022 high) is seen as part of the long term range pattern from 0.9499 (2020 high). Fall from 0.8977 is seen as the third leg. As long as 0.8700 resistance holds, further decline is still expected. Break of 0.8491 will resume the fall towards 0.8201 (2022 low). Nevertheless, firm break of 0.8700 will now be a sign of bullish reversal.
Economic Indicators Update
| GMT | Ccy | Events | Actual | Forecast | Previous | Revised |
|---|---|---|---|---|---|---|
| 01:30 | AUD | RBA Minutes | ||||
| 06:00 | CHF | Trade Balance (CHF) Aug | 4.23B | 3.13B | ||
| 08:00 | EUR | Current Account (EUR) Jul | 30.2B | 35.8B | ||
| 09:00 | EUR | Eurozone CPI Y/Y Aug F | 5.30% | 5.30% | ||
| 09:00 | EUR | Eurozone CPI Core Y/Y Aug F | 5.30% | 5.30% | ||
| 12:30 | USD | Building Permits Aug | 1.45M | 1.44M | ||
| 12:30 | USD | Housing Starts Aug | 1.44M | 1.45M | ||
| 12:30 | CAD | CPI M/M Aug | 0.20% | 0.60% | ||
| 12:30 | CAD | CPI Y/Y Aug | 3.80% | 3.30% | ||
| 12:30 | CAD | CPI Median Y/Y Aug | 3.70% | 3.70% | ||
| 12:30 | CAD | CPI Trimmed Y/Y Aug | 3.50% | 3.60% | ||
| 12:30 | CAD | CPI Common Y/Y Aug | 4.80% | 4.80% |
RBA Board Minutes Show It Considered A Rate Hike in September
The Board considered both options but the case for on hold was clearly stronger. The Board is maintaining its options to hike again if inflation surprises to the upside.
The Minutes for the September meeting show that the Reserve Bank Board continued to consider two policy options.
The options are whether to hold the cash rate steady or to lift it by 0.25%.
As recently as June, the Board had described the final decision as “finely balanced”. It is now describing the decision in terms of a clear winner: “in weighing up the two options, members agreed that the case to keep the cash rate target unchanged at this meeting was the stronger one.” This choice of “stronger argument” has now been used since the July meeting when the Board first went on hold.
Since late last year the Board has considered its decision in the context of two issues. Firstly, to raise the cash rate due to concerns about taking more time than planned to return inflation to the target; or secondly, to hold steady because policy had already been tightened substantially, there were signs that the economy was slowing, conditions in the labour market were easing and inflation was coming down.
Whereas the former argument prevailed in May and June, the latter argument has now prevailed for the last three months and looks like being sustained for the remainder of the cycle.
The latter arguments are clearly to the fore in the September Minutes and it seems likely that the discussion around raising rates would have been quite short.
The Minutes also address the argument that Australia’s cash rate is too low relative to other countries: “Members noted that the average outstanding mortgage rate in Australia was now higher than in several other peer economies, despite the policy rate in Australia being somewhat lower; this reflects the higher share of variable-rate mortgages in Australia and shorter maturity of fixed rate loans.” This is a clear rebuttal to those analysts that argue that the RBA’s cash rate must rise to align with other developed countries, including the US, where the rate is 5.375% – well above Australia’s 4.1%.
But despite these clear arguments, the Board still concludes that “some further tightening in policy may be required should inflation prove more persistent than expected.” This statement compares with August: “members agreed that it was possible that some further tightening of monetary policy might be required to ensure that inflation returns to target in a reasonable timeframe.”
That approach leaves the Board with options in the event of some unexpected and sustained lift in inflation, certainly putting the Q3 CPI report right to the fore. The Monthly CPI Indicators will also play a role in the decision but are unlikely to trigger a rate hike without confirmation from the quarterly report.
Based on our own forecasts, and the clear tone of the Minutes, we expect that the “hurdle” for an inflation induced rate hike at the November meeting is quite high.
It is also advantageous of the Board to maintain the tightening option to support the AUD. The sharp deterioration in the AUD over the last month is already putting some pressure on domestic fuel prices and further falls in AUD would be unhelpful to the Board.
Westpac maintains its call that the cash rate will remain on hold until the easing cycle can begin from the August meeting next year.
It is interesting that markets currently have around a 40% chance of another rate hike in this cycle and have now delayed their timing of the first cut to well beyond our August target.
Technical Outlook and Review
DXY:
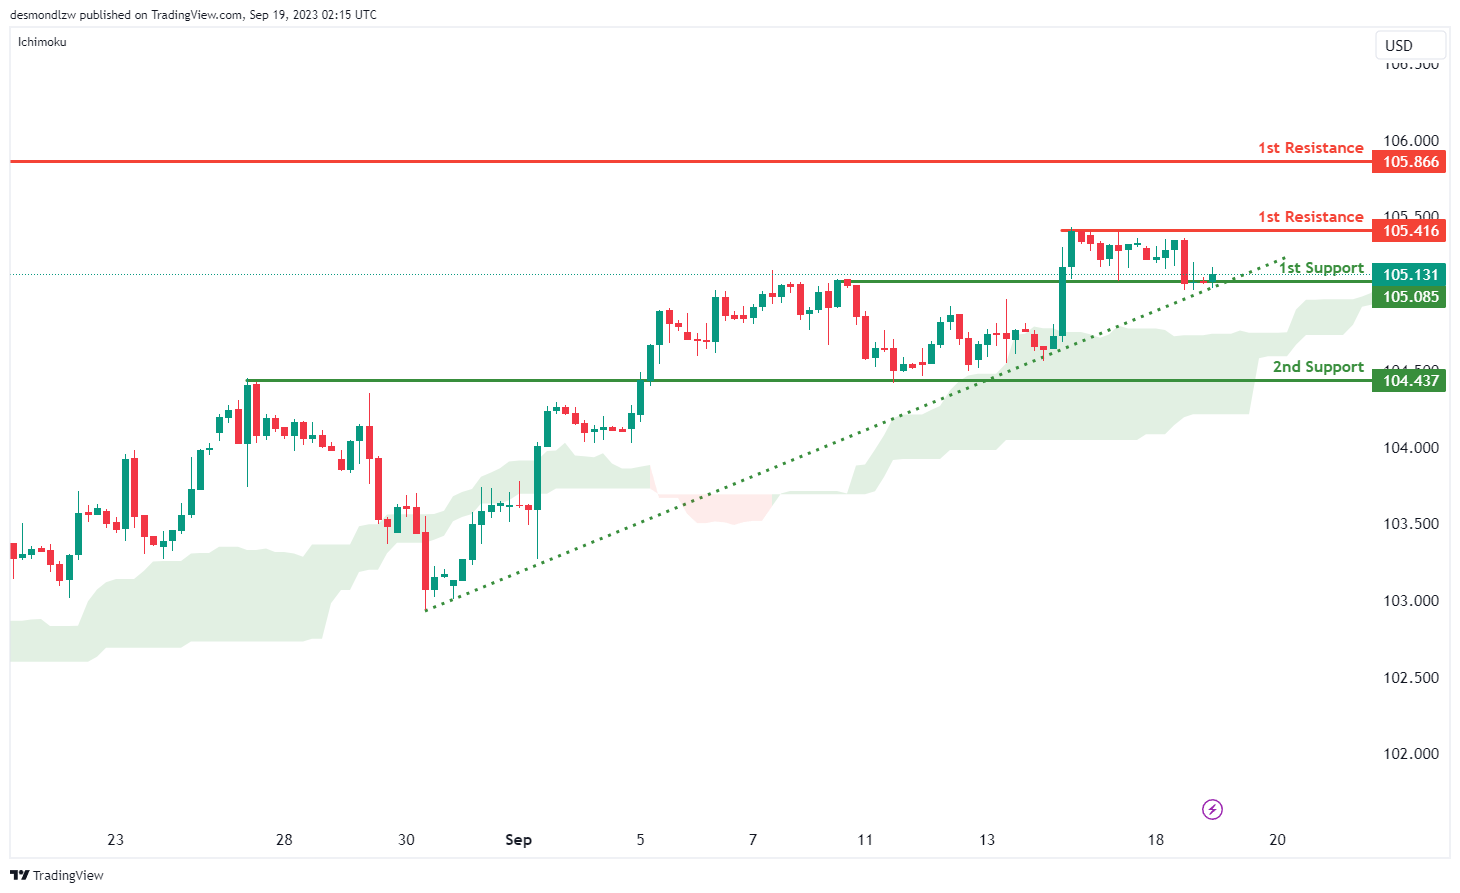
The DXY (US Dollar Index) chart currently demonstrates a robust bullish momentum, buoyed by several key factors that contribute to its upward trajectory. Notably, the price maintains its position above a significant ascending trend line, signaling the potential for further bullish momentum and reinforcing the overall positive sentiment.
Additionally, the chart has recently crossed above the Ichimoku cloud, further confirming the bullish outlook. Within this context, there is a plausible scenario where the price may experience a bullish bounce upon reaching the 1st support level at 105.13, subsequently moving towards the 1st resistance at 105.41. The 1st support level holds substantial significance, classified as an overlap support, indicating its historical relevance as a potential strong support zone. Similarly, the 2nd support at 104.43 is also identified as an overlap support, underlining its role as a key support level.
On the resistance side, the 1st resistance at 105.41 assumes a pivotal role as a multi-swing high resistance, signifying its importance as a potential barrier for further upward movements. Beyond the 1st resistance, the 2nd resistance at 105.87 is categorized as a swing high resistance, highlighting its potential significance as a resistance point. With the chart’s overall bullish momentum,
EUR/USD:
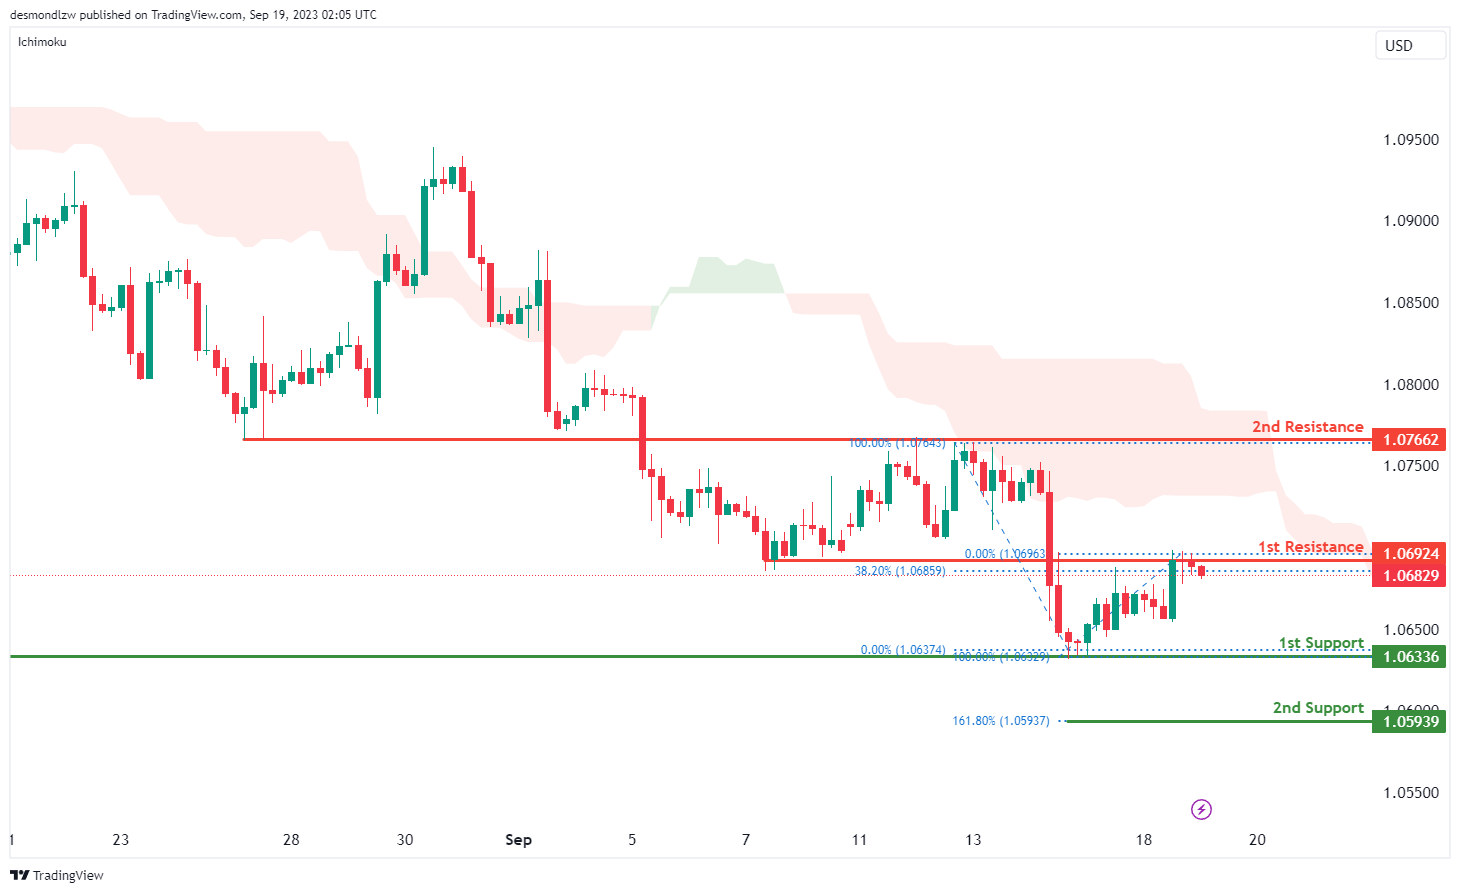
The EUR/USD chart is currently characterized by a bearish momentum, influenced by key factors that contribute to its downward trajectory. Notably, the price resides below the bearish Ichimoku cloud, underlining the overall bearish sentiment and suggesting the potential for further downward movement.
In this context, there’s a plausible scenario where the price may encounter a bearish reaction upon reaching the 1st resistance level at 1.0692, followed by a potential decline towards the 1st support at 1.0633. The 1st support level holds significance as an overlap support, signifying its historical relevance as a potential strong support zone. Similarly, the 2nd support at 1.0593 is characterized by the presence of the 161.80% Fibonacci Extension, further emphasizing its role as a key support level.
On the resistance side, the 1st resistance at 1.0692 is a critical juncture, classified as an overlap resistance and aligning with the 38.20% Fibonacci Retracement, underscoring its potential as a barrier to any potential upward movements. Beyond the 1st resistance, the 2nd resistance at 1.0766 is also identified as an overlap resistance, further highlighting its significance. With the chart’s overall bearish momentum
EUR/JPY:
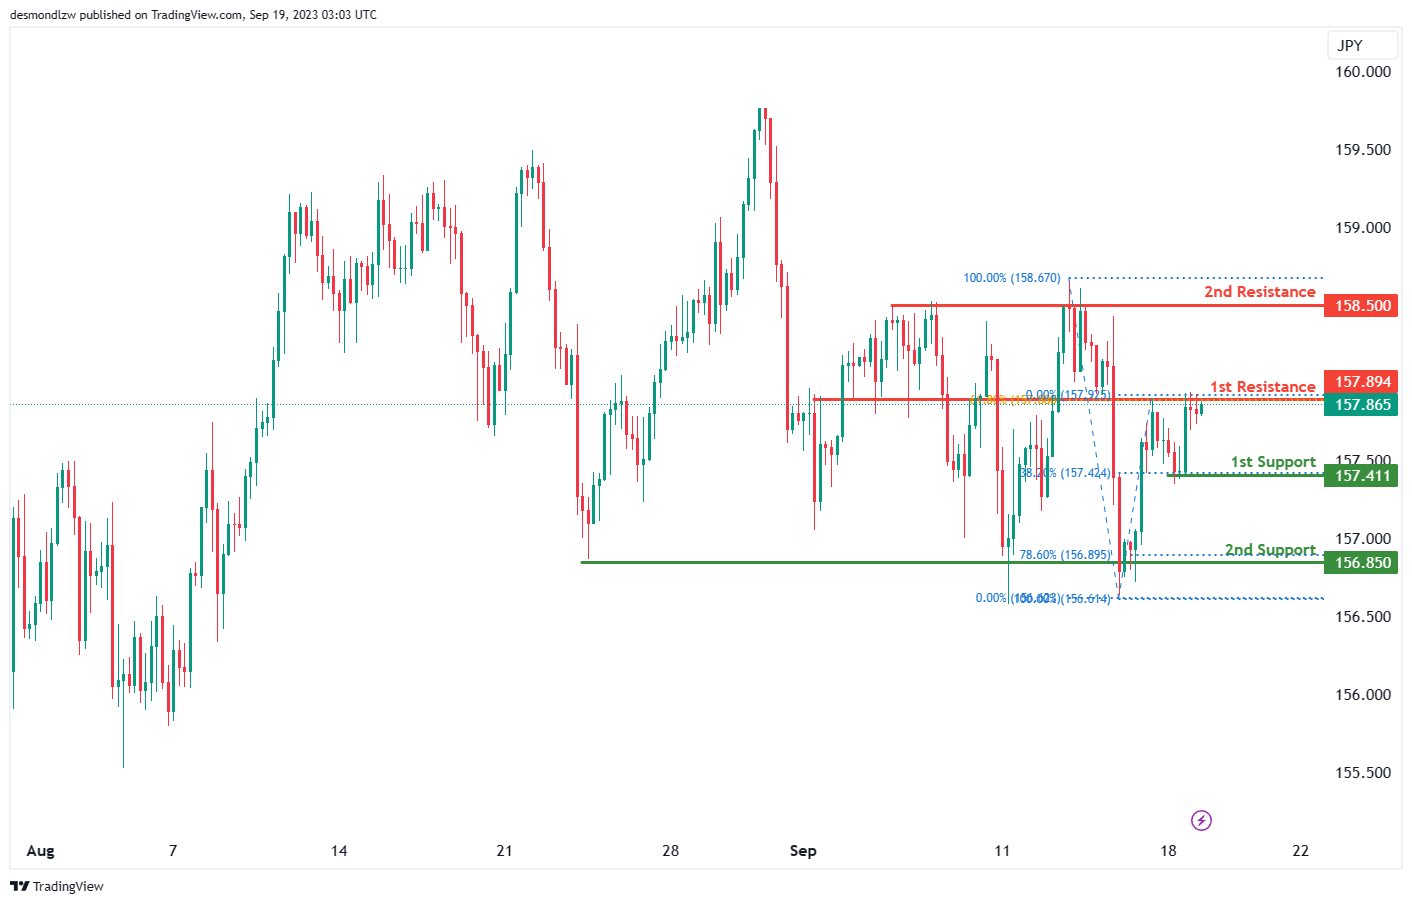
For EUR/JPY, the overall momentum of the chart is currently bearish, indicating a downward trend.
There is a potential for the price to react bearishly off the 1st resistance level at 157.89. This resistance level is considered significant as it represents an overlap resistance and aligns with the 61.80% Fibonacci Retracement level, indicating strong potential resistance at this confluence level.
If the bearish momentum continues, the 1st support level at 157.41 is noteworthy. This support level is characterized as a swing low support and is supported by the 38.20% Fibonacci Retracemen.
Further down, the 2nd support level at 156.85 is also notable as it represents a multi-swing low support and aligns with the 78.60% Fibonacci Retracement. It could act as additional support if the price continues to decline.
EUR/GBP:
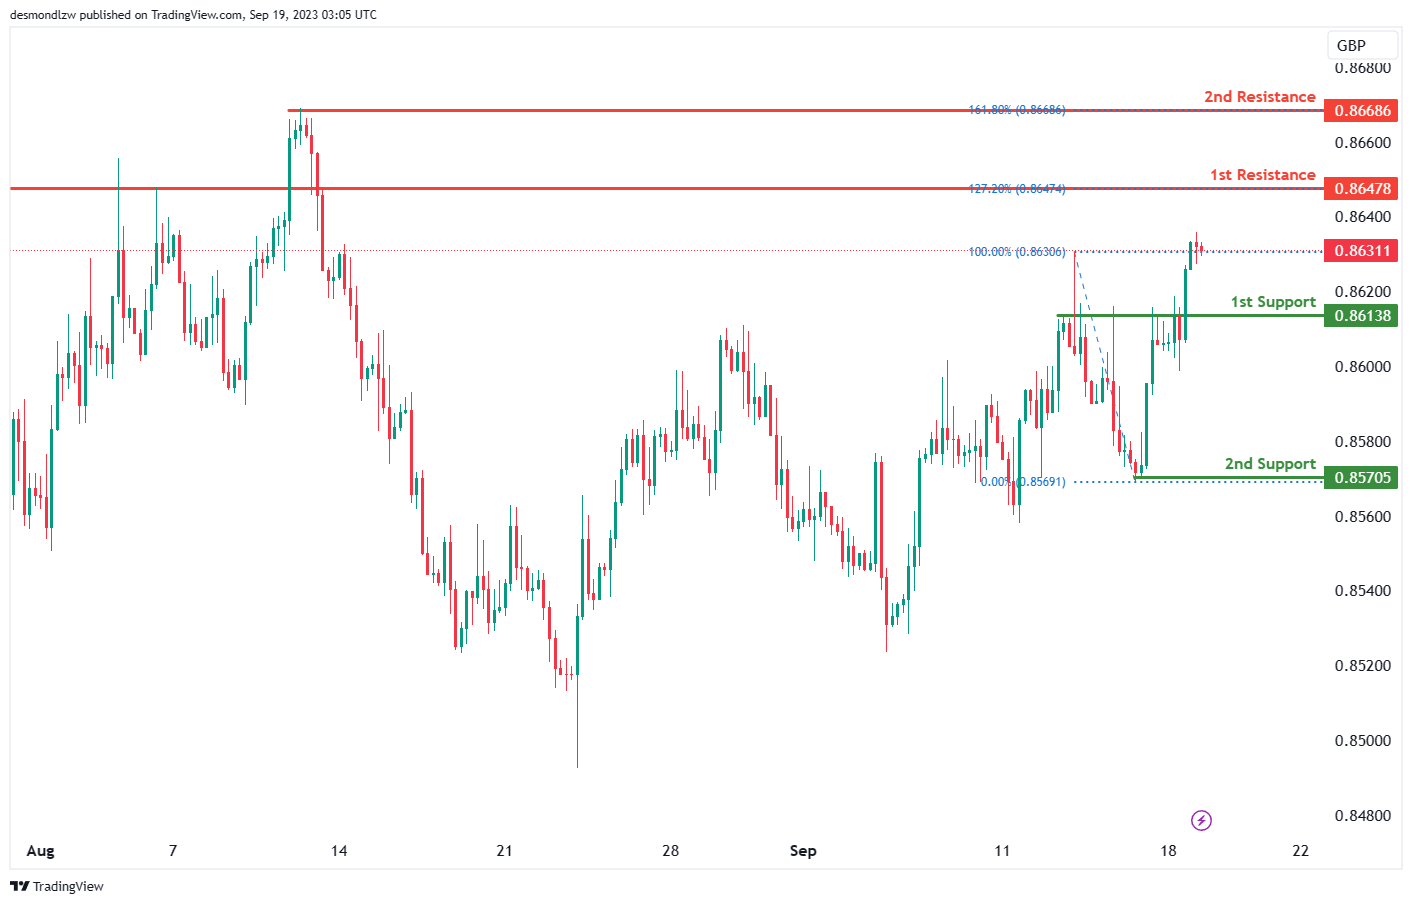
For EUR/GBP, the overall momentum of the chart is currently bullish, indicating an upward trend.
There is a potential for the price to continue its bullish momentum towards the 1st resistance level at 0.8647. This resistance level is considered significant as it represents a pullback resistance and aligns with the 127.20% Fibonacci Extension, suggesting a strong potential resistance area.
If the bullish momentum continues, the 2nd resistance level at 0.8668 is also noteworthy, as it represents a swing high resistance and aligns with the 161.80% Fibonacci Extension, indicating an even stronger potential resistance point.
On the downside, the 1st support level at 0.8613, which is identified as a pullback support. Further down, the 2nd support level at 0.8570, characterized as a swing low support, could also act as support in case ofa retracement.
GBP/USD:
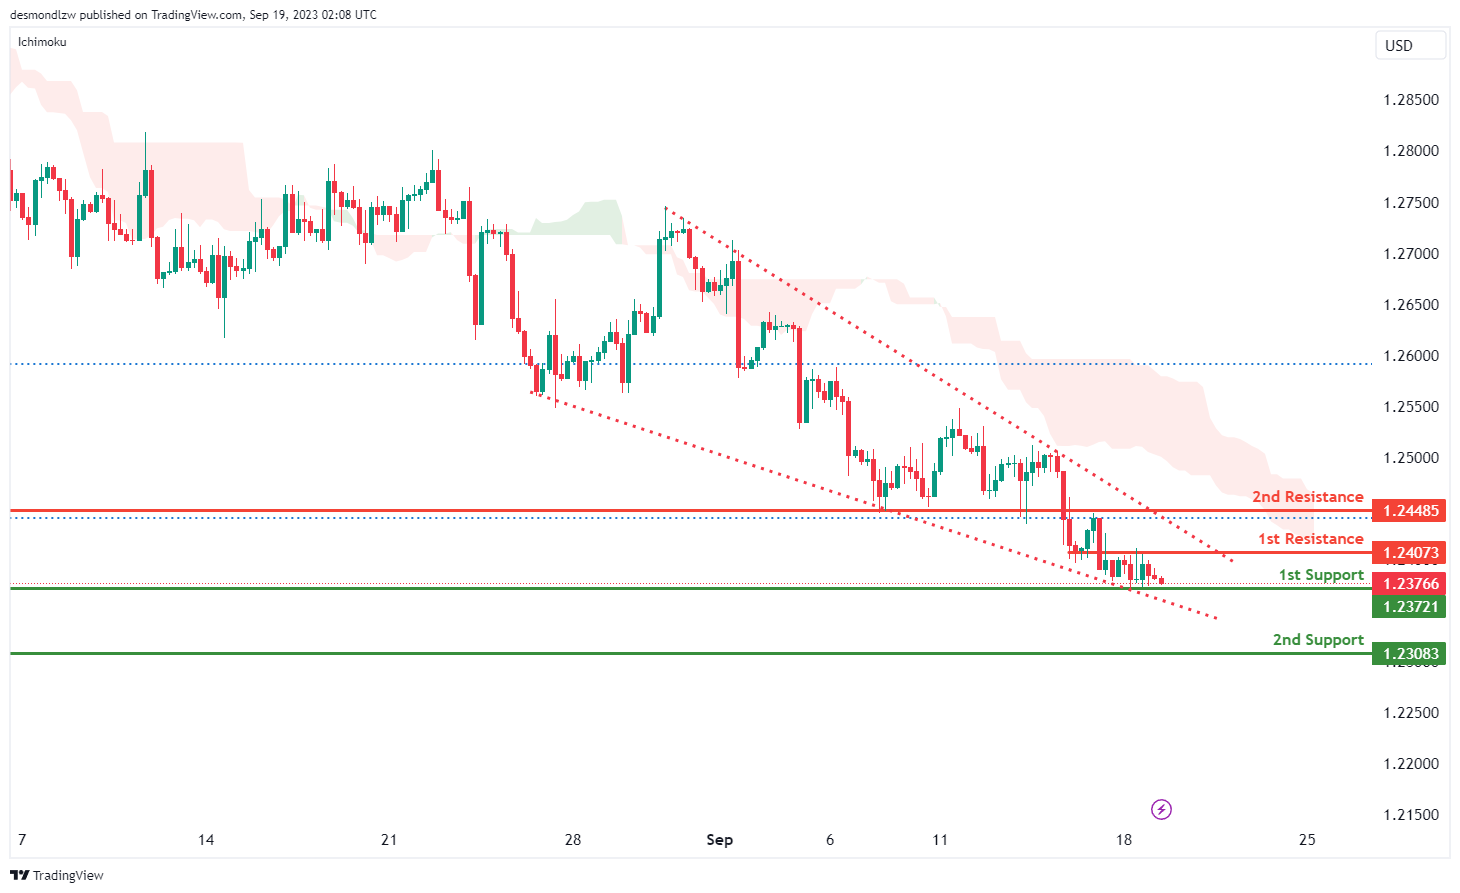
The GBP/USD chart currently exhibits a bearish overall momentum, characterized by several factors contributing to its downward trajectory, most notably, the price is situated below the bearish Ichimoku cloud, underscoring the prevailing bearish sentiment.
However, in the short term, there’s a potential scenario where the price may experience a temporary rise towards the 1st resistance level at 1.2407 before reversing and heading downwards towards the 1st support at 1.2372. The 1st support level is a notable consideration, classified as an overlap support, highlighting its historical importance as a potential strong support zone. Similarly, the 2nd support at 1.2308 is identified as a swing low support, reinforcing its role as a key support level.
On the resistance side, the 1st resistance at 1.2407 holds significance as an overlap resistance, signifying its potential as a resistance barrier in the short term. Beyond the 1st resistance, the 2nd resistance at 1.2448 is also categorized as an overlap resistance, further highlighting its relevance. As the chart maintains its bearish momentum,
GBP/JPY:
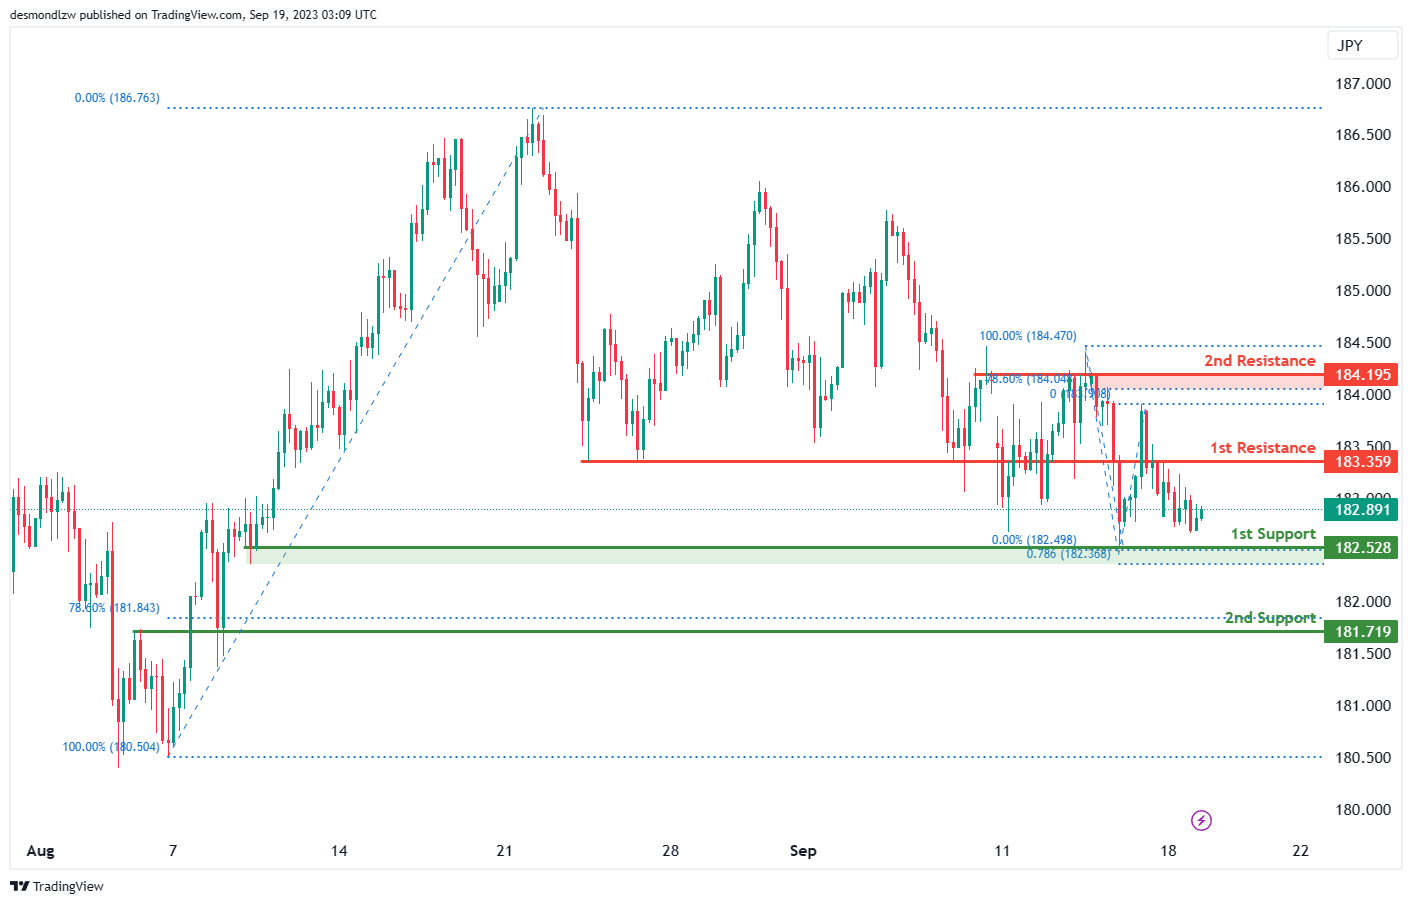
For GBP/JPY, the overall momentum of the chart is currently bearish, indicating a downward trend.
The potential scenario you’ve mentioned is for a bearish continuation towards the 1st support level at 182.52. This support level is considered significant as it aligns with a multi-swing low support and the 78.60% Fibonacci Projection, indicating a strong potential support area.
If the bearish momentum persists, the 2nd support level at 181.71 is also noteworthy. It represents an overlap support and coincides with the 78.60% Fibonacci Retracement, making it another potential support zone.
On the other hand, if there is a reversal in the trend, the 1st resistance level at 183.35. This resistance level is characterized as an overlap resistance.
Further up, the 2nd resistance level at 184.19, representing a multi-swing high resistance and aligning with the 78.60% Fibonacci Retracement, could act as a significant barrier if the price attempts to move higher.
USD/CHF:
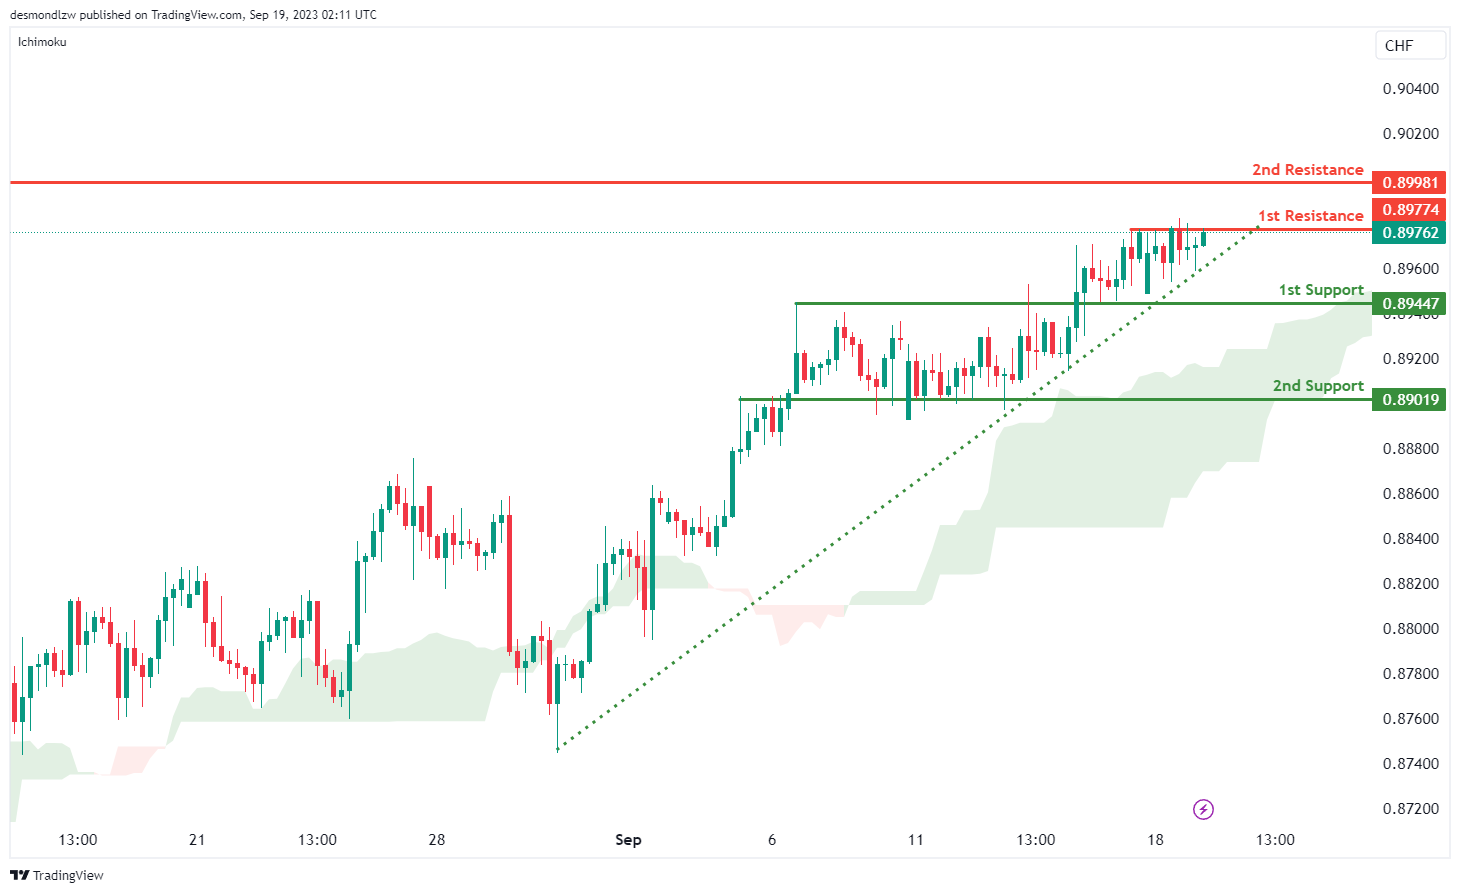
The USD/CHF chart is presently characterized by a robust bullish momentum, with several factors contributing to its upward trajectory. Key among these factors is the price’s position above the bullish Ichimoku cloud, signifying a dominant bullish sentiment, along with its alignment above a major ascending trend line, further bolstering expectations of continued bullish momentum.
In the short term, there’s a potential scenario where the price may experience a brief decline, reaching the 1st support level at 0.8944, before subsequently rebounding and ascending towards the 1st resistance at 0.8977. The 1st support level is a significant consideration, classified as an overlap support, signifying its historical relevance as a potential strong support zone. Similarly, the 2nd support at 0.8901 is also identified as an overlap support, reinforcing its role as a key support level.
On the resistance side, the 1st resistance at 0.8977 is pivotal, characterized as a multi-swing high resistance, and it holds the potential to act as a strong resistance barrier. Beyond the 1st resistance, the 2nd resistance at 0.8998 is also identified as a multi-swing high resistance, further highlighting its significance. With the chart’s overall bullish momentum
USD/JPY:
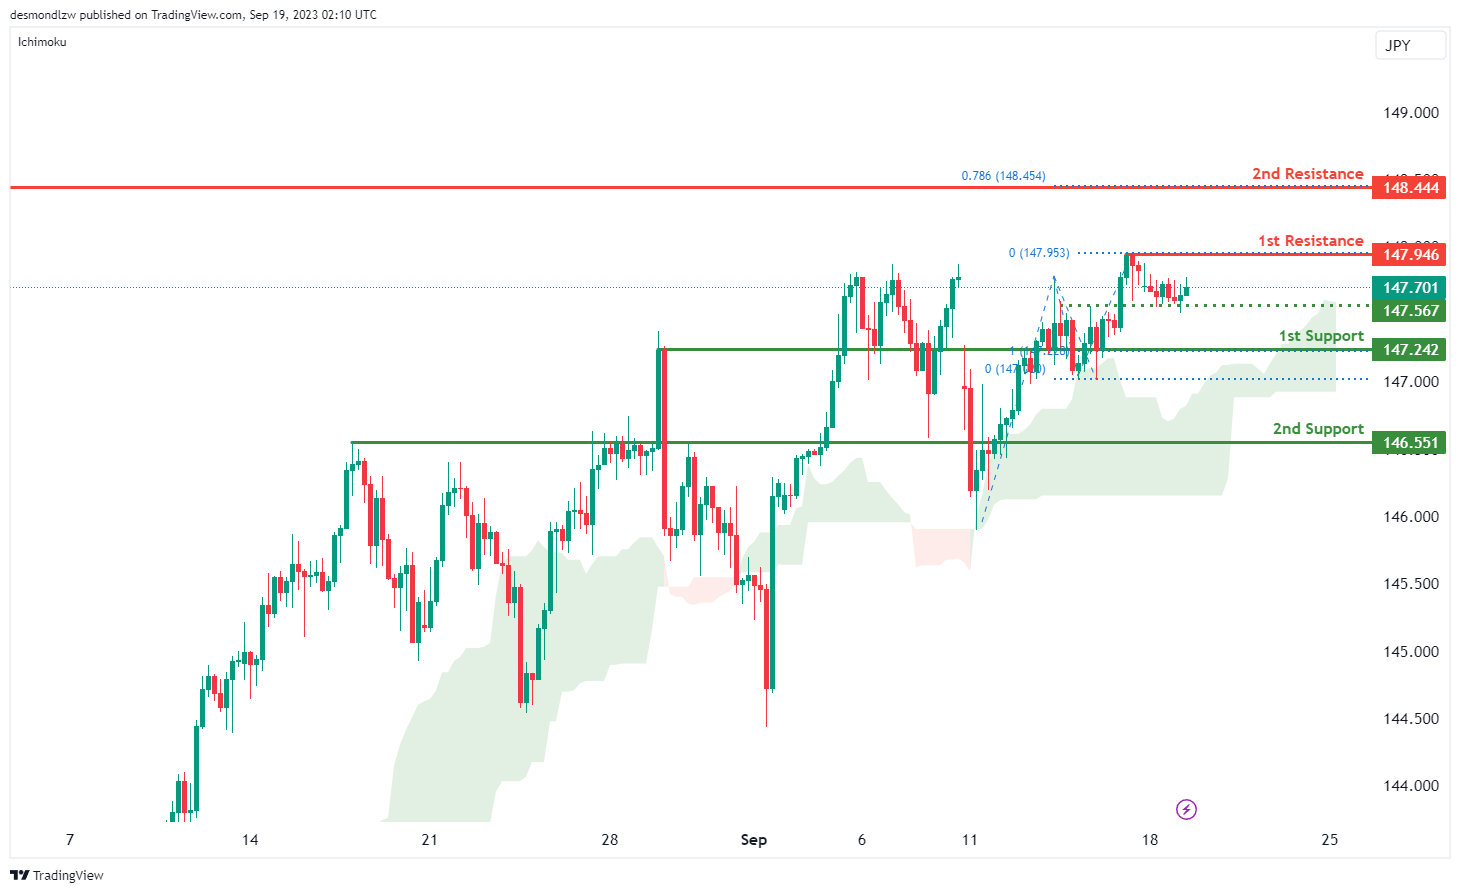
The USD/JPY chart currently maintains a strong bullish momentum, underpinned by several factors contributing to its upward trajectory. A notable signal of this bullish sentiment is the price’s recent cross above the Ichimoku cloud, confirming the favorable market conditions.
In this context, there’s a plausible scenario where the price may continue its bullish run towards the 1st resistance level at 147.94. The 1st support at 147.24 is of notable significance, classified as an overlap support, and its historical importance underscores its potential as a strong support zone. Similarly, the 2nd support at 146.55 is identified as an overlap support, further reinforcing its role as a key support level. On the resistance side, the 1st resistance at 147.94 assumes a pivotal role, characterized as a swing high resistance, signifying its potential as a point of resistance. Beyond the 1st resistance, the 2nd resistance at 148.44 is identified as a swing high resistance, and it aligns with the presence of the 78.60% Fibonacci Projection, adding an extra layer of reinforcement to its importance.
Additionally, an intermediate support level at 147.56 is in play, classified as an overlap support, further emphasizing its relevance as a support zone. With the chart’s overall bullish momentum,
USD/CAD:
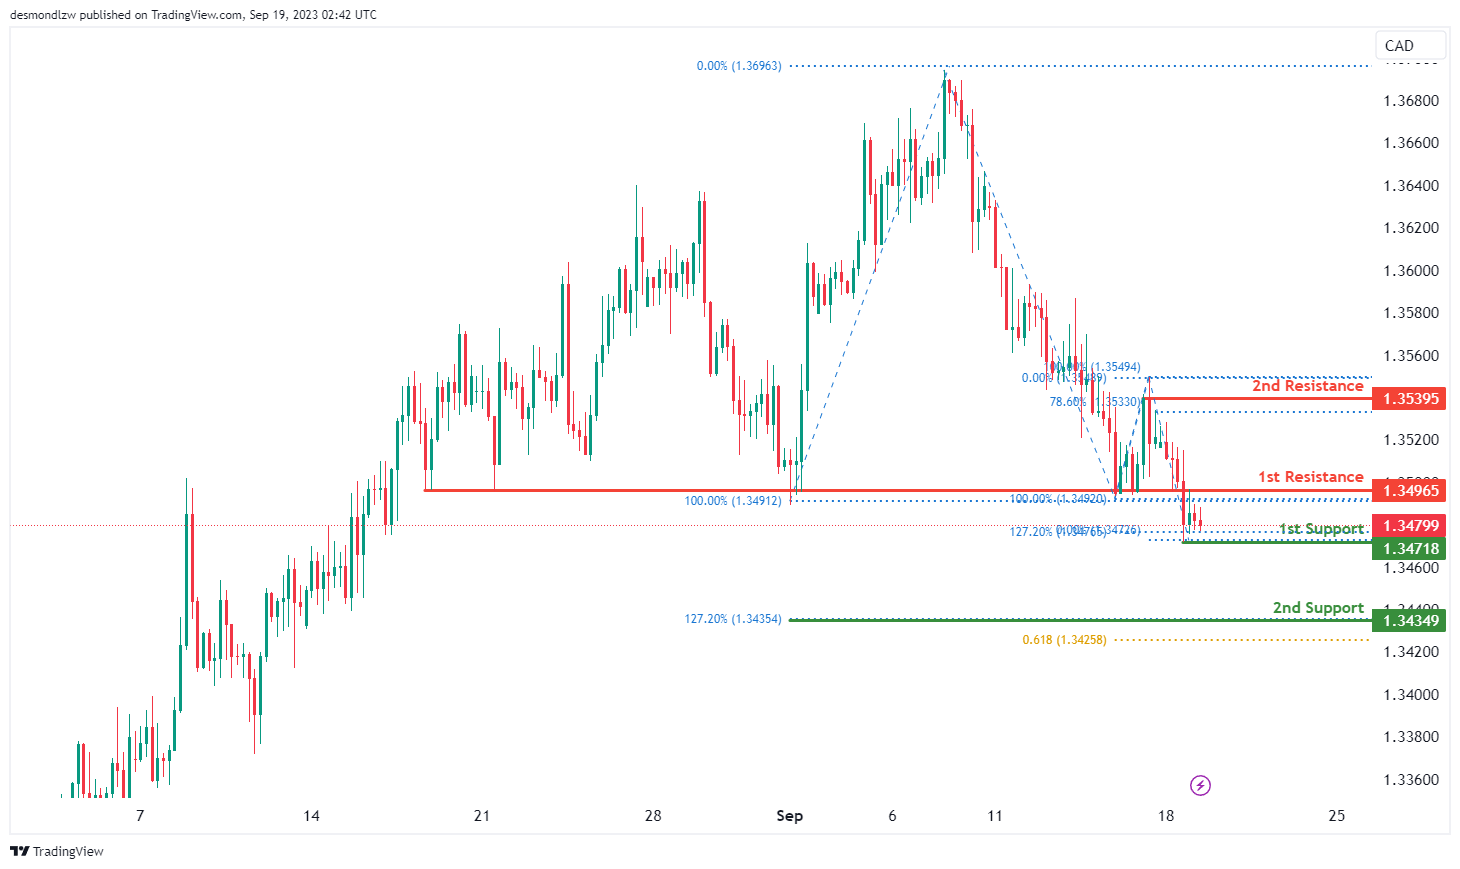
The USD/CAD chart currently indicates an overall neutral momentum, suggesting a lack of a strong directional bias in this currency pair. It is anticipated that price could fluctuate between the 1st support and the 1st resistance levels.
The 1st support level at 1.3472 is identified as a pullback support that aligns with the 127.20% Fibonacci extension level while the 2nd support level at 1.3435 is marked as a support level that aligns with a confluence of Fibonacci levels i.e. the 127.20% extension and the 61.80% projection levels.
To the upside, the 1st resistance level at 1.3497 is identified as a pullback resistance. Further up, the 2nd resistance level at 1.3539 is noted as a swing-high resistance that aligns with the 78.60% Fibonacci retracement level.
AUD/USD:
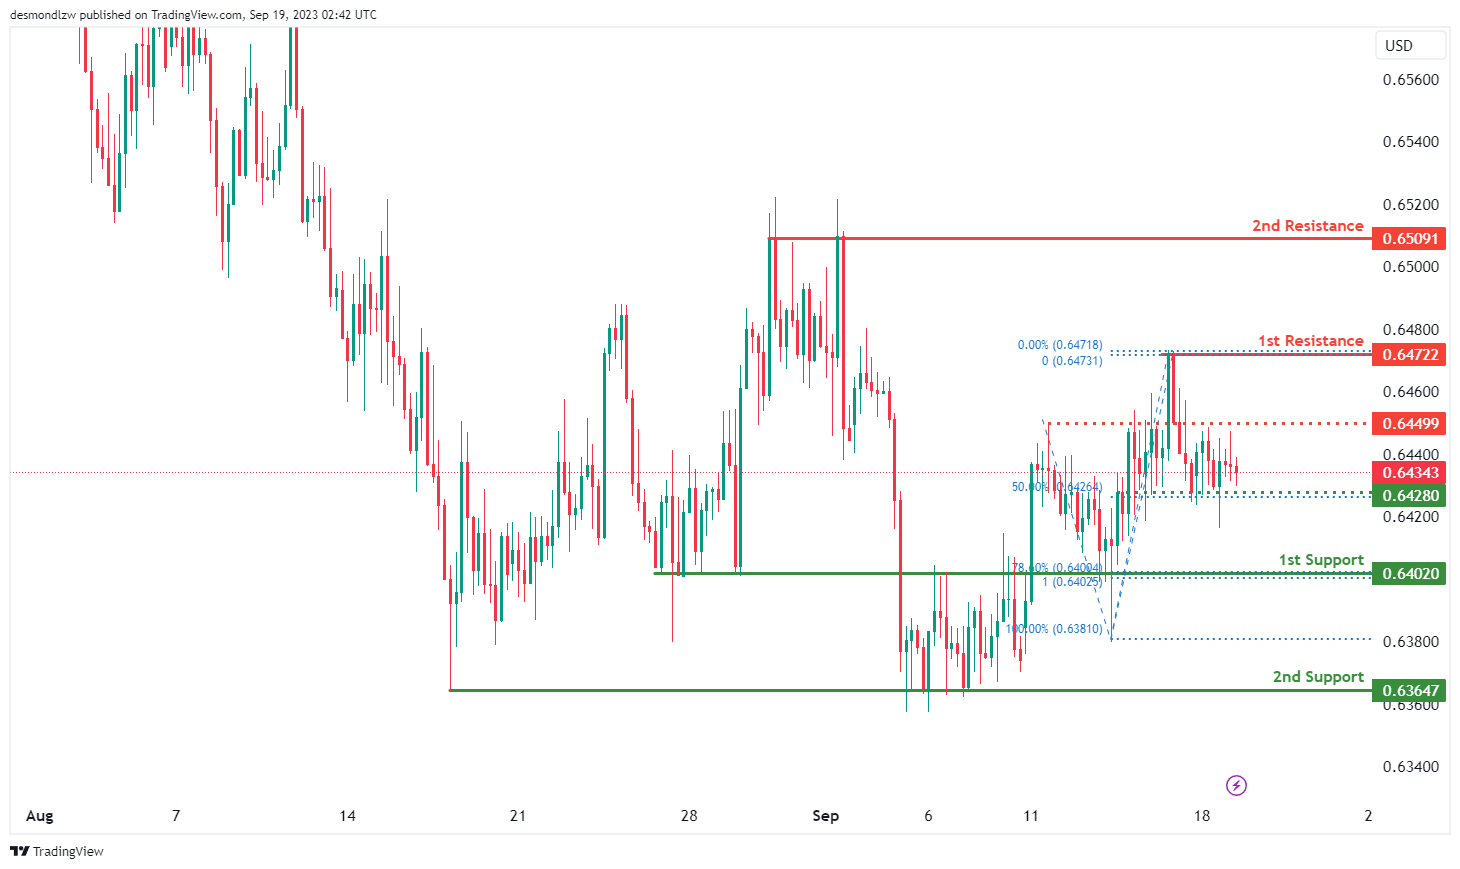
The AUD/USD chart currently indicates an overall neutral momentum, suggesting that the currency pair lacks a strong directional bias. In such scenarios, price is anticipated to fluctuate between the 1st support and the 1st resistance levels.
There is an intermediate support level at 0.64280 that is noted as a pullback support that aligns with the 50.00% Fibonacci retracement level while the 1st support level at 0.6402 is identified as an overlap support that aligns with a confluence of Fibonacci levels i.e. the 78.60% retracement and the 100.00% projection levels. In addition, the 2nd support level at 0.6365 is marked as a pullback support.
There is an intermediate resistance level at 0.6449 which is identified as a pullback resistance while the
1st resistance level at 0.6472 is marked as a swing-high resistance. Further up, the 2nd resistance level at 0.6509 is identified as a multi-swing-high resistance, potentially acting as a major barrier for any upward price movements.
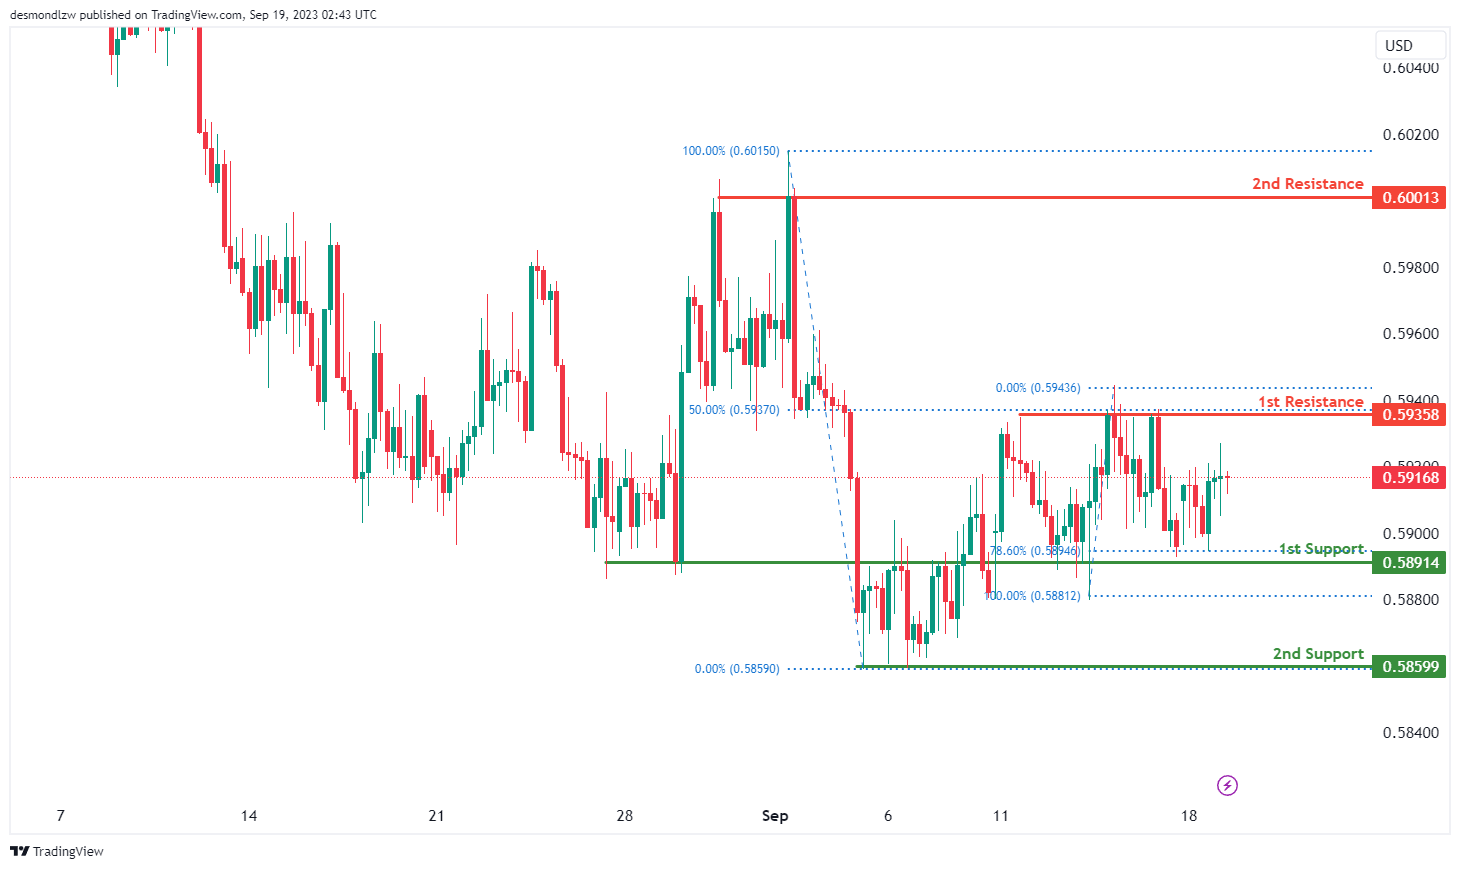
NZD/USD
The chart for NZD/USD indicates an overall neutral momentum, suggesting that the currency pair is lacking a clear directional bias and is anticipated for price to fluctuate between the 1st support and the 1st resistance levels.
The 1st support level at 0.5891 is identified as an overlap support that aligns with the 78.60% Fibonacci retracement level while the 2nd support level at 0.5859 is noted as a pullback support.
To the upside, the 1st resistance level at 0.5936 is identified as a pullback resistance that coincides with the 50.00% Fibonacci retracement level. Further up, the 2nd resistance level at 0.6001 is identified as a multi-swing-high resistance, potentially halting any further upward price movements.
DJ30:
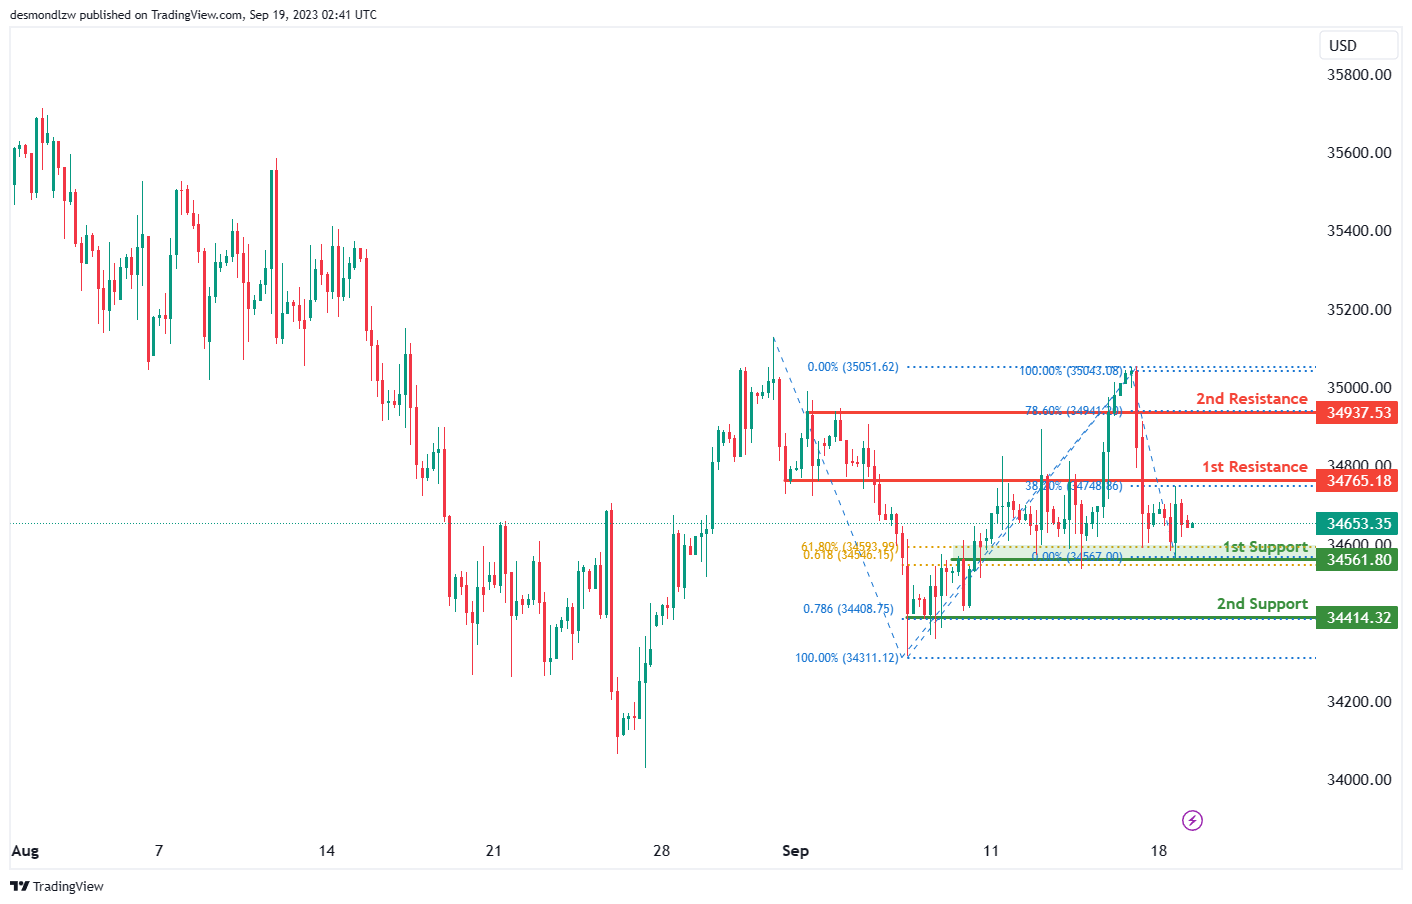
For DJ30 (Dow Jones Industrial Average), the overall momentum of the chart is currently bearish, indicating a downward trend.
There is potential for the price to continue its bearish movement towards the 1st support level at 34651.80, which is considered significant. This support level aligns with both the 61.80% Fibonacci Projection and the 61.80% Fibonacci Retracement, indicating strong potential support at this confluence level.
If the bearish momentum persists, the 2nd support level at 34414.32 is also noteworthy as it represents a multi-swing low support and aligns with the 78.60% Fibonacci Projection, providing additional support for this level.
On the other hand, if there’s a reversal in the price, it may encounter resistance at the 1st resistance level of 34765.18. This resistance is characterized as an overlap resistance and is supported by a 38.20% Fibonacci Retracement.
Further upward movement could face the 2nd resistance level at 34937.53, which is identified as a pullback resistance and is supported by the 78.60% Fibonacci Retracement.
GER30:
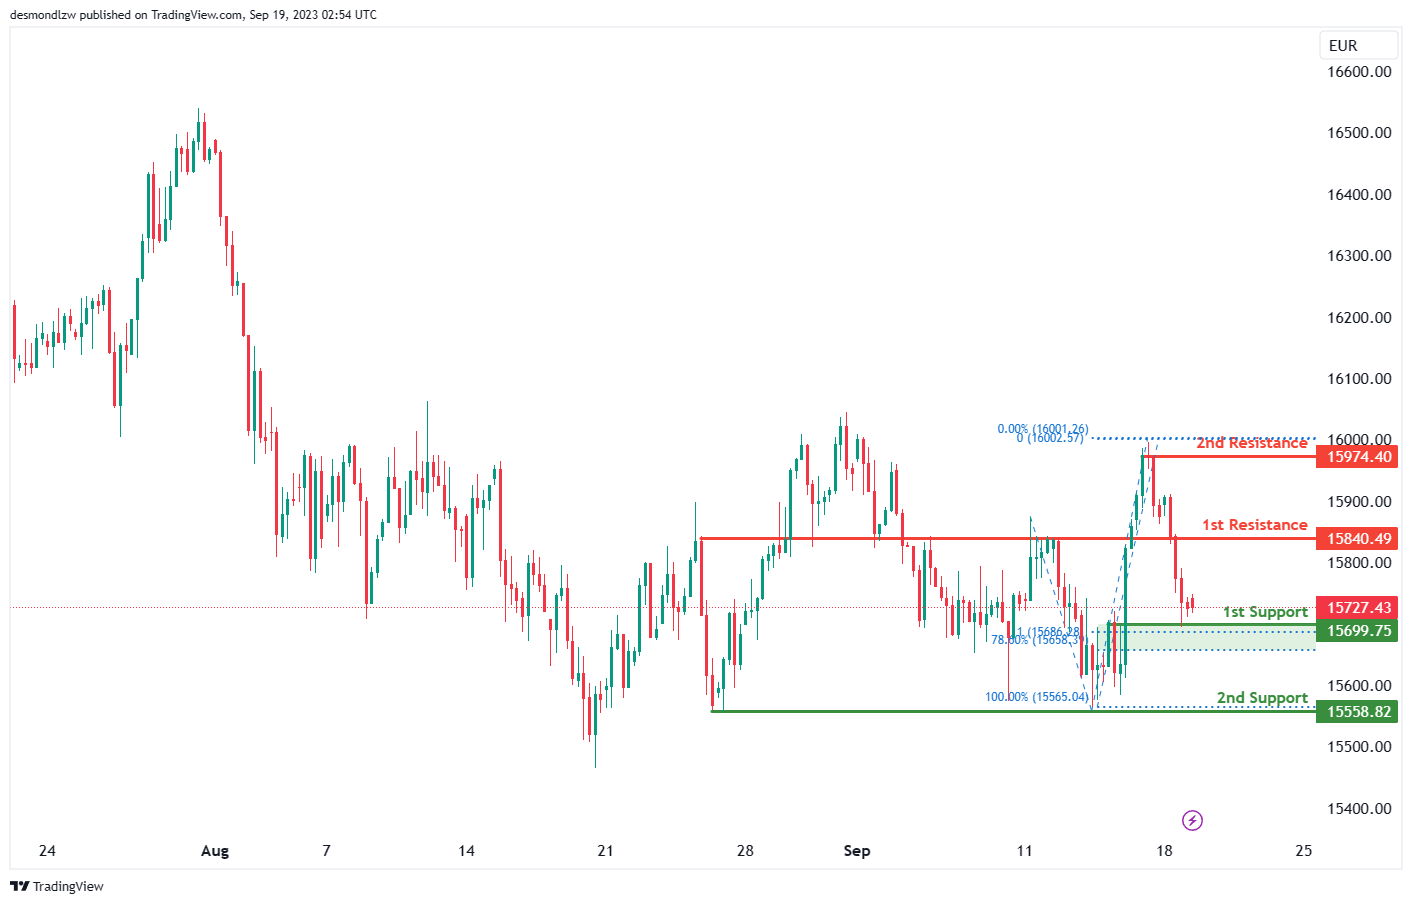
For GER30 (DAX 30), the overall momentum of the chart is currently bearish, indicating a downward trend.
There is potential for the price to continue its bearish movement towards the 1st support level at 15699.75. This support level is significant as it aligns with an overlap support, the 78.60% Fibonacci Retracement, and the 100% Fibonacci Projection, indicating strong potential support at this confluence level.
If the bearish momentum persists, the 2nd support level at 15558.82 is also noteworthy, representing a multi-swing low support. While not accompanied by Fibonacci levels, it can act as an additional layer of support.
On the other hand, if there’s a reversal in the price, it may encounter resistance at the 1st resistance level of 15840.49. This resistance level is characterized as a pullback resistance.
Further upward movement could face the 2nd resistance level at 15974.40, which is identified as a swing high resistance.
US500
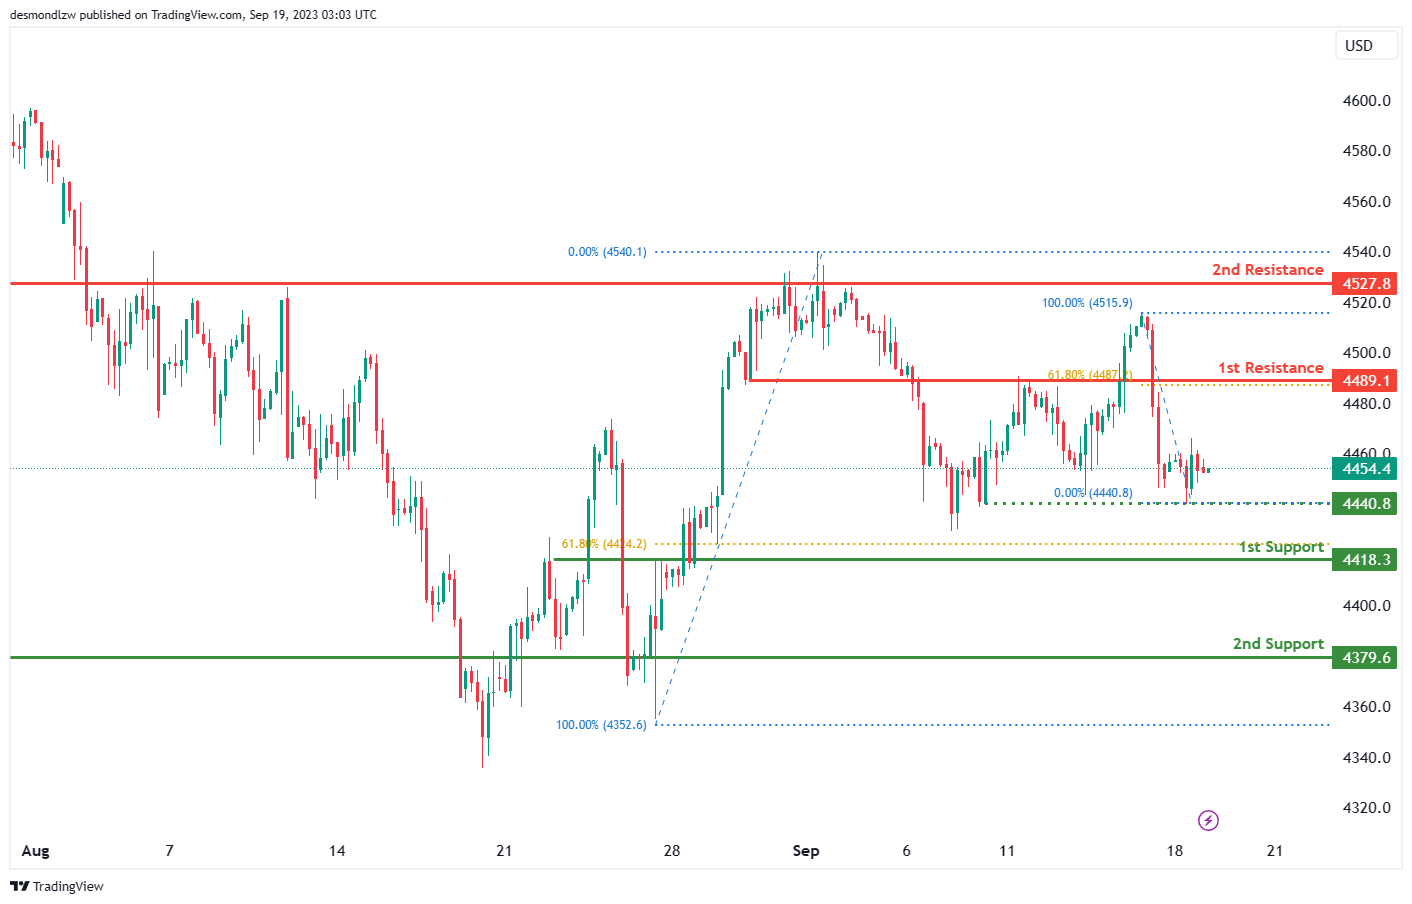
For US500 (S&P 500), the overall momentum of the chart is currently bearish, suggesting a downward trend.
There is a potential for the price to continue its bearish movement towards the 1st support level at 4418.3. This support level is considered significant as it aligns with a pullback support and coincides with the 61.80% Fibonacci Retracement level, indicating strong potential support at this confluence level.
If the bearish momentum persists, the 2nd support level at 4379.6 is also notable as it represents an overlap support. Although it doesn’t have a specific Fibonacci level attached to it, overlap supports can be meaningful in providing additional support.
On the other hand, if there’s a reversal in the price, it may face resistance at the 1st resistance level of 4489.1. This resistance level is characterized as a pullback resistance and aligns with the 61.80% Fibonacci Retracement.
Further upward movement could encounter the 2nd resistance level at 4527.8, which is identified as an overlap resistance.
Additionally, there is an intermediate support level at 4440.8, which is considered a multi-swing low support.
BTC/USD:
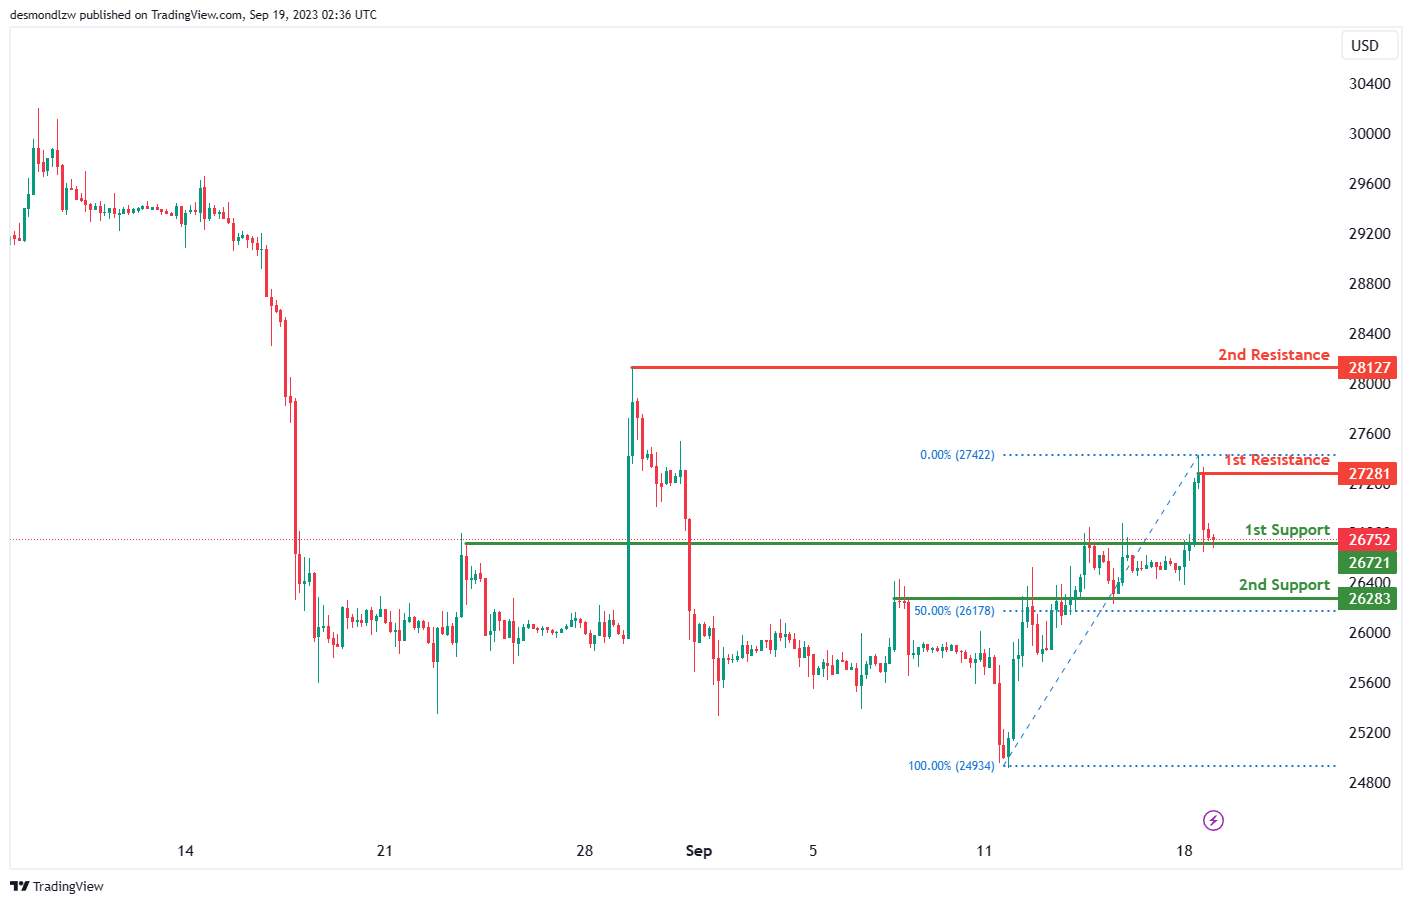
For BTC/USD, the overall momentum of the chart is currently bullish, indicating an upward trend.
There is potential for the price to make a bullish move by bouncing off the 1st support level at 26,721 and heading towards the 1st resistance level at 27,281.
The 1st support at 26,721 is considered significant as it represents an overlap support, suggesting strong potential support at this level.
In case of a deeper pullback, the 2nd support level at 26,283 is also noteworthy, as it aligns with the 50% Fibonacci Retracement, indicating potential support in this area.
On the upper side, the 1st resistance at 27,281 is identified as a swing high resistance, which may act as a point of resistance for the bullish momentum.
Further upward movement could face additional resistance at the 2nd resistance level of 28,127, characterized as a swing high resistance. Overall, the chart’s momentum suggests the potential for a bullish bounce off the identified support level and a move towards resistance.
ETH/USD:
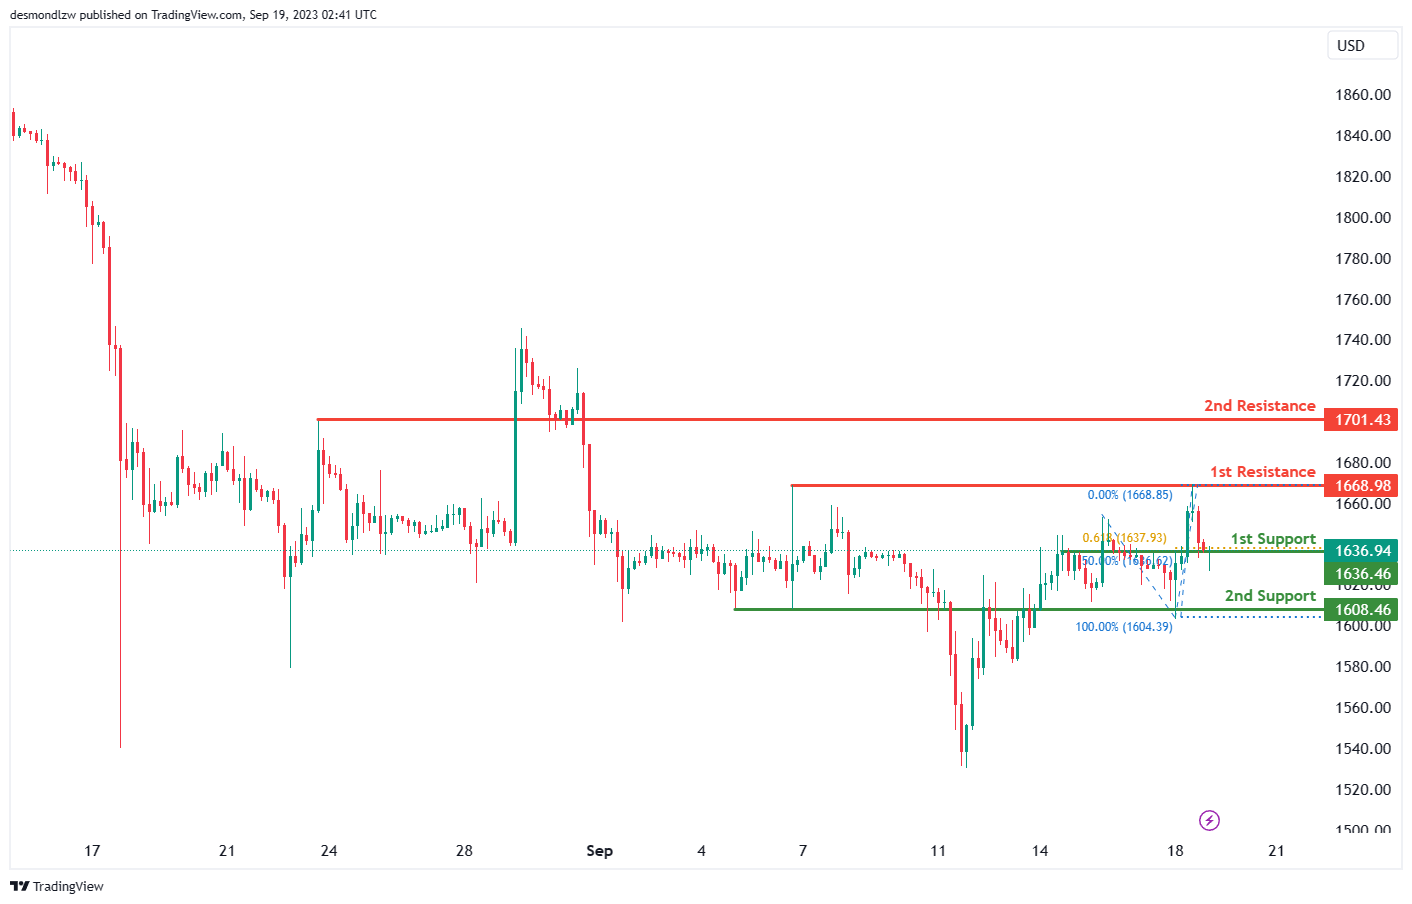
For ETH/USD, the overall momentum of the chart is currently bullish, indicating an upward trend.
There is potential for the price to make a bullish move by bouncing off the 1st support level at 1636.46 and heading towards the 1st resistance level at 1668.98.
The 1st support at 1636.46 is considered significant as it represents an overlap support and aligns with both the 50% Fibonacci Retracement and the 61.80% Fibonacci Projection, indicating strong potential support at this level.
If there’s a deeper pullback, the 2nd support level at 1608.46, which is also an overlap support, may provide additional support to the price.
On the upper side, the 1st resistance at 1668.98 is identified as a multi-swing high resistance, suggesting potential resistance at this level.
Further bullish movement could encounter the 2nd resistance level at 1701.43, which is characterized as a pullback resistance, potentially acting as a barrier to the bullish momentum.
WTI/USD:
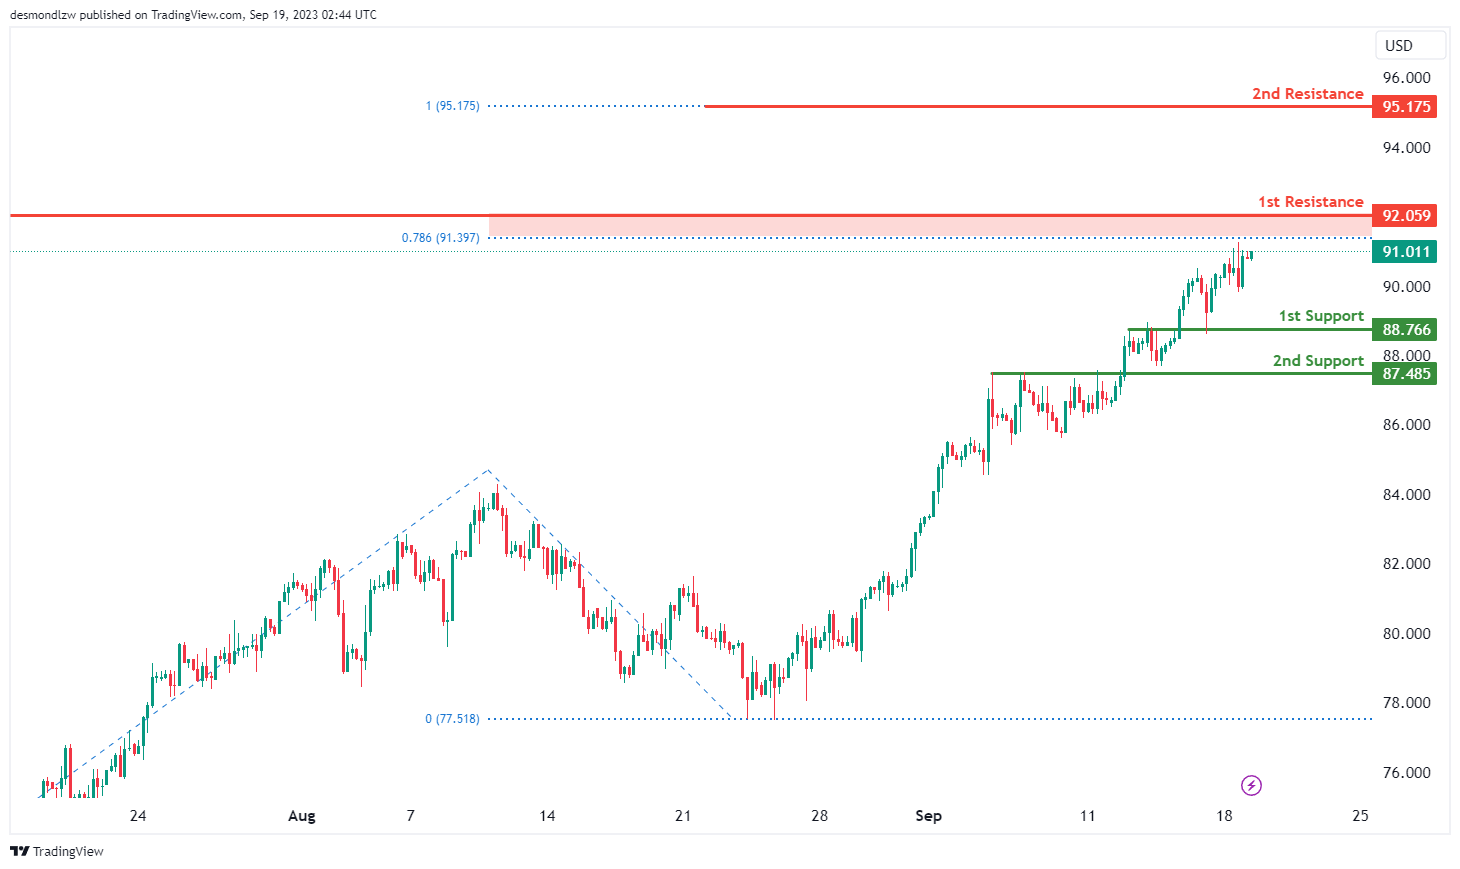
The chart for WTI (West Texas Intermediate) crude oil is currently showing an overall bullish momentum, indicating that price has been on an upward trajectory with the potential for a bullish continuation towards the 1st resistance level.
The 1st resistance level at 92.06 is identified as a swing-high resistance that aligns with the 78.60% Fibonacci projection level. Further up, the 2nd resistance level at 95.18 is marked as a resistance level that coincides with the 100.00% Fibonacci projection level, potentially acting as a strong barrier to upward price movement.
To the downside, the 1st support level at 88.77 is identified as an overlap support while the 2nd support level at 87.49 is also marked as another overlap support, reinforcing the idea that this area may act as a strong support zone.
XAU/USD (GOLD):
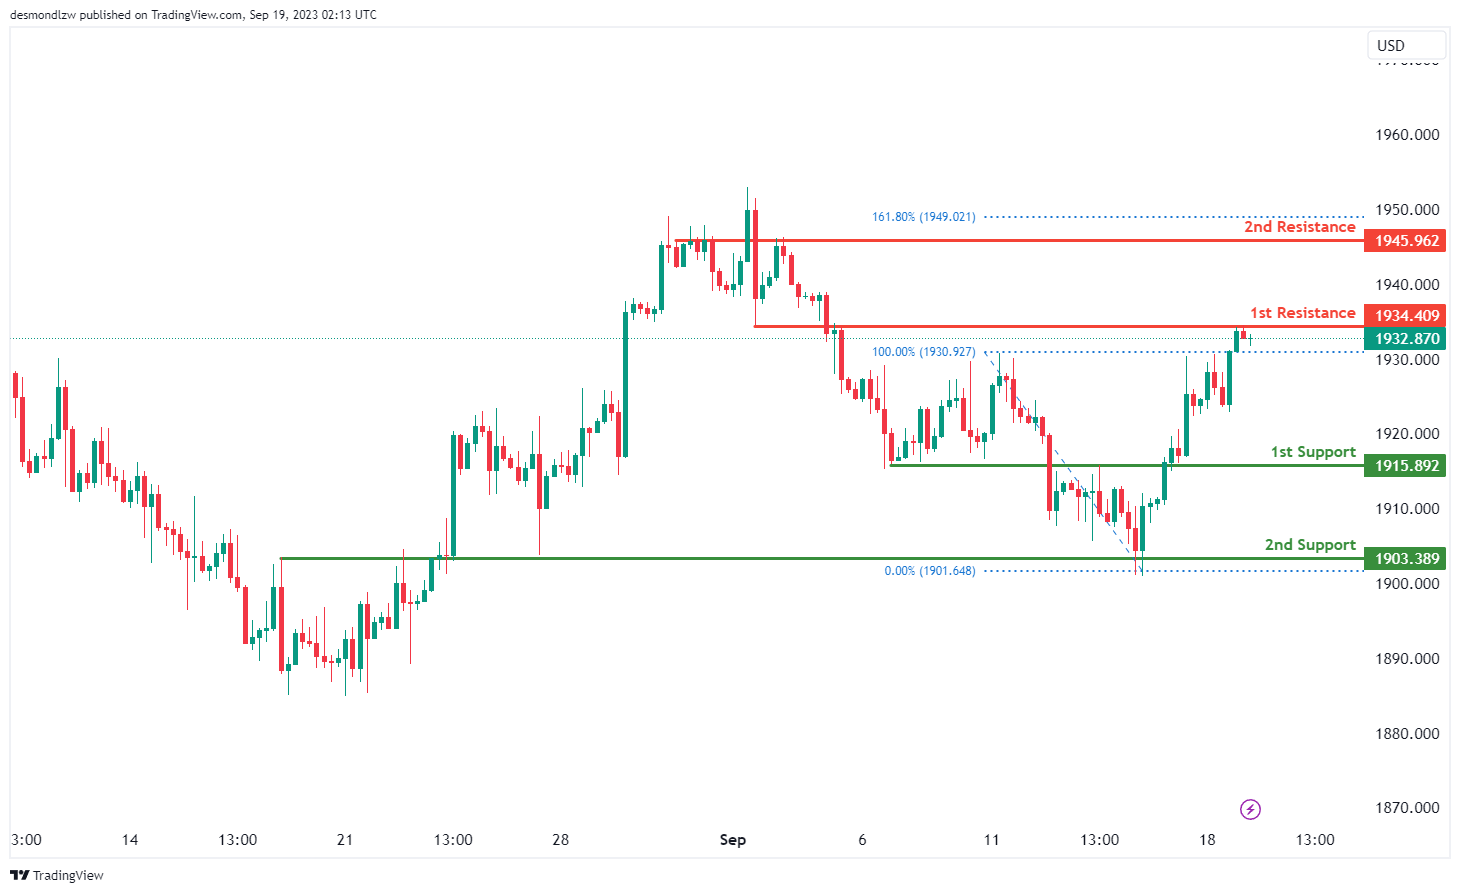
The XAU/USD chart currently exhibits a bullish overall momentum, and while the bullish sentiment persists, there’s a short-term scenario where the price may experience a temporary decline towards the 1st support level at 1915.89 before subsequently rebounding and ascending towards the 1st resistance at 1934.40. The 1st support is of notable significance, marked as an overlap support, emphasizing its historical relevance as a potential strong support zone. Similarly, the 2nd support at 1903.38 is identified as an overlap support, further underlining its role as a key support level.
On the resistance side, the 1st resistance at 1934.40 plays a pivotal role, categorized as an overlap resistance, and it carries the potential to act as a resistance barrier in the short term. Beyond the 1st resistance, the 2nd resistance at 1945.96 is also identified as an overlap resistance, further emphasizing its relevance. As the chart’s overall bullish momentum continues.
Geopolitical Radar – EU-China Trade Tensions Brewing, Ukraine Makes Advance
- EU-China trade tensions are brewing with an EU probe into Chinese EV subsidies. US weapons sale to Taiwan under sovereign-nation program feeds new tensions. China has increased the intensity of military exercises around Taiwan lately.
- Ukraine has made significant advance in the battlefield, successfully breaking through the first Russian line of defence in the south. If they are able to push further, they could eventually be able to attack key Russian logistics routes.
Recent developments related to China
Are EU and China heading for a trade war? At least we are seeing increased tensions in the trade area, which need to be followed over the coming year(s). EU's trade deficit with China has increased sharply in recent years, partly due to exports within green tech, where China is leading. The EU Commission President Ursula von der Leyen on Wednesday announced that a probe into Chinese EV subsidies will be launched. China responded with a sharp rebuke saying China's competitive advantage in the EV space had nothing to do with subsidies. Imports of Chinese EVs have increased significantly and was likely to become a flash point of tension sooner or later, not least as it challenges the German auto sector significantly.
Canada’s CPI looms, can CAD/JPY sustain bullish momentum?
Today, eyes are on Canada's CPI data, with projections pointing towards an uptick. Expectations peg the headline inflation at 3.8% yoy, an increase from July's 3.3% yoy. Should this materialize, it would represent a consecutive monthly acceleration, with inflation rate soaring to its pinnacle since April, and significantly surpassing BoC's 2% target. Nevertheless, monthly CPI growth is projected at 0.2% mom, decelerating from the previous 0.6% mom noted in July.
The inflation surge in August is attributed to an interplay of base effects paired with escalating energy prices. Yet, the most pronounced upside risks are to stem from an array of service prices. The spotlight will undeniably be on the core inflation metrics. Also, a surge in three-month inflation will naturally amplify the likelihood of another rate hikes by BoC, potentially as proximate as October.
BoC's Governor, Tiff Macklem, elucidated the bank's stance in a September 7 speech, stating that while "monetary policy may be sufficiently restrictive", the bank aspires to witness "less-generalized price increases" alongside a dip in the average price rise. Failing to observe such a trend might compel the bank to contemplate elevating the policy rate again, particularly if inflationary tendencies persist.
On the currency front, the Canadian Dollar has showcased commendable strength this month, propelled by a spike in oil prices. CAD/JPY's break of 109.46 resistance this week argues that rise from 94.04 is resuming for a test on 110.87 key resistance (2022 high). Firm break there will confirm larger up trend resumption. Next target will be 61.8% projection of 94.04 to 109.48 from 104.19 at 113.73. In any case, near term outlook will stay bullish as long as 108.10 resistance turned support holds.
RBA minutes flag risks on growth, consumption and China
RBA's meeting held on September 5, the minutes revealed that officials weighed two courses for monetary policy: increasing cash rate target by 25 bps or standing pat.
After a thorough consideration of the prevailing economic circumstances, members resolved that maintaining the current cash rate was the more compelling choice, highlighting the necessity to allot more time to gauge the comprehensive impacts of monetary policy tightening enacted since May 2022. This consensus is grounded in an understanding of the substantial delays that characterize transmission of policy repercussions through the economy.
Amid these considerations, members also highlighted potential risks. Specifically, there were concerns regarding the possibility that "the economy could slow more sharply than forecast." Factors like potentially weaker consumption and mounting downside risks to the Chinese economy were flagged.
However, the minutes reflected a cautiously optimistic tone, with members deducing that "recent developments had not materially altered the outlook." The general consensus remained that the economy still seems to be on a balanced path where inflation is poised to return to the target range, and employment growth is anticipated to sustain its momentum.
(RBA) Minutes of the Monetary Policy Meeting of the Reserve Bank Board
Sydney – 5 September 2023
Members present
Philip Lowe (Governor and Chair), Michele Bullock (Deputy Governor), Ian Harper AO, Carolyn Hewson AO, Steven Kennedy PSM, Iain Ross AO, Elana Rubin AM, Carol Schwartz AO, Alison Watkins AM
Others present
Christopher Kent (Assistant Governor, Financial Markets), Marion Kohler (Acting Assistant Governor, Economic)
Anthony Dickman (Secretary), David Norman (Deputy Secretary)
Penelope Smith (Head, International Department), Tom Rosewall (Acting Head, Economic Analysis Department), Carl Schwartz (Acting Head, Domestic Markets Department)
International economic developments
Members commenced their discussion of the global economy by observing that headline inflation had continued to ease in year-ended terms in most economies because food and energy commodity prices were generally lower than they had been a year earlier. More recent increases in some food and energy prices presented upside risks to headline inflation in the months ahead. Nevertheless, many central banks in advanced economies expected inflation to moderate further and return to target during 2025.
Members noted that core inflation remained more persistent than headline inflation in advanced economies, though it had eased in many owing in part to a decline in core goods price inflation. By contrast, core services inflation remained high in most advanced economies, supported by the recent strength in demand relative to supply and strong growth in unit labour costs. Labour market conditions had eased gradually but remained tight, and unemployment rates were still at very low levels.
Economic growth in advanced economies had slowed in response to cost-of-living pressures and tighter monetary policy, but by less than previously expected. Growth in household consumption had slowed in the June quarter in many advanced economies and timely indicators suggested the slowing had continued into the September quarter. Business investment growth had picked up in recent quarters in a number of advanced economies. Activity in the services sector – which had been a key driver of growth in economic activity in the first half of 2023 – appeared to have lost some momentum in preceding months.
Members discussed recent developments in China, observing that conditions in the property market had deteriorated further and that other indicators of economic activity had remained soft. Chinese authorities had introduced several policy measures to support the property sector, but these had not yet materially changed buyer sentiment. Members noted that the sector faced significant challenges from financial stress among developers and further defaults posed a risk to economic activity. Inflation in China remained very low by global standards and relative to the central bank's target. A sharper slowing in China was a risk to the global outlook, as Chinese policymakers navigated the longer term challenges of slower structural growth and a rebalancing of the sources of growth in the Chinese economy.
Despite problems in the property market in China, members observed that iron ore prices had increased over the prior month, supported by ongoing demand for steel from other sectors and the possibility of further policy support. Oil prices had increased by nearly 20 per cent from their trough in late June, with larger increases for refined fuel prices.
Members noted that the numbers of tourists and students entering Australia from China had continued to recover but were not yet back to pre-pandemic levels; therefore, further increases were expected to support growth in Australian services exports in the near term. However, a sharper deterioration in China's economic growth posed a downside risk to the outlook for services exports and would also be expected to reduce the prices received for Australia's commodity exports. Lower output growth in China would also affect global output growth, which might in turn affect a range of Australian exports as well as the prices of Australia's imports. However, if this downside risk were to eventuate, these effects would likely be partly offset by a depreciation of the Australian dollar.
Domestic economic conditions
Turning to the domestic economy, members observed that inflation had continued to decline from its peak in late 2022 but remained high. Headline inflation, as measured by the monthly CPI indicator, had decreased to 4.9 per cent over the year to July, owing to declines in the prices of fruit and vegetables and fuel. However, fuel prices had increased sharply in August. By itself, this would boost headline inflation in the September quarter, relative to expectations in early August. Overall, however, inflation was still expected to continue to moderate over the second half of 2023.
Members discussed the composition of the latest inflation data, noting that inflation excluding volatile items and holiday travel and accommodation had eased further in July. The earlier easing in global upstream cost pressures, alongside slowing growth in domestic demand, had contributed to lower inflation for a range of goods. As expected, electricity prices had increased markedly in July as the higher default market offers came into effect, with some offset from government rebates. Members noted that there was limited additional information available for services inflation in the first month of each quarter. Rent inflation had increased to 7½ per cent over the preceding year, reflecting very tight rental market conditions across the capital cities.
Members noted that the labour market also remained tight, but a little less so than in late 2022. While the unemployment rate remained around the low levels of the preceding year, broader measures of labour underutilisation had increased a little and a range of indicators suggested the labour market was at a turning point. The easing in labour market conditions had reflected both an easing in growth in labour demand (following slower growth in economic activity) and strong growth in labour supply. Firms in the Bank's liaison program had reported an improvement in labour availability but that finding suitable workers continued to be more difficult than prior to the pandemic.
Wages growth remained solid in the June quarter. The Wage Price Index increased by 3.6 per cent over the year, broadly around the same pace as in the March quarter. Members noted that timely indicators also pointed to wages growth having been steady ahead of the implementation from July of the changes to award and minimum wages decided by the Fair Work Commission (FWC). The liaison measure of private sector wages growth was around 4 per cent in the September quarter to date, although it was too soon to assess the overall effect of the FWC wage decision on wages growth overall. Expectations of firms in the liaison program were for wages growth in the year ahead to remain around 4 per cent.
Members observed that a range of timely indicators suggested economic growth remained weak. Cost-of-living pressures and high interest rates had continued to weigh on growth in real household disposable incomes and consumption. The national accounts, which were scheduled to be released the day after the meeting, were expected to show that growth in consumption was weak in the June quarter. In per capita terms, consumption was expected to have declined. Timely indicators suggested that consumption growth had remained weak into the September quarter. Looking through the recent monthly volatility, retail sales had been little changed in nominal terms since late 2022 but remained well above pre-pandemic levels in both nominal and real terms.
The recovery in housing prices had continued over the prior month, supported by strong demand – driven in part by strong population growth – and limited supply. Increases in prices had been broadly based across regions and property types; in Sydney, prices were around 8 per cent above their early-2023 trough. The rental market was also very tight and would likely remain so owing to strong population growth, but there had been some tentative signs of an easing in conditions. Rental vacancy rates had increased slightly in some capital cities in recent months and, although growth in advertised rents (for new leases) had remained strong in most capital cities, it had slowed in most regional areas.
Demand for new residential construction had remained weak. In liaison, builders had pointed to a range of factors, including higher interest rates, higher construction costs and the effect of construction delays and insolvencies on buyer sentiment. Members noted that the recent weakness in demand for new detached dwellings was expected to weigh on dwelling investment once the construction backlog had been worked through. Private residential construction work done had declined slightly in the June quarter, suggesting there had been limited easing of capacity constraints associated with finishing trades. Contacts in liaison reported that build times had improved modestly in preceding months and anticipated that they would return to more typical levels in 2024.
Members observed that business conditions had been relatively stable at around average levels in preceding months. Business investment was expected to have increased solidly in the June quarter. That said, in liaison, firms' investment intentions for the coming year had softened a little, driven by a range of factors including a slowing economy.
International financial markets
Members commenced their discussion of conditions in international financial markets by reviewing recent developments in China. Financial pressures on property developers had intensified during August. Property sales had fallen further during the month, to be around the level of a decade earlier. The equity and bond prices of property developers had declined sharply as weakening demand for new property continued to weigh on earnings. Notably, one of China's largest property developers was restructuring its onshore debt and had failed to make timely payments on its offshore debt. Given the levels of stress in the sector, further defaults were widely expected.
Members noted that stress in China's property sector had potential implications for the broader economy and financial system there. Households in China hold a significant share of their wealth in housing assets, and weakness in the property sector may be affecting households' confidence and spending. Additionally, land sales to property developers are an important source of income for local governments, whose finances are already stretched. China's shadow banking sector also has significant exposures to the property sector, and a large financial services provider had missed payments on several trust products in August. Authorities had made some adjustments to policies in response to the stress, including by further easing home buyer purchase restrictions and extending some existing support measures, but these had not yet had a discernible effect.
The People's Bank of China had eased monetary policy a little further in August in response to slowing economic activity. Chinese Government bond yields had declined and the Chinese renminbi had depreciated to its lowest level since late 2022. Members noted that authorities in China had stepped up their efforts to limit the speed of exchange rate depreciation and deter speculation in the currency.
In advanced economies, expectations for central bank policy rates had been little changed over the prior month, with most advanced economy central banks either at or nearing the expected peaks implied by market pricing. Longer term sovereign bond yields of advanced economies had increased and yield curves had steepened. Longer term market-based inflation expectations had remained stable against a backdrop of moderating headline inflation. Equity prices in major markets had been little changed. Corporate bond spreads had declined over preceding months, reflecting both expectations that central bank policy rates were near their peaks and an easing of concerns about the likelihood of a recession.
The Australian dollar had depreciated over the prior month, reflecting concerns about the outlook for the Chinese economy and a broad appreciation of the US dollar as US Treasury yields increased.
Domestic financial markets
Members observed that market expectations for the cash rate had declined over the prior month or two, as had market economists' expectations. This followed the Board's decision to hold the cash rate steady at its August meeting and the slightly weaker-than-expected domestic data over the prior month, as well as the economic and financial news from China.
Members noted that the average outstanding mortgage rate in Australia was now higher than in several other peer economies, despite the policy rate in Australia being somewhat lower; this reflects the higher share of variable-rate mortgages in Australia and shorter maturity of fixed-rate loans. As such, the household cashflow channel of monetary policy for borrowers is more pronounced in Australia than in many other countries. Scheduled mortgage payments rose to 9.7 per cent of household disposable income in July, a little above the estimated previous historical high. Members noted that aggregate payments were set to increase further as more borrowers with fixed-rate loans roll off onto higher rates.
Credit growth had stabilised over prior months, having slowed earlier in the year. New housing loan commitments had declined in June and July to be almost 30 per cent below their peak in January 2022. New commitments as a share of housing credit were at low levels, consistent with large increases in mortgage rates and declines in housing prices since the start of the tightening period. However, housing loan commitments were 6 per cent higher than in February this year, consistent with the rebound in housing prices over that period. Investors accounted for about two-thirds of the rise in commitments over prior months, as commitments for owner-occupiers had risen only slightly.
Members observed that current market pricing implied no expectation of a change in the cash rate at this meeting, and around a 40 per cent chance of one further increase by the end of 2023. Market economists had also revised lower their expectations for further increases in the cash rate this year; the average expected peak in the cash rate had declined from 4.45 per cent prior to the August meeting to around 4.3 per cent subsequently. The number of economists no longer expecting a further increase in the cash rate had risen.
Considerations for monetary policy
In turning to the policy decision, members noted that inflation was still too high and was expected to remain so for an extended period. The experience in other countries continued to suggest that services price inflation might take some time to decline. Members also observed that the data received on wages over the prior month had been broadly consistent with the Bank's forecasts; the labour market remained tight but conditions were easing.
Members noted that the economy was experiencing a period of subdued growth. This was being led by household consumption, as high inflation weighed on household incomes and the effects of prior tightening in monetary policy worked their way through the economy. The outlook for the Chinese economy had also become more uncertain over the prior month, and there were several channels through which this could affect Australia.
Members noted the decline in market expectations for the peak in the cash rate since the previous meeting. At the same time, longer term yields in advanced economies had risen, suggesting investors had become more confident that inflation could return to target without a sharp slowing in the economy. Members also observed that housing prices in Australia had continued to increase, as strengthening demand from investors offset still-subdued demand from owner-occupiers.
In light of these observations, members considered two options for monetary policy at this meeting: raising the cash rate target by a further 25 basis points; or holding the cash rate target steady.
The case to raise the cash rate further was based on the expectation that inflation will remain above the Bank's target for a prolonged period and the risk that this period might be extended. This could occur if productivity growth does not pick up as anticipated or if high services price inflation is more persistent than expected. Members observed that, were inflation to remain above target for an even longer period, this could cause inflation expectations to move higher, which would be likely to require an even larger increase in interest rates in the future. Such an outcome would be costly for the economy. Members noted that the recent rise in petrol prices – an important input for households' inflation expectations – highlighted that the process of returning inflation to target could be uneven.
The case to hold the cash rate unchanged at this meeting was based on the observation that interest rates had been increased significantly in a short period, and that the effects of tighter monetary policy were yet to be fully realised. While evidence suggested interest rates were working to bring aggregate demand into closer alignment with aggregate supply, lags in the transmission of monetary policy meant that the full effects of the tightening since May 2022 would take time to be apparent in the data.
Members noted that there was a risk the economy could slow more sharply than forecast. Consumption could be weaker than expected, and the downside risks to the Chinese economy had increased. On balance, though, members concluded that recent developments had not materially altered the outlook or their assessment that the economy still appears to be on the narrow path by which inflation comes back to target and employment continues to grow.
In weighing up the two options, members agreed that the case to keep the cash rate target unchanged at this meeting was the stronger one. The recent flow of data was consistent with inflation returning to target within a reasonable timeframe while the cash rate remained at its present level. Members recognised the value of allowing more time to see the full effects of the tightening of monetary policy since May 2022, given the lags in the transmission of policy through the economy.
In reaching this decision, members noted that some further tightening in policy may be required should inflation prove more persistent than expected. In assessing the need for such a move, members affirmed that they will be guided by the incoming data and how these alter the economic outlook and the assessment of risks. In making its decisions, the Board will continue to pay close attention to developments in the global economy, trends in household spending and the outlook for inflation and the labour market. Members reaffirmed their determination to return inflation to target within a reasonable timeframe and their willingness to do what is necessary to achieve that outcome.
The decision
The Board decided to leave the cash rate target unchanged at 4.1 per cent, and the interest rate on Exchange Settlement balances at 4 per cent.
GBP/USD Slides Further As Dollar Extends Rally
Key Highlights
- GBP/USD declined further and traded below 1.2420.
- A major bearish trend line is forming with resistance near 1.2440 on the 4-hour chart.
- Bitcoin price spiked and broke the $27,000 resistance.
- Crude oil prices are unstoppable as the bulls aim for $92.50.
GBP/USD Technical Analysis
The British Pound remained in a bearish zone below 1.2500 against the US Dollar. GBP/USD started a fresh decline and traded below the 1.2480 support.
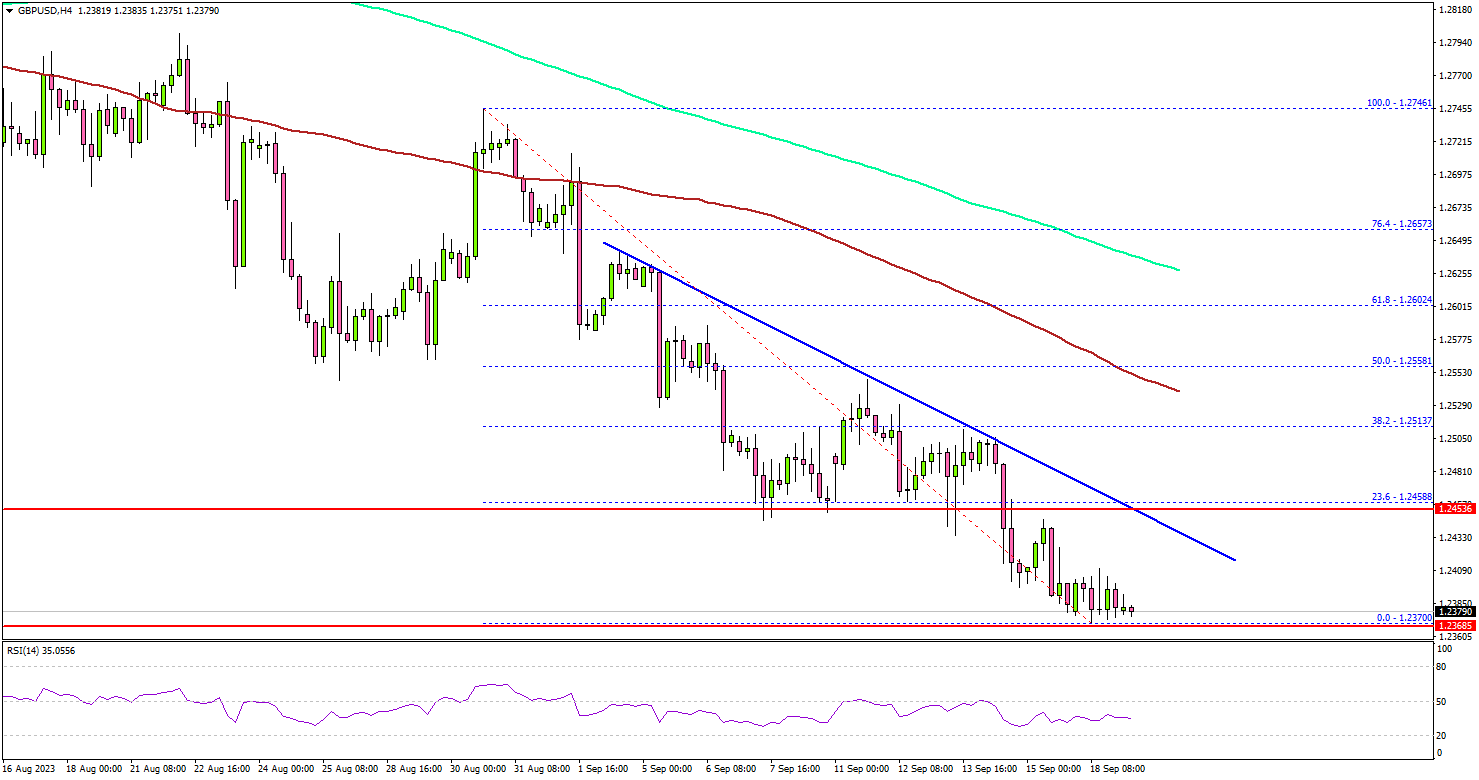
Looking at the 4-hour chart, the pair settled below the 1.2450 support, the 100 simple moving average (red, 4 hours), and the 200 simple moving average (green, 4 hours).
The bears even pushed it below 1.2420 and the pair traded to a new multi-week low. It is now consolidating losses and trading well below the 23.6% Fib retracement level of the downward move from the 1.2746 swing high to the 1.2370 low.
On the upside, the pair might face resistance near 1.2420. The next major resistance is near the 1.2450 zone. There is also a major bearish trend line forming with resistance near 1.2440 on the same chart.
A close above 1.2450 could start a decent recovery wave. In the stated case, the pair could rise toward the 1.2500 level. Any more gains might send GBP/USD toward the 50% Fib retracement level of the downward move from the 1.2746 swing high to the 1.2370 low at 1.2550.
On the downside, immediate support is near 1.2370. The next key support is seen near the 1.2350 level. If there is a move below 1.2350, the pair could dive toward 1.2265. Any more losses might send the pair toward the 1.2220 level.
Looking at Crude oil prices, the bulls seem to be in full control, and they seem to be aiming for a move toward the $92.50 level.
Economic Releases
- US Housing Starts for August 2023 (MoM) – Forecast 1.440M, versus 1.452M previous.
- US Building Permits for August 2023 (MoM) – Forecast 1.445M, versus 1.443M previous.
- Canadian Consumer Price Index for August 2023 (MoM) – Forecast +0.2%, versus +0.6% previous.
- Canadian Consumer Price Index for August 2023 (YoY) – Forecast +3.8%, versus +3.3% previous.
Impact of UAW Strike on FX Market
- UAW President Fain on latest offer – “It’s definitely a no-go.”
- A prolonged UAW strike could disrupt the US growth exceptionalism trade
- The impact of the strike is not as disruptive but it could lead to a lengthier period of production disruption
The three Detroit automakers and the United Auto Workers (UAW) union appear to be far from ending the strike that has now entered its fourth day. It is clear that American car manufacturers, Ford (F), GM (GM), and Stellantis (STLA) will be having higher costs once a deal is reached. There has been some relief that onset of the strike won’t be as bad as initially thought. The longer the hold out, the greater the impact on the economy.
These negotiations might last a while as many autoworkers haven’t had a meaningful raise in over 15 years. The union is looking for wage increases of 36% over the next four years, which matches what chief executives have received. In addition to wage increases, they are also looking to bring back pensions. Over the weekend, the UAW rejected a 20% offer from both Ford and GM, while Stellantis proposed a 21% increase.
The longer this strike lasts, the greater the impact on the economy, which will eventually impact the FX market. An extended strike that lasts more than a couple weeks, will start to rattle markets. It seems, Wall Street has priced in a short strike already, but the risk that this lasts more than a couple weeks is growing.
USD/JPY Daily Chart
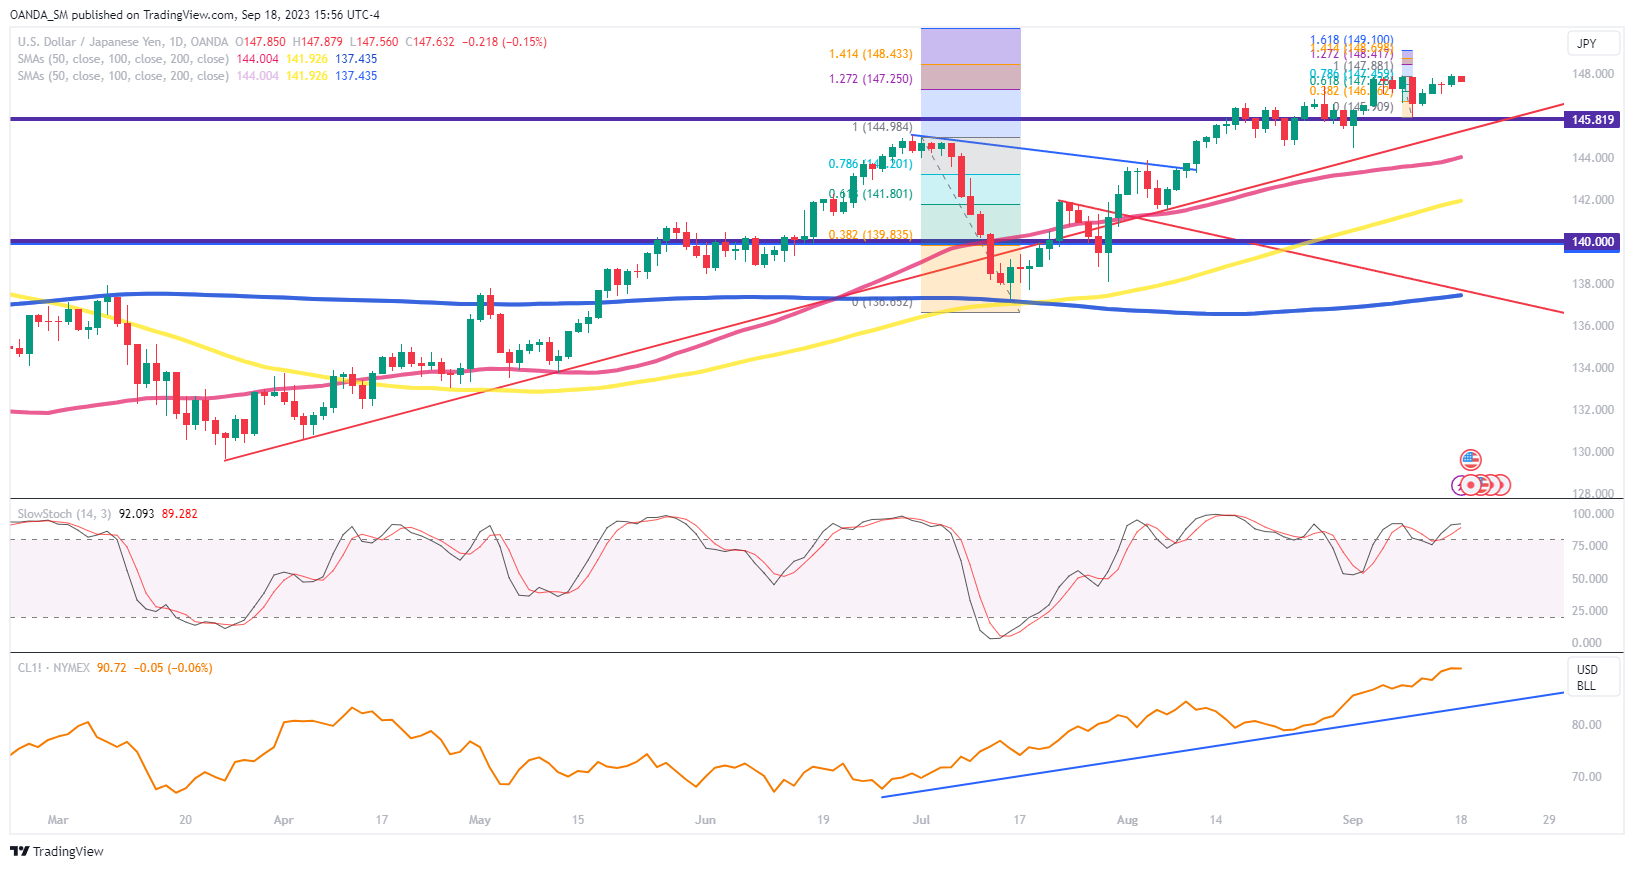
The dollar-yen trade remains focused on the BOJ commitment to an ultra-easy monetary stance and US growth exceptionalism and rising risks of more Fed tightening. If this week’s central bank actions by the Fed and BOJ don’t lead to any surprises, the bullish trend could remain intact. Unless growth prospects start to take a turn for the worse in the US, the dollar might remain supported over the short-term.
Key upside targets the 148.25, while downside eyes the 147.00 region. Major support remains at the 144 level, while upside targets remain the 150 price barrier.
Silver Wave Analysis
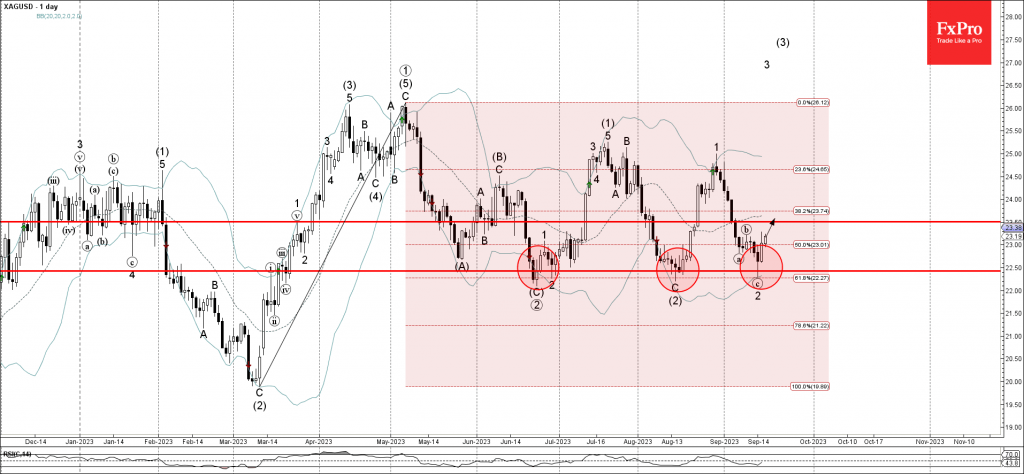
- Silver reversed from support level 22.50
- Likely to rise to resistance level 23.50
Silver recently reversed up from the strong multi-month support level 22.50 (which has been reversing the price from June) intersecting with the lower daily Bollinger Band and the 61.8% Fibonacci correction of the upward impulse from March.
The upward reversal from the support level 22.50 stopped the previous short-term ABC corrective wave 2.
Given the strength of the support level 22.50, Silver can be expected to rise further toward the next resistance level 23.50.