Sample Category Title
Impact of UAW Strike on FX Market
- UAW President Fain on latest offer – “It’s definitely a no-go.”
- A prolonged UAW strike could disrupt the US growth exceptionalism trade
- The impact of the strike is not as disruptive but it could lead to a lengthier period of production disruption
The three Detroit automakers and the United Auto Workers (UAW) union appear to be far from ending the strike that has now entered its fourth day. It is clear that American car manufacturers, Ford (F), GM (GM), and Stellantis (STLA) will be having higher costs once a deal is reached. There has been some relief that onset of the strike won’t be as bad as initially thought. The longer the hold out, the greater the impact on the economy.
These negotiations might last a while as many autoworkers haven’t had a meaningful raise in over 15 years. The union is looking for wage increases of 36% over the next four years, which matches what chief executives have received. In addition to wage increases, they are also looking to bring back pensions. Over the weekend, the UAW rejected a 20% offer from both Ford and GM, while Stellantis proposed a 21% increase.
The longer this strike lasts, the greater the impact on the economy, which will eventually impact the FX market. An extended strike that lasts more than a couple weeks, will start to rattle markets. It seems, Wall Street has priced in a short strike already, but the risk that this lasts more than a couple weeks is growing.
USD/JPY Daily Chart
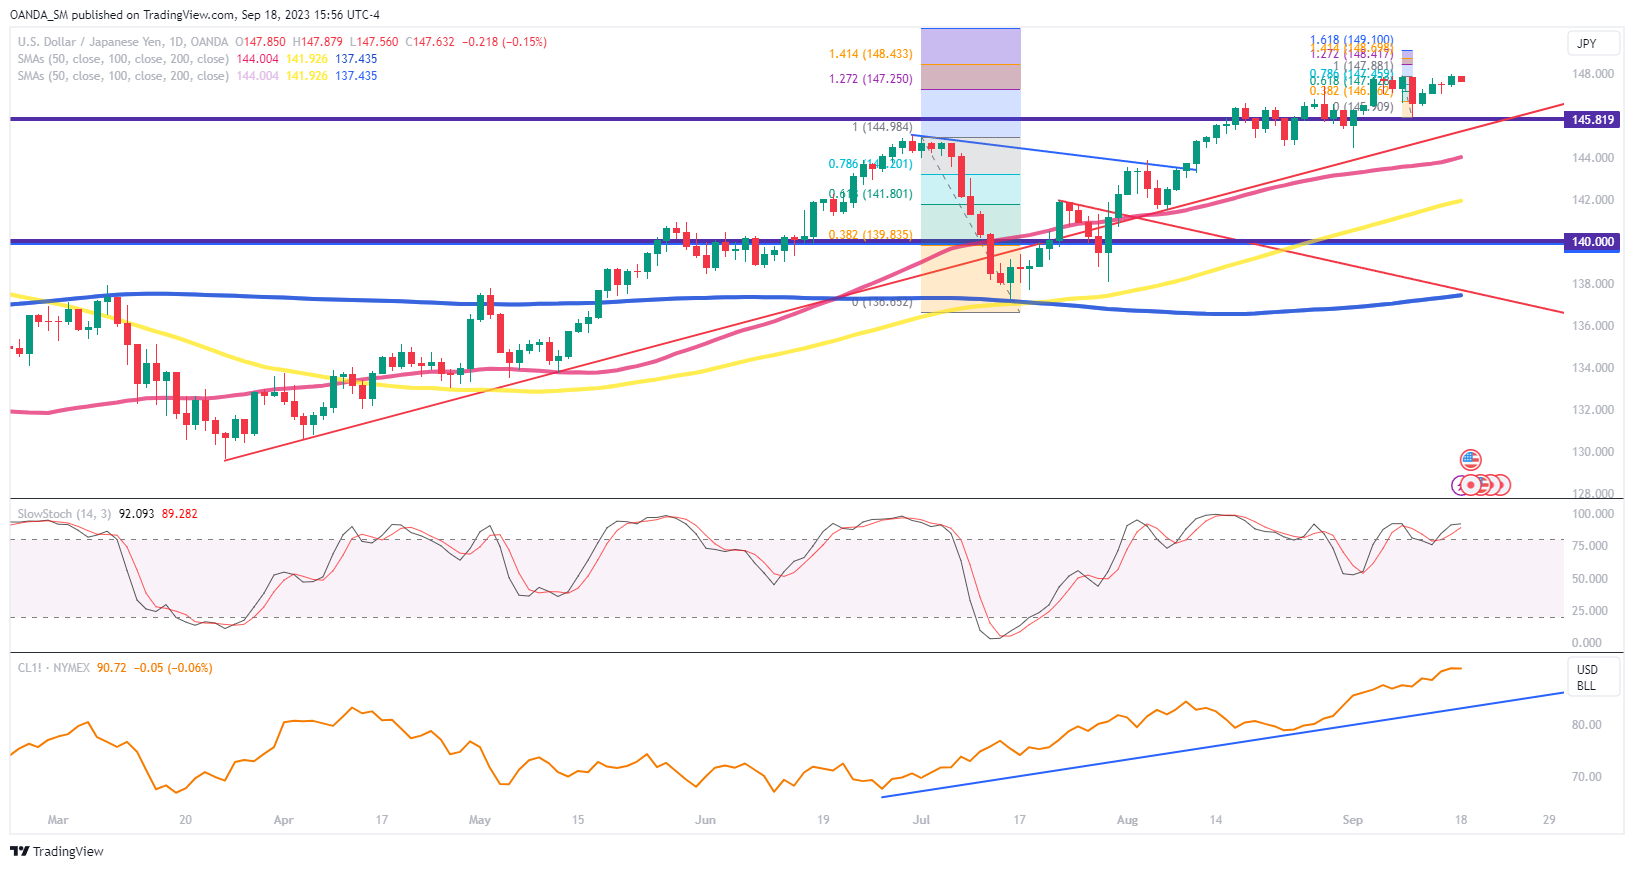
The dollar-yen trade remains focused on the BOJ commitment to an ultra-easy monetary stance and US growth exceptionalism and rising risks of more Fed tightening. If this week’s central bank actions by the Fed and BOJ don’t lead to any surprises, the bullish trend could remain intact. Unless growth prospects start to take a turn for the worse in the US, the dollar might remain supported over the short-term.
Key upside targets the 148.25, while downside eyes the 147.00 region. Major support remains at the 144 level, while upside targets remain the 150 price barrier.
Silver Wave Analysis
- Silver reversed from support level 22.50
- Likely to rise to resistance level 23.50
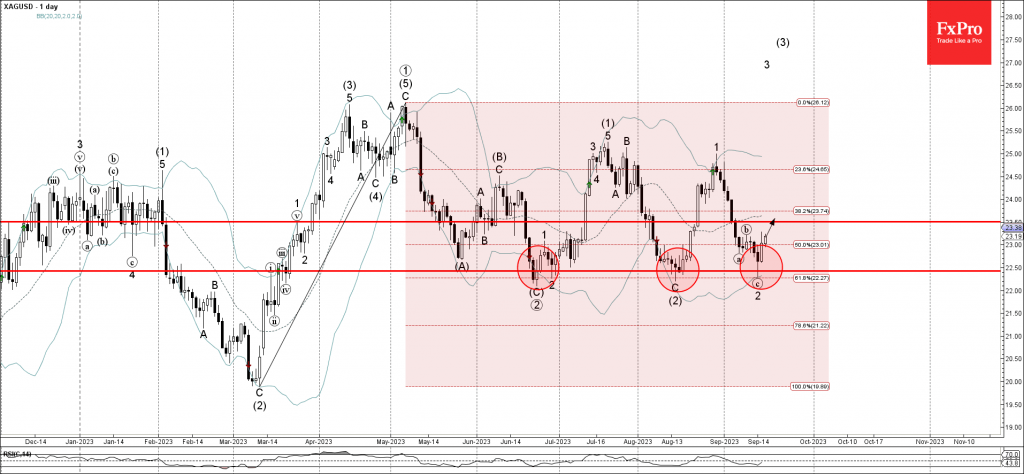
Silver recently reversed up from the strong multi-month support level 22.50 (which has been reversing the price from June) intersecting with the lower daily Bollinger Band and the 61.8% Fibonacci correction of the upward impulse from March.
The upward reversal from the support level 22.50 stopped the previous short-term ABC corrective wave 2.
Given the strength of the support level 22.50, Silver can be expected to rise further toward the next resistance level 23.50.
EURAUD Wave Analysis
- EURAUD reversed from support level 1.6535
- Likely to rise to resistance level 1.6800
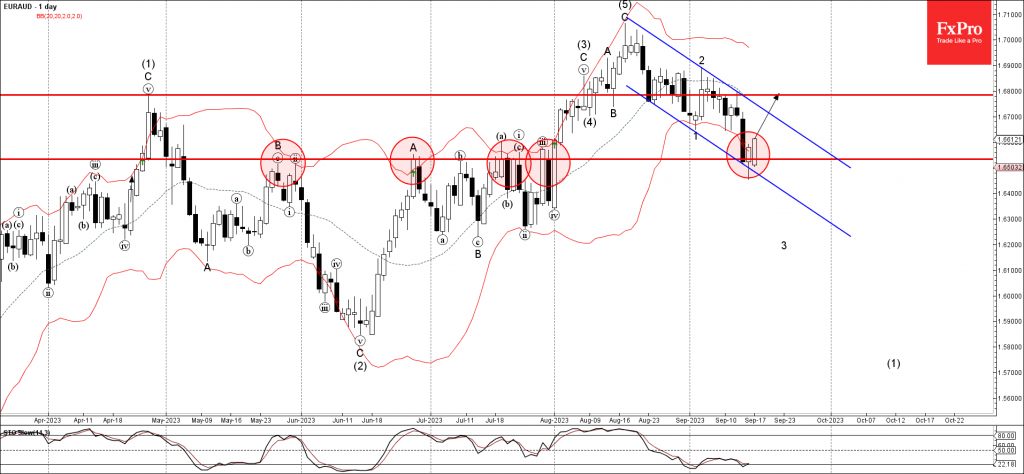
EURAUD currency pair recently reversed up from the support level 1.6535 (former resistance from May, June and July) intersecting with the lower daily Bollinger Band and the support trendline of the daily down channel from August.
The upward reversal from the support level 1.6535 stopped the previous short-term impulse wave 3.
Given the clear daily uptrend, EURAUD currency pair can be expected to rise further toward the next resistance level 1.6800.
A Bull Trap in Gold?
Gold added almost 1% on Friday, having managed to defend against a fall below $1900 the day before. The price tests the long-term and medium-term trends for the second month, leaving the Fed to make a decisive argument in favour of the bulls or the bears. Friday’s rise so far looks like a trap for the bears.
Gold closed last week minimally above its 200-day moving average. In the past two months, this is the second attempt by the bulls to prove that the dip below this line, which acts as a long-term trend indicator, was false, and the long-term uptrend is still in place.
However, this looks more like a temporary revenge, raising the chances of an even more disorganised retreat shortly.
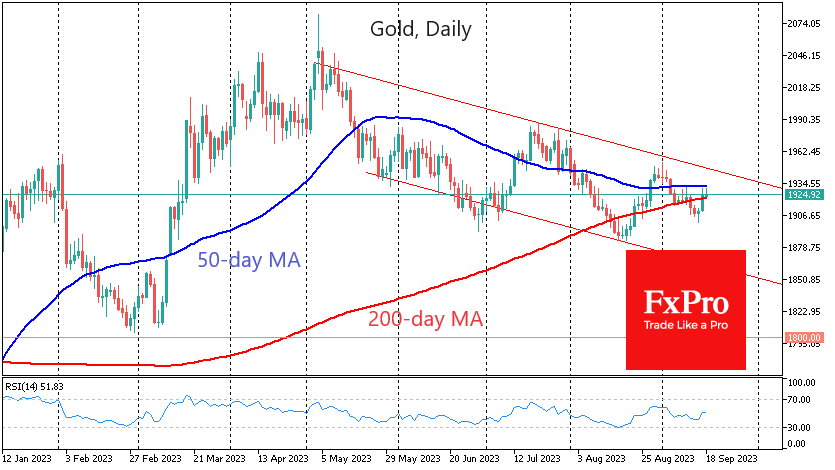
Gold’s performance in August also looks telling. Gold’s dip towards $1890 attracted buyers, but they quickly rushed to take profits on the approach to $1950 and failed to stay above the 50-day moving average for long.
Since May, gold has been in a downtrend with increasingly lower local highs (in May, July, and early September) and declining lows (in June and August).
Gold’s impulsive rebound late last week was counter-intuitive as it coincided with a broad sell-off in equities. However, there is often a direct correlation between these asset classes.
While a temporary balance of power can be seen in the market, we still see more potential for a bearish scenario. However, it has yet to prove its strength.
Thus, confidence in further declines will increase if gold returns under the 200-day moving average at $1922. In this case, we should expect a short-term decline under the previous lows at $1890 with a potential downside at $1850, the lower boundary of the descending channel formed.
Alternatively, if gold consolidates above $1930 and gains strength further above the 50-day moving average, it will make us consider a trend change to an uptrend.
In all cases, the market may give false signals until Wednesday evening, when we will see the market reaction to the Fed’s rate comments. The upcoming meeting has the potential to reverse the current short-term picture.
Gold Continues Three-Day Rally Amid Market Uncertainties: A Detailed Analysis
Gold prices are on a consecutive three-day rise, reaching $1930.00 per Troy ounce as of Monday. The upward trend seems to be fueled by investors seeking a hedge against uncertainties ahead of key events this week.
Investors are keenly awaiting the U.S. Federal Reserve's decision, which is widely expected to maintain the interest rate at 5.5% per annum. The primary focus will likely be on the Fed's outlook on the economy and inflation, which should provide valuable insights into the regulator's future course of action.
Additionally, the Bank of England and the Bank of Japan are set to hold their meetings this week, while the Reserve Bank of Australia (RBA) will release the minutes from its previous meeting.
Another contributing factor to gold's demand is the sudden depreciation in the yuan exchange rate, making the precious metal more attractive as a safe-haven asset.
Technical Analysis of XAU/USD price chart
On the 4-hour XAU/USD chart, a downward wave has concluded at $1901.00, followed by a corrective rally to $1930.00. A consolidation phase is anticipated below this level. Should the price break below the consolidation range, there's potential for an extension of the downward wave to $1893.40. The Moving Average Convergence Divergence (MACD) confirms this scenario, with its signal line positioned above zero but appearing to gear up for a downward movement.
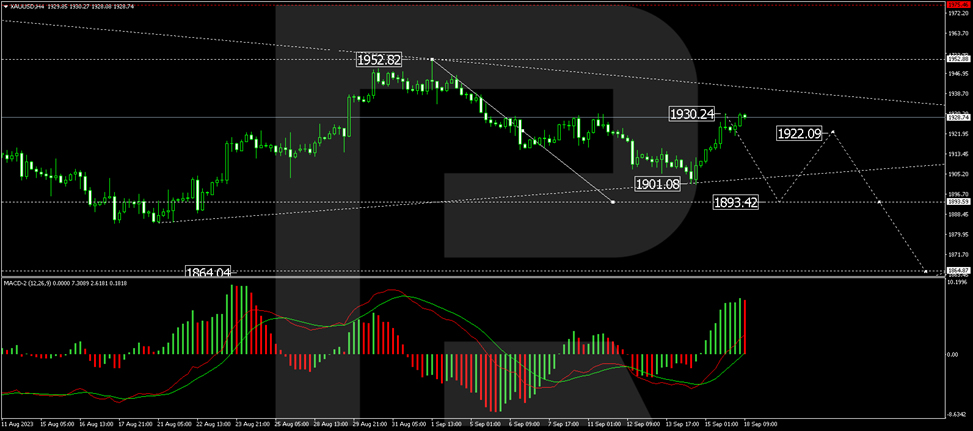
On the 1-hour chart, the price has formed a consolidation zone around $1915.85. Breaking out of this range to the upside, it has corrected to $1930.25. A retracement to $1915.00 is anticipated today. If this level is decisively breached, the door may open for a more significant drop to $1893.40. The Stochastic oscillator supports this outlook, showing its signal line above the 80 mark but trending strictly downward.
In summary, gold is experiencing a bullish streak, propelled by market uncertainties and key economic events on the horizon. Technical indicators point towards a possible short-term decline, but overall sentiment appears cautiously optimistic. Investors should closely monitor upcoming central bank meetings and currency fluctuations for further clues on the metal's future trajectory.
Cautious Start With An Abundance of Central Bank Meetings Ahead
A cautious start to the week ahead of a bunch of central bank meetings that will likely set the tone for the remainder of the year.
There's every chance that by the end of this week, the bulk of the major central banks have ended their tightening cycle and in many cases, signaled such as the ECB did last week. They'll never say definitively that it's over but, as the ECB did, they may indicate that it's their current view that they've hiked enough.
The question now is how much that tightening will weigh on economic prospects going forward and whether further inflation surprises are lurking ahead. We've clearly seen a cooling in the economy, with the US showing more resilience than most but still slowing and likely to further, but it's hard to imagine rates as high as they are for longer not packing a greater punch.
While there are some interesting economic releases over the next couple of days, for many the week really starts on Wednesday with UK inflation numbers and the Fed interest rate decision later on. After that, the central bank decisions will come thick and fast until Friday. It promises to be a fascinating week.
Relentless oil rally showing no signs of exhaustion
This oil rally has been relentless and I'm not seeing any signs of exhaustion yet. A 15% rally in the space of around three weeks to trade at levels not seen since last November and not far from triple figures, it's been an impressive move and there could be more to come.
Saudi Arabia and Russia have been very effective in squeezing a tight market that much further to create a situation in which oil prices are trading well above the zone they've been stuck around for much of the year. You would imagine there'll be a limit to their ambitions, not to mention their desire to continue the additional voluntary cuts but that may well depend on the demand side over the coming months.
They're committed until the end of the year but if demand softens as those additional cuts expire then the price could cool somewhat. The group has been heavily criticized over the last year for what were labelled unjustified cuts but for the bulk of that time, the price hasn't risen as much as thought. Is this a sign of cuts going a step too far or will demand weaken to the point of prices pulling back again?
Going testing major resistance zone
Gold has pulled off its lows in the final run-up to the Fed meeting, perhaps a sign of hope that we'll get a more dovish outcome than expected like we got from the ECB. The yellow metal slipped back to $1,900 late last week before rebounding higher to $1,930. This is where it also ran into significant resistance 10 days ago and could now represent a major technical level. A break of this could be very interesting, especially if it occurs ahead of the Fed meeting.
Sunset Market Commentary
Markets:
Friday’s market trends persist today in absence of eco data and with numerous central bank meetings lined up later this week (Fed, BoE, Norges Bank, Riksbank, SNB, BoJ). Key European stock markets lose over 1%, copying WS’s performance. The strike by the United Auto Workers union at the big three automakers (GM, Ford & Stellantis) for higher pay and other benefits is getting more and more attention and pulls the companies’ stocks lower. Core bonds face new selling pressure with the front end of the curves underperforming this time. US yields add 4 bps (2-yr) to 1.3 bps (30-yr). The US 2-yr yield (5.07%) is closing in on the 5.15% cycle high. The US 10-yr yield is already testing this reference at 4.35%. German yields today rise by 4.1 bps (5-yr) to 2.4 bps (30-yr). The German 10-yr yield (2.71%) has the 2.77% cycle top in sight with the German 30-yr yield (2.85%) currently at the highest level since end 2011. EUR/USD is going nowhere near 1.0670. ECB vice-governor de Guindos said that underlying inflation’s worst moment has passed and that it should moderate. However, rising energy prices add another element of uncertainty. Brent crude currently trades just below $95/b. The ECB’s September inflation forecasts imply an average oil price of $90b in the final 4 months of this year. ECB Kazimir hopes that last week’s rate increase is the final one, though he can’t rule out the possibility of others. Only the ECB’s March 2024 forecasts can confirm that inflation is heading unequivocally and steadily toward the 2% goal. If the ECB rates were at a top, it will be necessary to stay there for quite some time and spend the winter, spring and summer there, according to Kazimir. He says that the debate is now open to adjust the pace of quantitative tightening but wouldn’t touch the control buttons for the next six months.
The Belgian debt agency today raised a combined €2.3bn at its OLO auction by tapping OLO 97 (€1.31bn 3% Jun2033) and OLO 98 (€0.99bn 3.3% Jun2054). The auction bid cover (1.5) was weaker than at this year’s earlier taps. The richening of OLO’s following the debt agency’s bumper €22 bn retail note earlier this month is a probably cause. The debt agency now raised a total amount of €40.21bn of OLO funding compared to this year’s (downwardly revised) target of €42.1bn (95.5%). Separately, the Flemish community today announced near term syndicated benchmarks of a conventional short 9y bond (Jun2032) and a sustainable 19y bond (Sep2042). Flanders so far raised €1.53bn via regular benchmarks (vs €2.25-2.75bn official target). In their funding plan, they aim to raise between €1.25bn and €1.5bn via sustainable benchmarks. Private placements and short term funding should help bridge the remaining gap of this year’s total €8bn financing need.
News & Views:
After feeling substantial collateral damage in the wake of the unexpected 75 bps rate cut of the National bank of Poland (NBP), the Czech koruna succeeded a nice comeback today. The rebound comes after CNB Governor Michl in an interview with CNN Prime News yesterday dismissed calls for an early rate cut. The CNB governor indicated that a rate cut at the September (27) meeting is not at all on the table. Inflation came down to 8.5%, but was still labeled as being extremely high. He also assessed that core inflation is expected to remain at 3% or more which doesn’t allow to lower the policy rate. To make up its mind on the timing of a first rate cut, CNB will wait for further data, e.g. at the November policy meeting. The CNB governor also indicated to keep a restrictive monetary policy until it will be certain that inflation will stay around 2%, not only in the first half of 2024 but also thereafter. The Czech 2-y swap yield jumped about 10 bps at the open this morning but currently (5.14%) trades only 5 bps higher compared to Friday’s close. EUR/CZK dropped from the 24.57 area to currently trade near EUR/CZK 24.40.
The NBP today published its core inflation measures for the month of August. Polish inflation excluding food and energy prices printed at 0.3% M/M and 10% Y/Y from 0.2% M/M and 10.6% in July. Inflation excluding administered prices slowed from 9.6% to 8.9%. Inflation net of the most volatile prices slowed from 13.7% to 12.7%. Markets are closely monitoring Polish inflation data after the NBP’s 75 bps rate cut, leaving the Polish currency with a substantial negative real rate. EUR/PLN found a new short-term equilibrium near EUR/PLN 4.65 (currently 4.64) from levels near EUR/PLN 4.46 before the surprise rate cut.
USD/JPY Mid-Day Outlook
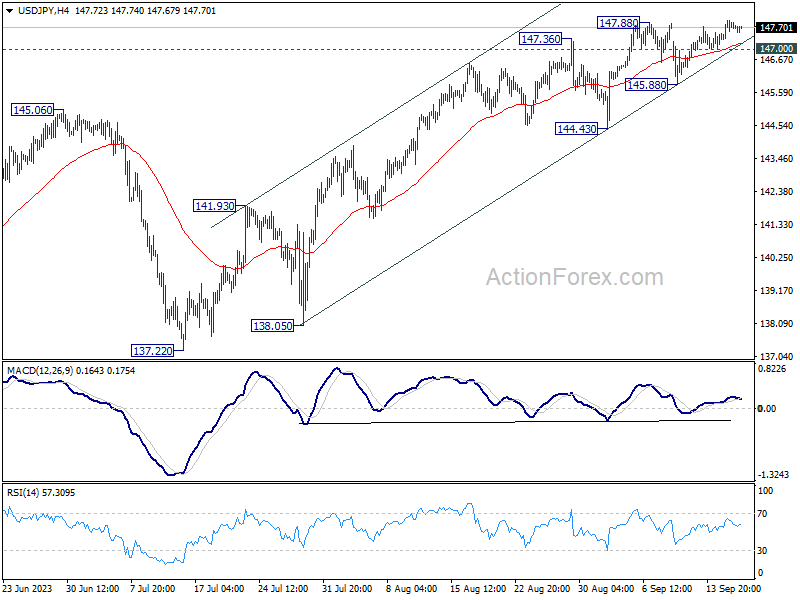
Daily Pivots: (S1) 147.48; (P) 147.71; (R1) 148.09; More...
Intraday bias in USD/JPY remains mildly on the upside at this point. Current rise is part of the whole rally from 127.20, and should target 151.93 high. On the downside, below 147.00 minor support will turn intraday bias neutral again first. But outlook will remain bullish as long as 145.88 support holds.
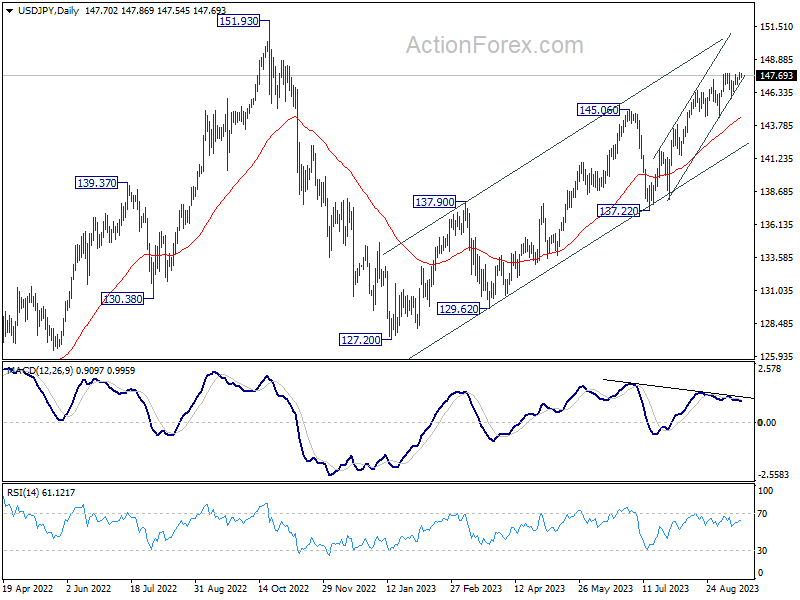
In the bigger picture, while rise from 127.20 is strong, it could still be seen as the second leg of the corrective pattern from 151.93 (2022 high). Rejection by 151.93, followed by break of 137.22 support will indicate that the third leg of the pattern has started. However, sustained break of 151.93 will confirm resumption of long term up trend.
USD/CHF Mid-Day Outlook
Daily Pivots: (S1) 0.8956; (P) 0.8967; (R1) 0.8989; More....
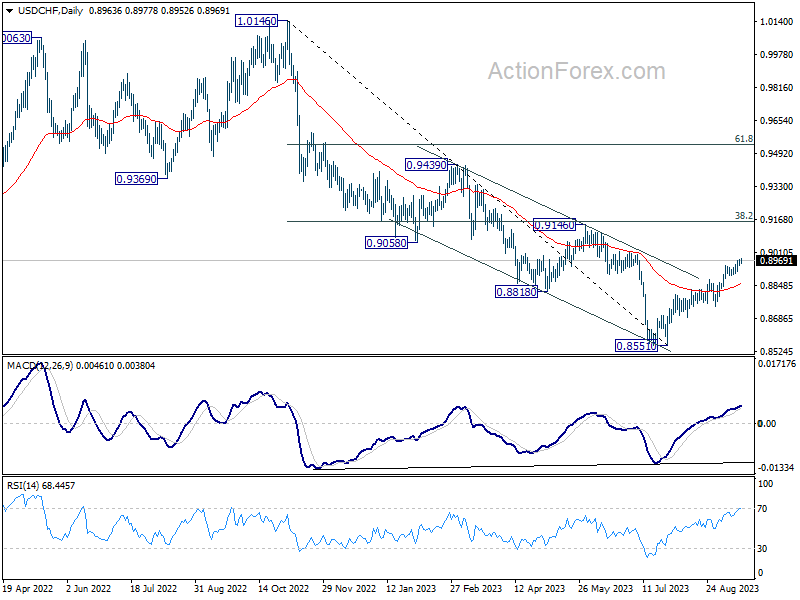
No change in USD/CHF's outlook and intraday bias remains on the upside. Current rise from 0.8551 is in progress for 0.9146 cluster resistance. On the downside, however, break of 0.8893 support will argue that a short term top is possibly formed, and turn bias back to the downside for 55 D EMA (now at 0.8854).
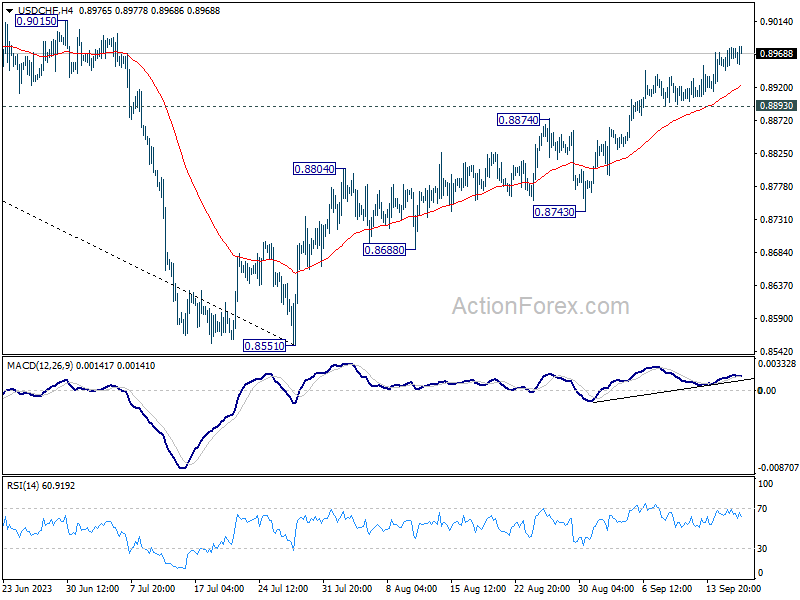
In the bigger picture, rebound from 0.8551 medium term bottom is currently seen as a correction to the downtrend from 1.0146 (2022 high). Further rally would be seen to 0.9146 cluster resistance (38.2% retracement of 1.0146 to 0.8551 at 0.9160). Strong resistance could be seen there to limit upside, at least on first attempt.