Sample Category Title
USD/JPY: Bulls Hold Grip Ahead of Fed and BOJ Policy Meetings
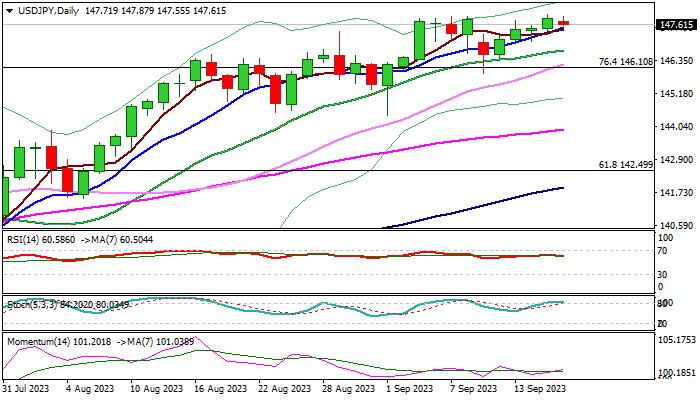
USDJPY keeps firm tone and holds within a narrow range just under new multi-month highs (147.87/95) in European trading on Monday.
Today’s quiet mode is mainly due to lower volumes as Japan is shut for holidays, while traders became more cautious ahead of two key events this week – US Federal Reserve and Bank of Japan policy meetings.
The Fed will end its two-day meeting on Thursday and BOJ meets on Friday, with both central banks widely expected to stay on hold this time, though surprises cannot be ruled out, especially after recent comments from BOJ governor who mentioned possible earlier than expected start of tightening monetary policy.
Markets are likely to face increased volatility this week, with focus on comments from FOMC, in light of recent solid economic data, which partially ease pressure on Fed and BOJ’s guidance about the conditions required to start reversing current negative policy.
Technical structure is positive and reinforced by four consecutive weekly closes above former pivotal resistance, now reverted to strong support at 146.10 (Fibo 76.4% of 151.94/127.22) as well as strong bullish momentum.
Near-term bias is expected to remain with bulls while the action stays above 146.10 and keep in play hopes of final push towards psychological 150 barrier (last time tested in mid-October 2022).
Caution on break below 146.10 which would risk deeper pullback and.
Res: 148.00; 148.59; 148.84; 149.70.
Sup: 147.16; 146.10; 145.06; 144.44.
Gold Challenges Crucial Downward Sloping Trendline
- Gold in a congested technical territory, capped by 50-day SMA
- A decisive close above the trendline could shift the short-term picture to bullish
- Momentum indicators endorse latest advance
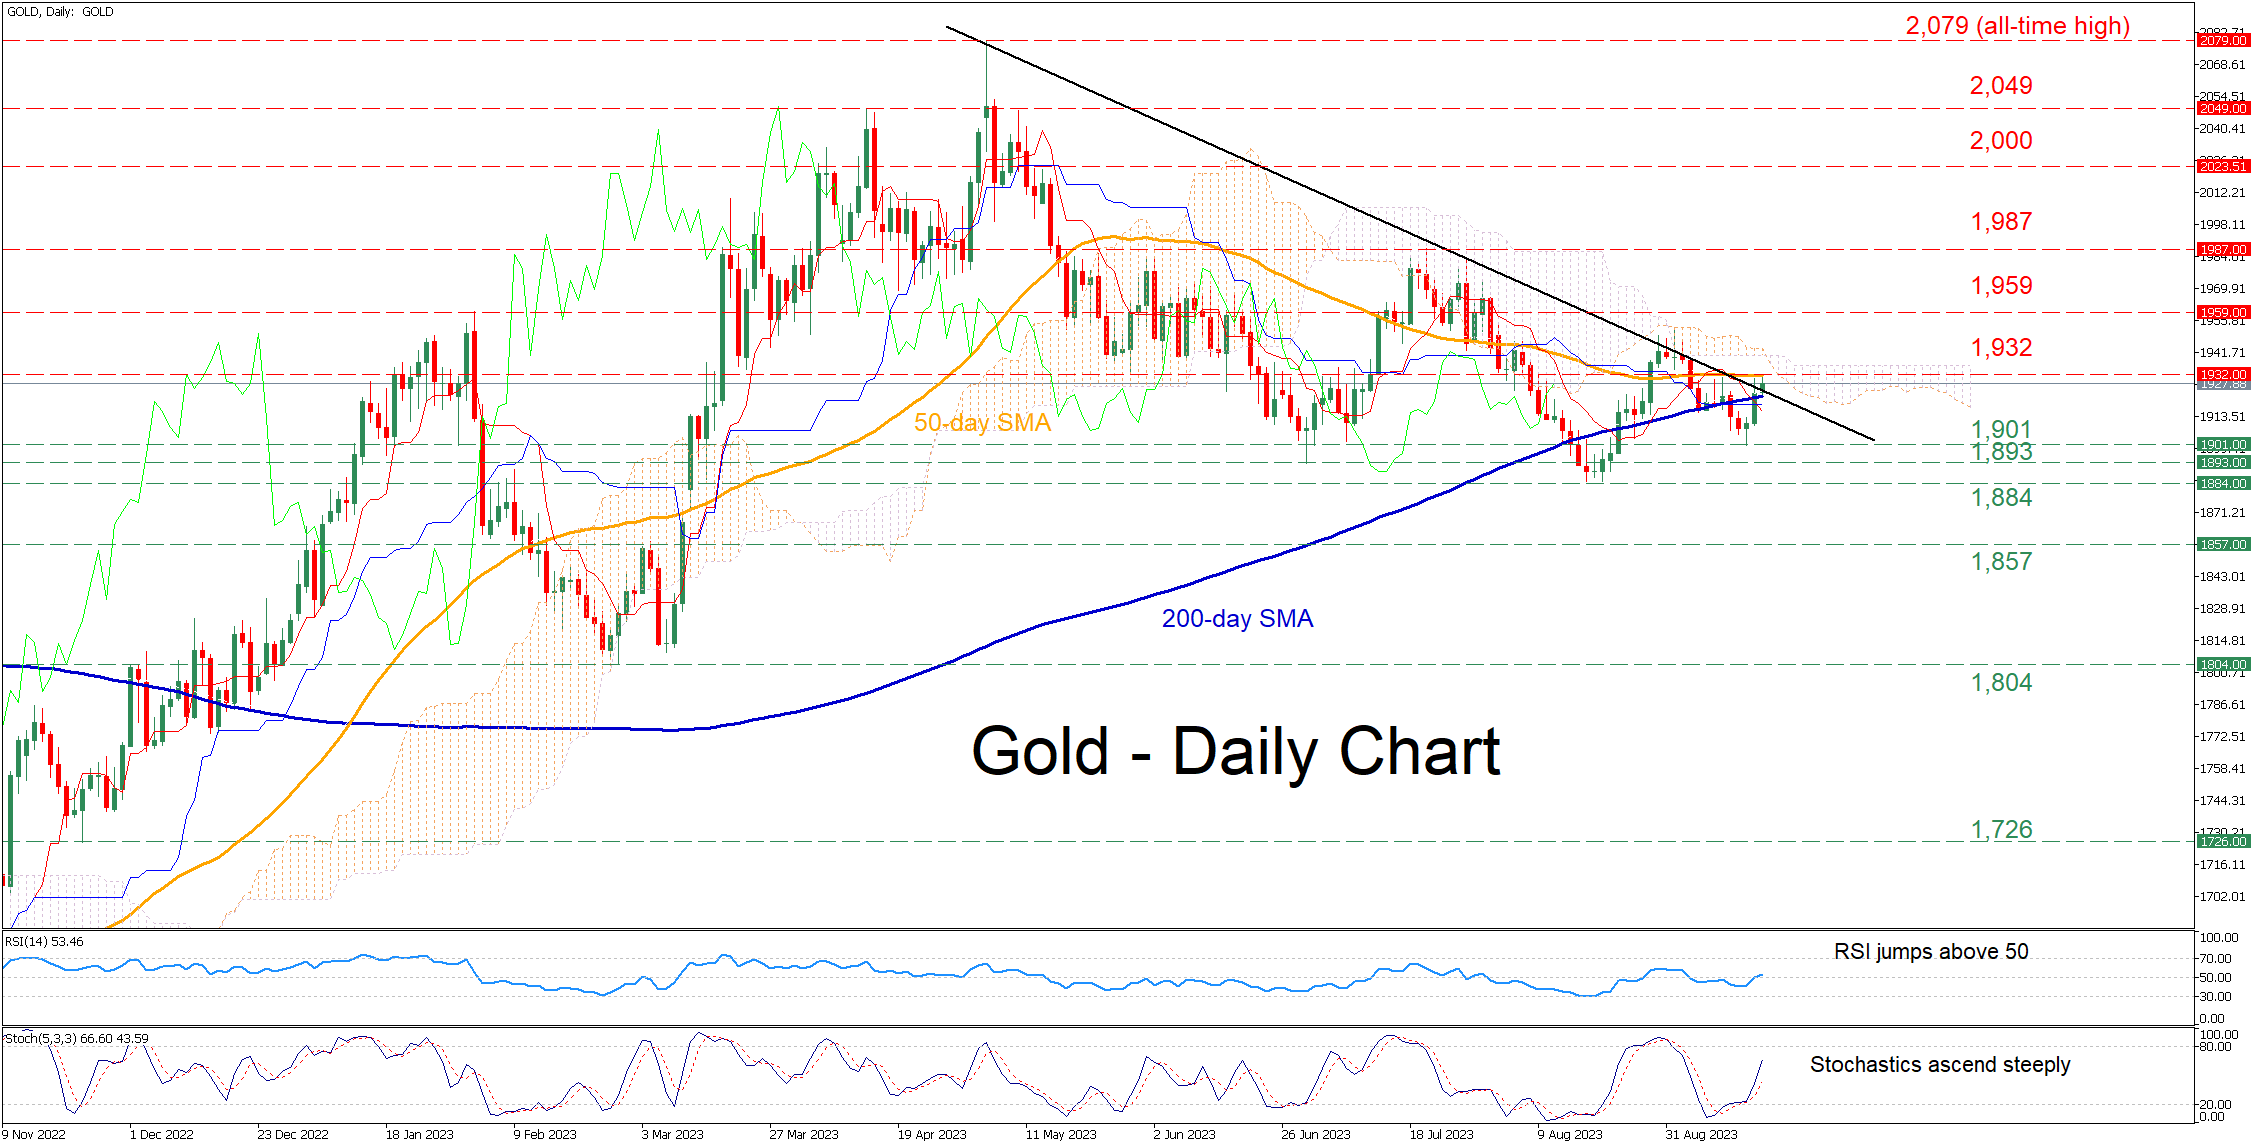
Gold has been edging higher in the past few sessions, rebounding strongly from its drop below the 200-day simple moving average (SMA). Furthermore, the short-term oscillators suggest that bullish forces are strengthening as the price is testing the important trendline that connects its recent lower highs.
Should the buying interest persist, the bulls could attempt to conquer the May low of 1,932, which overlaps with the 50-day SMA. Surpassing that zone, the price may ascend towards the February peak of 1,959. Further advances could then cease at the July high of 1,987.
Alternatively, should bullion reverse back lower, the recent support of 1,901 could act as the first line of defense. A break beneath that zone might set the stage for the June low of 1,893. Even lower, the five-month bottom of 1,884 may provide downside protection.
In brief, gold marched towards the congested region that includes the descending trendline and its 50-day SMA. Looking forward, a clear jump above both obstacles is needed to turn the technical outlook back to bullish.
GBP/JPY Daily Outlook
Daily Pivots: (S1) 182.60; (P) 183.26; (R1) 183.73; More...
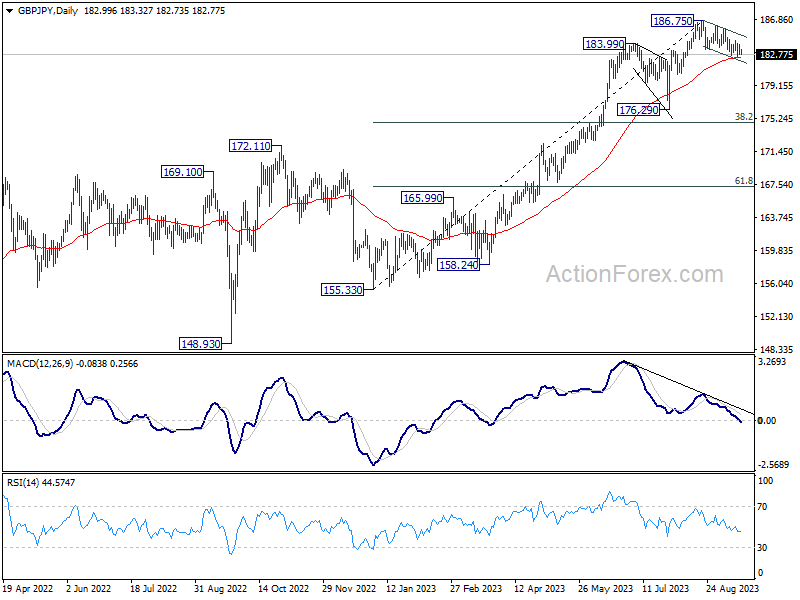
With 184.39 resistance holds, GBP/JPY's choppy decline from 186.75 is extended to continue. Sustained trading below 55 D EMA (now at 182.44) will argue that it's already in a larger scale correction and target 176.29 support next. On the upside, break of 184.39 resistance will argue that the pull back from 186.75 has completed. Intraday bias will be turned back to the upside for 185.76 resistance next.
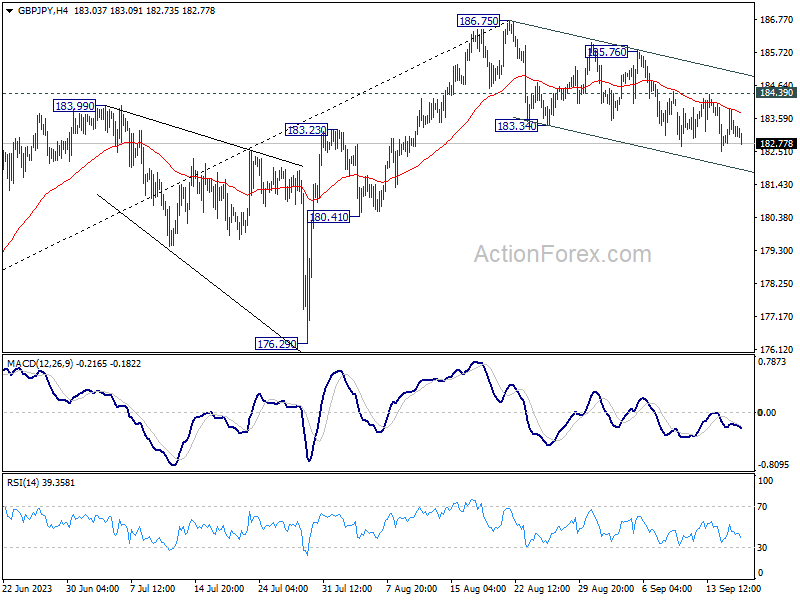
In the bigger picture, as long as 176.29 support holds, larger up trend from 123.94 (202 low) should still be in progress. Break of 186.75 will target 195.86 (2015 high). Nevertheless, firm break of 176.29 will confirm medium term topping, and turn outlook neutral for lengthier and deeper consolidations.
EUR/JPY Daily Outlook
Daily Pivots: (S1) 156.92; (P) 157.41; (R1) 158.10; More....
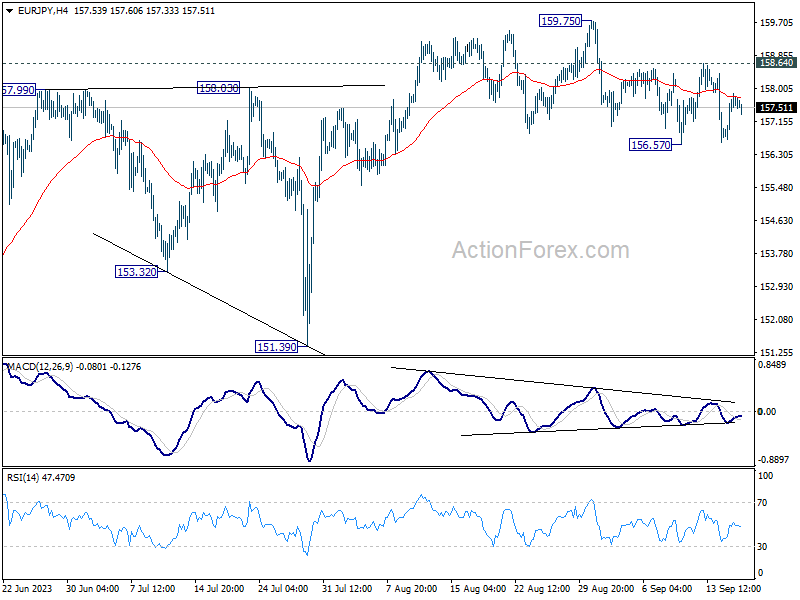
Intraday bias in EUR/JPY remains neutral for the moment. Risk will be mildly on the downside as long as 158.64 resistance holds. Break of 156.57 support, and sustained trading below 55 D EMA (now at 156.73) will argue that fall from 159.75 is a larger scale correction. Deeper decline would be seen back towards 151.39 support. Nevertheless, above 158.64 would bring retest of 159.75 high instead.
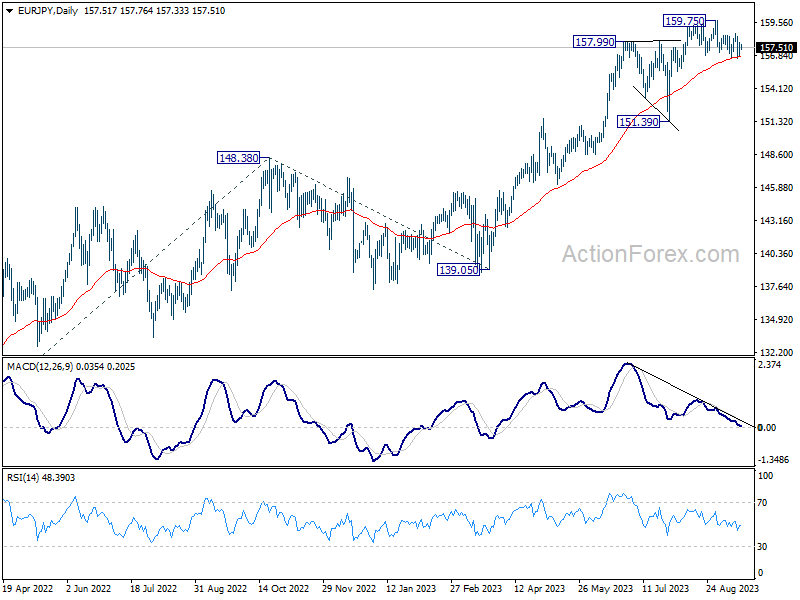
In the bigger picture, as long as 151.39 support holds, rise from 114.42 is still expected to continue. Next target is 100% projection of 124.37 to 148.38 from 139.05 at 163.06. Sustained break there will pave the way to retest long term resistance at 169.96.
EUR/GBP Daily Outlook
Daily Pivots: (S1) 0.8580; (P) 0.8598; (R1) 0.8627; More...
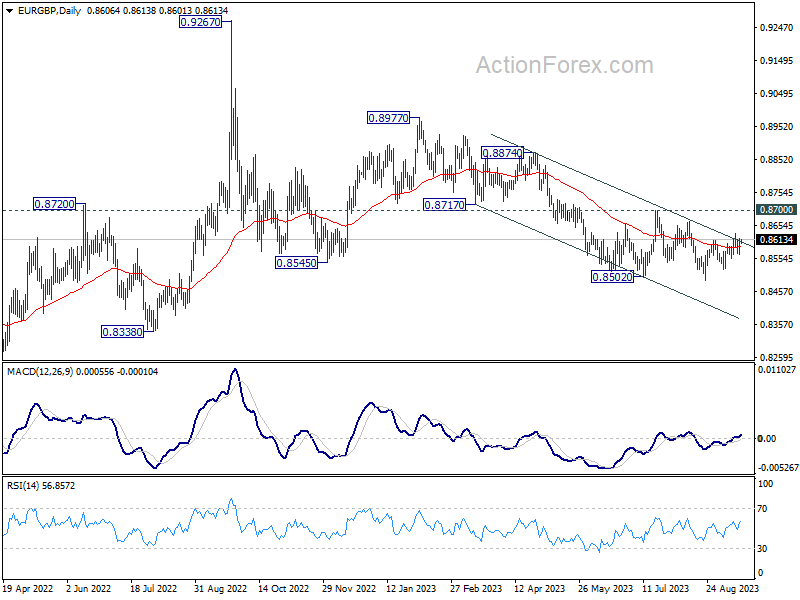
Intraday bias in EUR/GBP remains neutral first. Rise from 0.8491 is seen as the third leg of the corrective pattern from 0.8502. Above 0.8609 resistance will bring stronger rise to 0.8667/8700 resistance zone. On the downside, below 0.8522 will bring retest of 0.8491 support.
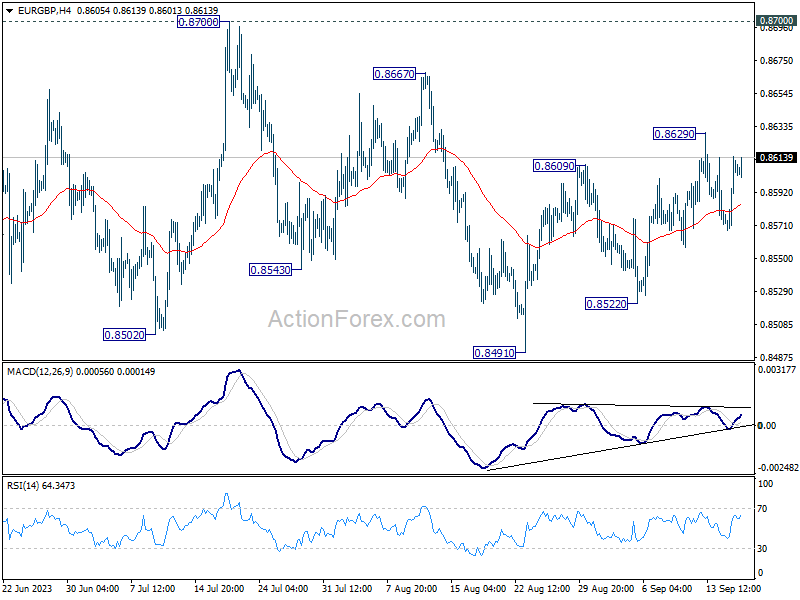
In the bigger picture, the down trend from 0.9267 (2022 high) is seen as part of the long term range pattern from 0.9499 (2020 high). Fall from 0.8977 is seen as the third leg. As long as 0.8700 resistance holds, further decline is still expected. Break of 0.8491 will resume the fall towards 0.8201 (2022 low). Nevertheless, firm break of 0.8700 will now be a sign of bullish reversal.
EUR/AUD Daily Outlook
Daily Pivots: (S1) 1.6450; (P) 1.6591; (R1) 1.6667; More...
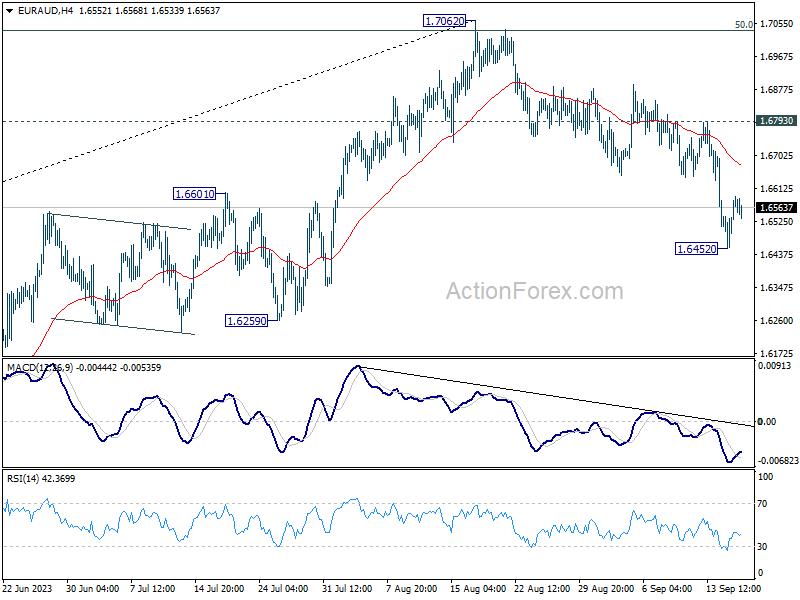
Intraday bias in EUR/AUD is turned neutral with current recovery, and some consolidations could be seen. But risk will stay on the downside as long as 1.6793 resistance holds. Fall from 1.7062 is seen as a larger scale correction. Below 1.6452 will target 1.6000 fibonacci level.
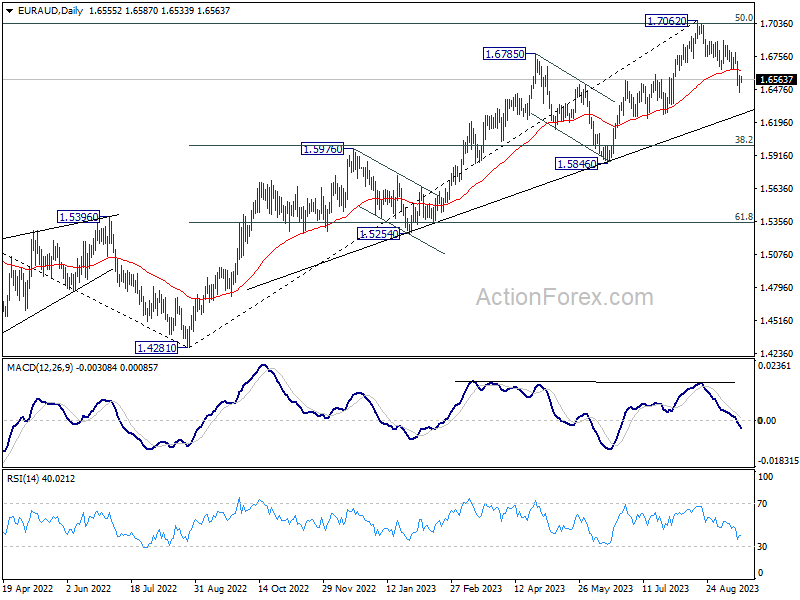
In the bigger picture, current development argues that fall from 1.7062 is probably correcting whole up trend from 1.4281. Deeper decline would be seen to 38.2% retracement of 1.4281 to 1.7062 at 1.6000. Strong support should be seen there to bring rebound, at least on first attempt.
EUR/CHF Daily Outlook
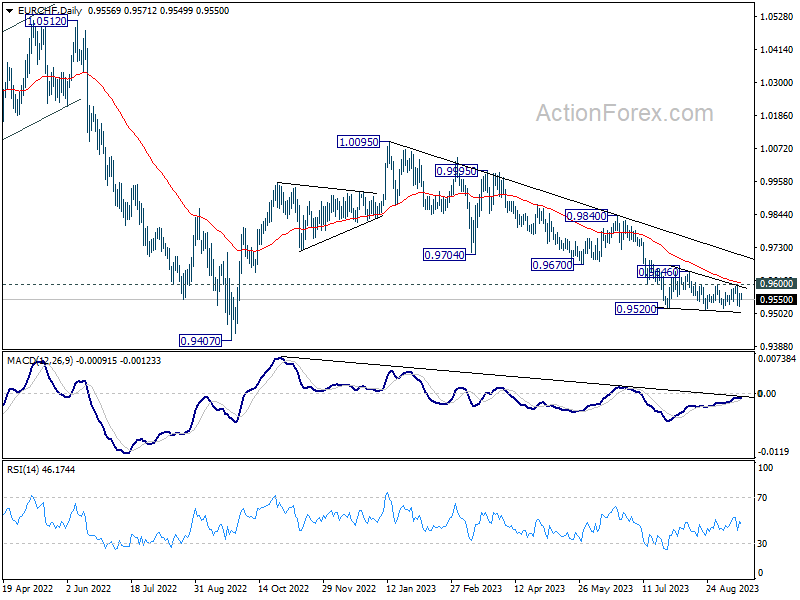
Daily Pivots: (S1) 0.9541; (P) 0.9557; (R1) 0.9585; More...
Intraday bias in EUR/CHF stays neutral as sideway trading continues. As long as 0.9600 resistance holds, downside breakout is in favor. Firm break of 0.9513 will resume larger fall from 1.0095 to 0.9407 low. Nevertheless, on the upside, sustained break of 0.9066 resistance will indicate that strong rebound is underway, and turn bias back to the upside for 0.9840 resistance.
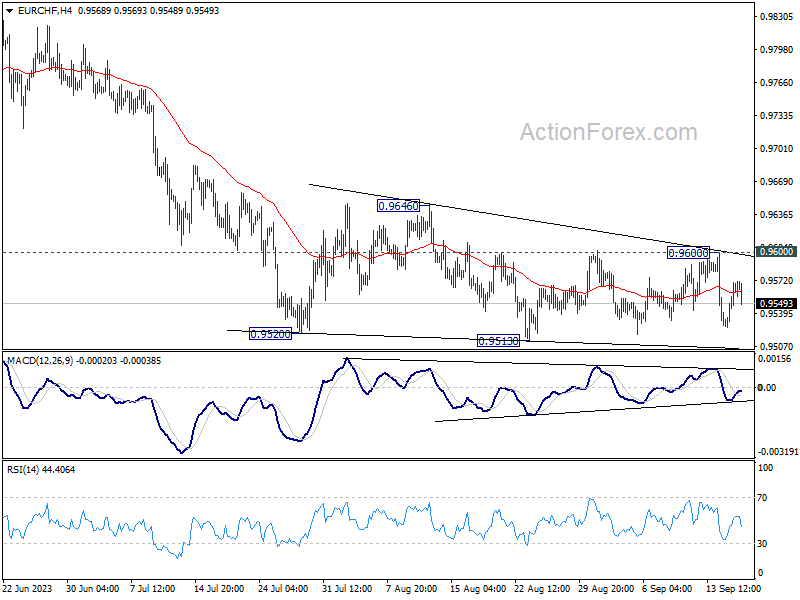
In the bigger picture, medium term outlook is staying bearish as the cross is capped well below falling 55 W EMA (now at 0.9818). Down trend from 1.2004 (2018 high) is in favor to continue. Sustained break of 0.9407 will target 61.8% projection of 1.1149 to 0.9407 from 1.0095 at 0.9018. For now, this will remain the favored case as long as 0.9670 support turned resistance holds, in case of strong rebound.
US 500 Cash Index Prepares for Wednesday’s Event
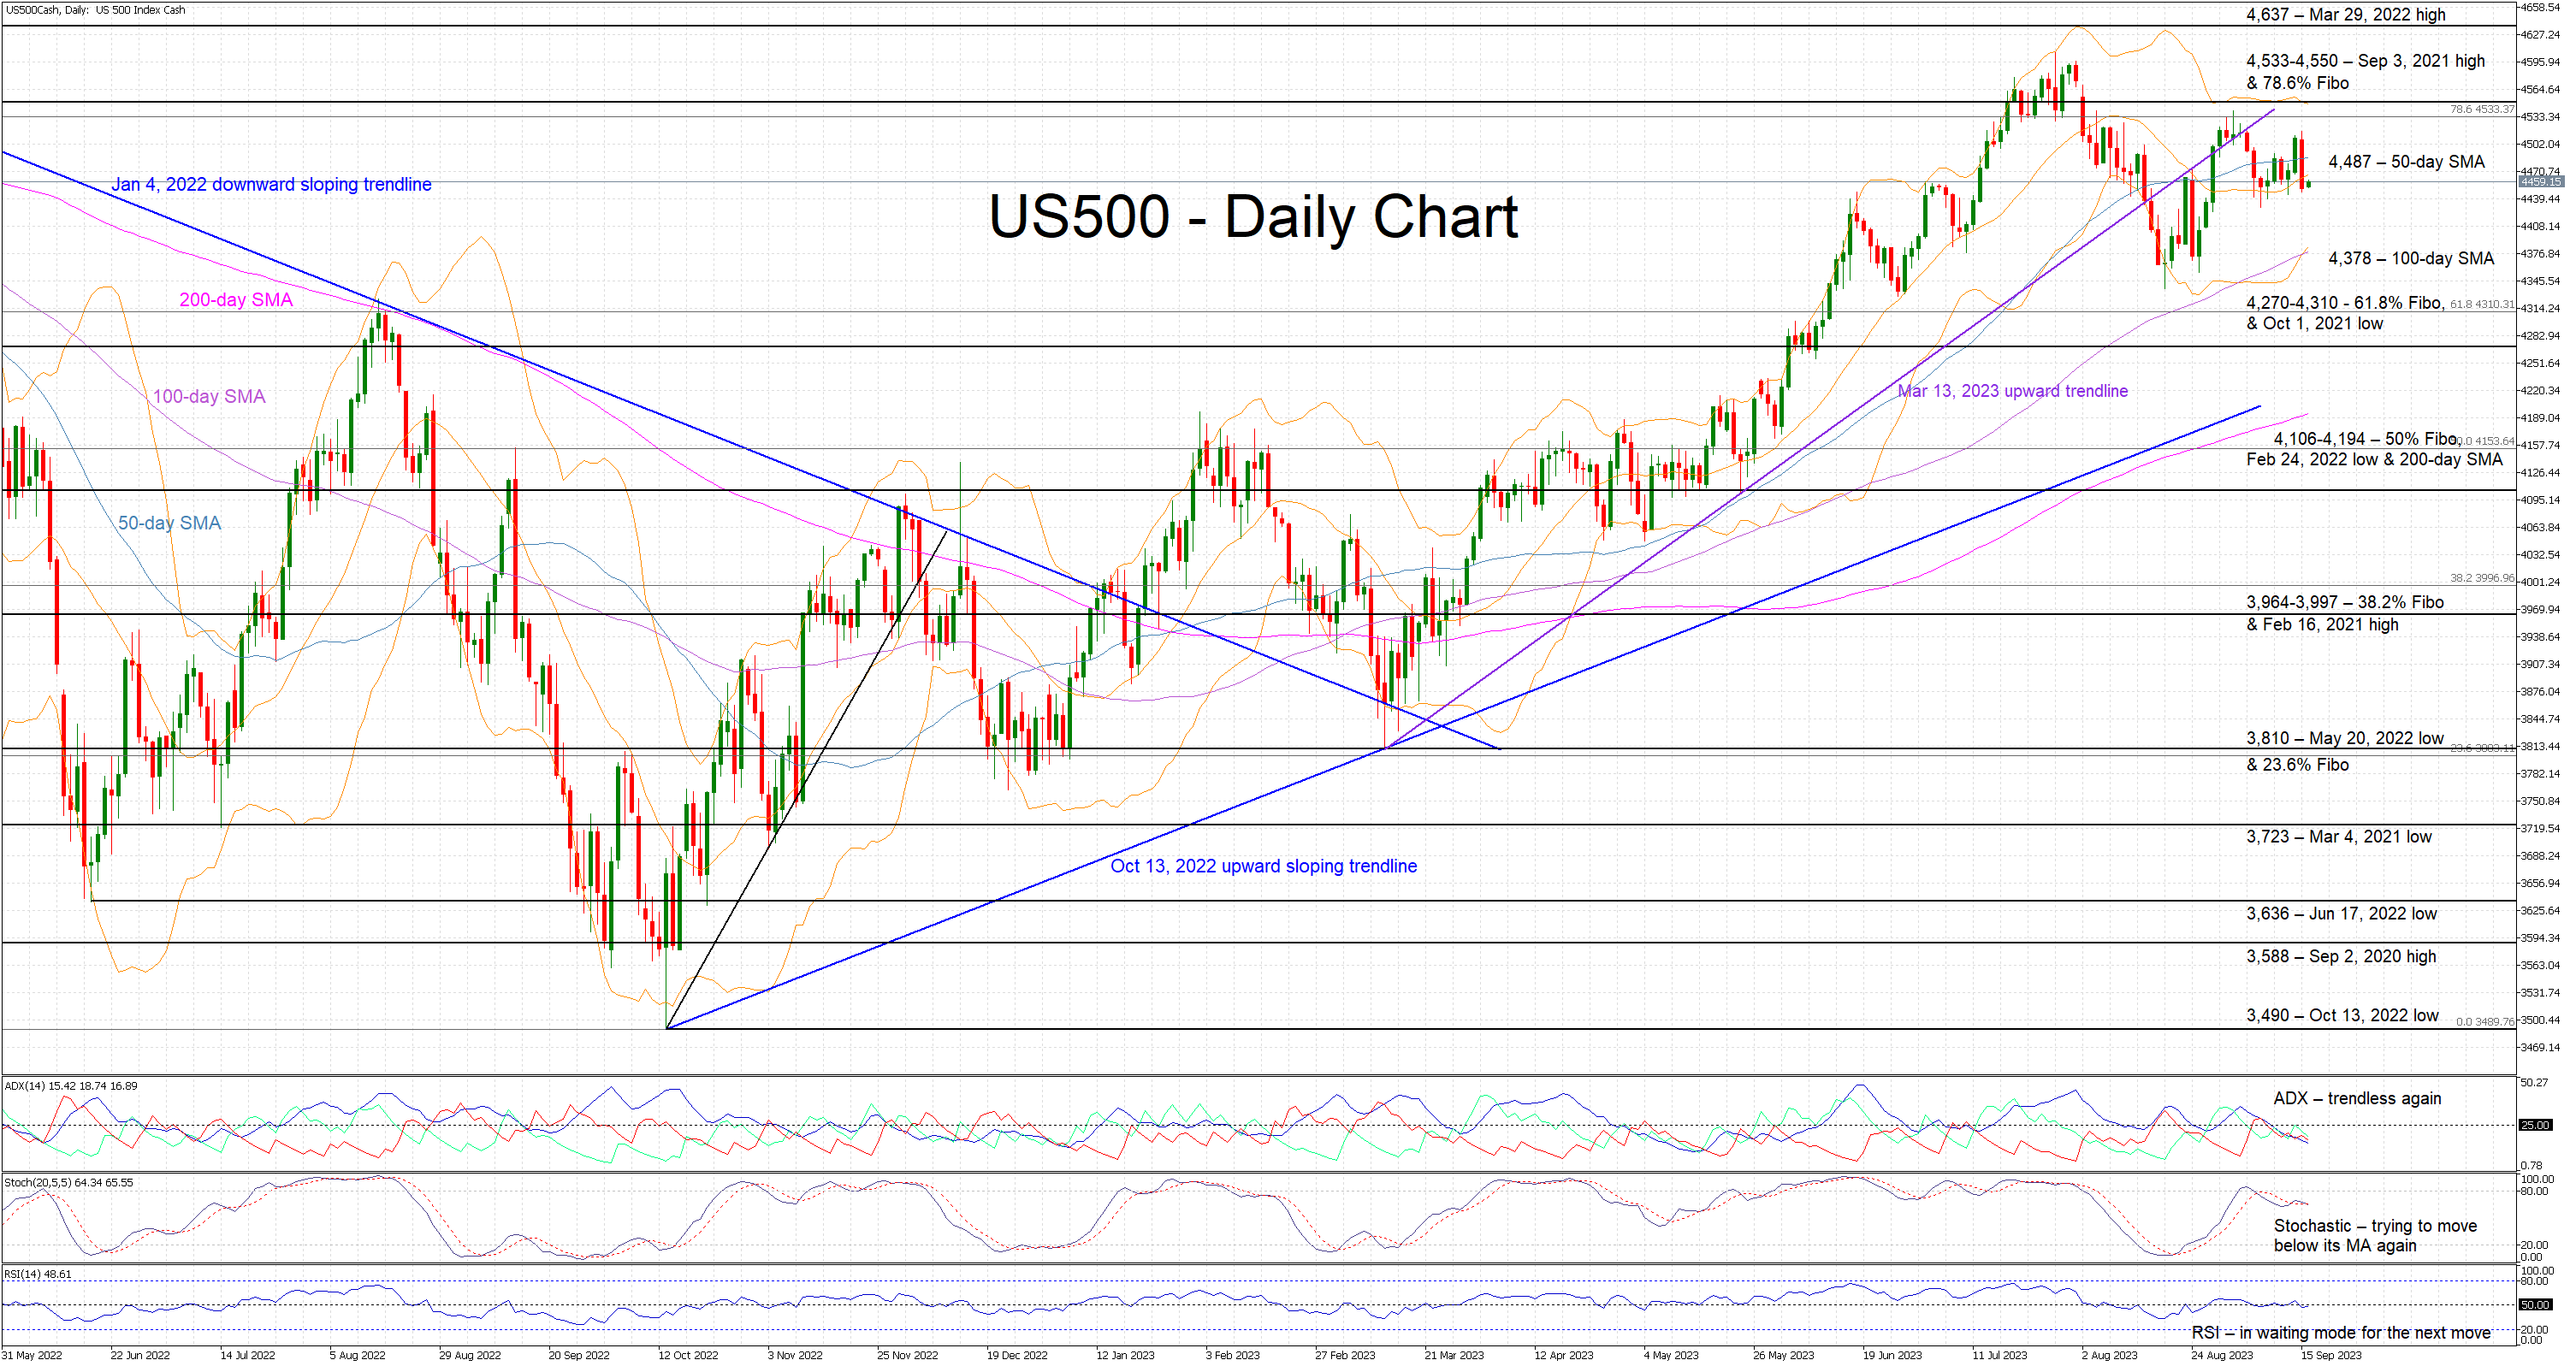
- The US 500 cash index tries to recover from Friday’s decent red candle
- The bears are trying to increase the bearish pressure by aiming for a lower low
- The momentum indicators could open the door to a further bearish correction
The US 500 cash index is in the green today as the market is anxiously waiting this week’s events. The bears are trying to exert their influence and stage another downleg, but most market participants are unlikely to be aggressive in their positioning at this juncture.
In the meantime, the momentum indicators are in waiting mode with the stochastic once again proving the most impatient one. Specifically, the Average Directional Movement Index (ADX) has stabilized below its 25-threshold, thus signaling a trendless market. Similarly, the RSI continues to hover purposelessly around its midpoint. Crucially though, the stochastic oscillator is trying to break below its moving average and infuse some confidence into the bears.
Should the bears decide to recoup another part of their losses, they would aim to push the US 500 index below the 100-day simple moving average at 4,378. If successful, they would then come up against a much tougher area. The 4,270-4,310 range is populated by the 61.8% Fibonacci retracement level of the January 4, 2022 – October 12, 2022 downtrend and the October 1, 2021 low. Even lower, strong support is expected at the 4,106-4,194 region.
On the flip side, the bulls are closely monitoring the price action. They appear determined to push the US 500 index above the 4,487 level and then retest the 4,533-4,550 range, defined by the 78.6% Fibonacci retracement level and the September 3, 2021 high. They would then have the chance of recording a new 2023 high and test their luck at the March 29, 2022 high at 4,637.
To conclude, US 500 cash index bears are trying to take advantage of the quieter market conditions ahead of this week’s events. However, the bulls remain on high alert and ready to react to a protracted bearish move.
WTI Oil: Crude Oil Price Continues to Rise on Tighter Supply and Brightening Demand Outlook
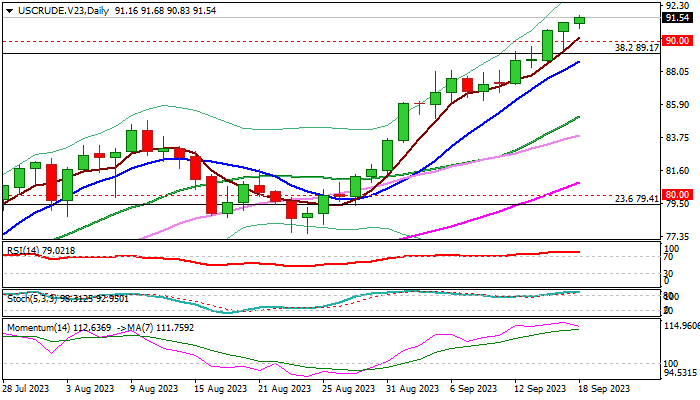
WTI oil price new highest in more than ten months in early Monday, in extension of last week’s 4.4% advance.
Several factors continue to fuel strong bullish sentiment, with decision of Saudi Arabia and Russia to extend their additional production cut in the fourth quarter, being the main contributor to tight supply outlook towards the end of the year.
In addition, signs of faster recovery in demand from China, world’s largest oil importer and still resilient US economy, continue to boost oil prices.
Bullish technical picture on daily and weekly chart add to positive outlook, as the contract registered a weekly close above important Fibo barrier at $89.17 (38.2% of $130.48/$63.63 downtrend) as well as close above psychological $90 level (for the first time since the last week of Oct 2022), marking strong bullish signals.
Bulls eye next targets at $93.28/72 (Oct/Nov peaks) $94.00 (weekly cloud top), ahead of $97.06 (50% retracement), with many already speculating of possible attack at $100 barrier on stronger bullish acceleration.
However, strongly overbought conditions on daily chart warn that bulls may take a breather for consolidation, which should be shallow in current bullish environment.
Broken barriers at $90.00 and $89.17 reverted to solid supports, along with rising 10DMA ($88.65) which should ideally contain dips.
Caution on break here, which would signal deeper correction and expose lower pivot at $85.10.
Res: 92.82; 93.72; 94.00; 95.02.
Sup: 90.00; 89.17; 88.65; 86.14.
GBP/JPY Can Be Eyeing 190 Area
GBPJPY pair has recently moved to a new high, after coming higher out of wave (4) running a triangle pattern at the start of 2023, so it’s ideally trading in final wave (5) od C of B. However, there can be still room for another push higher as the current recovery from 158 is an incomplete impulse.
It’s ideally now slowing down within subwave 4 of (5) before a continuation higher for wave 5 of (5). The first support is at 180, and then the second at 176.50 for a flat.
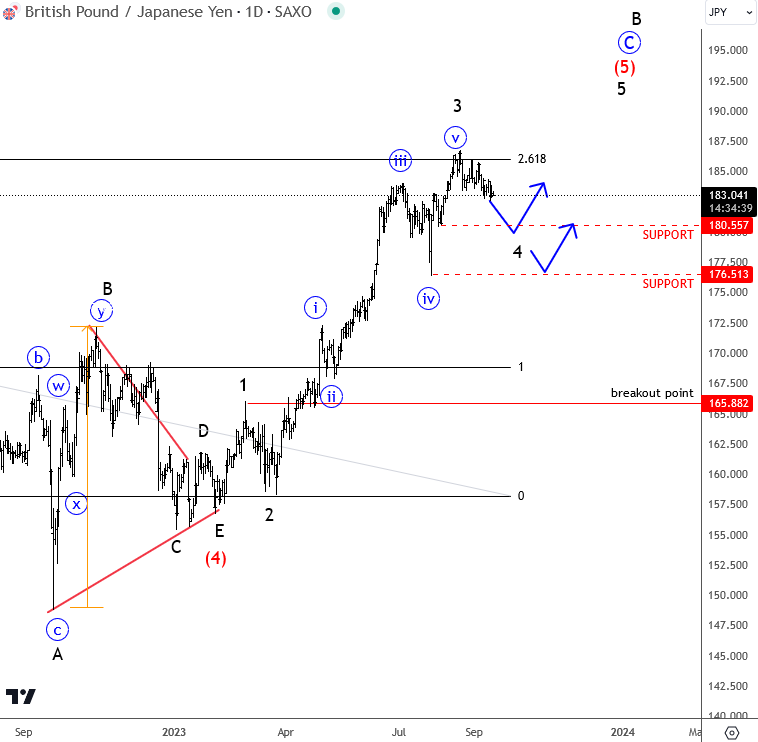
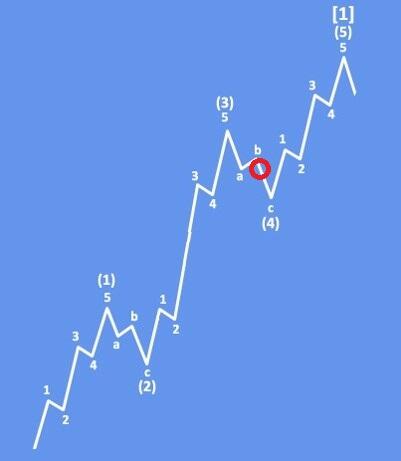
Basic Elliott Wave impulse is strong and impulsive movement, which should be completed by five waves in different degrees.