Sample Category Title
EUR/USD Daily Outlook
Daily Pivots: (S1) 1.0633; (P) 1.0660; (R1) 1.0688; More...
Intraday bias in EUR/USD stays neutral for the moment. Strong rebound from current level, followed by break of 1.0767 resistance, should confirm short term bottoming. Intraday bias will be back on the upside for 1.0944 resistance. However, sustained break of 1.0609/34 support zone will carry larger bearish implication, and target 1.0515 support next.
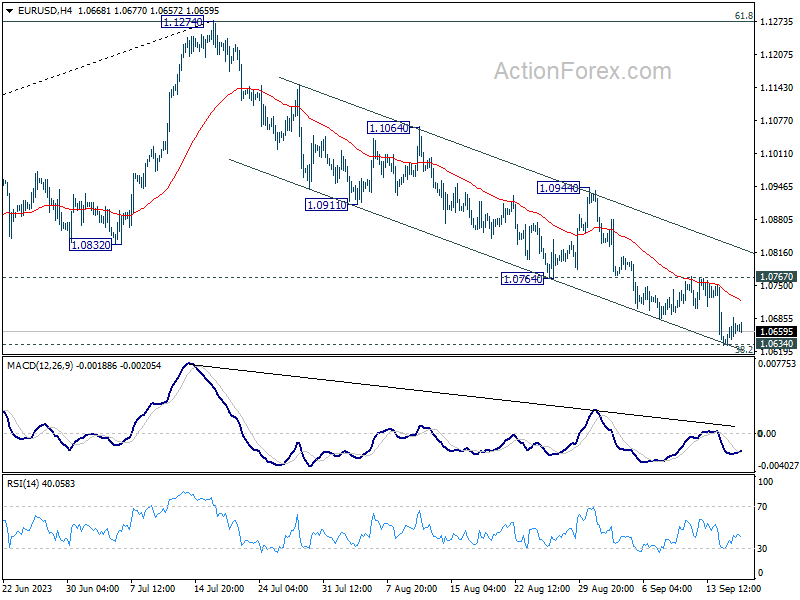
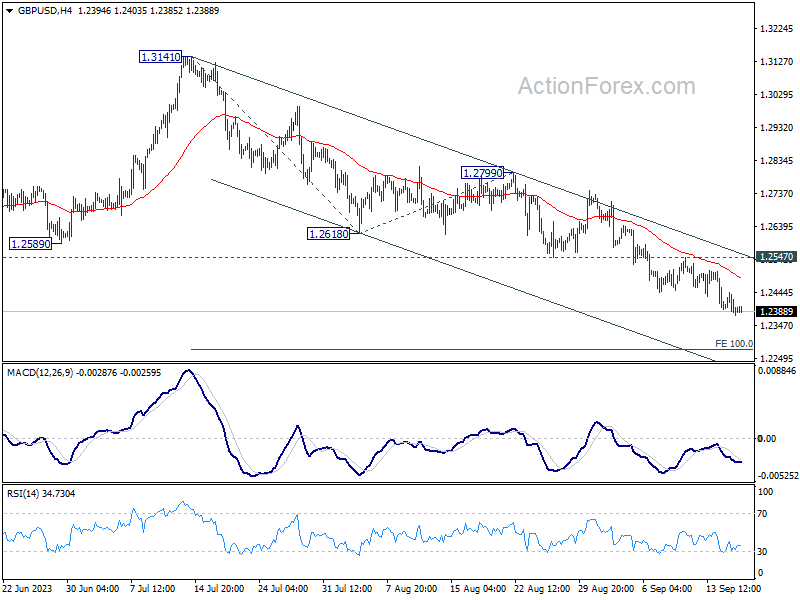
In the bigger picture, fall from 1.1274 medium term top is seen as a correction to up trend from 0.9534 (2022 low). Strong support could be seen from 1.0634 cluster support (38.2% retracement of 0.9534 to 1.1274 at 1.0609) to bring rebound, at least on first attempt. However, sustained break of 1.0609/0634 will raise the chance of bearish trend reversal, and target 61.8% retracement at 1.0199.
GBP/USD Daily Outlook
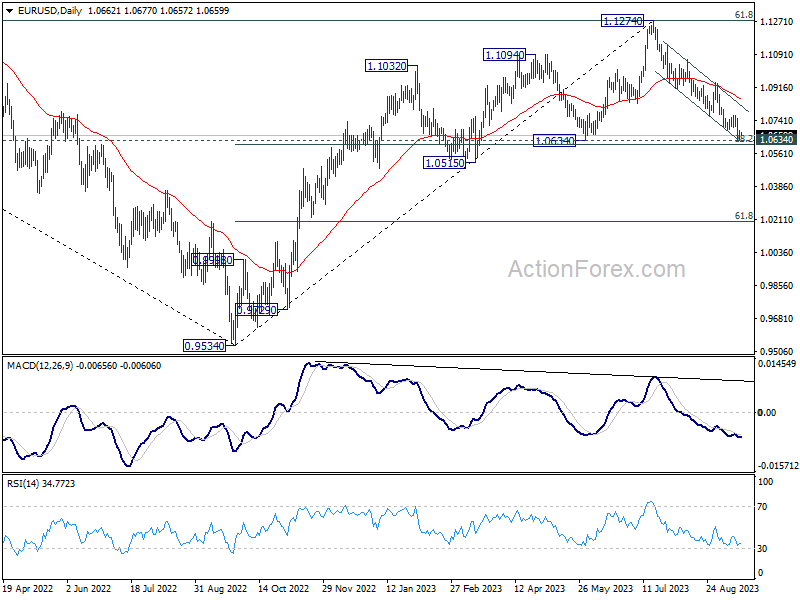
Daily Pivots: (S1) 1.2359; (P) 1.2402; (R1) 1.2426; More...
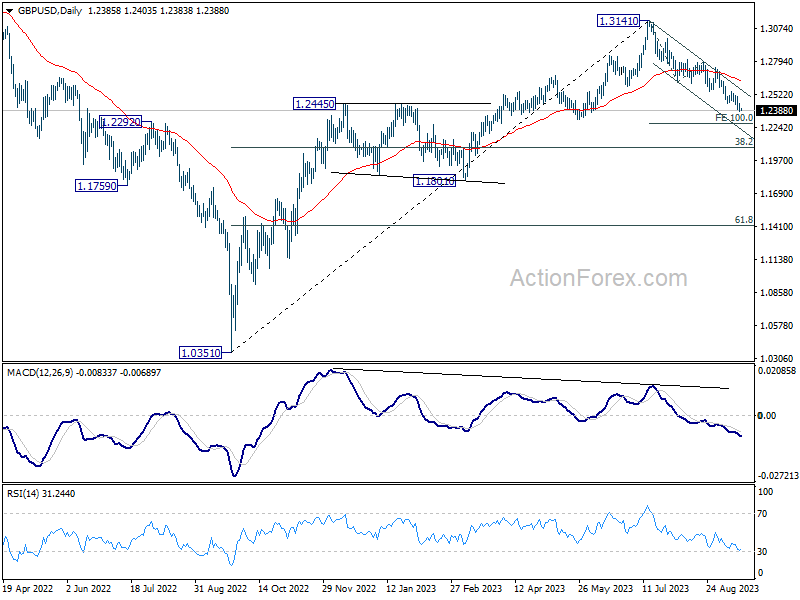
Intraday bias in GBP/USD remains on the downside for the moment. Fall from 1.3141 is in progress and should target 100% projection of 1.3141 to 1.2618 from 1.2799 at 1.2276. On the upside, though, firm break of 1.2547 resistance will now indicate short term bottoming, and bring stronger rebound.
In the bigger picture, fall from 1.3141 medium term top is seen as a correction to up trend from 1.0351 (2022 low). Deeper decline would be seen to 38.2% retracement of 1.0351 to 1.3141 at 1.2075. Strong support would be seen there to bring rebound on first attempt. However, sustained break of 1.2075 will raise the chance of bearish trend reversal.
USD/JPY Daily Outlook
Daily Pivots: (S1) 147.48; (P) 147.71; (R1) 148.09; More...
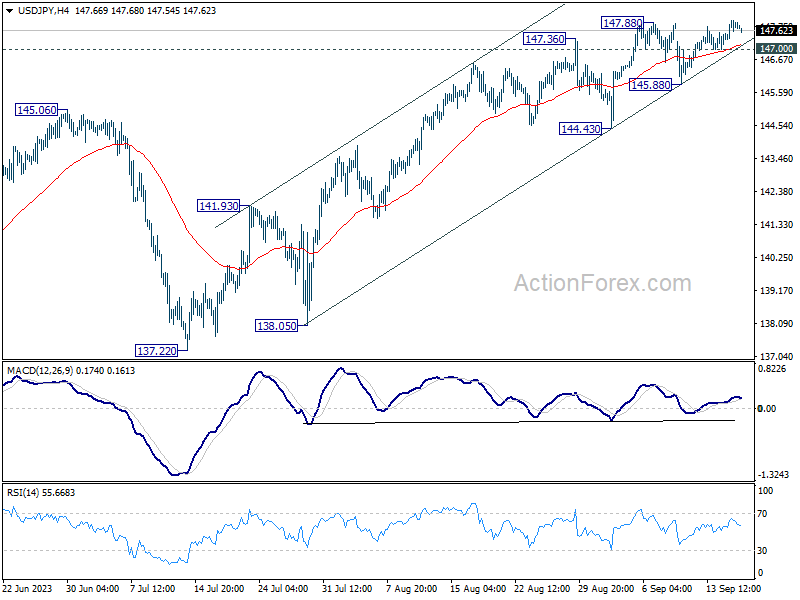
Intraday bias in USD/JPY stays mildly on the upside for the moment. Current rise is part of the whole rally from 127.20, and should target 151.93 high. On the downside, below 147.00 minor support will turn intraday bias neutral again first. But outlook will remain bullish as long as 145.88 support holds.
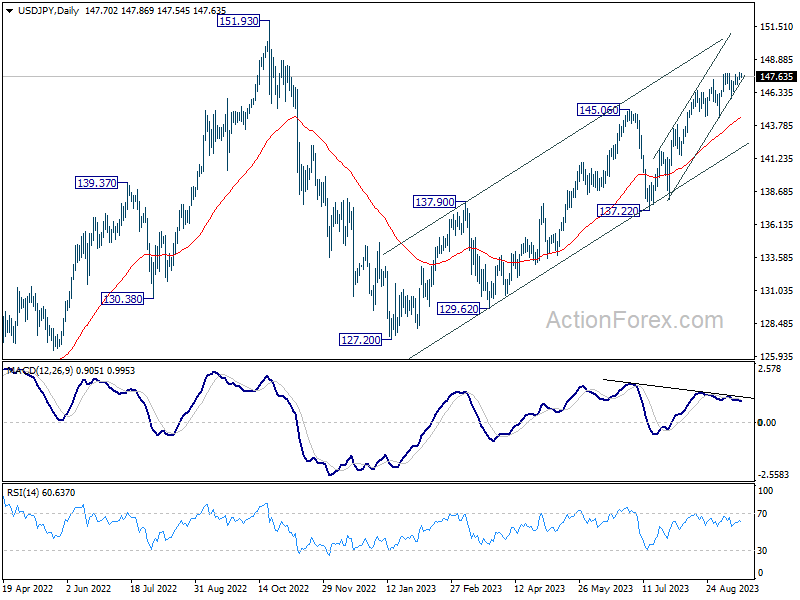
In the bigger picture, while rise from 127.20 is strong, it could still be seen as the second leg of the corrective pattern from 151.93 (2022 high). Rejection by 151.93, followed by break of 137.22 support will indicate that the third leg of the pattern has started. However, sustained break of 151.93 will confirm resumption of long term up trend.
USD/CHF Daily Outlook
Daily Pivots: (S1) 0.8956; (P) 0.8967; (R1) 0.8989; More....
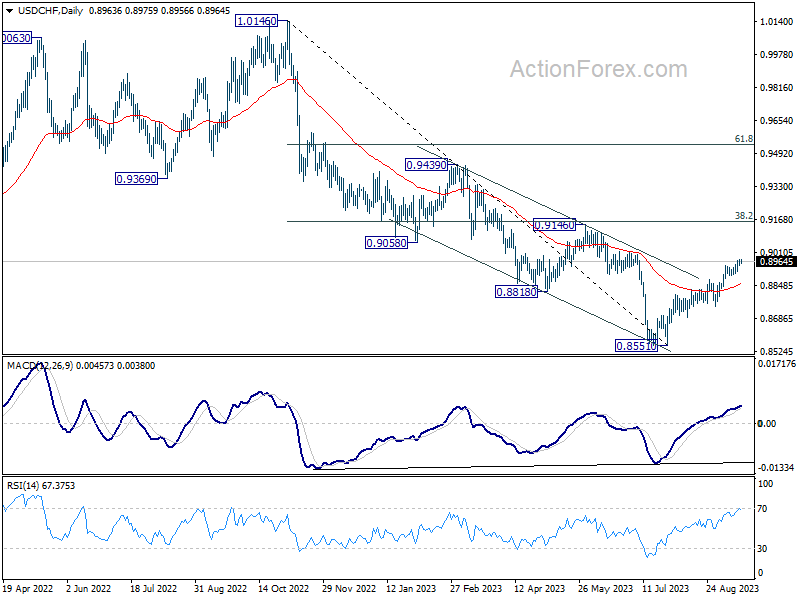
Intraday bias in USD/CHF remains on the upside for the moment. Current rise from 0.8551 is in progress for 0.9146 cluster resistance. On the downside, however, break of 0.8893 support will argue that a short term top is possibly formed, and turn bias back to the downside for 55 D EMA (now at 0.8854).
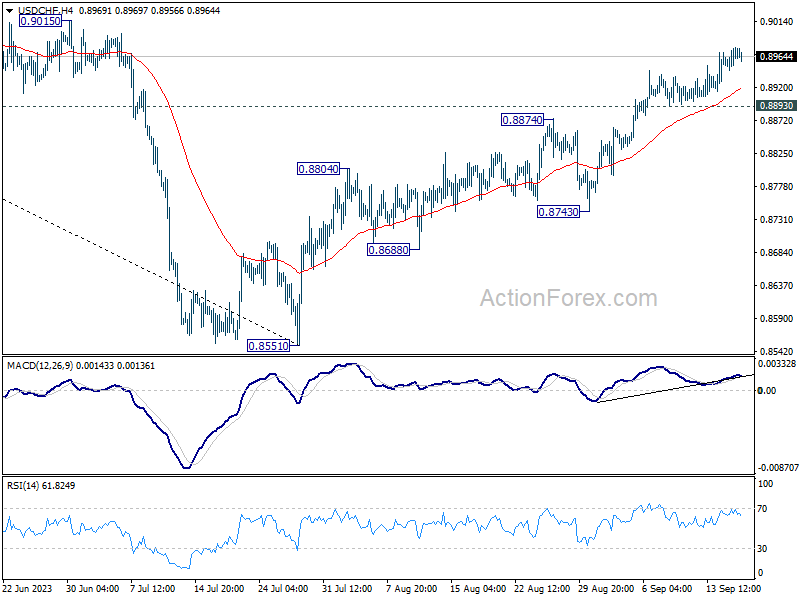
In the bigger picture, rebound from 0.8551 medium term bottom is currently seen as a correction to the downtrend from 1.0146 (2022 high). Further rally would be seen to 0.9146 cluster resistance (38.2% retracement of 1.0146 to 0.8551 at 0.9160). Strong resistance could be seen there to limit upside, at least on first attempt.
USD/CAD Daily Outlook
Daily Pivots: (S1) 1.3497; (P) 1.3524; (R1) 1.3553; More....
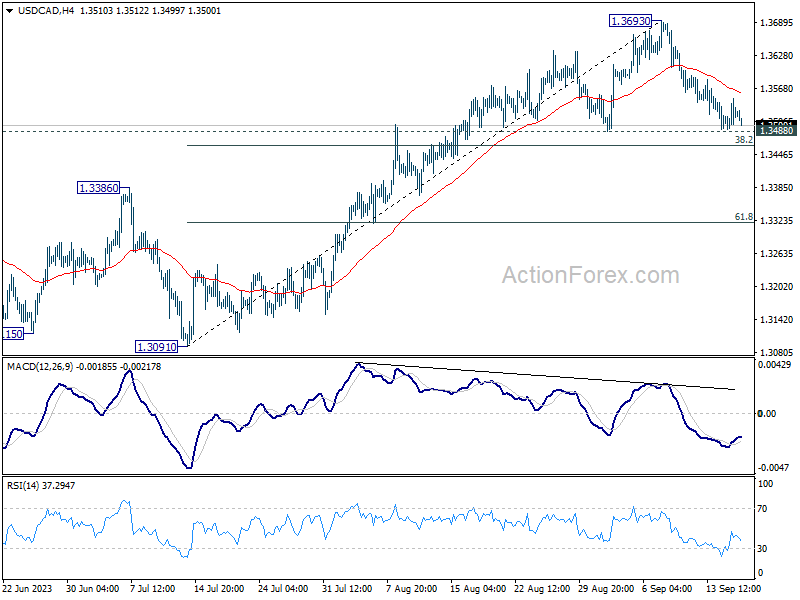
Intraday bias in USD/CAD stays neutral for the moment. Further rally is still expected as long as 1.3488 support holds. On the upside, break of 1.3693 will resume the rise from 1.3091 and target 1.3860 resistance next. However, firm break of 1.3488 will bring deeper fall to 61.8% retracement of 1.3091 to 1.3693 at 1.3321.
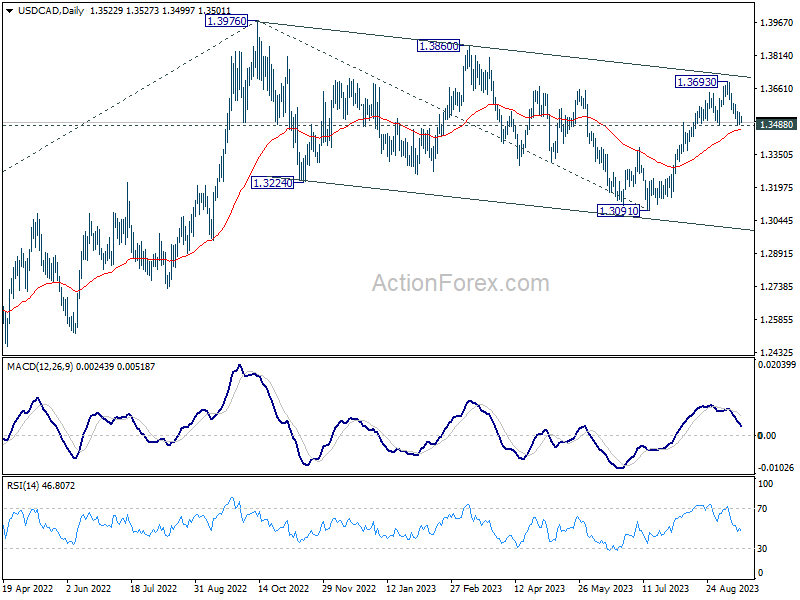
In the bigger picture, price actions from 1.3976 are viewed as a corrective pattern. Strong support from 55 D EMA (now at 1.3465) will solidify the case that it has completed with three waves down to 1.3091 already. Break of 1.3976 will target 61.8% projection of 1.2005 to 1.3976 from 1.3091 at 1.4309. However, sustained break of 55 D EMA will indicate that the pattern is extending with another falling leg before completion.
Canadian Dollar Strengthens Ahead of Inflation News
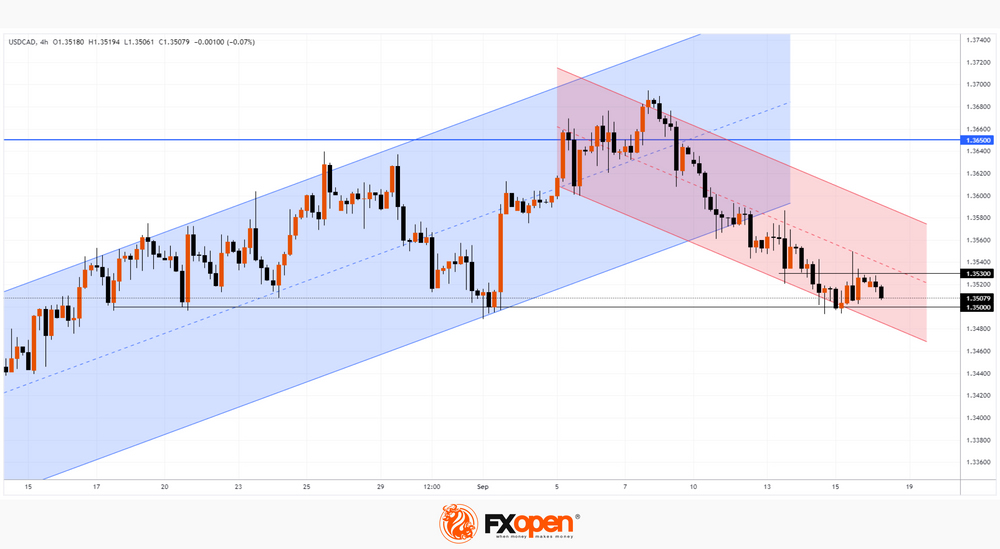
On September 7, we wrote that the level of 1.365 could serve as resistance, from which the price will form a bearish reversal.
As the USD/CAD chart shows, the rate dropped from this resistance to the psychological level of 1.3500, which served as support.
Wherein:
→ The bullish trend (shown by the blue channel) is broken. Facing resistance at 1.365, the bulls failed to reach the upper boundary of the channel, which was a sign of weakening uptrend. One could also observe bearish divergences on a number of indicators.
→ The price at the beginning of the week is in a downward trend, which is shown by the red channel.
→ The price formed a rebound from the psychological level of 1.3500 at the end of last week, but the momentum on the rebound quickly faded. And a return to support at 1.35 means the inability of the bulls to seize the initiative and the unrelenting pressure of the bears.
→ Level 1.353, which served as local support, now resists price growth. The long upper shadow on the September 15 candle confirms bearish pressure.
Thus, support 1.35 is in danger of being broken. And perhaps a successful bear attack will occur tomorrow at 15:30 GMT+3, when news on inflation in Canada will be published. It is expected to remain at 3.7%, however, given the significant increase in energy prices in August, surprises may occur that will affect the current balance of supply and demand in the USD/CAD market.
This article represents the opinion of the Companies operating under the FXOpen brand only. It is not to be construed as an offer, solicitation, or recommendation with respect to products and services provided by the Companies operating under the FXOpen brand, nor is it to be considered financial advice.
EUR/JPY Technical: Bulls May Have Reached a Key Bearish Reversal Zone
- The 9-month rally seen in the EUR/JPY has reached a key major resistance zone of 158.55/159.80.
- Several technical elements have started to hint at signs of bullish exhaustion where the next potential movement may be a multi-day to multi-week bearish mean reversion/counter-trend within a major uptrend phase.
- The short-term resistance and support will be at 158.55 and 155.90 respectively.
Since the start of the year, the EUR/JPY has rallied by 16.30% (2,239 pips) from its 2 January 2023 low of 137.39 to a recent high of 159.77 printed on 30 August 2023 within a major uptrend phase in place since March 2022 low of 124.39.
In the lens of technical analysis, directional price movements do not move in a vertical fashion forever, but instead, they oscillate within a longer-term trend. Also, such oscillations can be relatively more significant than the others because of the emergence of bearish momentum or bullish momentum at key resistance or support levels therefore in turn leading to potential significant mean reversion/counter-trend movements that go against the impulsive movements of the longer-term trend phases for a certain period.
The EUR/JPY is likely to be in transition to a potential multi-day to multi-week bearish mean reversion movement within a longer-term major uptrend phase that is still intact since the March 2022 low of 124.39.
Weekly indecisive price actions with bearish momentum
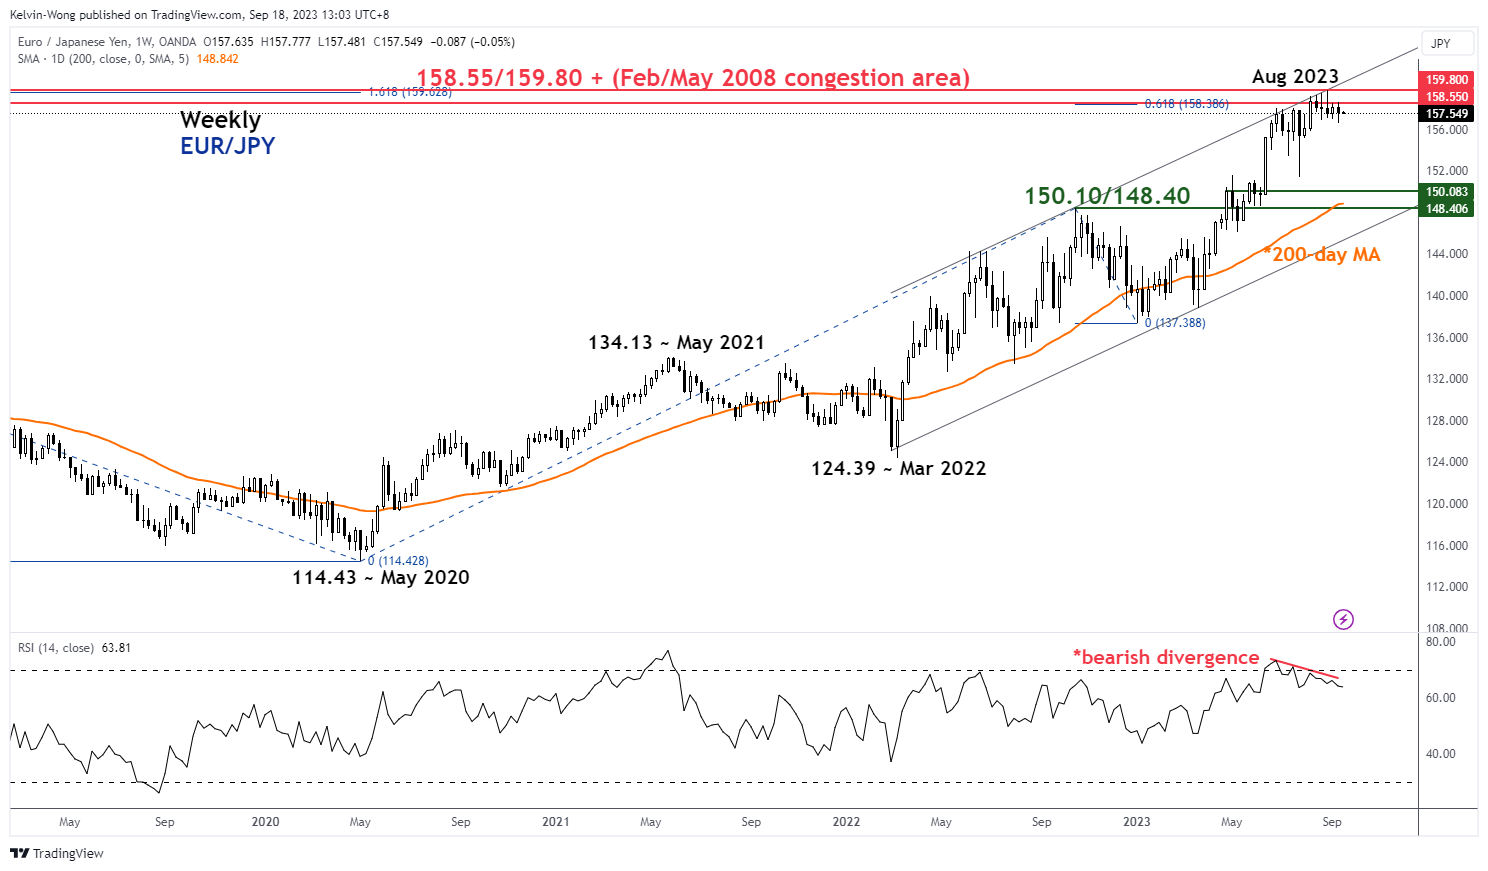
Fig 1: EUR/JPY major trend as of 18 Sep 2023 (Source: TradingView, click to enlarge chart)
As seen in the weekly chart of EUR/JPY, the recent price actions since the middle of August 2023 have formed a series of “Spinning Top” candlestick patterns which has implied some form of hesitancy by the prior bullish tone.
This set of “indecisive” behaviour has taken place right at a key resistance zone of 158.55/159.80 which is defined as the upper boundary of the major ascending channel in place since March 2022, the February/March 2008 congestion area, and a Fibonacci extension cluster.
In addition, the weekly RSI has formed a bearish divergence condition at its overbought zone which indicates a potential emergence of medium-term bearish momentum.
Shorter term price actions have broken below the 20-day moving average
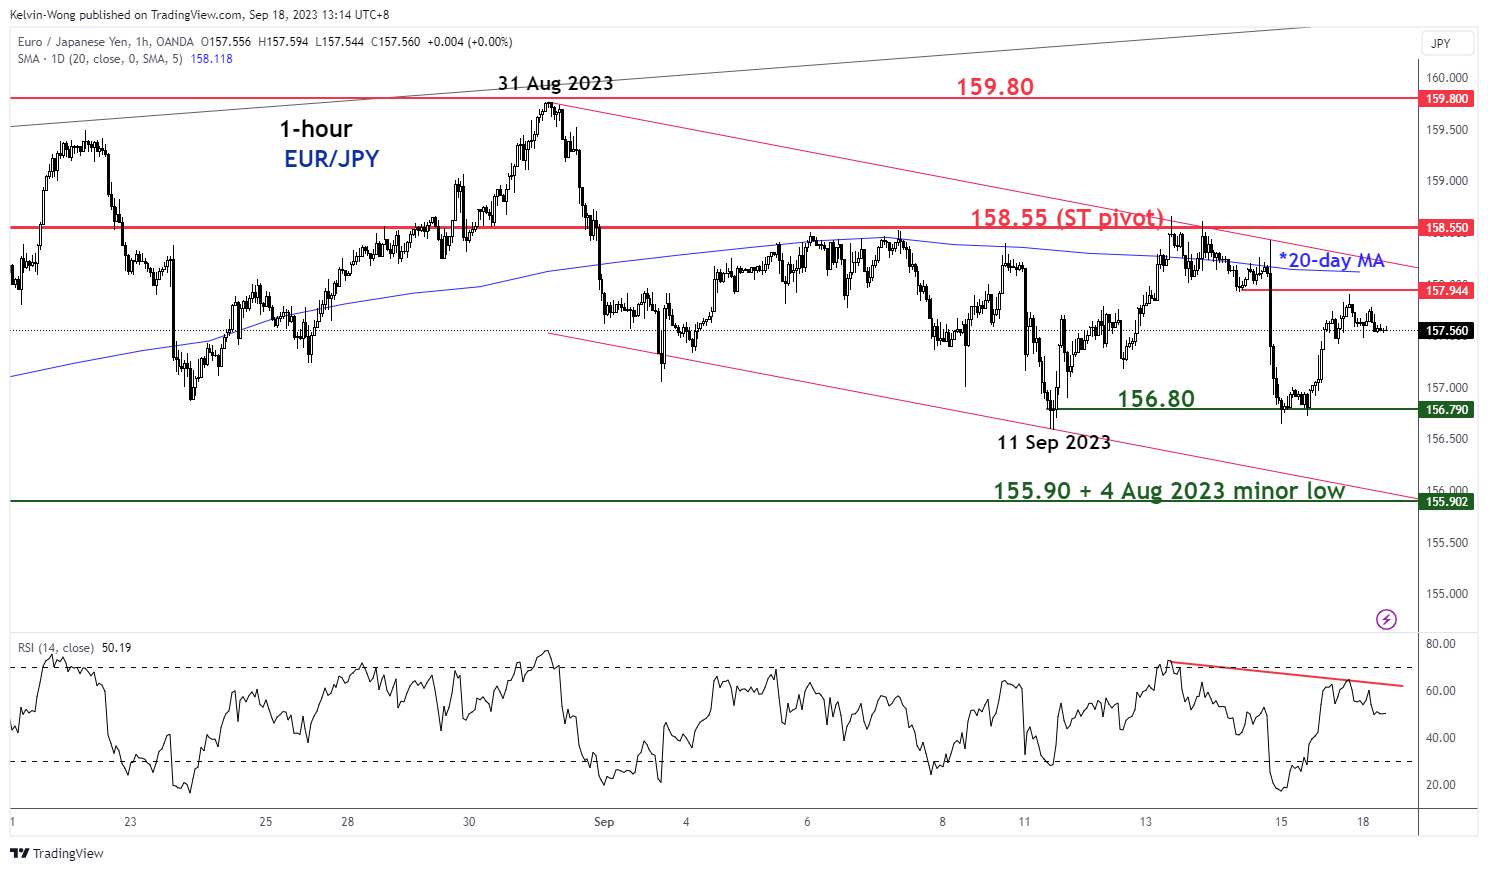
Fig 2: EUR/JPY minor short-term trend as of 18 Sep 2023 (Source: TradingView, click to enlarge chart)
In the shorter term as seen on the 1-hour chart, the EUR/JPY has started to oscillate within a minor descending channel and below the 20-day moving average since last Thursday, 14 September.
These latest set of short-term price movements have indicated that EUR/JPY is likely to be evolving within a minor downtrend. Watch the 158.55 key short-term pivotal support for a further potential slide to retest the 11/15 September minor swing low areas of 156.80 and a break below it exposes the next intermediate support at 155.90 (lower boundary of the minor descending channel, 4 August 2023 minor low, and a Fibonacci extension cluster).
However, a clearance above 158.55 invalidates the bearish tone for a squeeze up to retest the upper limit of the major resistance zone at 159.80.
GBP/USD Extends Losses While EUR/GBP Gains Strength
GBP/USD extended losses and traded below the 1.2465 support. EUR/GBP is rising and might climb above the 0.8615 resistance.
Important Takeaways for GBP/USD and EUR/GBP Analysis Today
- The British Pound is showing bearish signs below 1.2420.
- There is a key bearish trend line forming with resistance near 1.2465 on the hourly chart of GBP/USD at FXOpen.
- EUR/GBP is rising and trading above the 0.8600 zone.
- There was a break above a connecting bearish trend line with resistance near 0.8600 on the hourly chart at FXOpen.
GBP/USD Technical Analysis
On the hourly chart of GBP/USD at FXOpen, the pair attempted a fresh increase above 1.2500. However, the British Pound failed above 1.2540 and started a fresh decline against the US Dollar.
There was a clear move below the 1.2465 support and the 50-hour simple moving average. The pair even tested the 1.2380 support zone. A low was formed near 1.2378 and the pair is now consolidating losses.
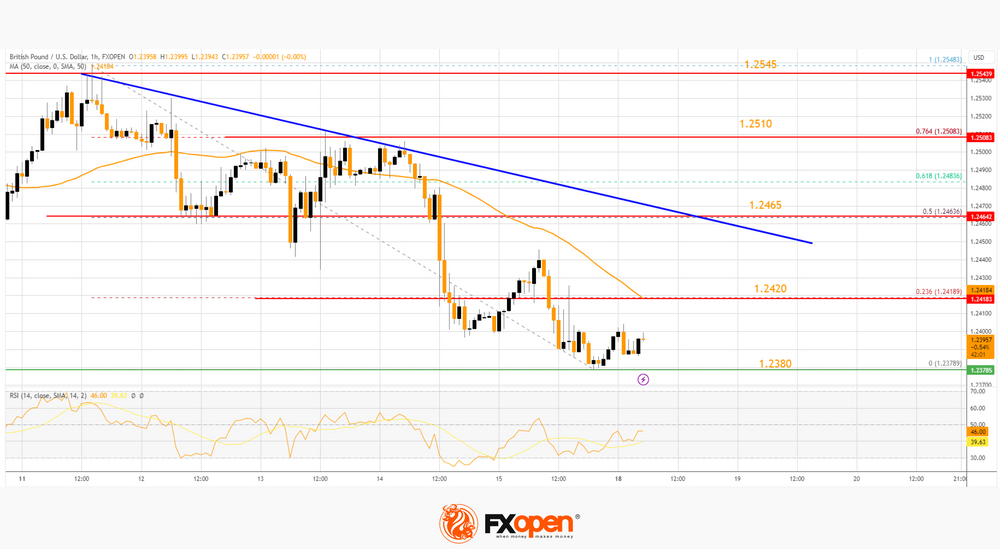
On the upside, the GBP/USD chart indicates that the pair is facing resistance near the 23.6% Fib retracement level of the downward move from the 1.2548 swing high to the 1.2378 low at 1.2420 and the 50-hour simple moving average.
The next major resistance is near a bearish trend line at 1.2465. It is close to the 50% Fib retracement level of the downward move from the 1.2548 swing high to the 1.2378 low.
A close above the 1.2465 resistance zone could open the doors for a move toward 1.2510. Any more gains might send GBP/USD toward 1.2545. On the downside, there is a key support forming near 1.2380. If there is a downside break below the 1.2380 support, the pair could accelerate lower.
The next major support is near the 1.2320 zone, below which the pair could test 1.2250. Any more losses could lead the pair toward the 1.2200 support.
EUR/GBP Technical Analysis
On the hourly chart of EUR/GBP at FXOpen, the pair started a steady increase from the 0.8570 zone. The Euro traded above the 0.8580 pivot level to enter a positive zone against the British Pound.
The EUR/GBP chart suggests that the pair settled above the 50-hour simple moving average and 0.8590. There was also a break above a connecting bearish trend line with resistance near 0.8600. A high is formed near 0.8615 and the pair is now consolidating gains.
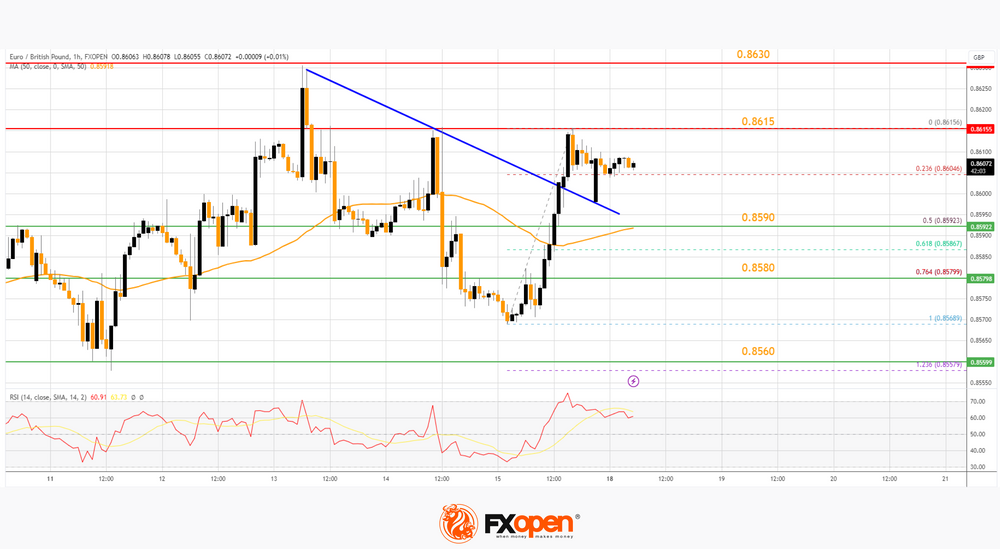
It tested the 23.6% Fib retracement level of the upward move from the 0.8568 swing low to the 0.8615 high. Immediate support sits near the 50-hour simple moving average at 0.8590.
The 50% Fib retracement level of the upward move from the 0.8568 swing low to the 0.8615 high is also near 0.8590. The next major support is near 0.8580. A downside break below the 0.8580 support might call for more downsides. In the stated case, the pair could drop toward the 0.8560 support level.
Immediate resistance is near 0.8615. The next major resistance could be 0.8645. A close above the 0.8645 level might accelerate gains. In the stated case, the bulls may perhaps aim for a test of 0.8680. Any more gains might send the pair toward the 0.8720 level.
This article represents the opinion of the Companies operating under the FXOpen brand only. It is not to be construed as an offer, solicitation, or recommendation with respect to products and services provided by the Companies operating under the FXOpen brand, nor is it to be considered financial advice.
EUR/USD Breaking Below 1.0633 Would Further Hurt the Technical Picture.
Markets
The ECB guided markets to a prolonged pause by saying that rates will be kept at the current level ‘for a sufficiently long duration, which will make a substantial contribution to a timely return of inflation to target’. However, with (core) inflation still substantially above target, the ECB thesis has to be validated. In this respect, several ECB members on Friday (and over the weekend) didn’t exclude an additional hike, with the December meeting (new projections) the next important point of evaluation (ECB’s Vasle). The debate on a faster run-off of the balance sheet also intensifies. All this on Friday resulted in a ‘logical‘ underperformance at the long end of the EMU/German curve with Bund yields adding 4.9 bps (2-y) to 9.0 bps (30-y). The German 30-y yield even touched a minor cycle top at 2.82%. US yields gains were more modest (3-4.5 bps across the curve). US August industrial production (+0.4%) and a sharp rebound in the NY Fed Empire manufacturing survey (1.9 from -19, including strong orders and shipments and ongoing high price index) confirmed the resilience of the US economy. Michigan consumer confidence was slightly disappointing with an unexpected easing of inflation expectations (1-y from 3.5% to 3.1%). US equities fell prey to quite aggressive end of week profit taking (S&P -1.22%; Nasdaq -1.56%), eroding a positive sentiment in Europe (Eurostoxx close +0.36%, after opening 1% higher). At $94/b, Brent oil closed at the highest levels since November last year. The USD showed a mixed picture, but basically kept recent gains (DXY 105.32). USD/JPY continues to attack the recent top just below 148. Higher EMU yields bought the euro some time (EUR/USD close at 1.0657 from 1.0643).
Asian equities join the WS decline this morning, but losses are more contained. China outperforms. The eco calendar today and tomorrow is thin with markets counting down to Wednesday’s Fed policy decision and multiple other CB decisions on Thursday (Bank of England, Norges Bank, Riksbank, Swiss National bank) and on Friday (Bank of Japan). US and EMU PMI’s on Friday give an update on activity. For now, markets aren’t inclined to fight the higher-for-longer mantra, which also the Fed is expect to maintain despite a widely expected pause. Combined with an ongoing rise in oil prices, this might protect EMU and US yields with the long end of the curve nearing cycle peak levels (10-y US 4.34%/4.36%; 10-y Germany 2.74%/2.77% area). The dollar took a breather on Friday, but remains in pole position. EUR/USD breaking below 1.0633 would further hurt the technical picture.
News and Views
The United Auto Workers on Friday started a walkout at the US’s three biggest, Detroit-based, car manufacturers, GM, Ford and Stellantis. It’s the first such triple action in the UAW’s 88-year-old history. They targeted three assembly plants in three different states with UAW’s top official Fain indicating that these guerilla tactics will keep the companies guessing. The union triggered the strike after two months of negotiations failed to yield new labour deals. Apart from wage raises, better pensions and rewinning some of the privileges lost after the 2008 financial crisis, the UAW also wants guarantees that union labour will still have jobs in the electric vehicle (EV) era where the south of the US is becoming center of gravity. Fain believes that his bottleneck approach can have a similar impact as an all-out strike while putting less members on the picket line. The National Association of Manufacturers already said that small and medium-sized manufacturers across the country will feel the brunt of this work stoppage, whether they are union shop or not.
UK property broker Hamptons’ letting index showed the largest annual rental growth (12%) since the start of the index in 2014. The average rent in Britain is now £1300/month. Rents are rising fastest in Greater London (17.1% Y/Y), catching up from a slump during the pandemic, followed by Scotland (13.4% Y/Y). In a separate report, property portal Rightmove indicated that selling prices rose by 0.4% in September; the first increase since May. On an annual basis however, asking prices slid by 0.4%. Price reductions (36.6% of properties for sale) hit a level not seen since January 2011. The shaky UK housing market complicates the picture for the Bank of England who walks an extremely fine line between taming inflation and not letting the economy go bust. The central bank meets on Thursday with money markets discounting a high probability of another 25 bps rate hike (>80%).
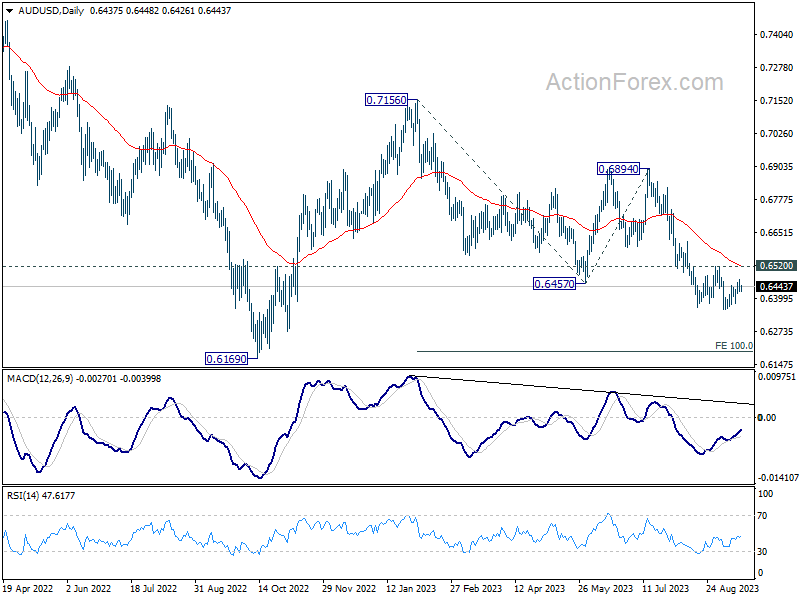
AUD/USD Daily Report
Daily Pivots: (S1) 0.6413; (P) 0.6443; (R1) 0.6462; More...
Outlook in AUD/USD is unchanged as corrective rise from 0.6356 might extend higher. Intraday bias stays neutral for the moment. Further decline is expected as long as 0.6520 resistance holds. Break of 0.6356 will resume larger down trend to 100% projection of 0.7156 to 0.6457 from 0.6894 at 0.6195.
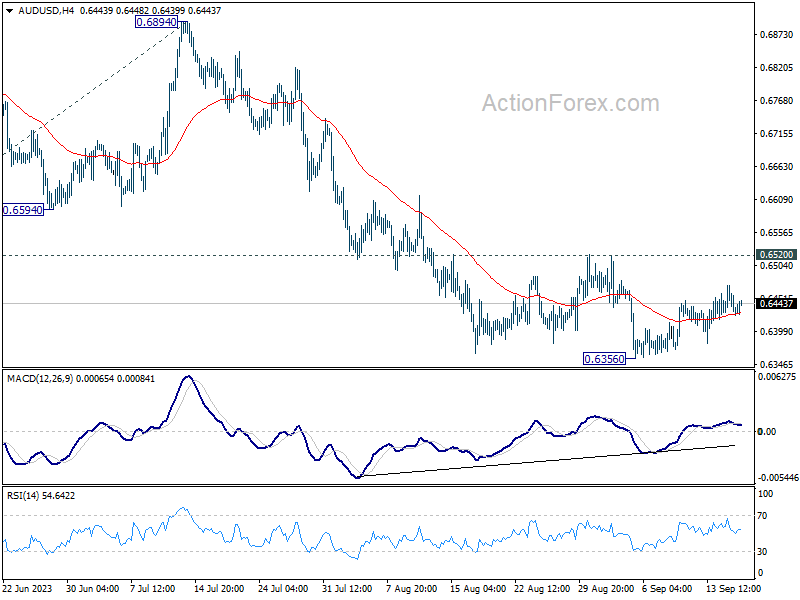
In the bigger picture, down trend from 0.8006 (2021 high) is possibly still in progress. Decisive break of 0.6169 will target 61.8% projection of 0.8006 to 0.6169 to 0.7156 at 0.6021. This will now remain the favored case as long as 0.6894, in case of strong rebound.