Sample Category Title
EURUSD Wave Analysis
- EURUSD reversed from support level 1.0645
- Likely to rise to resistance level 1.0750
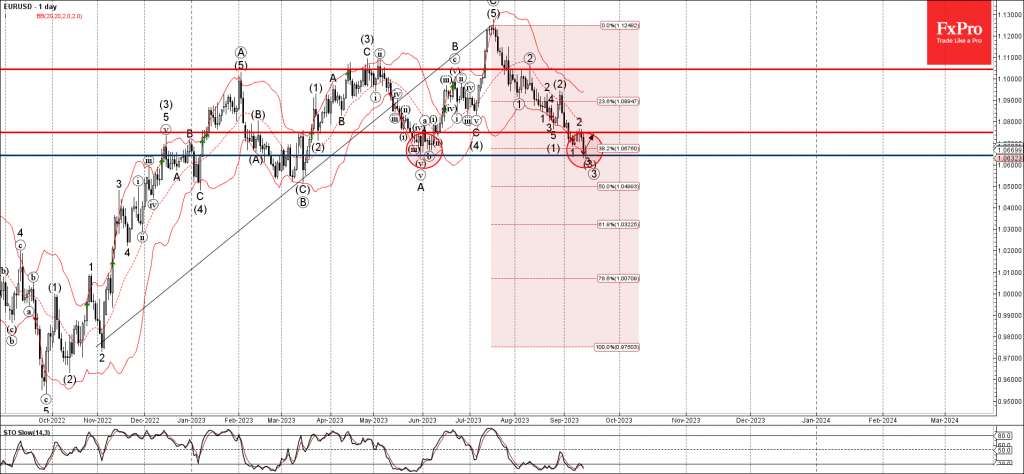
EURUSD currency pair recently reversed up from the support level 1.0645 (former multi-month low from May) intersecting with the lower daily Bollinger Band.
The support level 1.0645 was strengthened by the 38.2% Fibonacci correction of the upward impulse from 2022.
Given the clear daily uptrend and the oversold daily Stochastic, EURUSD currency pair can be expected to rise further toward the next resistance level 1.0750.
Forex and Cryptocurrencies Forecast
EUR/USD: ECB Triggers Euro Collapse
The past week was marked by two significant events. The first was the release of Consumer Price Index (CPI) data in the United States on September 13. The second was the meeting of the European Central Bank's (ECB) Governing Council on September 14.
Regarding the first event, the annual CPI in the United States rose from 3.2% in July to 3.7% in August, surpassing market forecasts of 3.6%. On a monthly basis, the CPI increased from 0.2% to 0.6%, precisely in line with market expectations. Financial markets reacted relatively tepidly to this data. According to CME Group, there is a 78.5% likelihood that the Federal Open Market Committee (FOMC) will maintain the key interest rate at its current level of 5.50% per annum during its meeting on September 20. However, the CPI statistics provide the regulator some room for manoeuvre in terms of tightening monetary policy in the future. If inflation in the United States continues to rise, there is a high probability that the Federal Reserve will increase the refinancing rate by another 25 basis points (bps). This is especially likely given that the U.S. economy is demonstrating stable growth and the national labor market remains robust. The published number of initial unemployment claims was 220K, which was lower than the forecasted 225K.
The second event triggered a considerably more volatile response. On Thursday, September 14, the ECB raised its key interest rate for the euro by 25 basis points (bps) for the tenth consecutive time, moving it from 4.25% to 4.50%. This is the highest it has reached since 2001. Experts had varying opinions on the move, labelling it as either hawkish or dovish. However, in theory, an interest rate increase should have supported the common European currency. Contrarily, EUR/USD fell below the 1.0700 mark, recording a local low at 1.0631. The last time it reached such depths was in the spring of 2023.
The decline in the euro was attributed to dovish comments made by the ECB's leadership. One could deduce from these that the central bank had already brought rates to levels that, if sustained over an extended period, should bring inflation within the Eurozone down to the target 2.0%. ECB President Christine Lagarde's statement, "I'm not saying we are at the peak of rates," failed to impress investors. They concluded that the current hike to 4.50% is likely the last step in this tightening cycle of monetary policy. As a result, with the backdrop that the Federal Reserve may still raise its rate to 5.75%, bears in EUR/USD have gained a noticeable advantage.
Bearish momentum increased even further following Thursday's release of data indicating that U.S. retail sales for August increased by 0.6% month-over-month (MoM), significantly exceeding the 0.2% forecast. At the same time, the Producer Price Index (PPI) for August rose by 0.7%, also surpassing expectations and the previous reading of 0.4%.
"We anticipate that the relative strength of the U.S. economy will continue to put pressure on EUR/USD in the coming months, as the growth differential will play a leading role. We maintain our forecast for the cross to be at the 1.0600-1.0300 range over the next 6-12 months," comment strategists at Danske Bank, one of Northern Europe's leading banks. They continue: "Given that it's hard to envision a sharp shift in the current U.S. dollar dynamics, and with commodity prices currently rising, we may reach our 6-month forecast for the cross earlier than expected."
HSBC strategists predict an even faster decline for the pair, anticipating that it will reach the 1.0200 level by the end of this year. According to specialists at ING, the pair could drop to the 1.0600-1.0650 area around the time of the Federal Reserve meeting in the upcoming week. "We believe that, at this stage, the EUR/USD rate will be increasingly influenced by the dollar," they write. "Markets have recognized that the ECB has most likely reached its peak interest rate, which means that Eurozone data should become less relevant. We might see EUR/USD rise again today [September 15], but a return to the 1.0600/1.0650 area around the date of the Federal Reserve meeting seems highly likely.".
As of the time of writing this review, on the evening of Friday, September 15, the pair indeed rose and ended the five-day trading period at the 1.0660 mark. 55% of experts are in favour of a continued upward correction, while 45% agree with ING economists' opinion and voted for a decline in the pair. As for technical analysis, almost nothing has changed over the past week. Among the trend indicators and oscillators on the D1 timeframe, 100% are still favouring the U.S. currency and are coloured in red. However, 25% of the latest indicators signal that the pair is oversold. Immediate support for the pair is located in the 1.0620-1.0630 area, followed by 1.0515-1.0525, 1.0480, 1.0370, and 1.0255. Bulls will encounter resistance in the 1.0680-1.0700 zone, then at 1.0745-1.0770, 1.0800, 1.0865, 1.0895-1.0925, 1.0985, and 1.1045.
The upcoming week will be quite eventful. On Tuesday, September 19, consumer inflation data (CPI) for the Eurozone will be released. Undoubtedly, the most significant day of the week, and perhaps even the upcoming months, will be Wednesday, September 20, when the FOMC meeting of the Federal Reserve will take place. In addition to the interest rate decision, investors expect to glean valuable information from the FOMC's long-term forecasts as well as during the press conference led by the Federal Reserve's management. On Thursday, September 21, the traditional initial jobless claims data will be published in the United States, along with the Federal Reserve Bank of Philadelphia's Manufacturing Activity Index. Friday promises a deluge of business activity statistics, with the release of PMI data for Germany, the Eurozone, and the United States.
GBP/USD: Awaiting the Bank of England Meeting
According to recent statistics, the UK economy is going through a challenging period. Some of the more emotional analysts even describe its condition as dire. GBP/USD continued to decline against the backdrop of disappointing GDP data for the country. According to the latest figures released by the Office for National Statistics (ONS) on Wednesday, September 13, the British economy contracted by -0.5% on a monthly basis, compared to an expected decline of -0.2%.
The day before, on Tuesday, the ONS published equally disheartening data concerning the labor market. The unemployment rate for the three months through July rose to 4.3%, compared to the previous figure of 4.2%. Employment decreased by 207,000 jobs, while the economy lost 66,000 jobs a month earlier. The market consensus forecast had been for a reduction of 185,000 jobs.
The Bank of England's (BoE) efforts to combat inflation appear to be rather modest. Although the annual rate of price growth in the UK has decreased from 7.9% to 6.8% (the lowest since February 2022), inflation remains the highest among the G7 countries. Moreover, the core Consumer Price Index (CPI) remained unchanged from the previous month at 6.9% year-on-year, only 0.2% below the peak set two months earlier.
Sarah Briden, the Deputy Governor of the BoE, believes that the "risks to inflation [...] are currently to the upside," and that it will only reach the target level of 2% two years from now. Meanwhile, according to quarterly survey data, only 21% of the country's population is satisfied with what the Bank of England is doing to control price growth. This marks a new record low.
Analysts at Canada's Scotiabank believe that the decline of GBP/USD could continue to 1.2100 in the coming weeks, and further to 1.2000. Economists at the French bank Societe Generale hold a similar view. According to them, while a fall to 1.1500 seems unlikely, the pair could very well reach 1.2000.
GBP/USD concluded the past week at a mark of 1.2382. The median forecast suggests that 50% of analysts expect the pair to correct upwards, 35% anticipate further movement downwards, and the remaining 15% point eastward. On the D1 chart, 100% of trend indicators and oscillators are coloured red, with 15% indicating that the pair is in oversold territory. If the pair continues to move south, it will encounter support levels and zones at 1.2300-1.2330, 1.2270, 1.2190-1.2210, 1.2085, 1.1960, and 1.1800. In the event of an upward correction, the pair will face resistance at 1.2440-1.2450, 1.2510, 1.2550-1.2575, 1.2600-1.2615, 1.2690-1.2710, 1.2760, and 1.2800-1.2815.
Among the key events related to the UK economy, the publication of the Consumer Price Index (CPI) on Wednesday, September 20, stands out. This inflation indicator will undoubtedly impact the Bank of England's decision on interest rates (forecasted to rise by 25 bps, from 5.25% to 5.50%). The BoE meeting will take place on Thursday, September 21. Additionally, toward the end of the workweek, data on retail sales and the UK's Purchasing Managers' Index (PMI) will be released.
USD/JPY: No Surprises Expected from the Bank of Japan Yet
Since the beginning of this year, the yen has been gradually losing ground to the U.S. dollar, with USD/JPY returning to November 2022 levels. It's worth noting that it was a year ago at these heights that the Bank of Japan (BoJ) initiated active currency interventions. This year, however, the BoJ has so far engaged only in verbal interventions, although quite actively: high-ranking Japanese officials are frequently making public comments.
In a recent interview with Yomiuri newspaper, BoJ Governor Kazuo Ueda stated that the central bank might abandon its negative interest rate policy if it concludes that sustainable inflation targets of 2% have been achieved. According to Ueda, by year-end, the regulator will have sufficient data to assess whether conditions are ripe for a policy shift.
This verbal intervention had an impact: markets responded with a strengthening of the yen. However, the "magic" was short-lived, and USD/JPY soon resumed its upward trajectory, closing the five-day trading period at 147.84.
Economists at Danske Bank believe that the global environment favours the Japanese yen and forecast a decline in USD/JPY to 130.00 over a 6-12 month horizon. "We believe that yields in the U.S. are peaking or close to it, which is the primary argument for our bearish stance on USD/JPY," they state. "Additionally, under current global economic conditions, where growth and inflation rates are declining, history suggests that these are favourable conditions for the Japanese yen." Danske Bank also anticipates that a recession could begin in the United States within the next two quarters, prompting the Federal Reserve to cut dollar interest rates. Until the Federal Reserve concludes its easing cycle, the Bank of Japan is expected to maintain its monetary policy unchanged. Therefore, any action from the BoJ before the second half of 2024 is unlikely.
As for short-term forecasts, Societe Generale does not rule out the possibility that following the FOMC decision by the Federal Reserve on September 20, USD/JPY could move closer to the 150.00 mark. As for the Bank of Japan's meeting on Friday, September 22, no surprises are expected, and it will likely involve another round of verbal intervention. Meanwhile, the vast majority of surveyed experts (80%) believe that if the Federal Reserve rate remains unchanged, USD/JPY has a high likelihood of correcting downward. Only 10% expect the pair to continue its upward trajectory, while another 10% take a neutral stance. All trend indicators and oscillators on the D1 time frame are coloured green, although 10% of these are signalling overbought conditions.
The nearest support levels are located in the 146.85-147.00 zone, followed by 145.90-146.10, 145.30, 144.50, 143.75-144.05, 142.90-143.05, 142.20, 141.40-141.75, 140.60-140.75, 138.95-139.05, and 137.25-137.50. The nearest resistance is at 147.95-148.00, followed by 148.45, 148.85-149.10, 150.00, and finally, the October 2022 high of 151.90.
We have already mentioned the Bank of Japan's meeting on September 22. No significant economic data concerning the state of the Japanese economy is scheduled for release in the coming week. Traders should be aware, however, that Monday, September 18, is a public holiday in Japan as the country observes Respect for the Aged Day.
CRYPTOCURRENCIES: Death Cross and Bitcoin Paradoxes
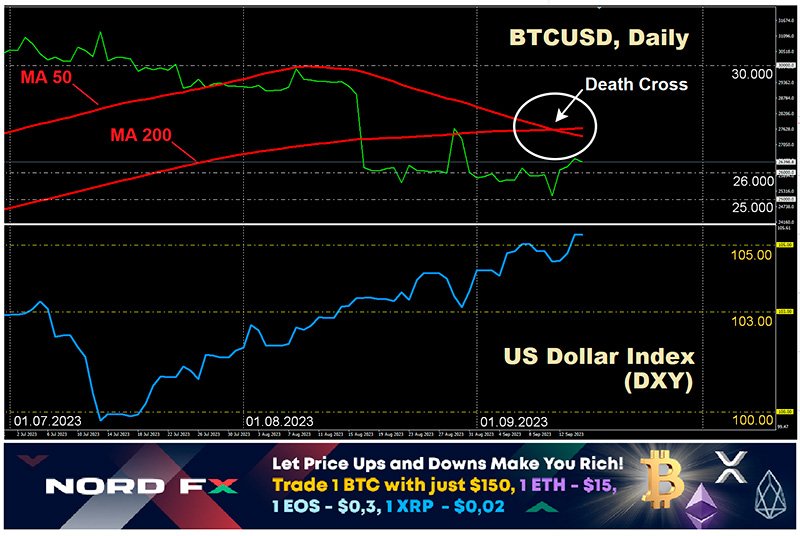
A "Death Cross," indicated by the intersection of the 50-day and 200-day moving averages, has appeared on bitcoin's daily chart. This pattern last emerged in mid-January 2022, and was followed by a nearly threefold decrease in bitcoin's price by November, which is cause for concern. Interestingly, a similar Death Cross was observed in July 2021, but did not result in a price decline, offering some reassurance.
The current week in the cryptocurrency market has been marked by high volatility, with trading volumes for the leading cryptocurrency reaching $15 billion. Such levels of activity are typically only seen around major macroeconomic events. In this case, they include the release of U.S. inflation data on Wednesday, September 13, and the upcoming Federal Reserve meeting on September 20.
The BTC/USD weekly chart showed the following trends. On Monday, September 11, the price of bitcoin fell below $25,000, despite a weakening dollar and rising stock indices. This decline was fueled by rumors that the controversial FTX exchange was planning to sell digital assets as part of a bankruptcy proceeding. On Tuesday, investors resumed buying at lower levels, pushing the coin's price above $26,500. On Thursday, following the ECB's decision on interest rates, bitcoin continued to strengthen its position, reaching a high of $26,838. This occurred even as the dollar was strengthening.
In fact, the recent price dynamics are quite paradoxical. Imagine BTC/USD as a set of scales. When one side becomes heavier, it goes down while the other goes up. Yet, we witnessed both sides simultaneously descending and ascending. According to some analysts, there was no fundamental rationale behind these bitcoin movements. With low liquidity and falling market capitalization, the asset was merely being "shifted" from one group of speculators to another.
Even the testimony of Gary Gensler, the Chairman of the U.S. Securities and Exchange Commission (SEC), before the U.S. Senate did not spook market participants. He stated that the overwhelming majority of cryptocurrencies fall under the jurisdiction of his agency. Consequently, all intermediaries in the market, exchanges, brokers, dealers, and clearing agencies, are required to register with the SEC.
Gensler compared the current state of the crypto industry to the "wild west" years of the early 20th century, when securities market legislation was still being developed. During those years, the agency took a series of strict enforcement actions to rein in the industry, and many cases ended up in court. Similar measures are needed today, not only to serve as a deterrent to businesses but also to protect investors, the SEC Chairman stated. (It's worth noting that, according to Ripple CEO Brad Garlinghouse, the SEC is to blame for the U.S. becoming one of the "worst places" to launch cryptocurrency projects.)
But aside from the SEC, there are other regulators, such as the Federal Reserve. It's clear that the Fed's decisions and forecasts, which will be announced on September 20, will impact the dynamics of risky assets, including cryptocurrencies. Mike McGlone, Senior Macro Strategist at Bloomberg Intelligence, has already warned investors that the near future for the crypto sector looks challenging. According to him, digital assets gained popularity during a period of near-zero interest rates. However, as monetary policy shifts, challenges could arise for the industry. McGlone pointed out that the yield on U.S. Treasury bonds is expected to reach 5.45% by November, based on futures contracts. In contrast, from 2011 to 2021, this yield was only about 0.6% annually, a period during which bitcoin and other digital assets saw significant growth. Therefore, a liquidity outflow from cryptocurrencies would not be surprising.
Once again, many analysts are offering positive medium- and long-term forecasts but negative short-term outlooks. Michael Van De Poppe, founder of venture firm Eight, predicts a final price correction for the leading cryptocurrency before an impending bull rally. According to him, if bears manage to breach the exponential moving average line, currently at $24,689, the coin could drop to as low as $23,000 in a worst-case scenario. Van De Poppe believes this upcoming correction represents the last chance to buy bitcoin at a low price.
Dan Gambardello, founder of Crypto Capital Venture, predicts that the next bull cycle could be the most impressive in the cryptocurrency market. However, he also reminds investors that the crypto market follows cycles and appears to be in an accumulation phase. Given this, Gambardello warns that there's a possibility that bitcoin's price could drop to $21,000 in the coming weeks. He attributes this potential decline to market manipulation by major players who may be driving down prices to accumulate coins in anticipation of the next bull run.
According to a popular expert known as CrypNuevo, the flagship cryptocurrency could soon reach a $27,000 mark. However, the analyst emphasized that this is likely to be a false move, and a dip down to around $24,000 should be expected thereafter. (It's worth noting that on August 17, the BTC price broke through the ascending trend line that started in December 2022 and settled below it, indicating a high risk of a prolonged bearish trend.)
As for the short-term prospects of the leading altcoin, they also appear to be less than optimistic. Analysts at Matrixport have warned that if ETH drops to $1,500, the path to $1,000 would be open: a level the experts consider justifiable based on their revenue projections for the Ethereum blockchain ecosystem. Matrixport notes that ETH is not a "super sound money" capable of resisting inflation, as the number of coins minted last week exceeded the amount burned by 4,000. This represents a deviation from the deflationary model that the blockchain adopted with the consensus algorithm transition from Proof of Work (PoW) to Proof of Stake (PoS).
Analyst Benjamin Cowen sets an even lower target. He claims that Ethereum is on the brink of "extreme volatility," potentially plummeting to a range between $800 and $400 by the end of the year. The reason remains the same: a possible decline in the profitability of blockchain platforms built on ETH smart contract technologies. According to Cowen, both ETH bulls and bears "have crashed and failed to execute their strategies," which will result in both parties locking in their losses by the end of 2023.
With three and a half months remaining until the end of the year, the current state of the market at the time of writing this review, Friday evening, September 15, shows ETH/USD trading around $1,620 and BTC/USD at $26,415. The total market capitalization of the crypto market stands at $1.052 trillion, up from $1.043 trillion a week ago. The leading cryptocurrency accounts for 48.34% of the market, while the primary altcoin makes up 18.84%. The Crypto Fear & Greed Index for bitcoin remains in the 'Fear' zone at 45 points, albeit inching closer to the 'Neutral' zone (it was 46 points a week ago).
Rising Commodity Currencies, Mixed Dollar Fortunes, Crucial Decisions Looming on the Horizon
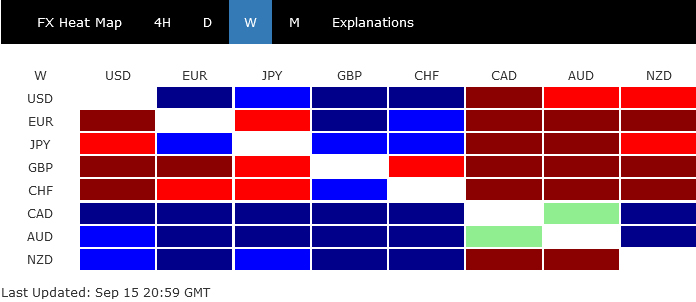
Commodity currencies were the biggest winners last week as the global tightening cycle draw closer to a prolonged pause. There was some optimism that China's economy is moving past the worst with improving economic data. The change in sentiment also lift oil prices, which was already lifted by tight supply outlook, and feed back into the currency markets.
While Euro was under some selling pressure after ECB's dovish hike, the situation was not disastrous. ECB was the most recent one to indicate explicitly that interest rates have possibly peaked. But it shouldn't be the only central bank. Indeed, the single currencies was just the third worst performer, with Sterling and Swiss France being worse.
Dollar and Yen ended mixed, up against European but down against commodity currencies. The development argues that Dollar traders were indeed holding their bets ahead of FOMC rate decision, which is just a few days away. Dollar index is now pressing a key near term resistance zone and would probably reveal next move soon.
Dollar Index presses key resistance zone, fate on hands of Fed
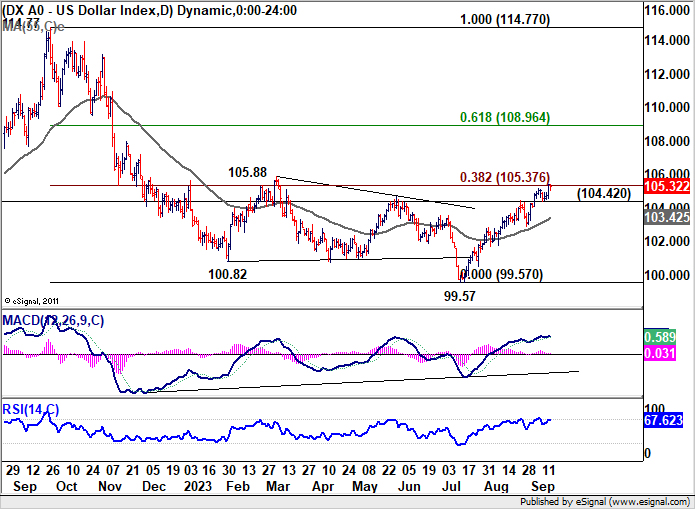
Last week saw Dollar index continue its recent rally, peaking at 105.43 before settling at 105.32. This surge was significantly buoyed by a sell-off in Euro, although the downward momentum of EUR/USD seemed to decelerate upon reaching the 1.0634 support level. Parallelly, the breach of 147.88 resistance by USD/JPY seemed to lack conviction, leaving the fate of Dollar index in the critical resistance area between 150.37/88 hanging in the balance.
As the ripple effects of ECB's rate decision potentially subside, market attention is pivoting to the upcoming Fed and BoJ decisions, scheduled for Wednesday and Friday, respectively. The overwhelming consensus is that Fed will maintain its current interest rate range of 5.25-5.50%. Market speculations regarding further rate hikes have been inconsistent, akin to the unpredictability of a coin toss. Under the most optimistic assumptions, Fed is unlikely to cut interest rates until at least the coming June. However, such forecasts might undergo significant adjustments post revelation of Fed's updated economic projections and dot plot. Concurrently, traders will be vigilant to any policy tweak by BoJ priming for a departure from negative interest rates in 2024.
Analyzing from a technical standpoint, rejection by 38.2% retracement of 114.77 to 99.57 at 105.37 and 105.88, followed by break of 104.42 support, will indicate short term topping in Dollar Index. Deeper decline would then be seen in the near term back to 55 D EMA (now at 103.42). That would at best render the medium-term outlook neutral.
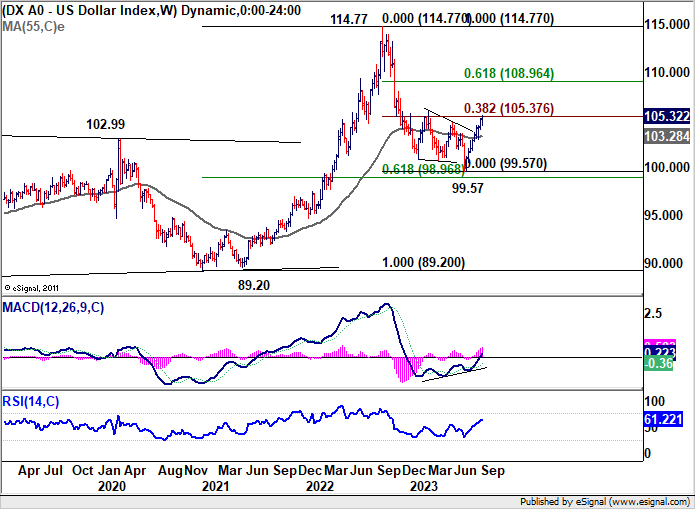
Nevertheless, a steadfast break above the barrier at 105.37 and preferably past the 105.88 resistance could initiate a more substantial rally, possibly reaching 61.8% retracement at 108.96. For such an optimistic scenario to materialize, the greenback must assert itself robustly against both Euro and Yen.
No disastrous selling on Euro after ECB's dovish hike
Euro found itself amidst a whirlpool of selling pressure, triggered predominantly by ECB's dovish 25bps rate hike. Following the adjustment, the main refinancing and deposit rates now stand at 4.50% and 4.00%, respectively. However, ECB has indicated its intent to keep interest rates at this restrictive for an extended duration to steer inflation back to target.
Market sentiments have since solidified around expectation of a 25bps rate reduction by ECB by June of the upcoming year. This is in light of the central bank's downgraded GDP growth projections spanning from 2023 to 2025. A growing cluster of analysts are voicing concerns about growth dynamics, which they perceive as a more pressing issue in comparison to inflation.
However, bucking the trend of widespread anticipation, Euro found some traction courtesy of ECB officials, including President Lagarde, who emphasized that rate cuts were not a topic of current discussions at the ECB. This support from ECB allowed Euro to finish the week on a stronger note against Sterling and Swiss Franc, albeit confined to a near-term range. In upcoming financial events, both BoE and SNB could make potentially their final rate hikes in this cycle.
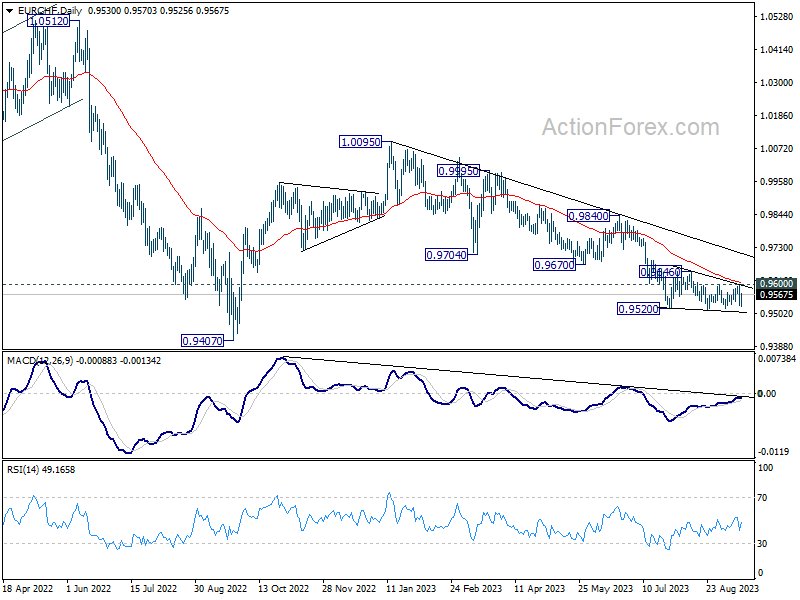
For EUR/CHF, being capped below falling 55 D EMA, risk remains on the downside. Another fall through 0.9513 to extend the down trend from 1.0095 remains in favor. But based on the current downside momentum as seen in D MACD, strong support could emerge above 0.9407 low to floor the cross, at least on first attempt.
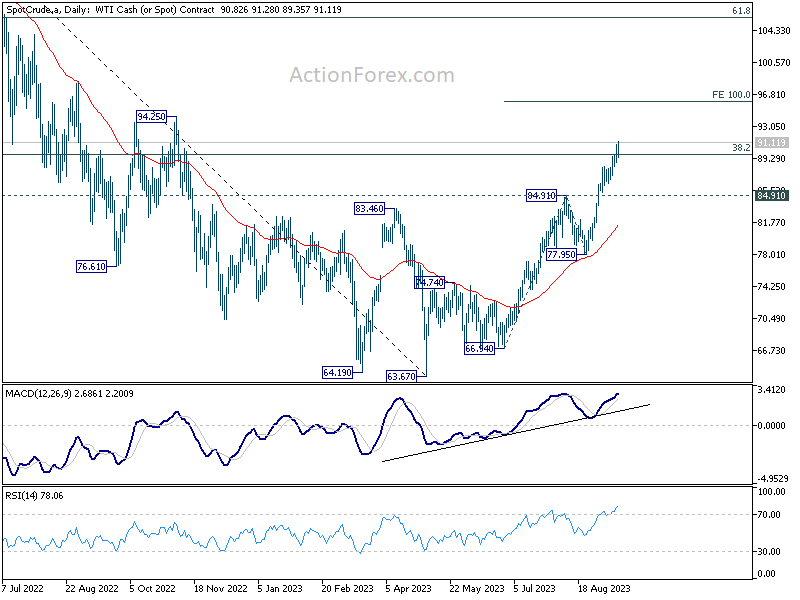
WTI breaks 90 with three-week winning streak, ready for 100?
Oil prices soared to a ten-month high last week, marking their third consecutive weekly gain. The current pace indicates that oil is set for its most significant quarterly surge since the upheaval caused by Russia's invasion of Ukraine in the early months of 2022.
Dominating the drivers behind this upsurge are the ongoing supply concerns. These concerns have been accentuated since Saudi Arabia and Russia jointly announced the continuation of their supply cut measures. The positive momentum was further bolstered by China's economic data last week, indicating industrial production and retail sales performance surpassing expectations, thereby giving an added boost to oil prices.
Interestingly, the appetite among traders remains undeterred, even as prices are hovering above the 90 mark. This indicates a leaning towards further bullish movement, with oil market likely remaining tight for a bit more time. Yet, the market might still require a new significant driving force to propel oil prices into the triple-digit territory.
On the flip side, break of the 90 threshold has rekindled concerns surrounding inflation. As WTI oil inches further to 100, these apprehensions are likely to amplify, potentially disrupting inflation expectations and impeding the disinflation initiatives set by global central banks.
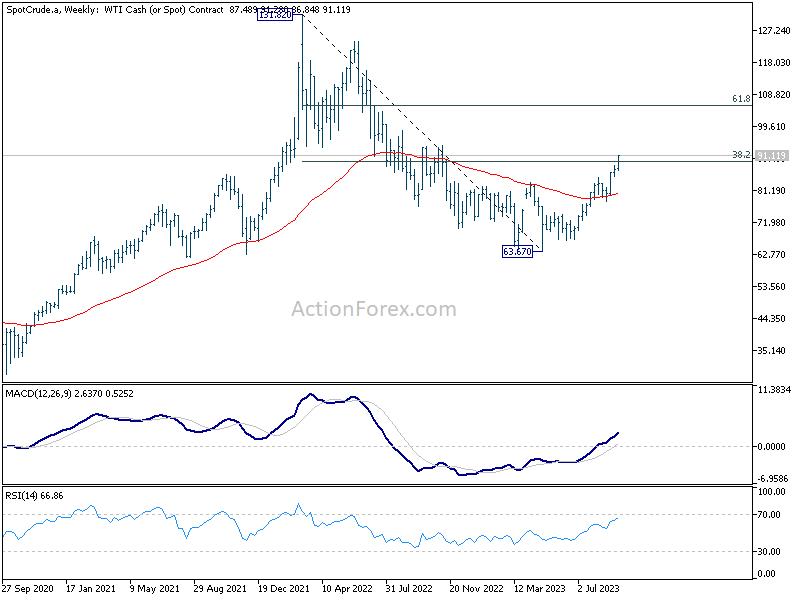
Technically, the break above 38.2% retracement of 131.82 to 63.67 at 89.70 is also significant. It opens the way to 61.8% retracement at 105.78, even if rise from 63.67 is a corrective move. But WTI would need to overcome the next near term hurdle first, 100% projection of 66.94 to 64.91 from 77.95 at 95.92. The momentum towards this projection level would be watched closely to gauge the odds of further rally beyond that.
A deep dive into Aussie and Loonie as commodity currencies jumped
Commodity currencies showed remarkable strength last week, flourishing on the back of increasingly optimistic sentiment as anticipation builds around culmination of global tightening cycle. Australian Dollar enjoyed a boost, courtesy of encouraging economic figures pouring out of China. Simultaneously, Canadian Dollar rode the wave of rising oil prices. The vitality of these commodity currencies was especially pronounced when juxtaposed with European majors.
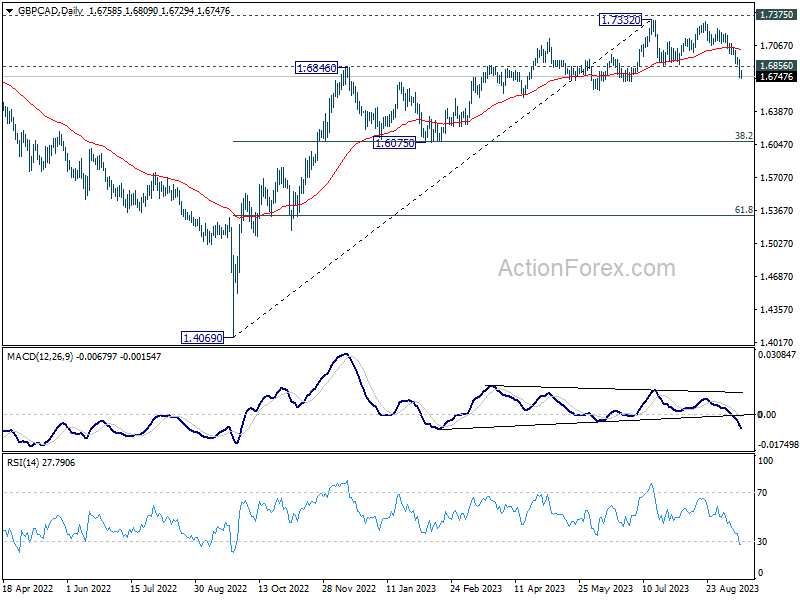
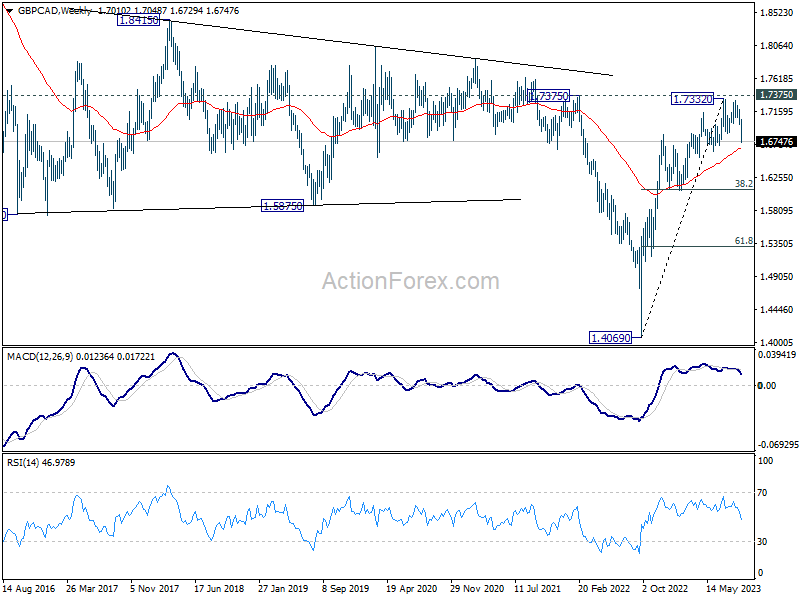
After accelerating down to 1.6729 last week, next focus for GBP/CAD is now on 55 W EMA (now at 1.6653). Sustained break there should confirm rejection by 1.7375 structural resistance, and that 1.7332 is medium term top. Fall from there would at least be a correction to whole rise from 1.4069 (2022 low). That would pave the way to 1.6075 cluster support (38.2% retracement of 1.4069 to 1.7332 at 1.6086) next.
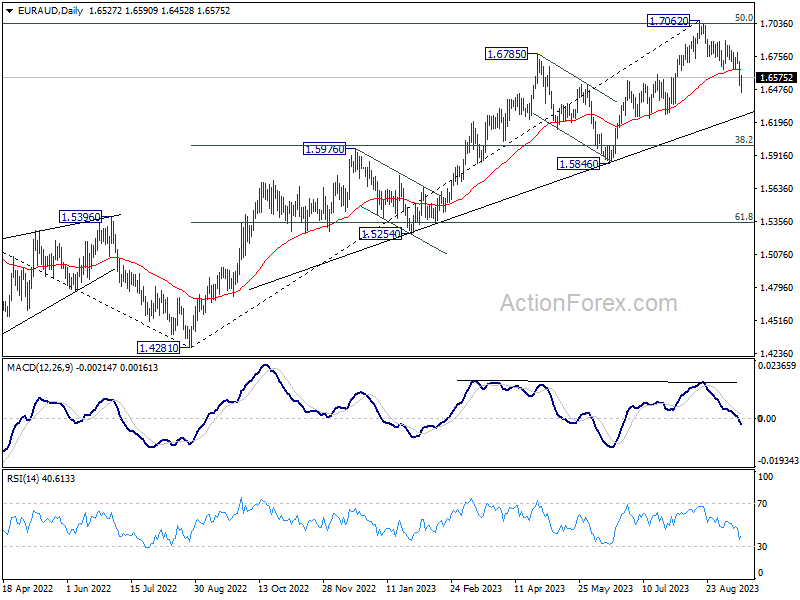
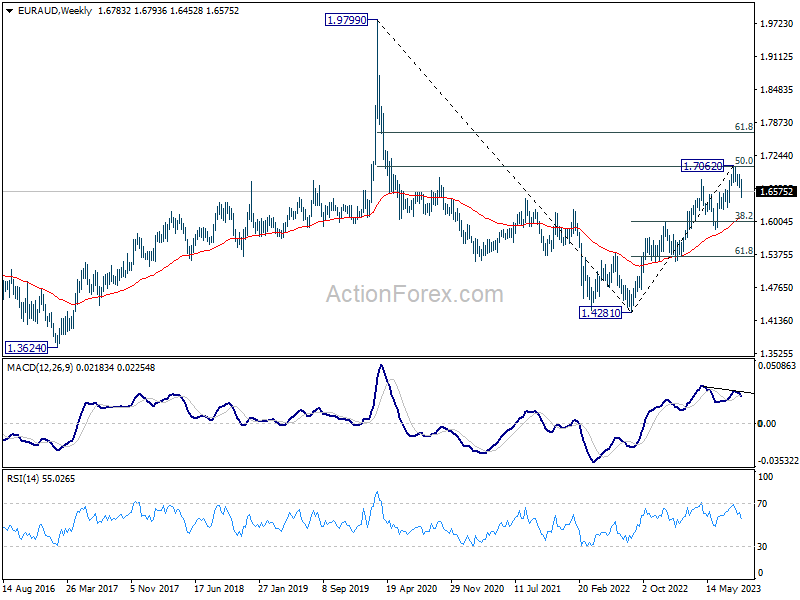
Considering bearish divergence condition in W MACD, EUR/AUD has also likely made a medium term top at 1.7062, after hitting 50% retracement of 1.9799 to 1.4281 at 1.7040. Fall from 1.7062 is likely correcting whole rise from 1.4281. Deeper decline is expected to 38.2 retracement of 1.4281 to 1.7062 at 1.6000.
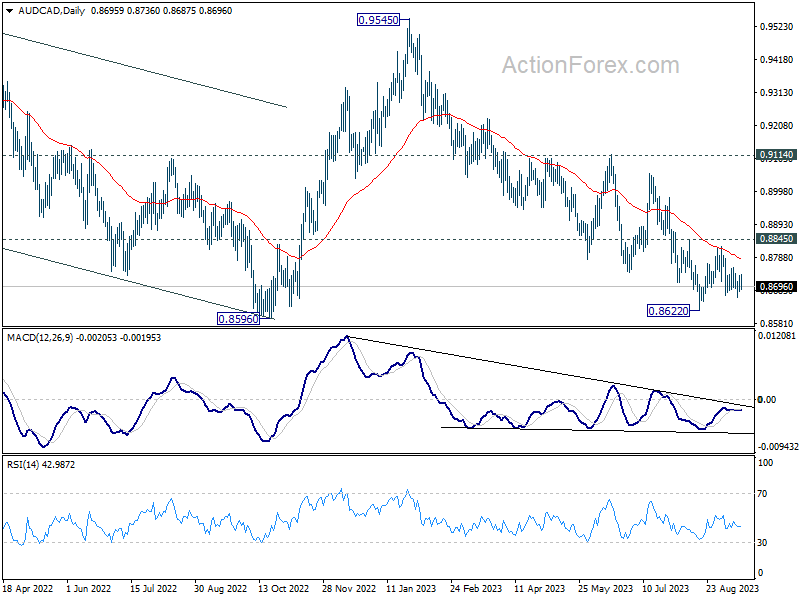
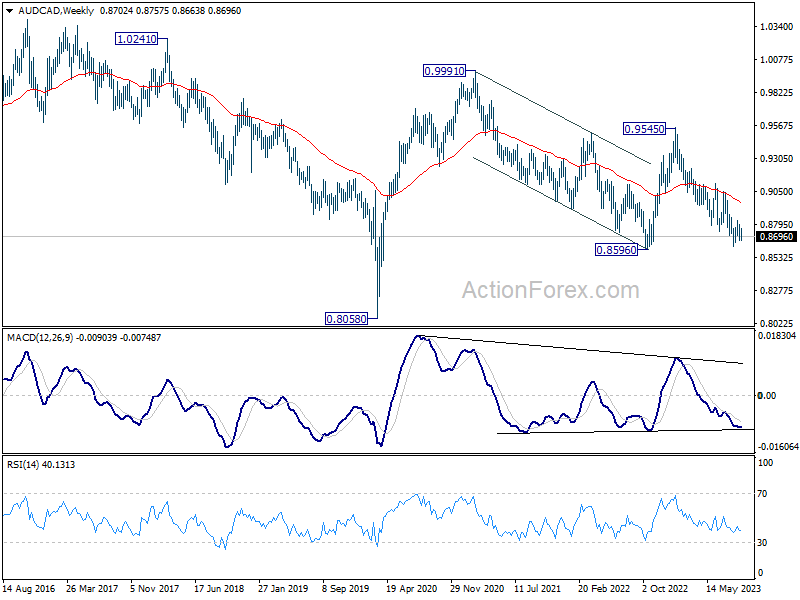
Comparing Aussie and Loonie, AUD/CAD is still clearly staying in the down trend from 0.9545. Further fall will remain in favor as long as 0.8845 resistance holds. However, as the cross have struggle to build downside momentum for a few months already, downside potential below 0.8596 could be limited. On the other hand, firm break of 0.8845 could present bullish reversal opportunity for at least a take on 0.9114 resistance.
USD/JPY Weekly Outlook
USD/JPY's late breach of 147.88 resistance suggests that rise from 127.20 is resuming. Initial bias is mildly on the upside this week for 151.93 high. On the downside, below 147.00 minor support will turn intraday bias neutral again first. But outlook will remain bullish as long as 145.88 support holds.
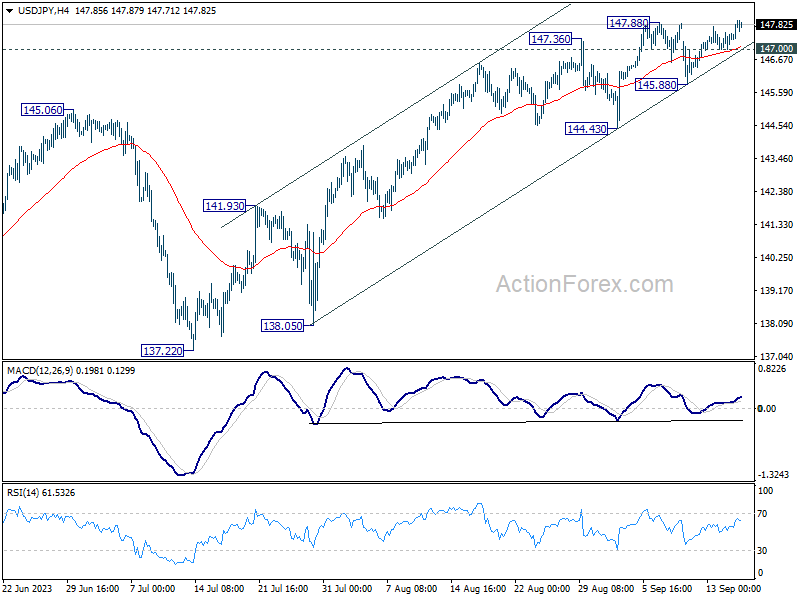
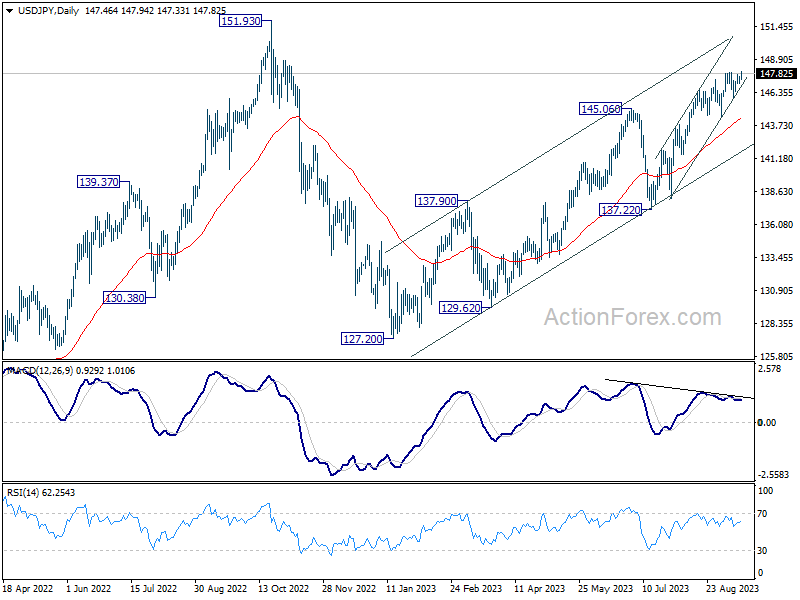
In the bigger picture, while rise from 127.20 is strong, it could still be seen as the second leg of the corrective pattern from 151.93 (2022 high). Rejection by 151.93, followed by break of 137.22 support will indicate that the third leg of the pattern has started. However, sustained break of 151.93 will confirm resumption of long term up trend.
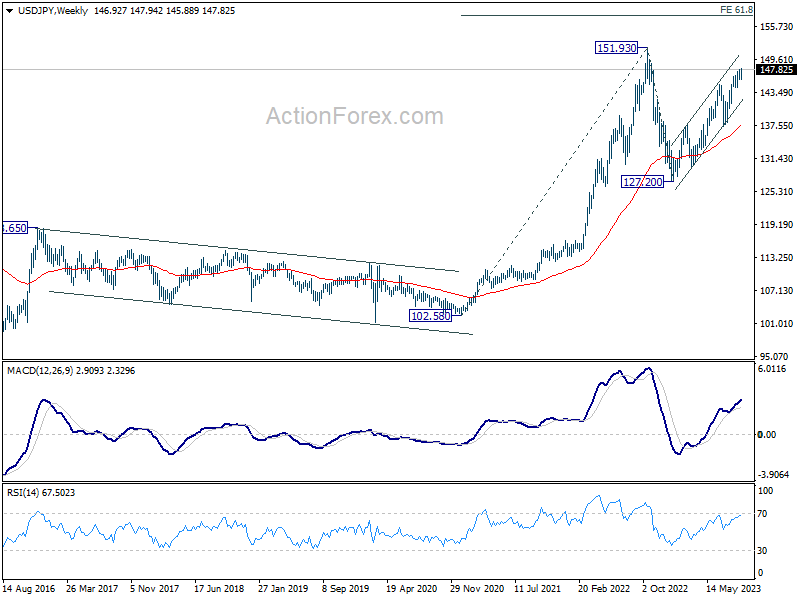
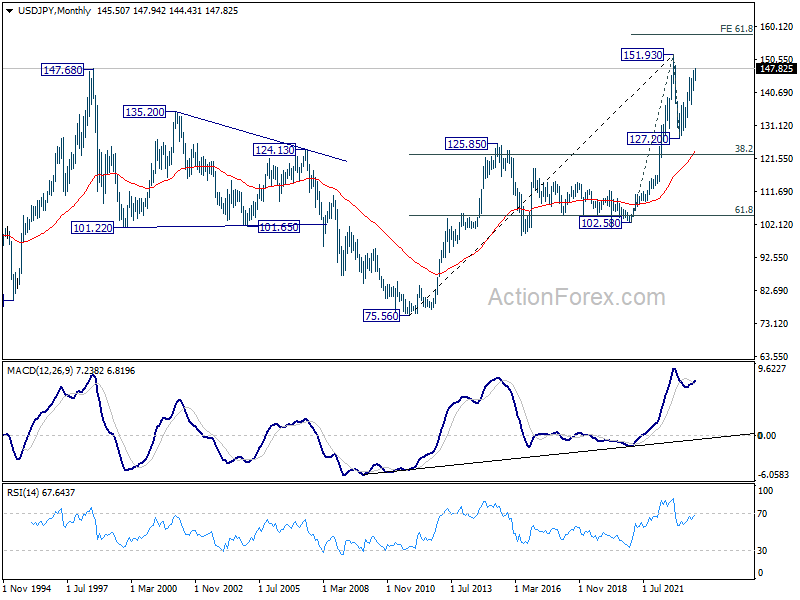
In the long term picture, price action from 151.93 is seen as developing into a corrective pattern to up trend from 75.56 (2011 low). Another falling leg could be seen, but in that case, downside should be contained by 38.2% retracement of 75.56 to 151.93 at 122.75. On resumption, next target would be 61.8% projection of 102.58 to 151.93 from 127.20 at 157.69.
EUR/USD Weekly Outlook
EUR/USD's fall from 1.1274 extended lower last week and touched 1.0609/34 cluster support zone. Initial bias is turned neutral this week first. Strong rebound from current level, followed by break of 1.0767 resistance, should confirm short term bottoming. Intraday bias will be back on the upside for 1.0944 resistance. However, sustained break of 1.0609/34 support zone will carry larger bearish implication, and target 1.0515 support next.
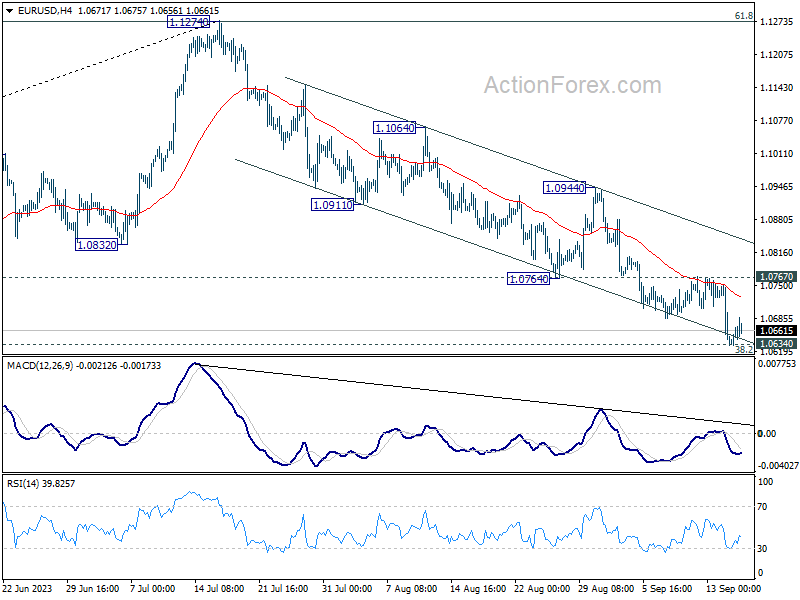
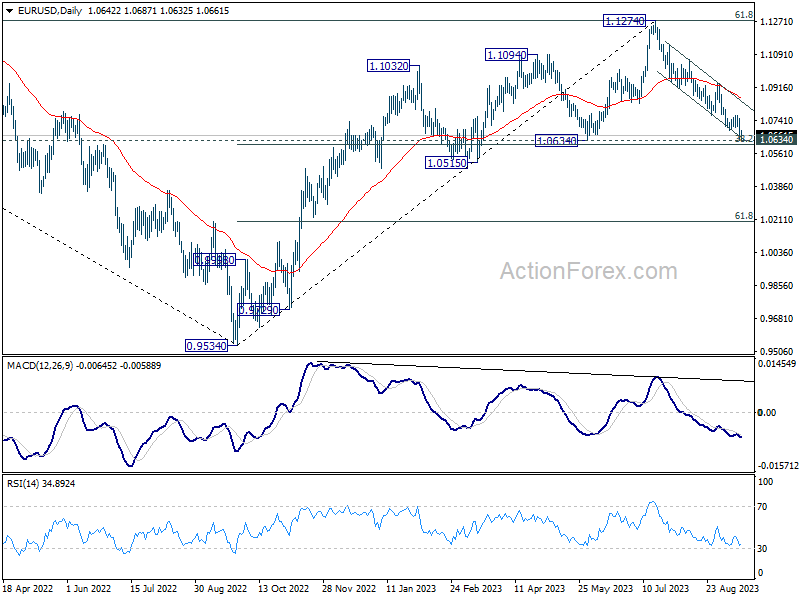
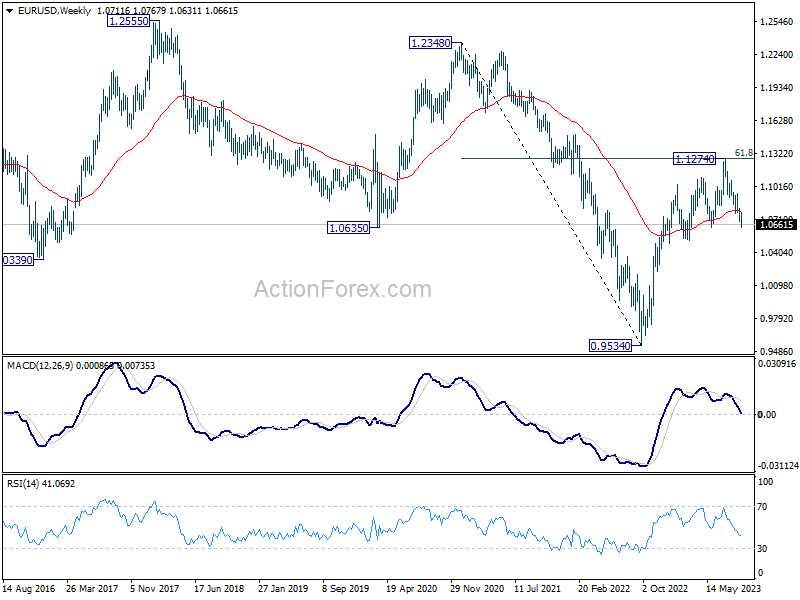
In the bigger picture, fall from 1.1274 medium term top is seen as a correction to up trend from 0.9534 (2022 low). Strong support could be seen from 1.0634 cluster support (38.2% retracement of 0.9534 to 1.1274 at 1.0609) to bring rebound, at least on first attempt. However, sustained break of 1.0609/0634 will raise the chance of bearish trend reversal, and target 61.8% retracement at 1.0199.
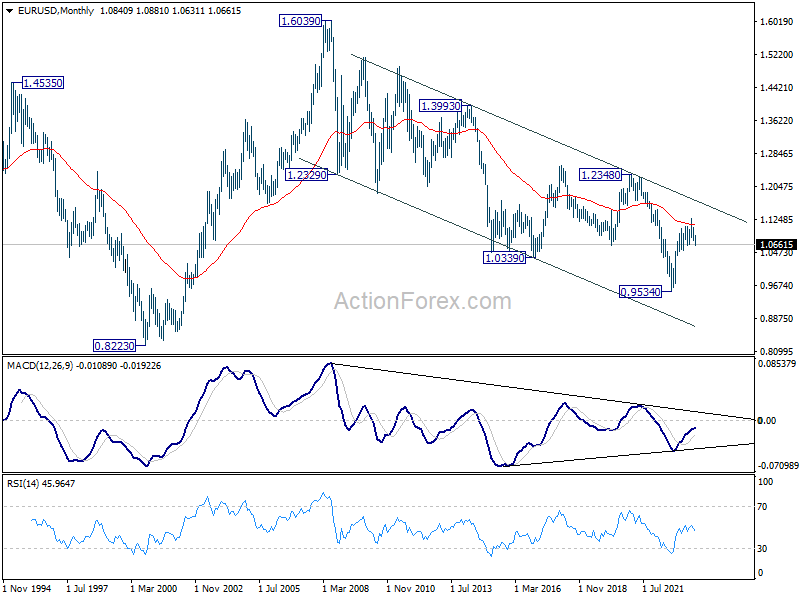
In the long term picture, there is no clear sign of trend reversal yet. That is, down trend from 1.6039 (2008 high) might still be in progress. Rejection by 55 M EMA (now at 1.1126) will retain long term bearishness, for another fall through 0.9534 at a later stage.
USD/JPY Weekly Outlook
USD/JPY's late breach of 147.88 resistance suggests that rise from 127.20 is resuming. Initial bias is mildly on the upside this week for 151.93 high. On the downside, below 147.00 minor support will turn intraday bias neutral again first. But outlook will remain bullish as long as 145.88 support holds.
In the bigger picture, while rise from 127.20 is strong, it could still be seen as the second leg of the corrective pattern from 151.93 (2022 high). Rejection by 151.93, followed by break of 137.22 support will indicate that the third leg of the pattern has started. However, sustained break of 151.93 will confirm resumption of long term up trend.
In the long term picture, price action from 151.93 is seen as developing into a corrective pattern to up trend from 75.56 (2011 low). Another falling leg could be seen, but in that case, downside should be contained by 38.2% retracement of 75.56 to 151.93 at 122.75. On resumption, next target would be 61.8% projection of 102.58 to 151.93 from 127.20 at 157.69.
GBP/USD Weekly Outlook
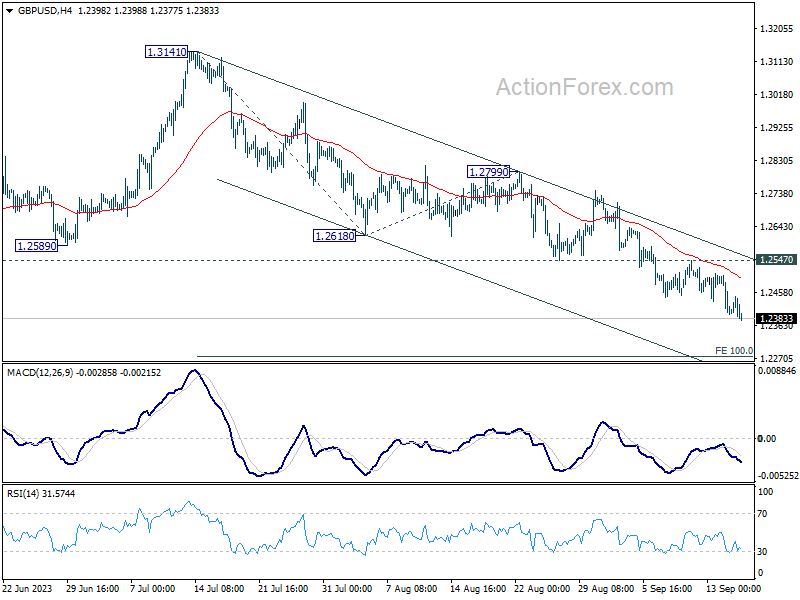
GBP/USD's fall from 1.3141 continued last week. Initial bias stays on the downside this week for 100% projection of 1.3141 to 1.2618 from 1.2799 at 1.2276. On the upside, though, firm break of 1.2547 resistance will now indicate short term bottoming, and bring stronger rebound.
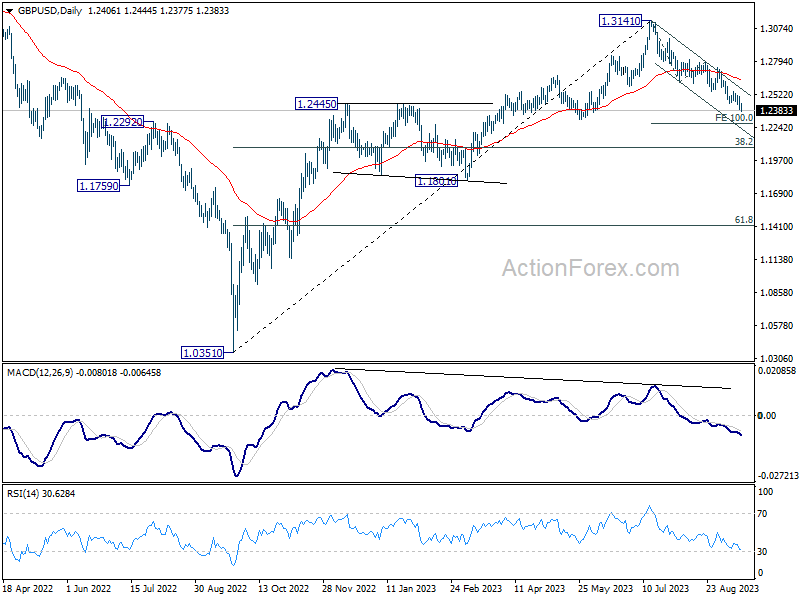
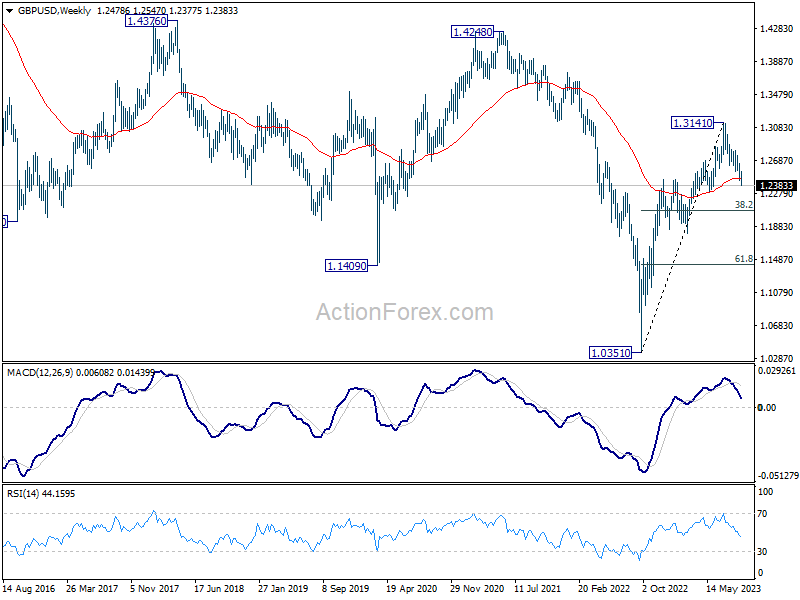
In the bigger picture, fall from 1.3141 medium term top is seen as a correction to up trend from 1.0351 (2022 low). Deeper decline would be seen to 38.2% retracement of 1.0351 to 1.3141 at 1.2075. Strong support would be seen there to bring rebound on first attempt. However, sustained break of 1.2075 will raise the chance of bearish trend reversal.
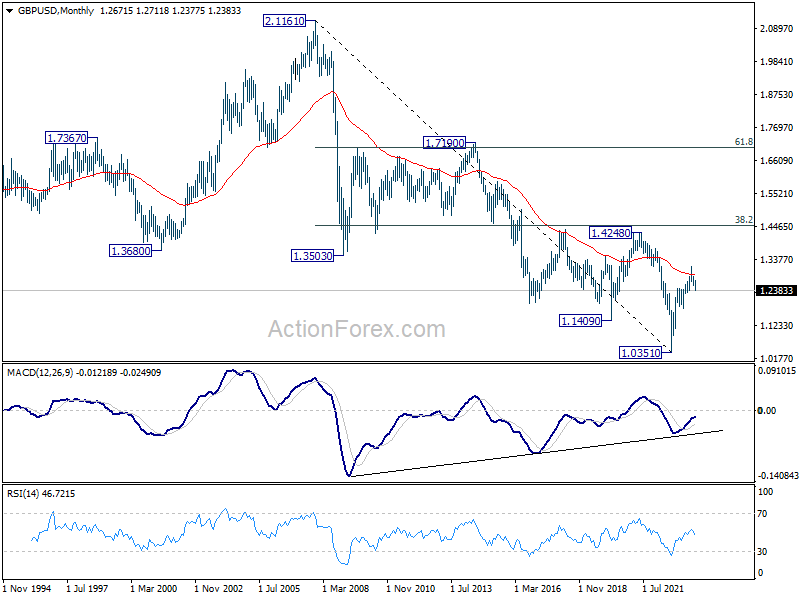
In the long term picture, there is no clear sign of trend reversal yet. Rise from 1.0351 could be part of a consolidation pattern to down trend from 2.1161 (2007 high). Rejection by 55 M EMA (now at 1.2900) will retain long term bearishness for extending the down trend at a later stage.
USD/CHF Weekly Outlook
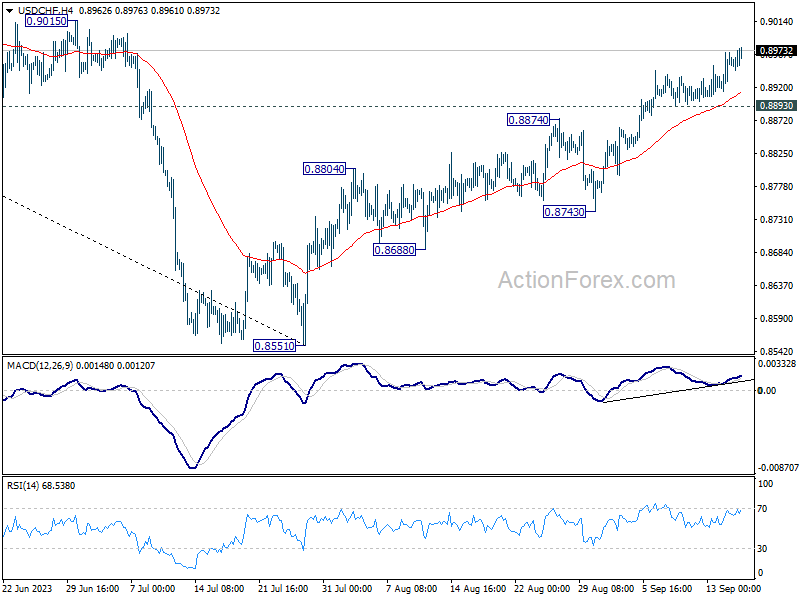
USD/CHF's rise from 0.8551 continued last week and hit as high as 0.8976. Initial bias stays on the upside this week for 0.9146 cluster resistance. On the downside, however, break of 0.8893 support will argue that a short term top is possibly formed, and turn bias back to the downside for 55 D EMA (now at 0.8850).
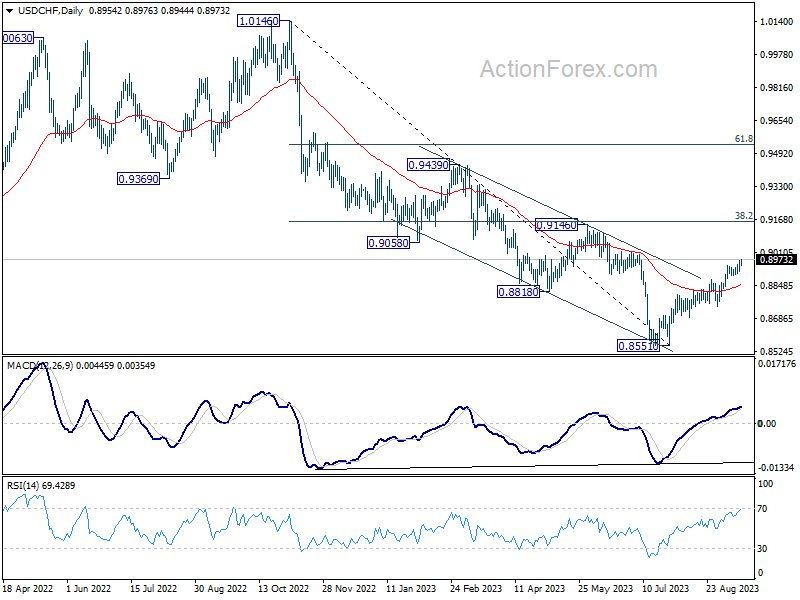
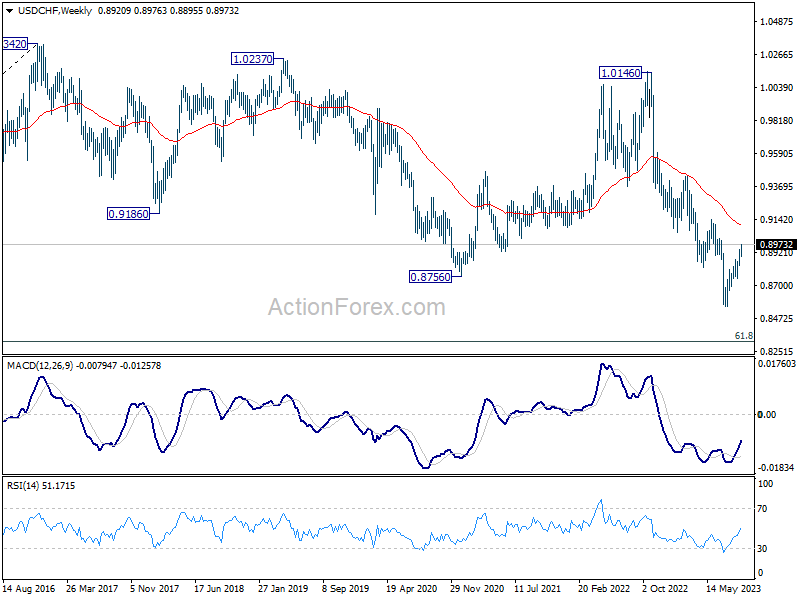
In the bigger picture, rebound from 0.8551 medium term bottom is currently seen as a correction to the downtrend from 1.0146 (2022 high). Further rally would be seen to 0.9146 cluster resistance (38.2% retracement of 1.0146 to 0.8551 at 0.9160). Strong resistance could be seen there to limit upside, at least on first attempt.
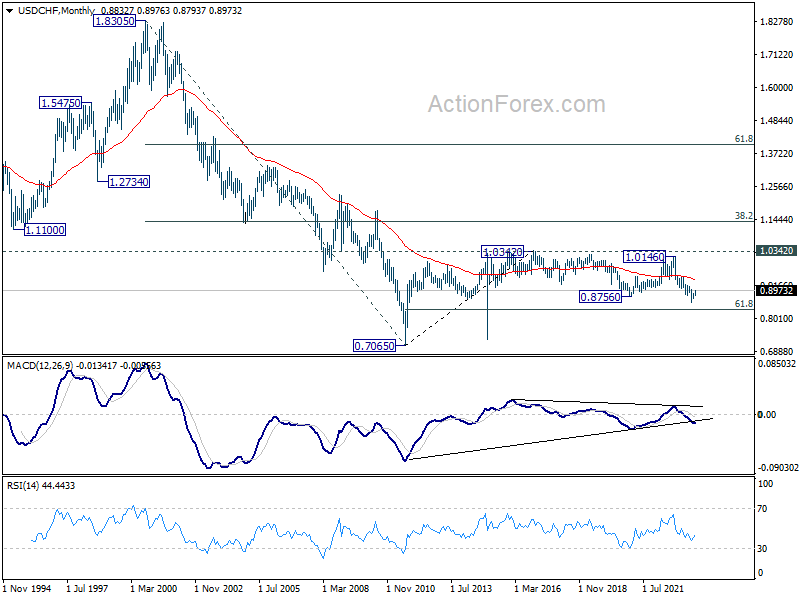
In the long term picture, there is no clear sign that down trend from 1.8305 (2000 high) has completed. With 38.2% retracement of 1.8305 to 0.7065 at 1.1359 intact, outlook is neutral at best. Deeper fall would still be seen to 61.8% retracement of 0.7065 (2011 low) to 1.0342 (2016 high) at 0.8317.
AUD/USD Weekly Report
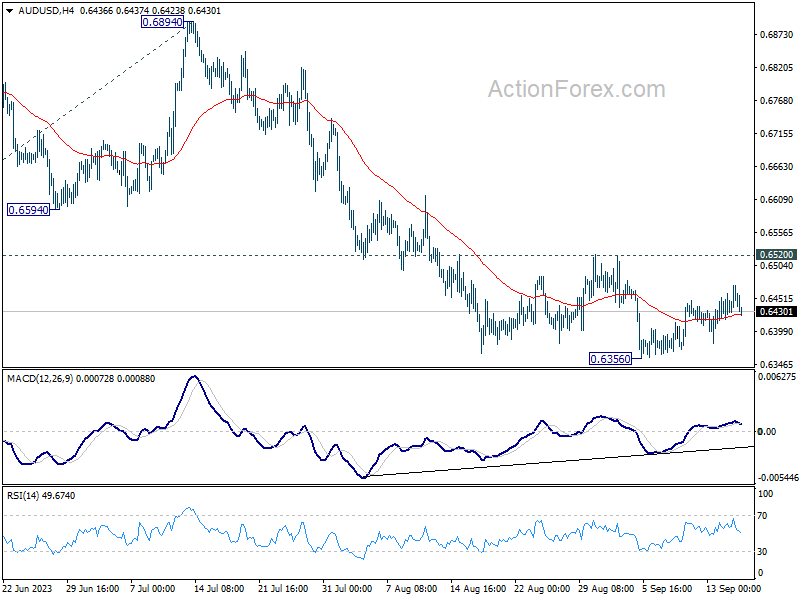
AUD/USD's gyrated higher last week but outlook is unchanged. Initial bias stays neutral this week for some more consolidations. But further decline is expected as long as 0.6520 resistance holds. Break of 0.6356 will resume larger down trend to 100% projection of 0.7156 to 0.6457 from 0.6894 at 0.6195.
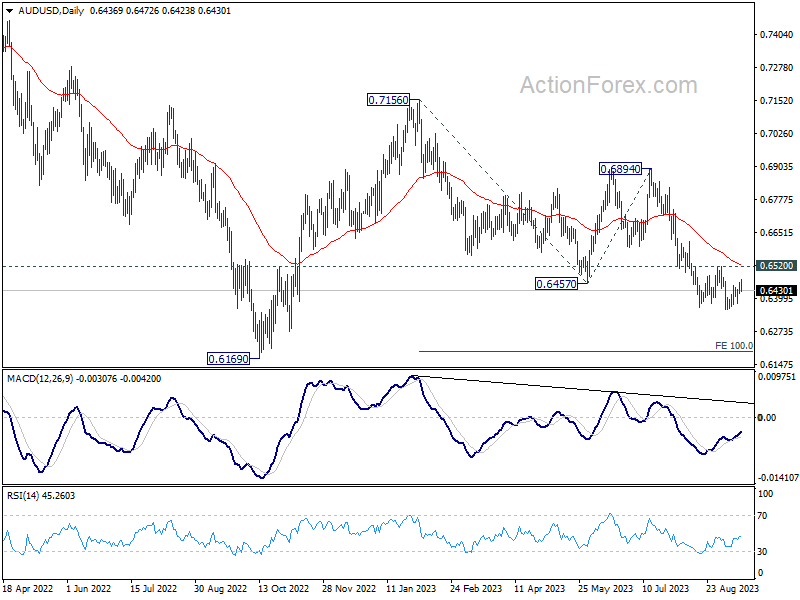
In the bigger picture, down trend from 0.8006 (2021 high) is possibly still in progress. Decisive break of 0.6169 will target 61.8% projection of 0.8006 to 0.6169 to 0.7156 at 0.6021. This will now remain the favored case as long as 0.6894, in case of strong rebound.
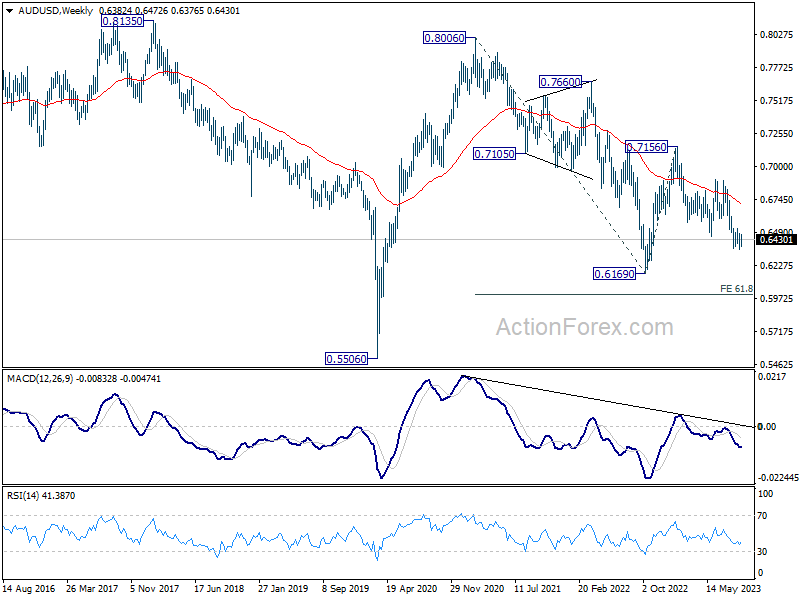
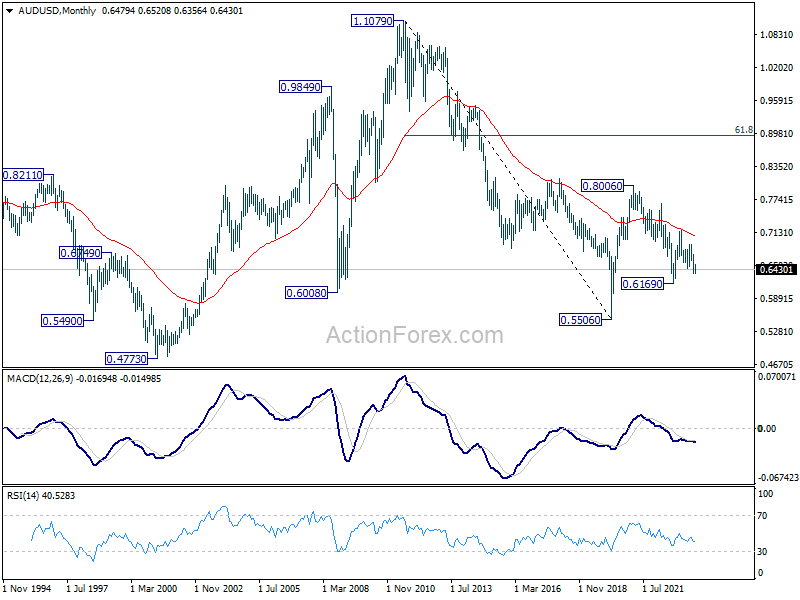
In the long term picture, while fall from 0.8006 might extend lower, the structure argues that it's merely a correction to rise from 0.5506 (2020 low). In case of downside extension, strong support should emerge above 0.5506 to bring reversal. But still, momentum of the next move will be monitored to adjust the assessment.
USD/CAD Weekly Outlook
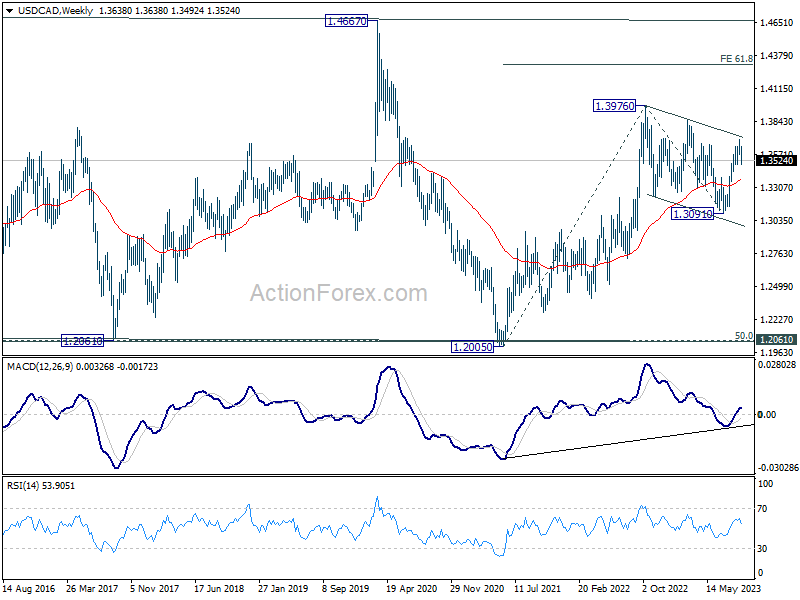
USD/CAD's correction from 1.3693 extended lower last week but stayed above 1.3488 support. Initial bias remains neutral first and further rally is expected. Break of 1.3693 will resume the rise from 1.3091 and target 1.3860 resistance next. However, firm break of 1.3488 will bring deeper fall to 61.8% retracement of 1.3091 to 1.3693 at 1.3321.
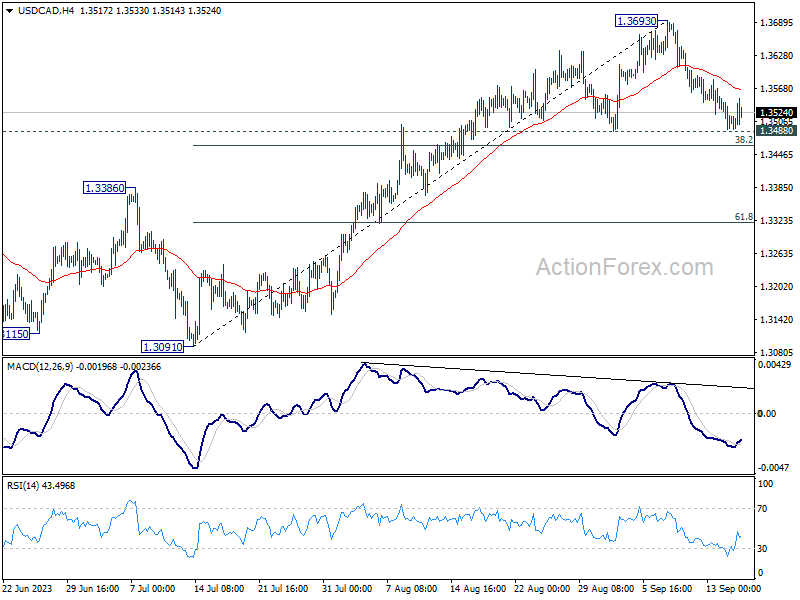
In the bigger picture, price actions from 1.3976 are viewed as a corrective pattern. Strong support from 55 D EMA (now at 1.3465) will solidify the case that it has completed with three waves down to 1.3091 already. Break of 1.3976 will target 61.8% projection of 1.2005 to 1.3976 from 1.3091 at 1.4309. However, sustained break of 55 D EMA will indicate that the pattern is extending with another falling leg before completion.
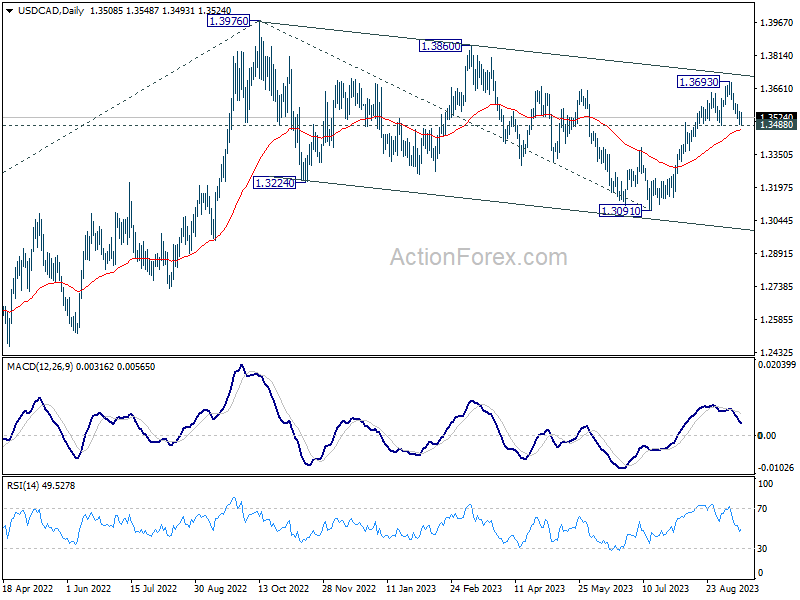
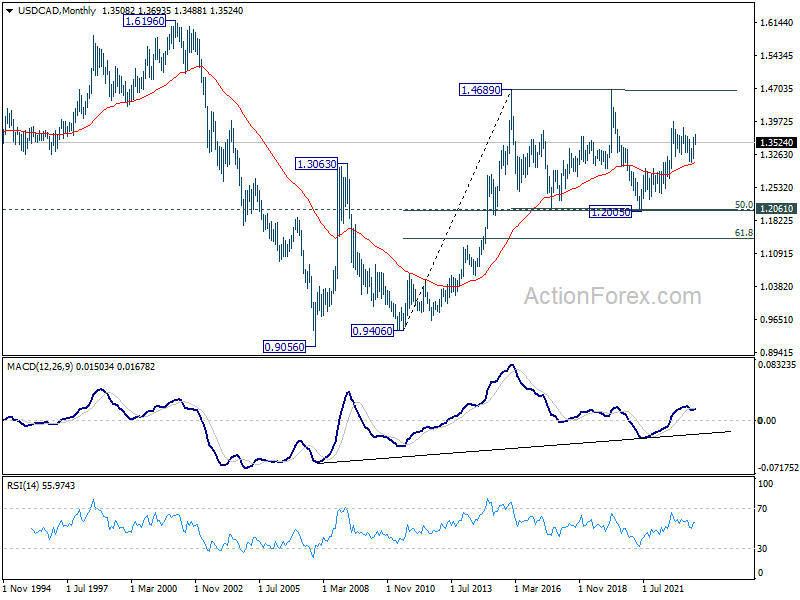
In the longer term picture, price actions from 1.4689 (2016 high) are seen as a consolidation pattern only, which might have completed at 1.2005. That is, up trend from 0.9506 (2007 low) is expected to resume at a later stage. This will remain the favored case as 55 M EMA (now at 1.3082) holds.