Sample Category Title
Yen Hits Year Low on Yields, Euro Shows Signs of Stabilization
Japanese Yen registered notable slump today, recording a new low for the year against Dollar, a move driven largely by ascending benchmark yields in the US and European markets. Meanwhile, sentiment in risk markets appears to be on the upswing, partly propelled by encouraging economic data emerging from China, fostering an environment where commodity currencies are experiencing a lift, with Australian Dollar taking the forefront.
Euro, on the other hand, managed to slow its descent, buoyed by remarks from ECB officials who sought to downplay the prospects of rate cuts in the coming year. The comments stimulated a recovery in Euro, particularly against Sterling and Swiss franc. While Dollar is making efforts to strengthen up, traders remain cautious, seemingly unwilling to stake large bets ahead of Fed's rate decisions slated for next week.
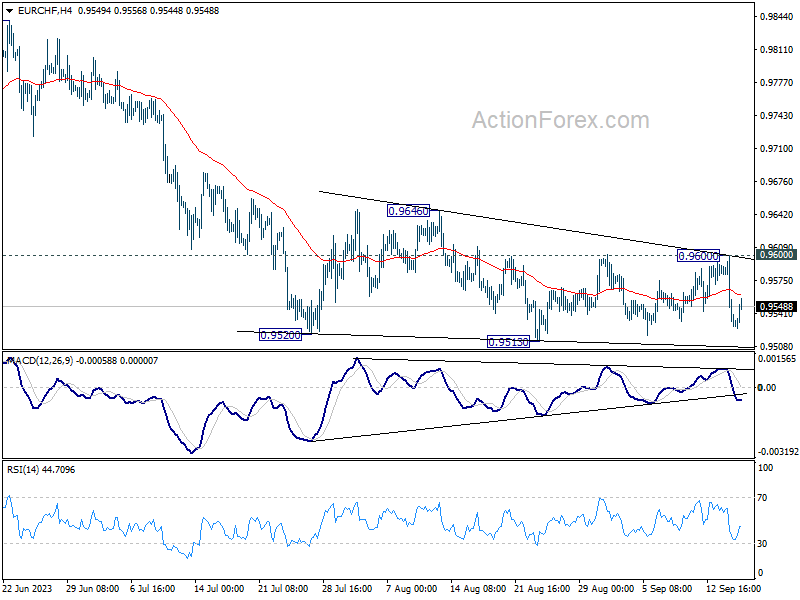
Technically, EUR/CHF recovered well ahead of 0.9513 low, and the developments argues that post-ECB selling might have past its climax. Nevertheless, outlook will stay bearish as long as 0.9600 resistance holds. Break of 0.9513 is in favor sooner or later to resume larger decline from 1.0095.
In Europe, at the time of writing, FTSE is up 0.68%. DAX is up 0.91%. CAC is up 1.43%. Germany 10-year yield is up 0.0649 at 2.661. Earlier in Asia, Nikkei rose 1.10%. Hong Kong HSI rose 0.75%. China Shanghai SSE dropped -0.28%. Singapore Strait Times rose 0.96%. Japan 10-year JGB yield rose 0.0013 to 0.710.
ECB officials dismiss predictions of early rate cuts
In a chorus of comments, ECB officias pushed back on market expectations on a rate cut next year.
During a press conference today, ECB President Christine Lagarde emphasized, "We have not decided, discussed or even pronounced cuts." She underlined that the institution's strategy will pivot according to incoming economic data and highlighted that the levels and duration of the existing high rates are designed to foster a return to the inflation target of 2%. The focus is on evolving economic indicators, reviewed in a meeting-by-meeting approach, hinting at the bank's readiness to adapt in the face of changing economic contexts.
Supporting Lagarde's stance, ECB Vice President Luis de Guindos conveyed skepticism regarding market pricing that forecast a rate cut in June 2024. Speaking to Spanish radio station Cadena Cope, de Guindos mentioned that the markets often rely on speculative "hypotheses that sometimes do not come true." He viewed such forecasts as gambles, affirming that they might not materialize. "It is a bet, it may be right and it may not be right," De Guindos added, underlining the uncertain nature of market forecasts.
Martins Kazaks, a member of ECB's Governing Council, expressed comfort with the current rate levels, showing optimism regarding achieving the 2% inflation goal by the second half of 2025. He maintained that the bank remains open to the possibility of another rate increase if substantiated by forthcoming data.
Kazaks was assertive in dismissing speculations about a rate cut in April, stating such conjectures are "inconsistent with our macro scenario." He reiterated the bank's firm stance to "stay in restrictive territory for as long as necessary to get inflation to 2%."
UK public anticipates elevated inflation and ascending interest rates, BoE Survey Reveals
Bank of England/Ipsos Inflation Attitudes Survey for August has shed light on how the public perceives inflation trends and the likely moves by the central bank.
Interestingly, public's perception of current inflation rate seems to have moderated, with a median estimate of 8.6%. This is a full percentage point decline from 9.6% recorded in May. This suggests that the public may feel the worst of inflationary surge has passed.
However, expectations for inflation over the short to medium term are slightly more elevated. The median expectation for inflation over the next year stood at 3.6%, a modest uptick from 3.5% three months ago. Looking a bit further out, the 12-month period after next, expectations rose to 2.8% from 2.6% in the prior survey.
Regarding BoE's policy path, a significant 63% anticipate interest rate hike over the next year, marking an increase from 57% in May. Meanwhile, those expecting rates to remain stable accounted for 19%, a slight decrease from prior reading of 20%.
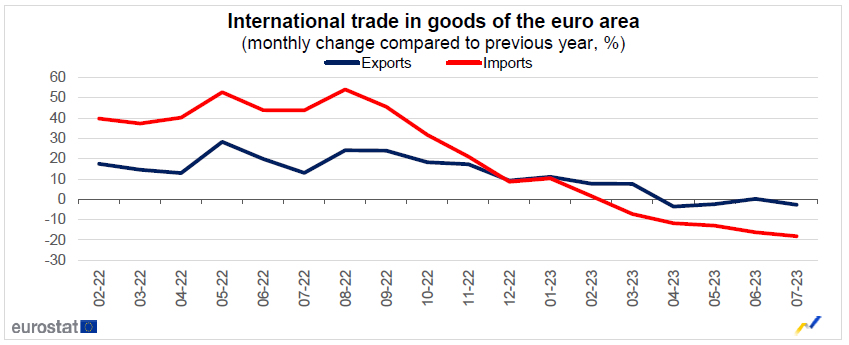
Eurozone goods expects down -2.7 yoy, imports fell -18.2% yoy
Eurozone exports of goods to the rest of the world dropped -2.7% yoy to EUR 227.8B in Jul. Imports fell -18.2% yoy to EUR 221.3B. Eurozone recorded EUR 6.5B trade surplus. Intra-Eurozone trade fell -7.9% yoy to EUR 211.8B.
In seasonally adjusted term, exports fell -1.7% mom to EUR 232.6B. Imports rose 0.7% mom to EUR 229.7B. Trade surplus narrowed from EUR 8.6B to EUR 2.9B, smaller than expectation of EUR 13.5B. Intra-Eurozone trade fell slightly from EUR 219.3B to EUR 218.7B.
NZ BNZ PMI falls to 46.1, manufacturing activity slumps to multi-year low
New Zealand's manufacturing sector experienced a further slowdown in August, with BusinessNZ Performance of Manufacturing Index falling slightly from 46.6 in July to 46.1. This marks the lowest rate of activity for a non-pandemic affected month since June 2009. Furthermore, the latest PMI data sits significantly below its long-term average of 52.9.
A closer look at the August data reveals: Production observed a modest increase, moving from 43.1 to 43.9. Employment metrics improved, rising from 44.8 to 47.7. New orders experienced a minor uptick, growing from 45.5 to 46.6. Finished stock levels retreated slightly from 52.7 to 52.1. Deliveries, however, showed more promise, escalating from 42.9 to 47.7.
Despite the grim headline figure, it is noteworthy that there was a slight decrease in the proportion of negative comments, standing at 66.7%, a marginal relief compared to July's 72%. However, the level of pessimism mirrored that of May, maintaining the same rate of 66.7%. The pervasive market uncertainty stemming both from domestic and offshore influences, coupled with rising costs and weather-impacted demand, continued to be highlighted as primary drivers for the negative sentiment pervading the industry.
BNZ Senior Economist Craig Ebert expressed concern over the PMI's latest results, noting that while the headline figure had seen much lower points during previous recessions, the composition of August figures brought little consolation. Ebert pinpointed new orders and production as substantial drags on the performance, trailing behind the standard levels by 8.0 and 9.5 points respectively.
China's Economic Data Surpasses Forecasts, but Challenges Persist
China's economic indicators for August showcased a mixed picture but, on the whole, exceeded analyst expectations in key areas. Industrial production exhibited growth of 4.5% yoy, edging out forecast of 4.0% yoy. Retail sales also outperformed predictions, registering 4.6% yoy increase compared to anticipated 3.0% yoy. However, fixed asset investment lagged slightly, presenting a 3.2% rise year-to-date year-on-year, just shy of the 3.3% expected.
The official communique from the NBS acknowledged the data as revealing a "marginal improvement." Emphasizing the resilience and progress of the national economy, the statement underscored that "high-quality development" was on track and the accumulation of positive factors was evident. However, it also stressed caution. While the recovery is in motion, the bureau pointed out that there are still several "unstable and uncertain factors in the external environment" that China has to contend with.
USD/JPY Mid-Day Outlook
Daily Pivots: (S1) 147.14; (P) 147.35; (R1) 147.69; More...
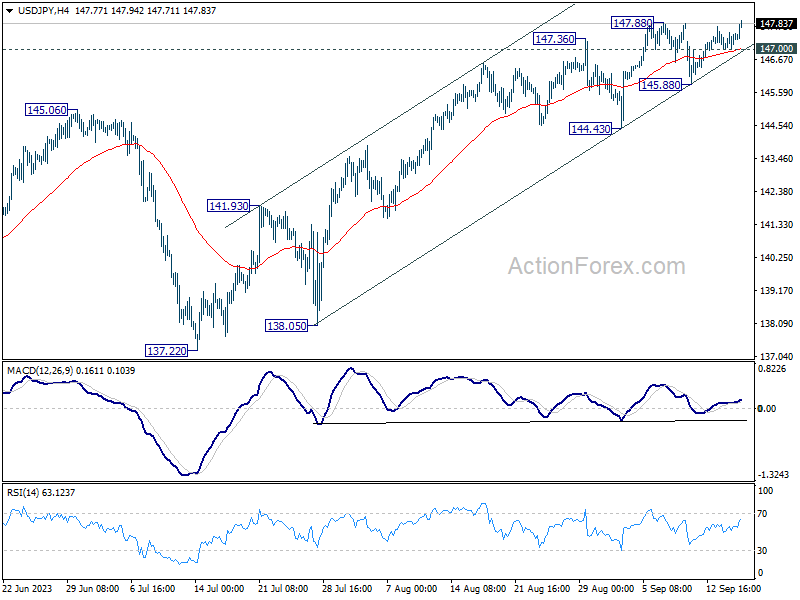
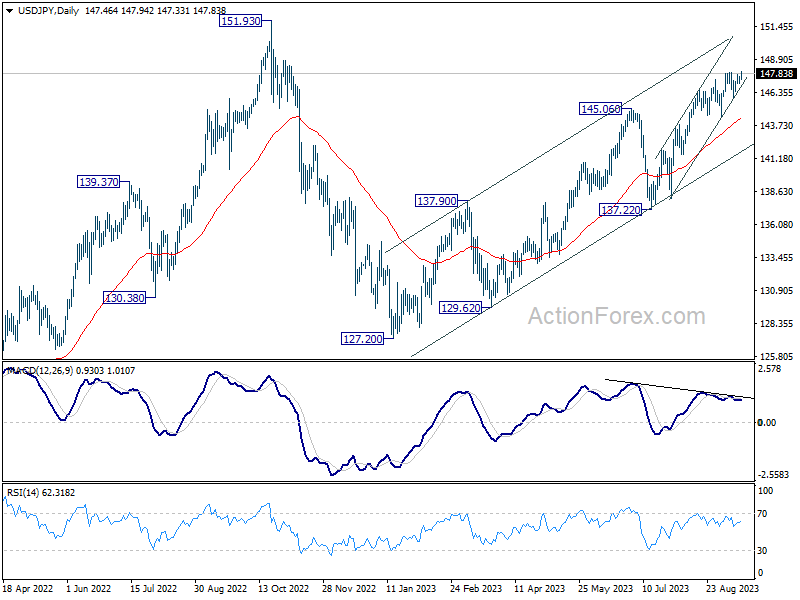
USD/JPY's breach of 147.88 resistance argues that rise from 127.20 is resuming. Intraday bias is back on the upside. Sustained trading above 147.88 will pave the way to retest 151.93 high. On the downside, below 147.00 minor support will turn intraday bias neutral again first. But outlook will remain bullish as long as 145.88 support holds.
In the bigger picture, while rise from 127.20 is strong, it could still be seen as the second leg of the corrective pattern from 151.93 (2022 high). Rejection by 151.93, followed by break of 137.22 support will indicate that the third leg of the pattern has started. However, sustained break of 151.93 will confirm resumption of long term up trend.
Economic Indicators Update
| GMT | Ccy | Events | Actual | Forecast | Previous | Revised |
|---|---|---|---|---|---|---|
| 22:30 | NZD | Business NZ PMI Aug | 46.1 | 46.3 | 46.6 | |
| 02:00 | CNY | Industrial Production Y/Y Aug | 4.50% | 4.00% | 3.70% | |
| 02:00 | CNY | Fixed Asset Investment YTD Y/Y Aug | 3.20% | 3.30% | 3.40% | |
| 02:00 | CNY | Retail Sales Y/Y Aug | 4.60% | 3.00% | 2.50% | |
| 04:30 | JPY | Tertiary Industry Index M/M Jul | 0.90% | 0.20% | -0.40% | -0.70% |
| 08:30 | GBP | Consumer Inflation Expectations | 3.60% | 3.50% | ||
| 09:00 | EUR | Eurozone Trade Balance (EUR) Jul | 2.9B | 13.5B | 12.5B | 8.6B |
| 12:30 | CAD | Manufacturing Sales M/M Jul | 1.60% | 0.70% | -1.70% | |
| 12:30 | USD | Empire State Manufacturing Sep | 1.9 | -10 | -19 | |
| 12:30 | USD | Import Price Index M/M Aug | 0.50% | 0.30% | 0.40% | |
| 13:15 | USD | Industrial Production M/M Aug | 0.20% | 1.00% | ||
| 13:15 | USD | Capacity Utilization Aug | 79.30% | 79.30% | ||
| 14:00 | USD | Michigan Consumer Sentiment Index Sep P | 69.5 | 69.5 |
ECB officials dismiss predictions of early rate cuts
In a chorus of comments, ECB officias pushed back on market expectations on a rate cut next year.
During a press conference today, ECB President Christine Lagarde emphasized, "We have not decided, discussed or even pronounced cuts." She underlined that the institution's strategy will pivot according to incoming economic data and highlighted that the levels and duration of the existing high rates are designed to foster a return to the inflation target of 2%. The focus is on evolving economic indicators, reviewed in a meeting-by-meeting approach, hinting at the bank's readiness to adapt in the face of changing economic contexts.
Supporting Lagarde's stance, ECB Vice President Luis de Guindos conveyed skepticism regarding market pricing that forecast a rate cut in June 2024. Speaking to Spanish radio station Cadena Cope, de Guindos mentioned that the markets often rely on speculative "hypotheses that sometimes do not come true." He viewed such forecasts as gambles, affirming that they might not materialize. "It is a bet, it may be right and it may not be right," De Guindos added, underlining the uncertain nature of market forecasts.
Martins Kazaks, a member of ECB's Governing Council, expressed comfort with the current rate levels, showing optimism regarding achieving the 2% inflation goal by the second half of 2025. He maintained that the bank remains open to the possibility of another rate increase if substantiated by forthcoming data.
Kazaks was assertive in dismissing speculations about a rate cut in April, stating such conjectures are "inconsistent with our macro scenario." He reiterated the bank's firm stance to "stay in restrictive territory for as long as necessary to get inflation to 2%."
USD/JPY: Bulls Look for Retest of 2023 Peak
Bulls regained control and are on track to fully retrace a pullback sparked by comments of BoJ Governor Ueda about possible change in monetary policy.
Positive impact on yen was short-lived as dollar remains well supported despite threats of Japan’s intervention.
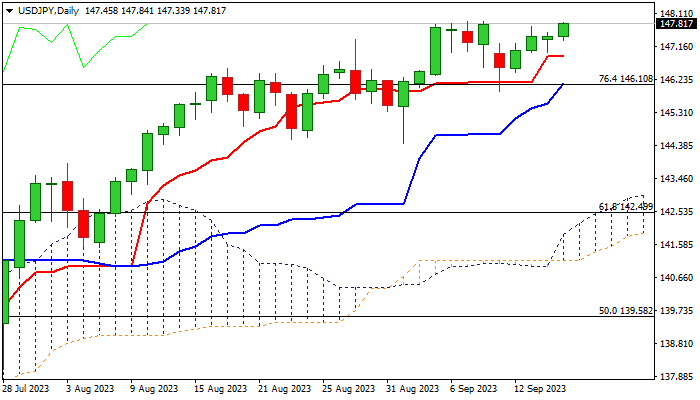
Firmly bullish daily techs underpin the action which looks for the fourth consecutive weekly close above broken Fibo level at 146.10 (76.4% of 151.94/127.22), now acting as solid support and keeping the downside protected.
Break of last Friday’s high at 147.87 (2023 peak) to reinforce bullish structure for possible attack at psychological 150 barrier.
First support at 146.88 (daily Tenkan-sen should ideally contain and guard key 146.10 level (reinforced by daily Kijun-sen), loss of which put larger bulls on hold.
Res: 148.00; 148.59; 148.84; 149.70.
Sup: 147.34; 146.88; 146.43; 146.10.
AUD/USD Extends Gains on Strong Chinese Data
- Chinese industrial production, retail sales accelerate
- AUD/USD posts slight gains
- US to release manufacturing, consumer confidence data on Friday
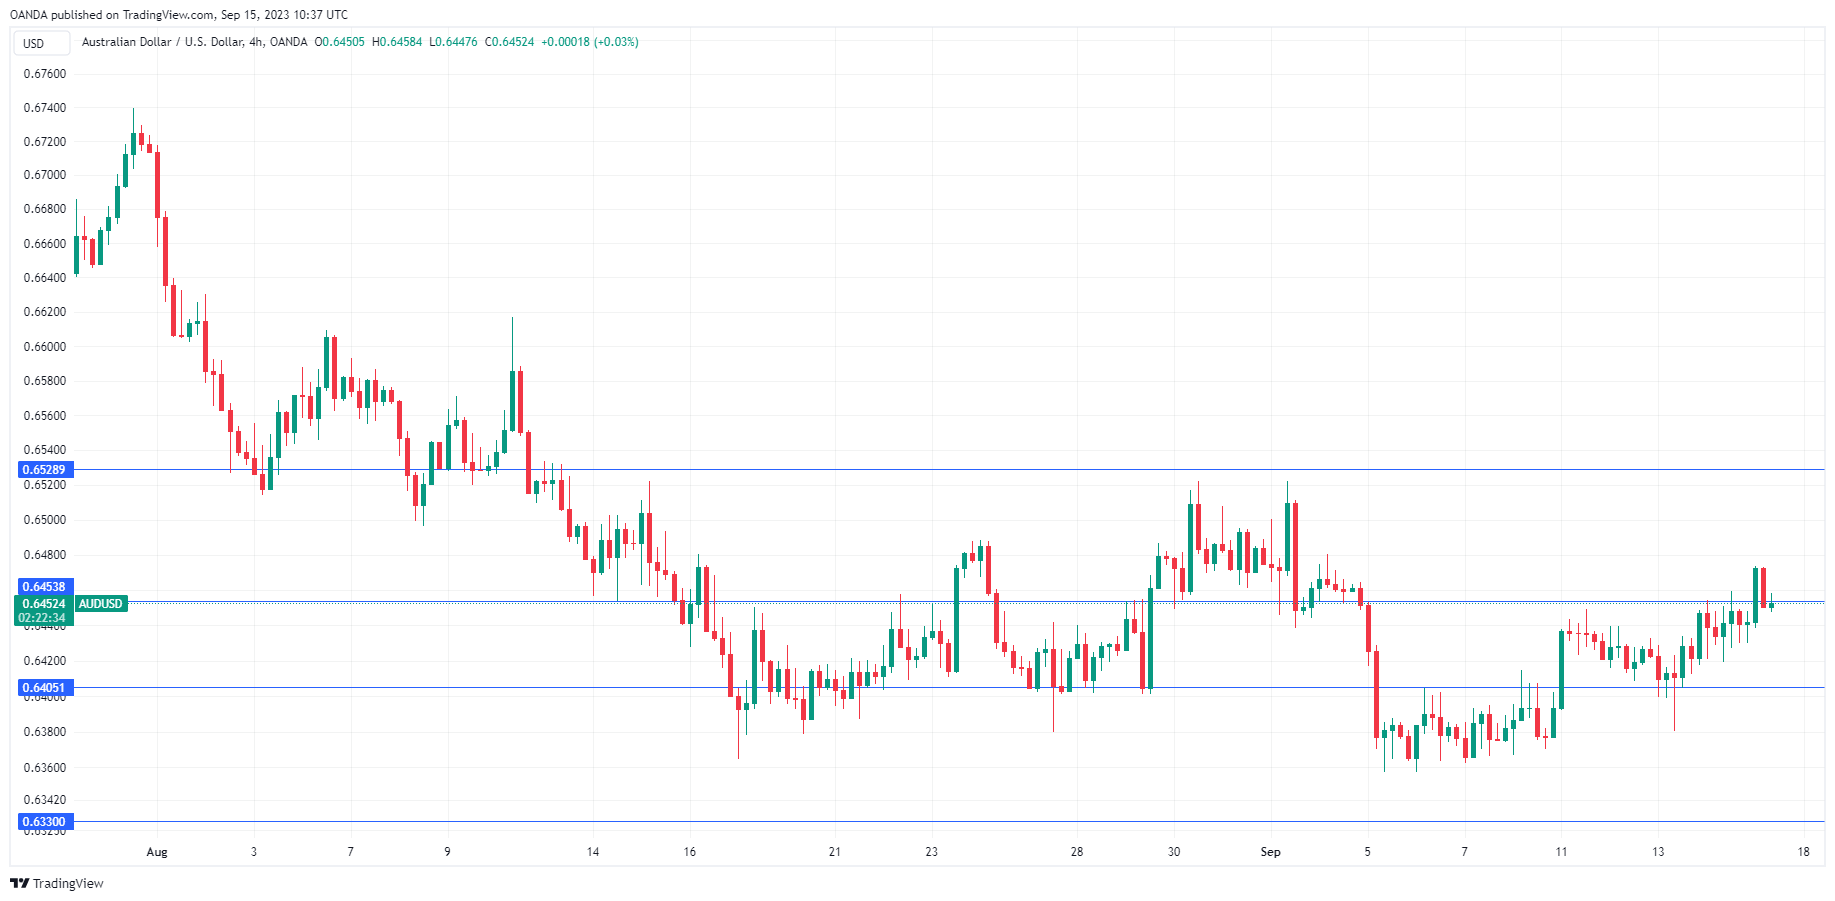
The Australian dollar has edged higher on Friday. In the European session, AUD/USD is trading at 0.6452, up 0.18%. Earlier, AUD/USD touched a high of 0.6473, its highest level since September 4th.
Chinese data beats expectations
China posted better-than-expected numbers on Thursday, raising hopes that the world’s number two economy might be finding its footing. Industrial production climbed 4.5% y/y in August, up from 3.7% in July and beating the consensus estimate of 3.9%. This was the strongest growth since April. There was more positive news as retail sales rose 4.6% y/y in August, up sharply from 2.5% in July and above the market consensus of 3.0%.
The solid data follows recent stimulus measures from the government after a host of economic data pointed to a sharp deterioration in economic growth. The central bank has cut benchmark rates such as the one-year loan prime rate and has reduced the reserve requirement ratio for all banks, which means that banks can keep less cash on hand.
These stimulus measures, while welcome, are unlikely to resolve the property sector crisis. Moody’s lowered its outlook for the property sector from stable to negative, in response to the brewing crisis which has engulfed two of the country’s largest private property developers. The Evergrande Group recently defaulted and Country Garden Holdings is trying to avoid a default.
Economic developments in China tend to have a significant impact on the Australian economy and the Australian dollar, as China is Australia’s largest trading partner. China’s slowdown has weighed heavily on the Aussie’s poor performance, as AUD/USD plunged 3.48% in August. If China’s downturn continues, we can expect the Australian dollar to lose ground.
In the US, there are two key events on the data calendar, which could trigger some volatility from the US dollar in the North American session. The Empire State Manufacturing Index, which plunged to -19 in August, is expected to improve to -10 points. UoM Consumer Sentiment is expected to dip to 69.1, down from 69.5 and inflation expectations are projected to remain unchanged at 3.5%.
AUD/USD Technical
- AUD/USD continues to test resistance at 0.6453. The next resistance line is 0.6528
- 0.6405 and 0.6330 are providing support
Can the Chinese Economy Recover?
Amid concerns of a Chinese economic slowdown, reports of declining investment often overlook China's efficient investment strategy in emerging sectors for long-term growth. China has taken measures to stabilize foreign and private sector investments, like reducing the reserve requirement ratio to boost investor confidence. While China's fixed-asset and private-sector investments have shown some decline, there is robust investment activity in key areas. Foreign investments increasingly focus on high-tech sectors, aligning with China's emphasis on emerging industries. China's investment strategy prioritizes quality and reasonable growth over quantity expansion, with policies supporting this approach.
USDCNH - D1 Timeframe
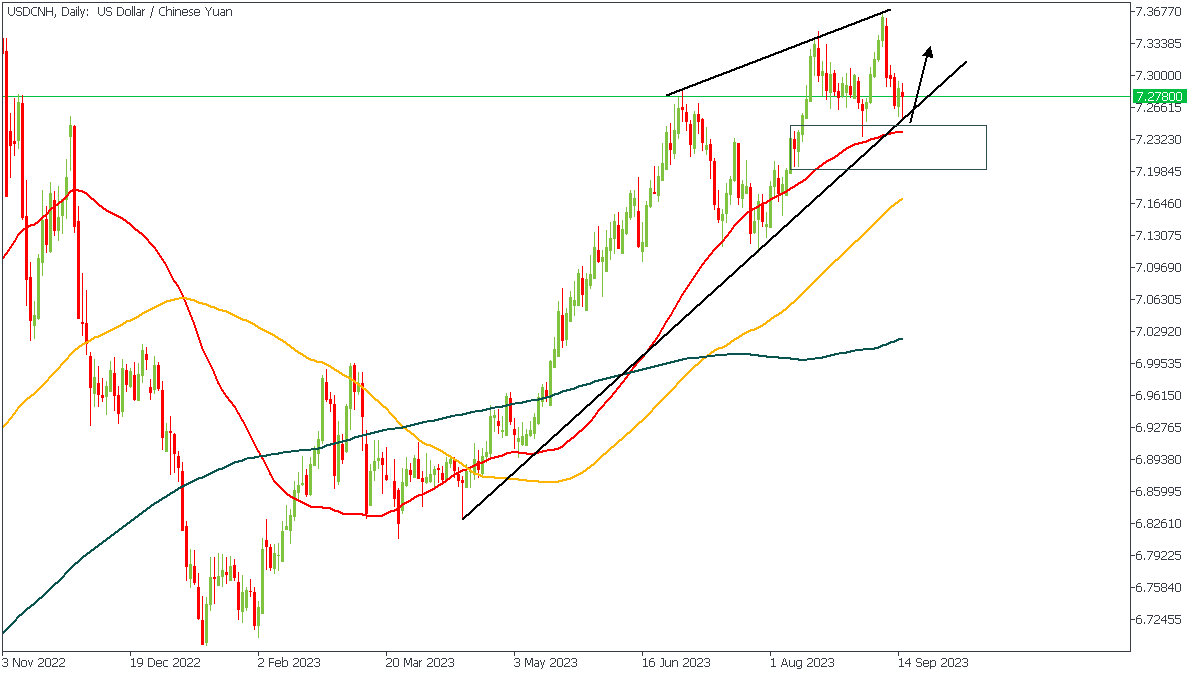
The Daily timeframe of USDCNH, as seen in the chart, shows that the price has reacted initially from the support trendline of the wedge pattern and may very well be continuing its bullish rally from here. Considering the presence of the 50-day moving average as an additional support, the rally-base-rally demand zone, and the bullish array of the moving averages, I am quite optimistic about a bullish sentiment.
Analyst’s Expectations:
- Direction: Bullish
- Target: 7.33086
- Invalidation: 7.21807
HK50 - D1 Timeframe
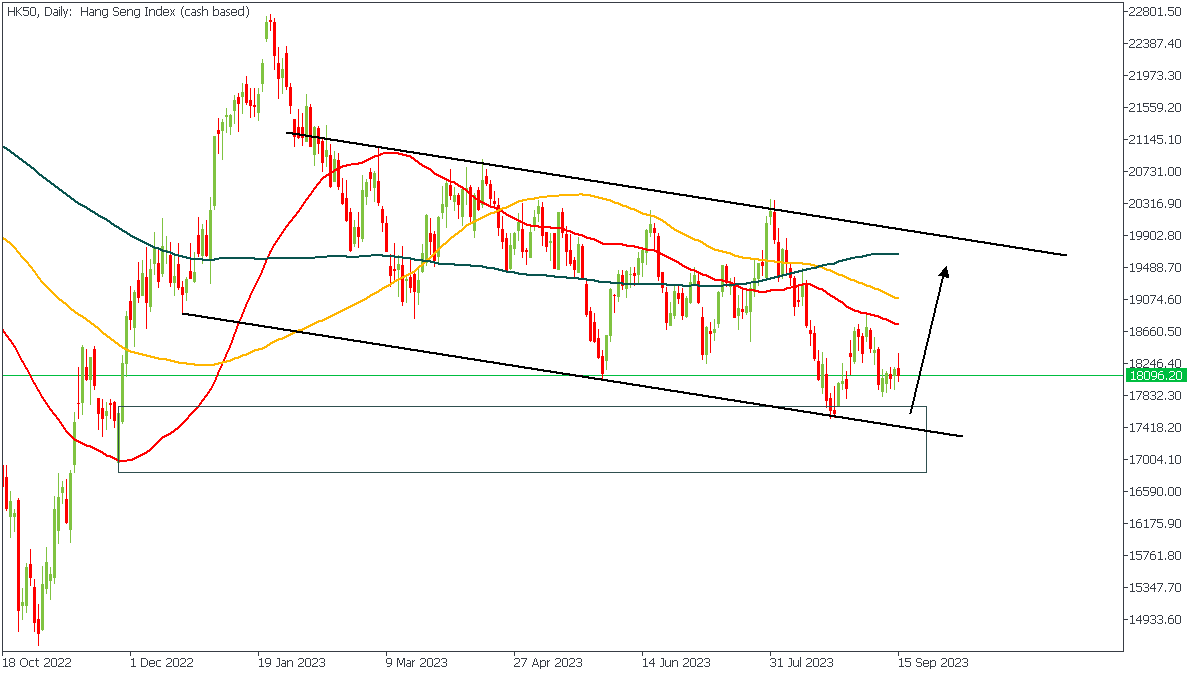
HK50 as seen in the chart image seems to be trading inside a descending channel, with the most recent move being a touch of the trendline support. The trendline also overlaps with a drop-base-rally demand zone, which serves as a further confluence for bullish sentiment.
Analyst’s Expectations:
- Direction: Bullish
- Target: 18595.26
- Invalidation: 17494.04
CONCLUSION
The trading of CFDs comes at a risk. Thus, to succeed, you have to manage risks properly. To avoid costly mistakes while you look to trade these opportunities, be sure to do your due diligence and manage your risk appropriately.
Yuan Retreats from Multi-year Highs on Strong Economic Data
The US dollar index hit its highest level since early March this week, but the yuan is one of the few currencies to rise against the USD over the period.
This was facilitated, among other things, by strong economic data published today:
→ Industrial production growth in August amounted to +4.5% in annual terms (expected +3.9). This is the strongest progress in 1 month since autumn 2022.
→ Retail sales in August increased by 4.6% year on year (expected +3.0%).
The chart shows that after a multi-year high (B) of about USD 7.36 per yuan set on September 8, the rate has retreated sharply. That is, sales of dollars (B→C) for yuan increased. And the sharp increase in A→B is completely leveled out. This is a bearish sign, indicating that the bulls have completely retreated.
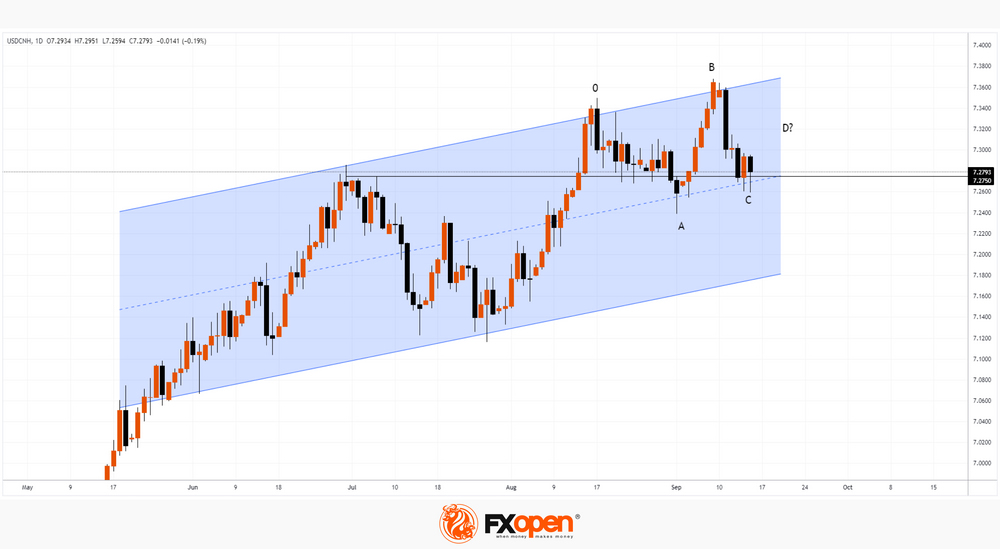
Now the price is near the median line of the channel. Here one can expect support, which is also strengthened by the level of 7.275, which previously served as resistance.
Let’s say that if a rebound C→D occurs (its probability is indicated by the long lower shadows on the candles on September 14-15), then by its dynamics it will be possible to judge the sustainability of the initiative that the bears have taken. If the rebound is 50% of the momentum (B→C), this will confirm the change in sentiment to bearish, and then we can expect that sellers will be able to put pressure on the rate so that it will decline to the lower border of the channel.
And then the picture will be even more bearish, because a head-and-shoulders pattern will form on the chart along the 0-B-D vertices. Provided the positive news background regarding the Chinese economy continues, we will be able to witness the formation of a stable bearish trend in favor of the yuan.
UK public anticipates elevated inflation and ascending interest rates, BoE survey reveals
Bank of England/Ipsos Inflation Attitudes Survey for August has shed light on how the public perceives inflation trends and the likely moves by the central bank.
Interestingly, public's perception of current inflation rate seems to have moderated, with a median estimate of 8.6%. This is a full percentage point decline from 9.6% recorded in May. This suggests that the public may feel the worst of inflationary surge has passed.
However, expectations for inflation over the short to medium term are slightly more elevated. The median expectation for inflation over the next year stood at 3.6%, a modest uptick from 3.5% three months ago. Looking a bit further out, the 12-month period after next, expectations rose to 2.8% from 2.6% in the prior survey.
Regarding BoE's policy path, a significant 63% anticipate interest rate hike over the next year, marking an increase from 57% in May. Meanwhile, those expecting rates to remain stable accounted for 19%, a slight decrease from prior reading of 20%.
Full Bank of England/Ipsos Inflation Attitudes Survey release here.
Eurozone goods expects down -2.7 yoy, imports fell -18.2% yoy
Eurozone exports of goods to the rest of the world dropped -2.7% yoy to EUR 227.8B in Jul. Imports fell -18.2% yoy to EUR 221.3B. Eurozone recorded EUR 6.5B trade surplus. Intra-Eurozone trade fell -7.9% yoy to EUR 211.8B.
In seasonally adjusted term, exports fell -1.7% mom to EUR 232.6B. Imports rose 0.7% mom to EUR 229.7B. Trade surplus narrowed from EUR 8.6B to EUR 2.9B, smaller than expectation of EUR 13.5B. Intra-Eurozone trade fell slightly from EUR 219.3B to EUR 218.7B.
Resilient Chinese Yuan Supporting Hong Kong Equities and Antipodean Currencies
- Yesterday’s significant US dollar up moves against the EUR, GBP, and CHF have not spread to the Chinese yuan and antipodean currencies.
- The choice of China’s central bank, PBoC latest monetary policy easing measure via a cut on the required reserves ratio and upbeat retail sales and industrial production have led to a short-term “K-shaped performance” seen in the FX market.
- Short-term bullish momentum elements are sighted in AUD/USD and NZD/USD supported by a weakening USD/CNH.
Despite the European Central Bank (ECB) hike of 25 basis points to bring its policy deposit rate to 4%, market participants have viewed that as a dovish hike that triggered a significant rally in the US dollar against the Euro that has also spilled over to other European currencies such as the UK pound and the Swiss franc.
The EUR/USD tumbled by 85 pips to close yesterday, 14 September US session at 1.0644 and breached below the recent closing level’s swing lows of 31 May and 6 June reinforced by the latest ECB’s economic forecast on the Eurozone which has painted a stagflation condition; 2024’s inflation projection is upgraded to 3.2% while GDP growth is being trimmed downwards to 1% for 2024.
Not all currencies are sucked into a USD’s bullish vacuum
Interestingly, the antipodean currencies (AUD and NZD), CAD, and JPY did not manage to get ramped down by the US dollar’s bulls inflicted on the European currencies. It is likely the resilient Chinese yuan is playing either a direct or indirect role in the short-term “K-shaped” performance seen in the FX market (see chart of figure 1).
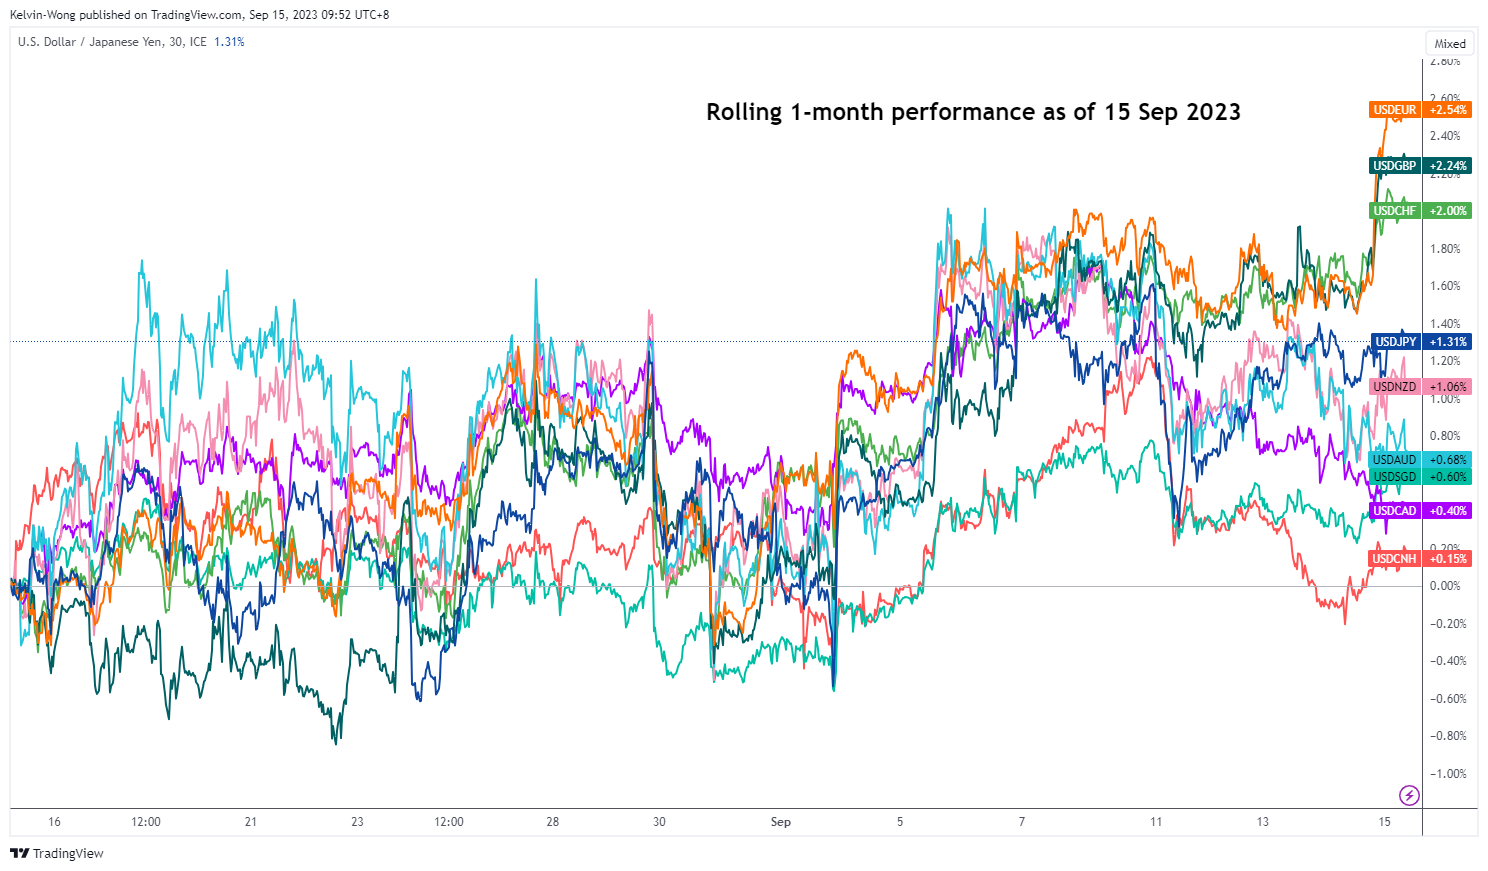
Fig 1: Rolling 1-month performance of the US dollar against the major currencies, AUD, NZD, CNH & SGD as of 15 Sep 2023 (Source: TradingView, click to enlarge chart)
China’s central bank PBoC’s latest monetary policy stimulus manoeuvre does not involve a direct cut on the 1-year medium-term lending facility rate, a key policy interest rate but rather a reduction on China’s commercial banks’ reserve requirement ratio by 25 basis points, a second reduction on the ratio so far this year.
USD/CNH major uptrend’s momentum has started to ease
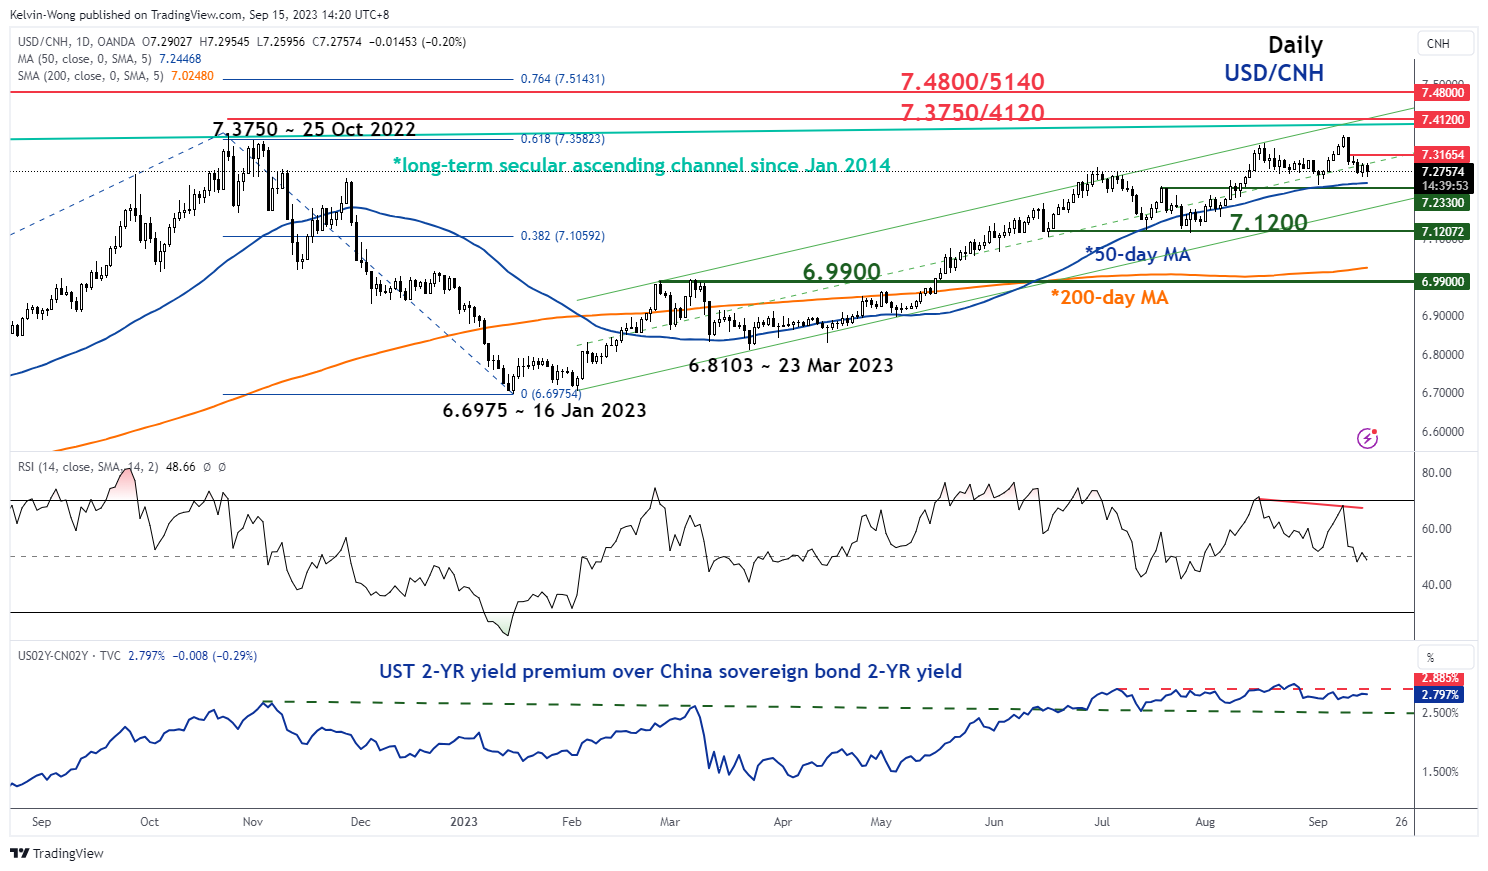
Fig 2: USD/CNH major & medium-term trends as of 15 Sep 2023 (Source: TradingView, click to enlarge chart)
Thus, by leaving interest rates unchanged in China, the upward pressure on the shorter-term US Treasuries yield premium over China’s sovereign notes is likely to be negated which in turn may choke off potential near-term US dollar strength against the offshore yuan that lead to a bullish tapering of the current major uptrend phase of the USD/CNH in place since 16 January 2023 low to allow the pair to consolidate between 7.3165 and 7.2330 (also the 50-day moving average) in the short-term.
Also, fundamental factors are also supporting today’s minor yuan strength against the US dollar. China’s retail sales for August have come in at 4.6% y/y, above the consensus of 3%, and surpassed July’s 2.5% y/y, its strongest pace of growth since May.
August’s industrial production in China also managed to beat expectations of 3.9% with a growth of 4.5% y/y, its highest reading since April.
All in All, this latest set of key economic data suggests that the risk of a deflationary spiral in China has abated by another notch.
How does it impact the Aussie and the Kiwi?
From a momentum and technical analysis standpoint, the AUD and NZD have a rather high direct correlation with the CNH (offshore yuan), and from a fundamental aspect, Australia’s commodities producers/trading firms are dependent either directly or indirectly on the fortunes of China’s economy.
Hence, a slowdown in the bullish trend of the USD/CNH is likely to lead to some form of bullish momentum to ignite the AUD/USD and NZD/USD. Let’s look at their respective short-term technical charts.
AUD/USD is forming a potential minor bullish double-bottom base
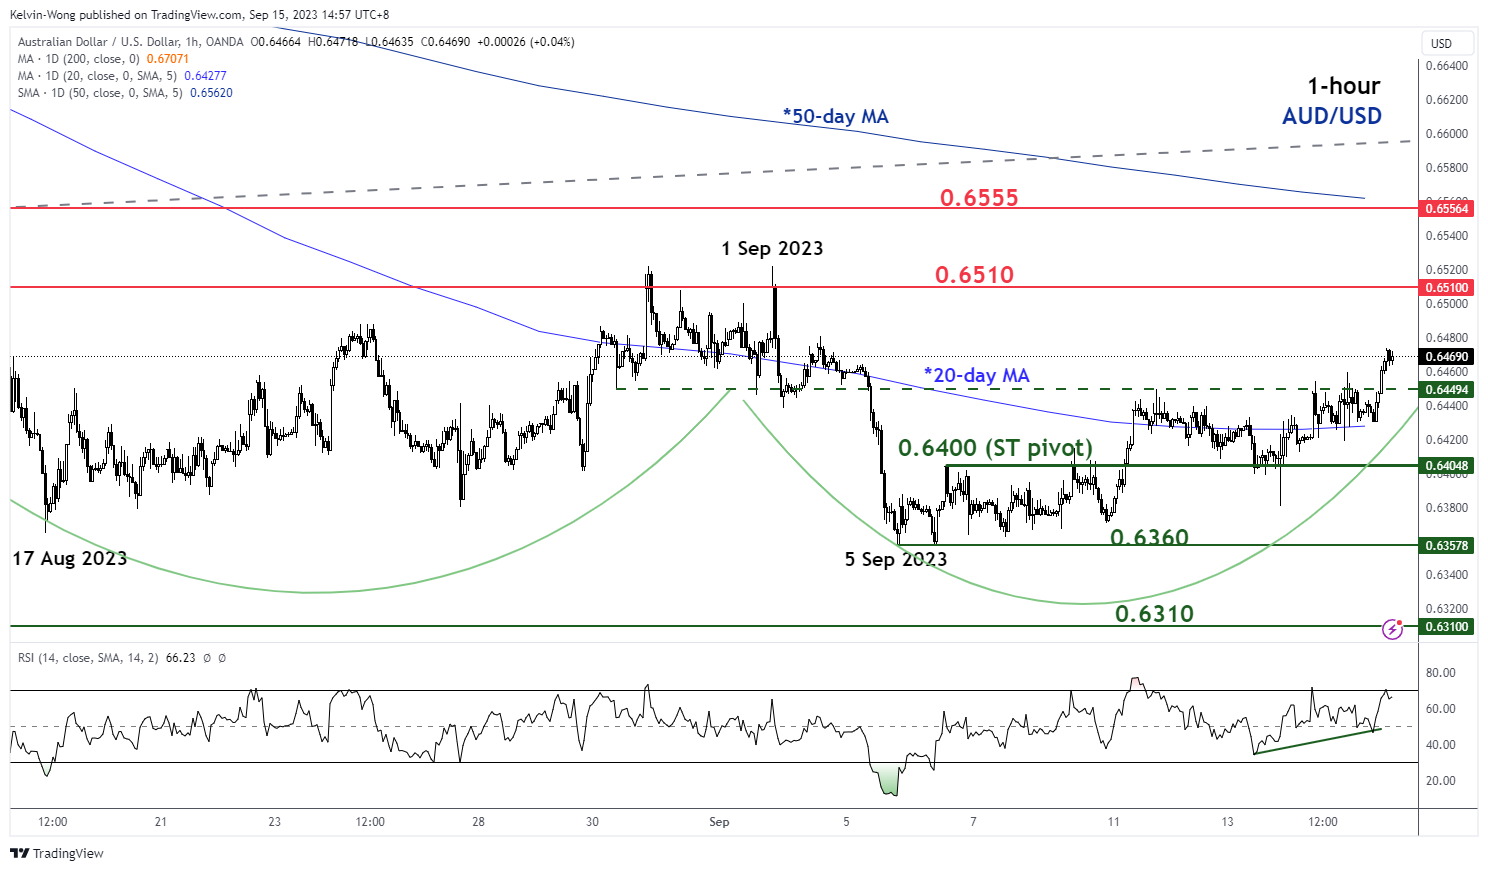
Fig 3: AUD/USD minor short-term trend as of 15 Sep 2023 (Source: TradingView, click to enlarge chart)
As seen on the 1-hour chart, the price actions of the AUD/USD have failed to have a clean break below the 17 August 2023 low of 0.6365 in the past two weeks since the start of September.
Today’s price action has tested and rebounded significantly from the 20-day moving average which suggests an emergence of bullish momentum at least in the short term. If the 0.6400 key short-term pivotal support is not broken down, the AUD/USD may see a further potential push-up towards the intermediate resistance at 0.6510 (the neckline of the minor double bottom base). Above 0.6510 sees the next resistance at 0.6555 (the 50-day moving average).
On the flip side, failure to hold at 0.6400 negates the bullish tone for a slide back toward the minor base support at 0.6360.
NZD/USD’s recent minor drop is supported by an ascending trendline
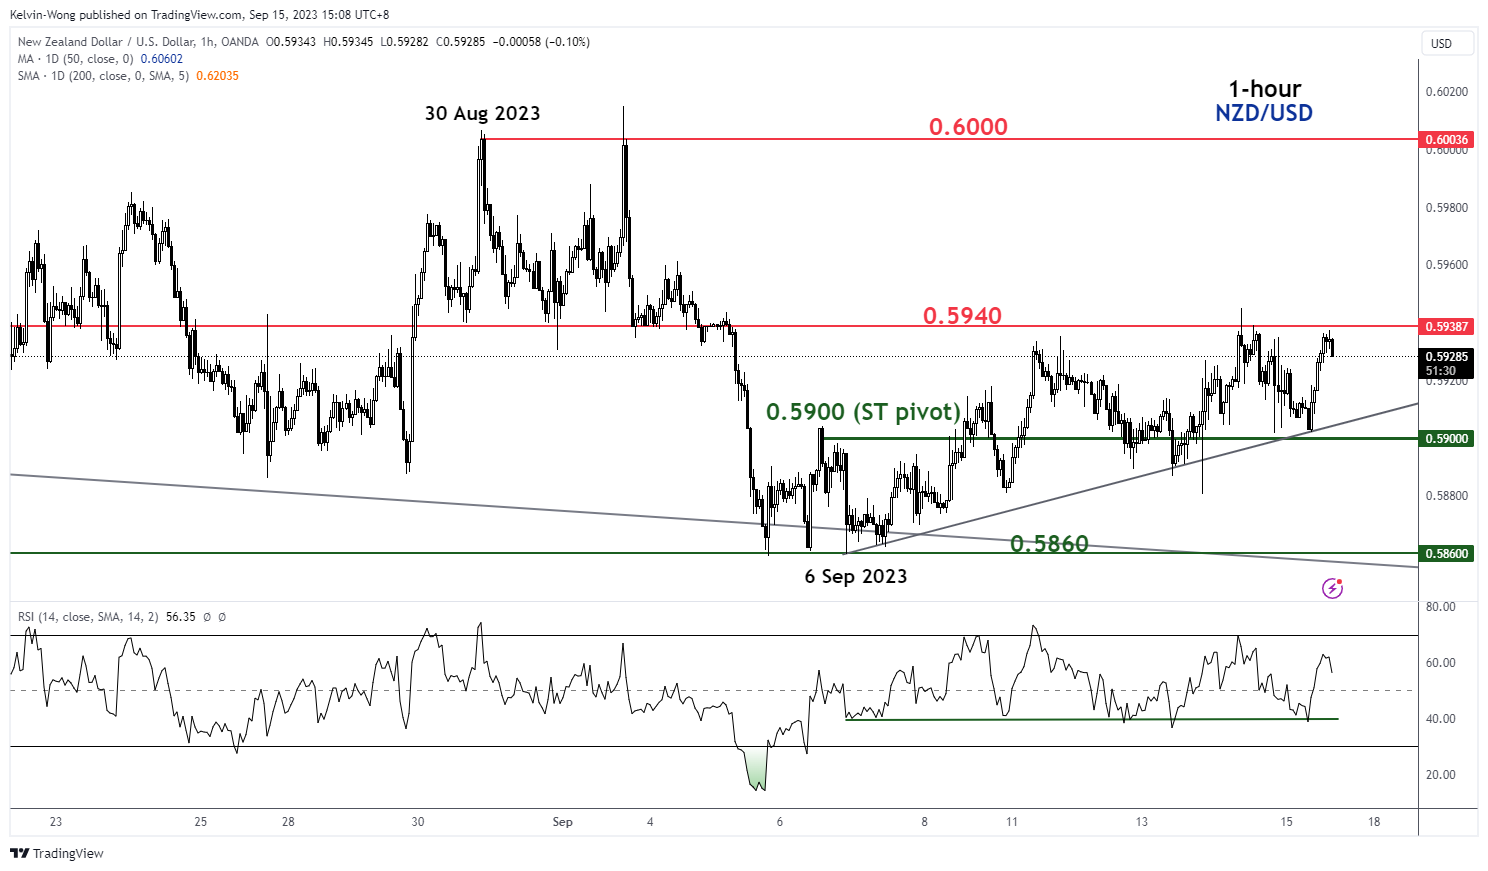
Fig 4: NZD/USD minor short-term trend as of 15 Sep 2023 (Source: TradingView, click to enlarge chart)
The technical elements seen in the NZD/USD are not as bullish as the AUD/USD but since its 6 September 2023 low, the price actions have traced out a series of “higher lows” and an ascending trendline is now acting as a support at around 0.5900.
Watch the 0.5900 key short-term pivotal support and a clearance above 0.5940 intermediate resistance may trigger a more pronounced bullish momentum towards the next resistance at 0.6000.
However, a break below 0.5900 may see another round of choppy movement to retest the 6 September 2023 swing low of 0.5860.
Benchmark Hong Kong stock indices are looking to end on positive weekly closing levels
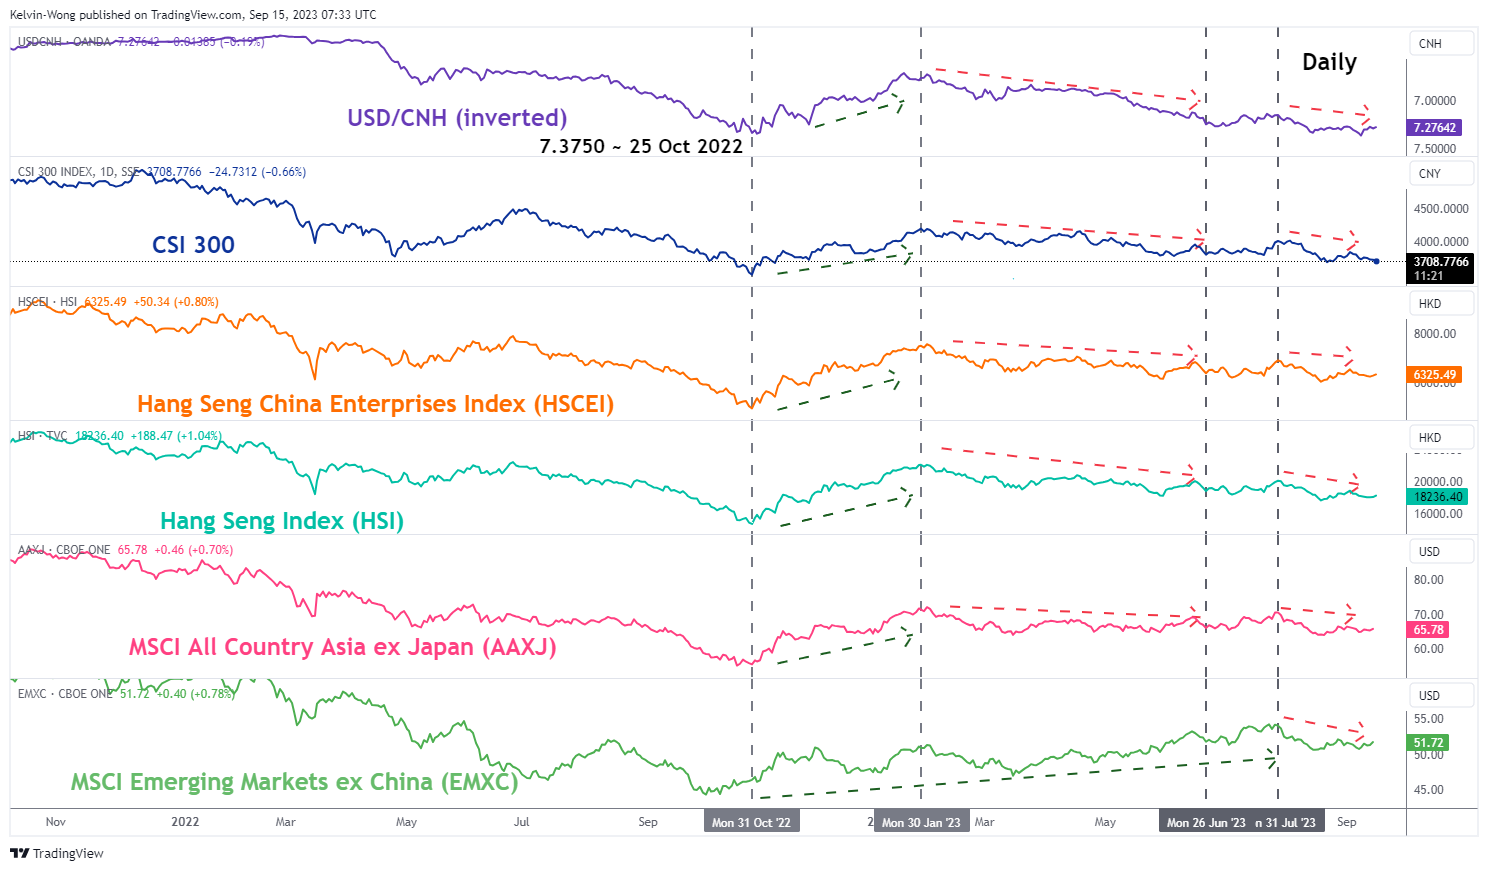
Fig 5: USD/CNH’s correlation with Hang Seng indices as of 15 Sep 2023 (Source: TradingView, click to enlarge chart)
Since late October 2022, the Heng Seng Index (HSI) and the Hang Seng China Enterprise Index (HSCEI) have moved in lockstep with the USD/CNH (offshore yuan) where a significant yuan weakness against the USD tends to see a similar bearish sentiment towards HSI and HSCEI.
Since the bullish momentum of USD/CNH has started to abate which in turn has led the HSI and HSCEI to erase their earlier losses at the start of this week and recorded intra-session weekly gains of +0.20% for both indices at this time of the writing.
USDCAD Extends Pull Back from 5-month Peak
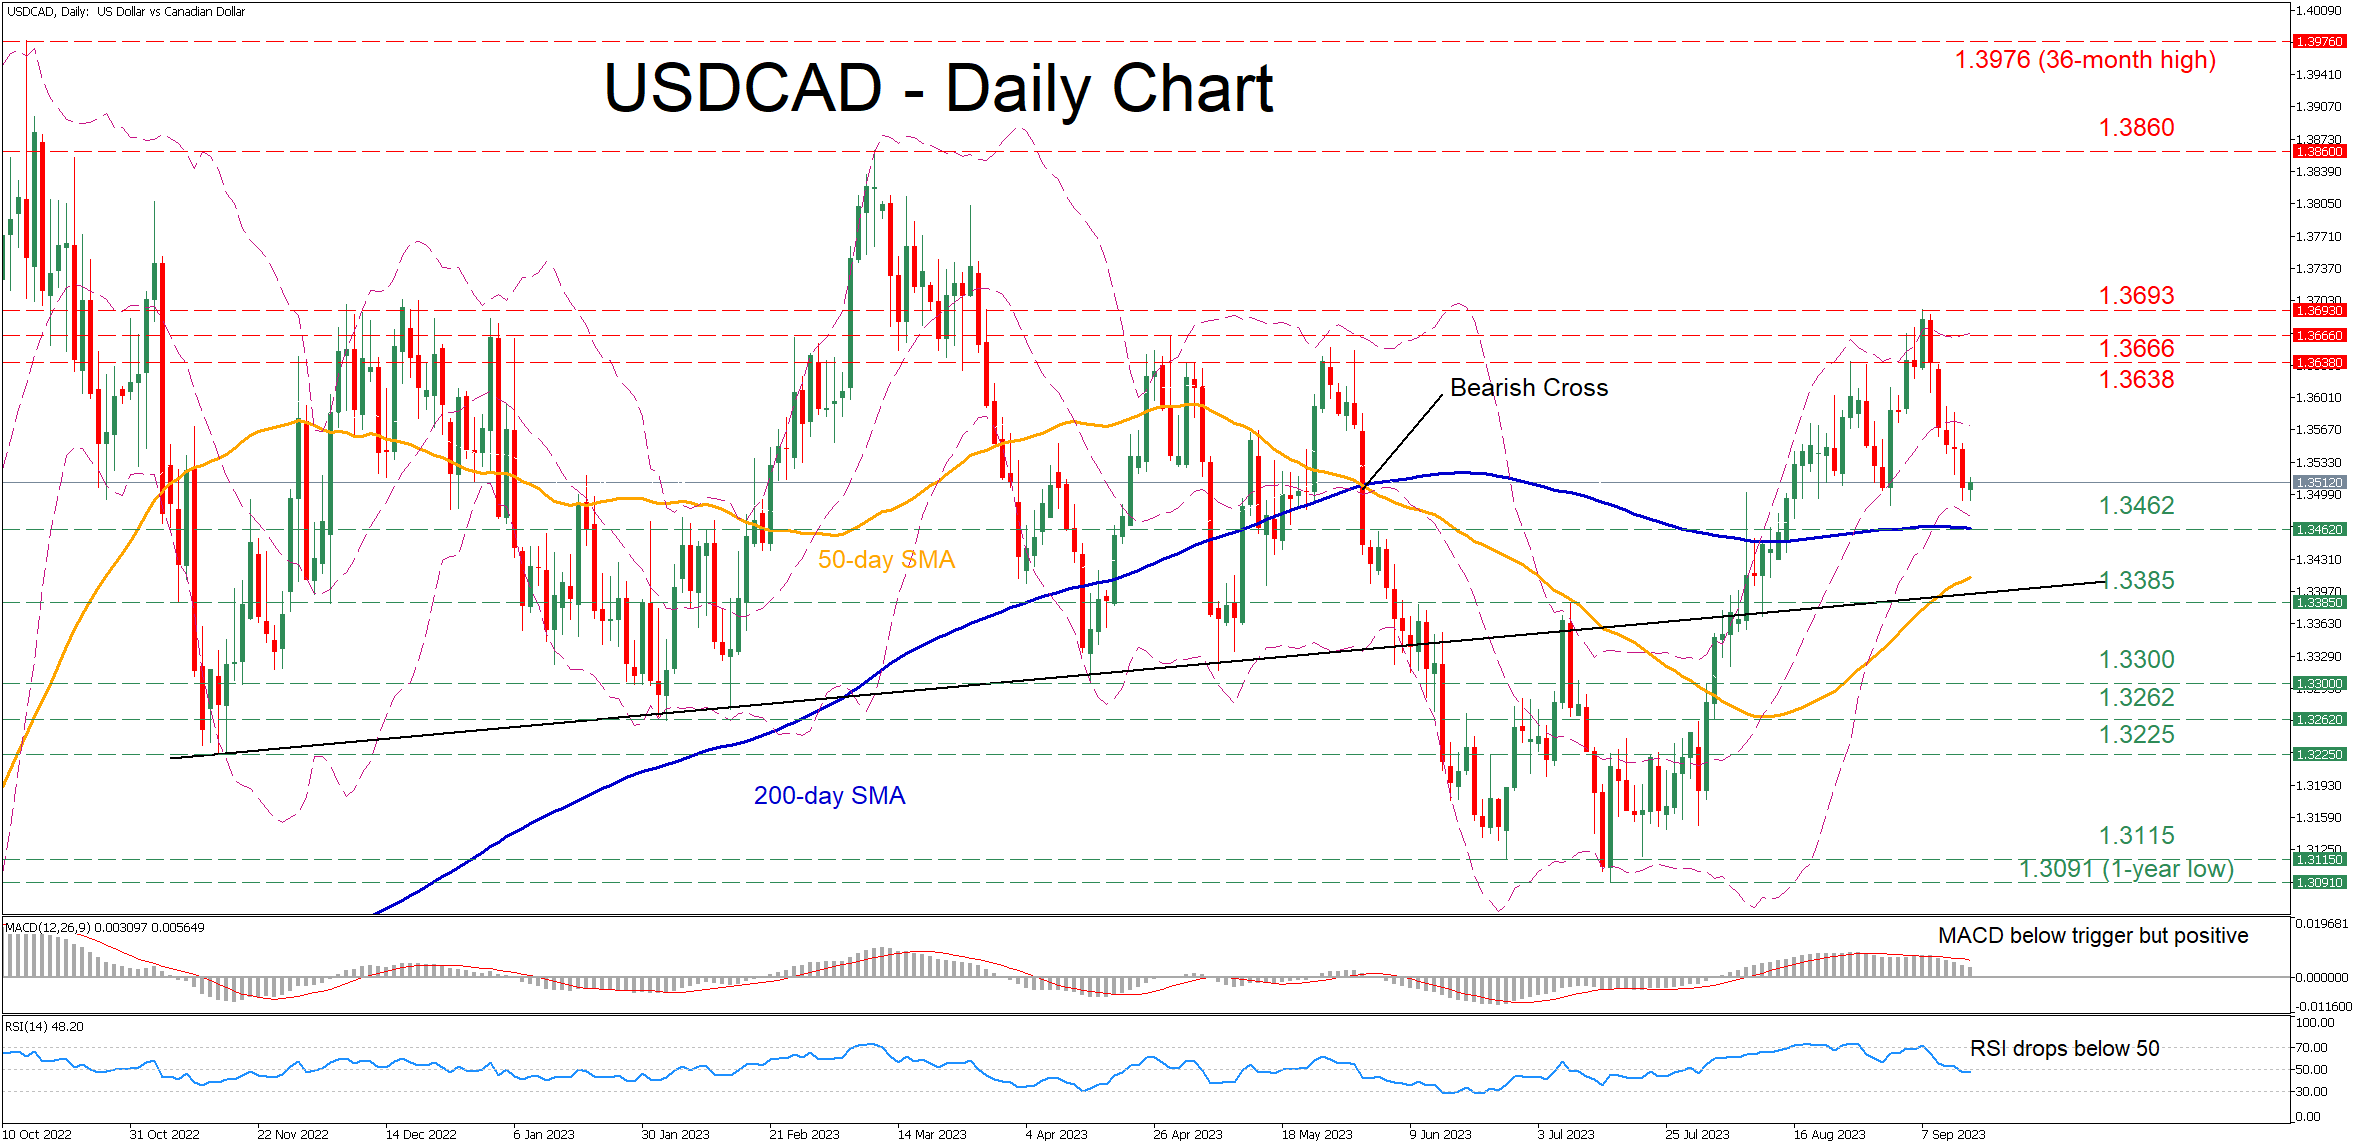
- USDCAD in an aggressive decline from its 5-month high of 1.3693
- Bears eye the crucial 200-day SMA
- Momentum indicators suggest more pain in the short term
USDCAD had staged a massive rebound after finding its feet at the one-year low of 1.3091 in mid-July. However, the pair has been undergoing a downside correction since its rejection at a fresh five-month peak of 1.3693 last week, with short-term oscillators suggesting that sellers have gained total control.
If the price extends its retreat, immediate support could be found at the 200-day simple moving average (SMA), currently at 1.3462. Sliding beneath that floor, the pair could retreat towards the May resistance of 1.3385, which might now serve as support. A violation of that territory could open the door for the April bottom of 1.3300.
Alternatively, bullish actions could propel the price higher towards the August resistance of 1.3638. Surpassing that hurdle, the pair may face the April high of 1.3666. Further advances could then cease at the recent five-month peak of 1.3693.
In brief, USDCAD has been losing ground since its latest advance encountered strong resistance at a fresh five-month high. Nevertheless, it's too early to call for a sustained downtrend, unless the price profoundly breaks below the 200-day SMA.