

Sample Category Title
AUD/USD Daily Report
Daily Pivots: (S1) 0.6419; (P) 0.6439; (R1) 0.6462; More...
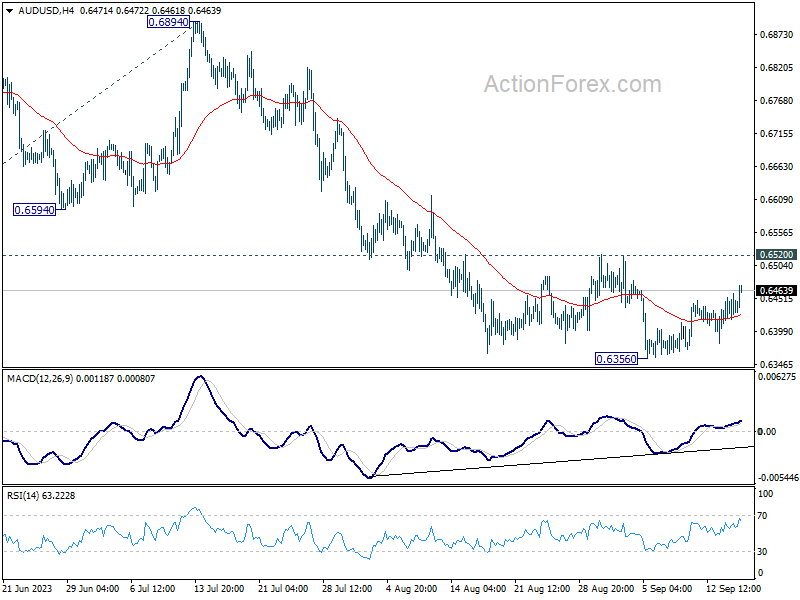
AUD/USD's rebound from 0.6356 extends higher today but upside is capped below 0.6520 resistance. Intraday bias stays neutral and further decline is still expected. On the downside, break of 0.6356 will resume larger fall to 100% projection of 0.7156 to 0.6457 from 0.6894 at 0.6195.
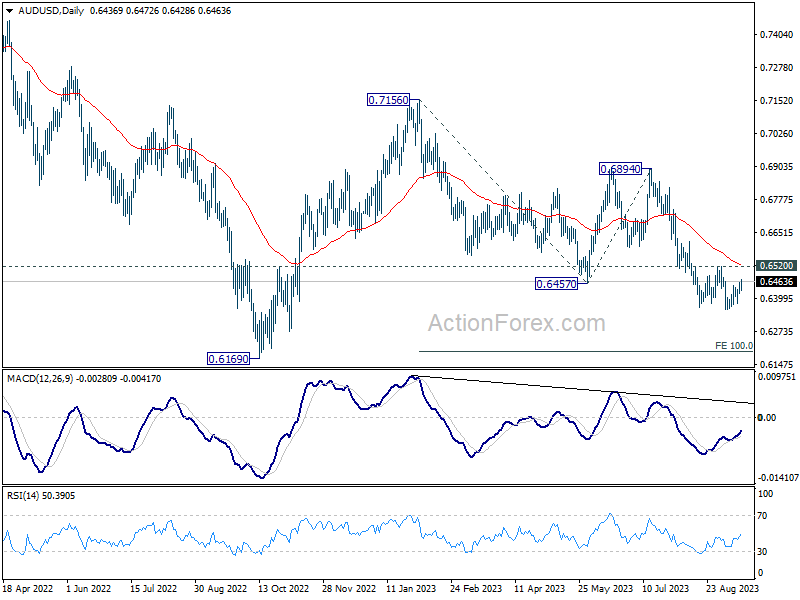
In the bigger picture, current development argues that the down trend from 0.8006 (2021 high) is still in progress. Decisive break of 0.6169 will target 61.8% projection of 0.8006 to 0.6169 to 0.7156 at 0.6021. This will now remain the favored case as long as 0.6894, in case of strong rebound.
USD/JPY Daily Outlook
Daily Pivots: (S1) 147.14; (P) 147.35; (R1) 147.69; More...
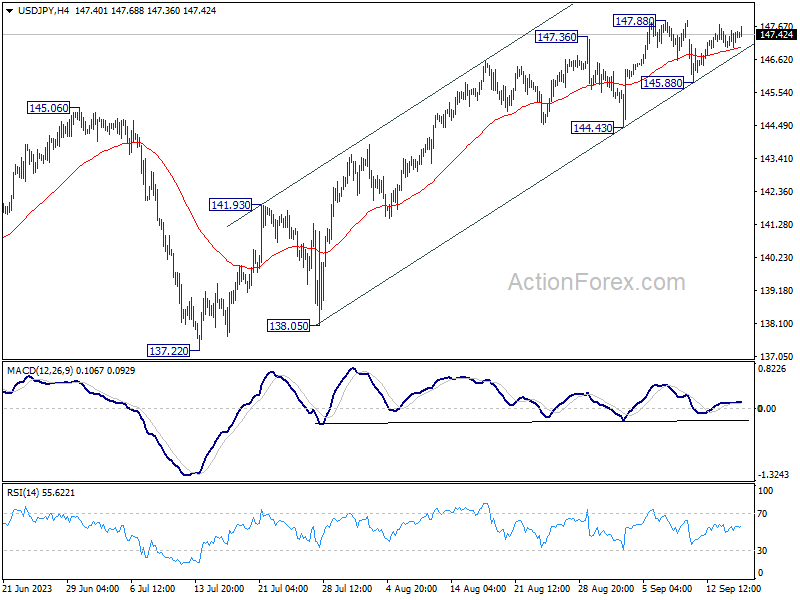
Range trading continues in USD/JPY below 147.88 and intraday bias remains neutral. In case of another pull back, near term outlook will remain bullish as long as 144.43 support holds. On the upside, firm break of 147.88 will resume larger rise from 127.20, to retest 151.93 high.
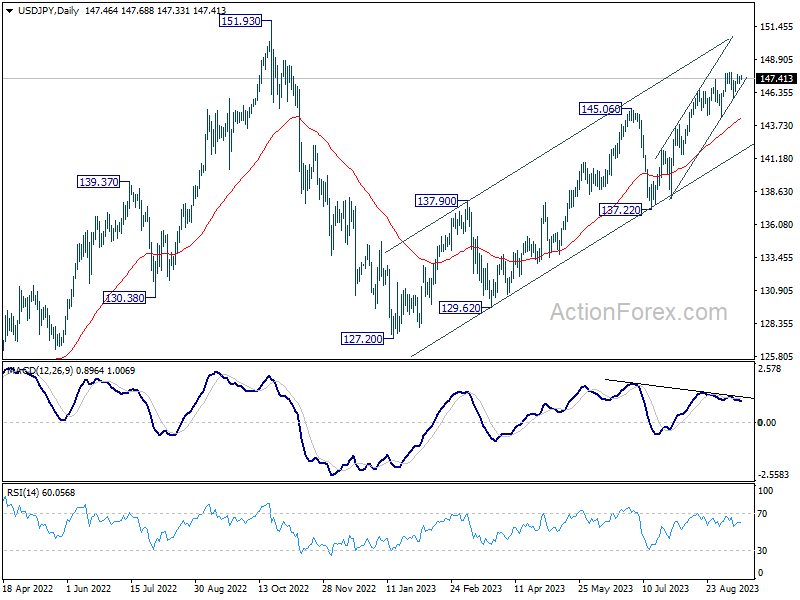
In the bigger picture, while rise from 127.20 is strong, it could still be seen as the second leg of the corrective pattern from 151.93 (2022 high). Rejection by 151.93, followed by break of 137.22 support will indicate that the third leg of the pattern has started. However, sustained break of 151.93 will confirm resumption of long term up trend.
USD/CHF Daily Outlook
Daily Pivots: (S1) 0.8924; (P) 0.8948; (R1) 0.8980; More....
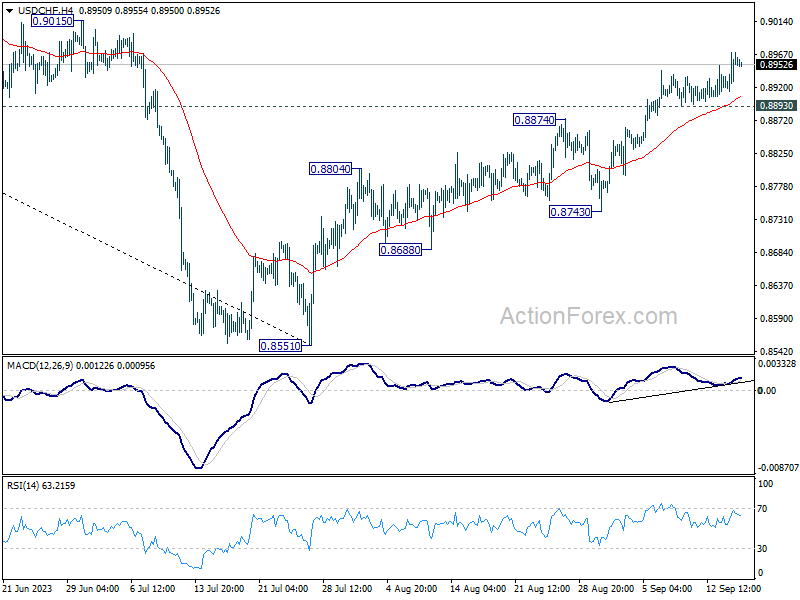
Intraday bias in USD/CHF stays on the upside as rise from 0.8551 is in progress. Further rally would be seen to 0.9146 cluster resistance. On the downside, though, break of 0.8893 support will indicate short term topping, and turn bias to the downside for deeper pullback.
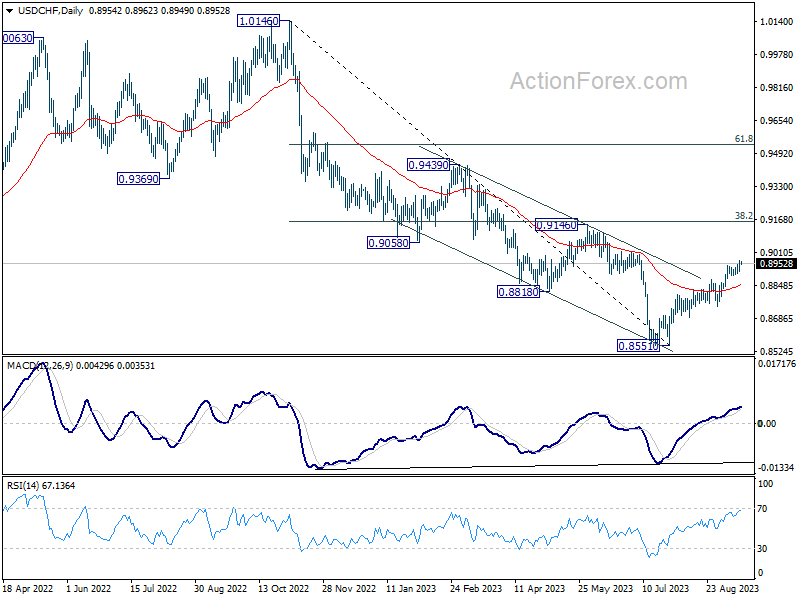
In the bigger picture, rebound from 0.8551 medium term bottom is currently seen as a correction to the downtrend from 1.0146 (2022 high). Further rally would be seen to 0.9146 cluster resistance (38.2% retracement of 1.0146 to 0.8551 at 0.9160). Strong resistance could be seen there to limit upside, at least on first attempt.
GBP/USD Daily Outlook
Daily Pivots: (S1) 1.2369; (P) 1.2438; (R1) 1.2478; More...
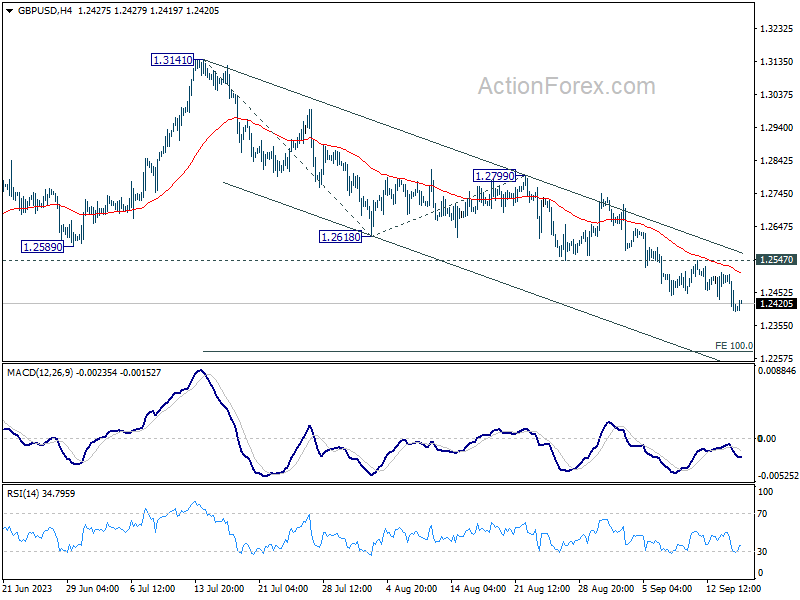
GBP/USD's fall from 1.3141 is in progress and intraday bias stays on the downside. Next target is 100% projection of 1.3141 to 1.2618 from 1.2799 at 1.2276. On the upside, however, firm break of 1.2547 resistance will now indicate short term bottoming, and bring stronger rebound.
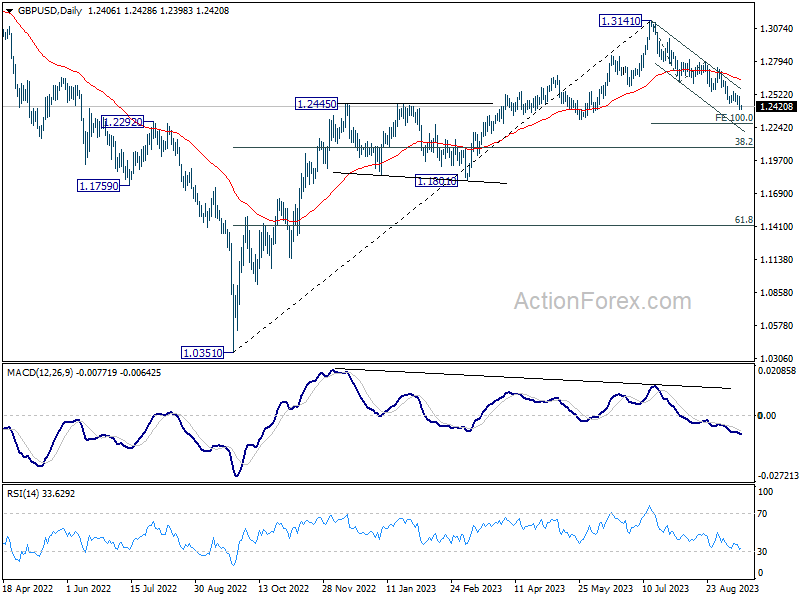
In the bigger picture, fall from 1.3141 medium term top is seen as a correction to up trend from 1.0351 (2022 low). Deeper decline would be seen to 38.2% retracement of 1.0351 to 1.3141 at 1.2075. Strong support would be seen there to bring rebound on first attempt. But outlook will be neutral at best as long as 1.3141 resistance holds, and consolidation from there is set to extend, until further development.
Euro Tanks After 25bp Hike, Lagarde Goes Unheard
Investors didn’t buy the rumour of a European Central Bank (ECB) rate hike but heavily sold the ECB’s intention to stop hiking the rates in the close future. The ECB raised the rates by 25bp yesterday and said that it ‘now considers that the key ECB rates reached levels that, maintained for sufficiently long duration, will make a substantial contribution to the timely return of inflation to the target’. And that was it for the euro bears. ECB Chief Christine Lagarde tried to convince investors that the ECB rates are not necessarily at their peak and that the future decisions will depend on the incoming data. But in vain. The EURUSD sank below 1.07 after the decision and the EZ yields melted as many were rubbing their eyes to understand why a 25bp hike didn’t even spark a minor rebound given that the decision was not warranted, on the contrary, the expectations were mixed into the meeting!
In fact, many euro bears also jumped on a trade yesterday as Lagarde announced that the ECB significantly pulled its economic projections to the downside. BUT, in the meantime, the ECB revised its inflation expectations higher as well. Therefore, it’s naïve to think that the ECB can’t continue hiking rates with such a sour economic outlook. They can. They can, because they have a single mandate – price stability. As such, the market certainly remains too enthusiastically, and unrealistically dovish about the ECB. When I hear ‘data dependency’, I immediately look at energy prices and you know what I see there: further inflation pressures and a real possibility for further rate hikes.
Oil extends gains
The barrel of US crude traded past $91 yesterday, and Brent is getting ready to test the $95pb level. The better-than-expected industrial production, retail sales data from China this morning and news that the People’s Bank of China (PBoC) cut the required reserves for banks for the second time this year to boost market liquidity are giving a further support to the oil bulls looking for reasons to ignore the overbought market conditions.
But the rising oil prices are not benign, and the hawkish ECB is not necessarily positive for the euro, and here is why: the data released in the US yesterday showed that both retail sales and PPI got a decent boost because of higher gasoline prices in August. But it also showed that spending more on gasoline didn’t get Americans to spend less elsewhere. And that’s inflationary. Consequently, the latest developments will, at some point, awaken the Federal Reserve (Fed) hawks, and increase the risk of a further selloff for the EURUSD. There is no chance that Jerome Powell will announce the end of the rate hikes next week. He will only say that the trajectory of core inflation is soothing, but rising energy prices is a risk that they must manage. The dollar index could soon take out a major Fibonacci resistance, the 38.2% retracement on last year’s meltdown (near 105.40), and step into the medium-term bullish consolidation zone. Hence the EURUSD could well be forced below a critical Fibonacci retracement, its own 38.2% level, near 1.0615.
PS: US government drama and shutdown risk could eventually soften US outlook and temporarily prevent the Fed hawks from forcefully coming back.
ARM gains 25%
In the equity markets, ARM went public yesterday, and nailed its first day on Nasdaq. The share price rose 25% and closed above $63. It wasn’t as impressive as Rivian, for example which had jumped more than 50% during its first hours of trading, But hopefully, ARM will have a more stable cruise. Arm currently estimates that ‘70% of the world’s population uses Arm-based products’, in their PCs, cars, smartphones and so. And growth is the only possible direction for the chip designer with AI’s sudden arrival to our lives.
EUR/USD Daily Outlook
Daily Pivots: (S1) 1.0600; (P) 1.0676; (R1) 1.0720; More...
Intraday bias in EUR/USD remains on the downside for the moment, as EUR/USD is pressing 1.0609/34 cluster support zone. Strong rebound from current level, followed by break of 1.0767 resistance, should confirm short term bottoming. Intraday bias will be back on the upside for 1.0944 resistance. However, sustained break of 1.0609/34 will carry larger bearish implication, and target 1.0515 support next.
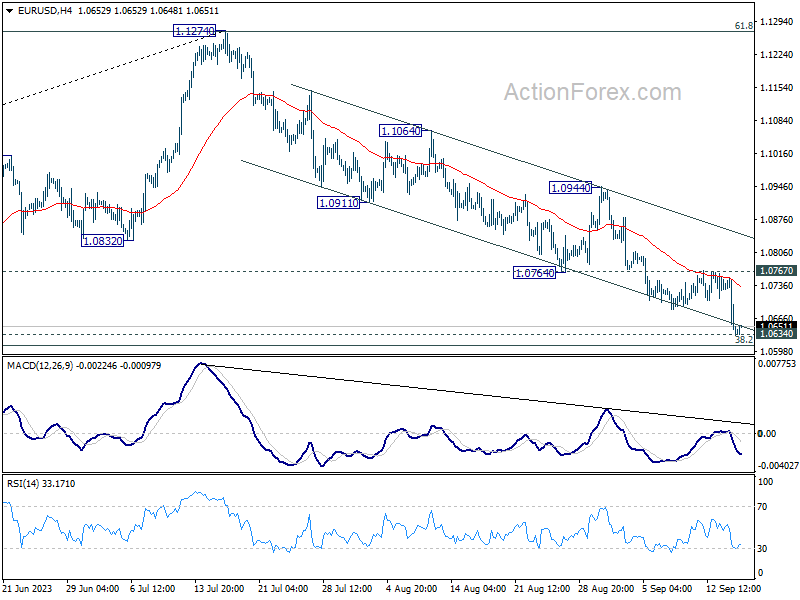
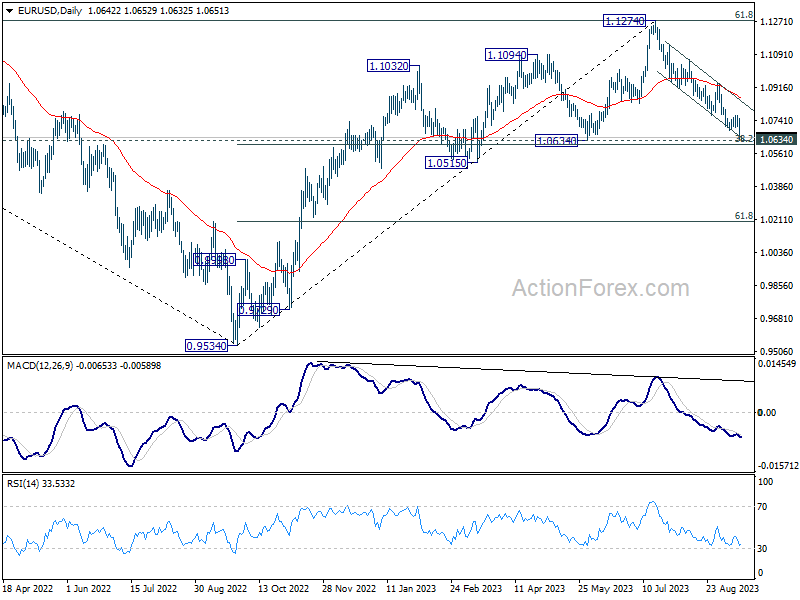
In the bigger picture, fall from 1.1274 medium term top is seen as a correction to up trend from 0.9534 (2022 low). Strong support could be seen from 1.0634 cluster support (38.2% retracement of 0.9534 to 1.1274 at 1.0609) to bring rebound, at least on first attempt. Break of 1.0944 will indicate the start of the second leg, and target retest of 1.1274. However, sustained break of 1.0609/0634 will raise the chance of bearish trend reversal, and target 61.8% retracement at 1.0199.
Europeans Lag as Commodity Currencies Ride the Wave of Optimism
Australian Dollar advanced during Asian session, bolstered by stronger than anticipated data emanating from China and the injection of CNY 191B of fresh liquidity into the banking system by PBoC. The injection, which involved CNY 34B through 14-day reverse repos at a reduced rate of 1.95%, down from the prior 2.15%, followed the Chinese central bank's decision to cut reserve requirement ratio for all banks by 25bps a day earlier.
Other commodity currencies are also experiencing a surge, buoyed by improving risk sentiment as analysts expect that the world is nearing the end of current tightening cycle. Adding fuel to the fire, Canadian Dollar received an extra push from the unrestrained ascent of WTI oil prices, which broke through 91 mark and shows no signs of halting.
In contrast, Euro finds itself as the week's underperformer, suffering a selloff triggered by the dovish ECB rate hike yesterday. While selling pressure witnessed a slight respite during Asian session, substantial rebound appears elusive. Sterling and Swiss Franc are also languishing, holding positions as the next weakest links in the chain.
Dollar and Yen are holding a middle ground, gaining against European majors but losing terrain to commodity currencies. Despite the release of this week's US CPI data, the greenback remained relatively unmoved, leaving traders to pin their hopes on next week's FOMC rate decision and economic projections for a more decisive direction.
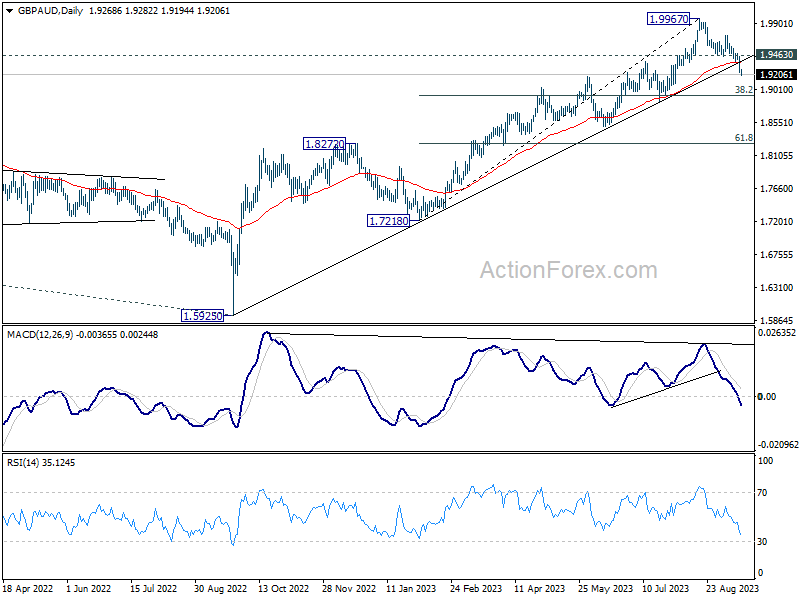
Technically, GBP/AUD's strong break of 55 D EMA and medium term trend line support this week indicates that it's at least correcting the rise from 1.7128 to 1.9967. Deeper fall is now expected as long as 1.9463 support turned resistance holds. Next target is 38.2% retracement of 1.7218 to 1.9967 at 1.8917. Reaction from there will reveal whether the cross is in a larger scale correction.
In Asia, at the time of writing, Nikkei is up 1.33%. Hong Kong HSI is up 1.53%. China Shanghai SSE is up 0.01%. Singapore Strait Times is up 1.01%. Japan 10-year JGB yield is down -0.0025 at 0.706. Overnight, DOW rose 0.96%. S&P 500 rose 0.84%. NASDAQ rose 0.81%. 10-year yield rose 0.039 to 4.288.
NZ BNZ PMI falls to 46.1, manufacturing activity slumps to multi-year low
New Zealand's manufacturing sector experienced a further slowdown in August, with BusinessNZ Performance of Manufacturing Index falling slightly from 46.6 in July to 46.1. This marks the lowest rate of activity for a non-pandemic affected month since June 2009. Furthermore, the latest PMI data sits significantly below its long-term average of 52.9.
A closer look at the August data reveals: Production observed a modest increase, moving from 43.1 to 43.9. Employment metrics improved, rising from 44.8 to 47.7. New orders experienced a minor uptick, growing from 45.5 to 46.6. Finished stock levels retreated slightly from 52.7 to 52.1. Deliveries, however, showed more promise, escalating from 42.9 to 47.7.
Despite the grim headline figure, it is noteworthy that there was a slight decrease in the proportion of negative comments, standing at 66.7%, a marginal relief compared to July's 72%. However, the level of pessimism mirrored that of May, maintaining the same rate of 66.7%. The pervasive market uncertainty stemming both from domestic and offshore influences, coupled with rising costs and weather-impacted demand, continued to be highlighted as primary drivers for the negative sentiment pervading the industry.
BNZ Senior Economist Craig Ebert expressed concern over the PMI's latest results, noting that while the headline figure had seen much lower points during previous recessions, the composition of August figures brought little consolation. Ebert pinpointed new orders and production as substantial drags on the performance, trailing behind the standard levels by 8.0 and 9.5 points respectively.
China's Economic Data Surpasses Forecasts, but Challenges Persist
China's economic indicators for August showcased a mixed picture but, on the whole, exceeded analyst expectations in key areas. Industrial production exhibited growth of 4.5% yoy, edging out forecast of 4.0% yoy. Retail sales also outperformed predictions, registering 4.6% yoy increase compared to anticipated 3.0% yoy. However, fixed asset investment lagged slightly, presenting a 3.2% rise year-to-date year-on-year, just shy of the 3.3% expected.
The official communique from the NBS acknowledged the data as revealing a "marginal improvement." Emphasizing the resilience and progress of the national economy, the statement underscored that "high-quality development" was on track and the accumulation of positive factors was evident. However, it also stressed caution. While the recovery is in motion, the bureau pointed out that there are still several "unstable and uncertain factors in the external environment" that China has to contend with.
Looking ahead
Eurozone trade balance will be released in European session. Later in the day, US will release Empire State manufacturing, import price, industrial production and U of Michigan consumer sentiment.
EUR/USD Daily Outlook
Daily Pivots: (S1) 1.0600; (P) 1.0676; (R1) 1.0720; More...
Intraday bias in EUR/USD remains on the downside for the moment, as EUR/USD is pressing 1.0609/34 cluster support zone. Strong rebound from current level, followed by break of 1.0767 resistance, should confirm short term bottoming. Intraday bias will be back on the upside for 1.0944 resistance. However, sustained break of 1.0609/34 will carry larger bearish implication, and target 1.0515 support next.
In the bigger picture, fall from 1.1274 medium term top is seen as a correction to up trend from 0.9534 (2022 low). Strong support could be seen from 1.0634 cluster support (38.2% retracement of 0.9534 to 1.1274 at 1.0609) to bring rebound, at least on first attempt. Break of 1.0944 will indicate the start of the second leg, and target retest of 1.1274. However, sustained break of 1.0609/0634 will raise the chance of bearish trend reversal, and target 61.8% retracement at 1.0199.
Economic Indicators Update
| GMT | Ccy | Events | Actual | Forecast | Previous | Revised |
|---|---|---|---|---|---|---|
| 22:30 | NZD | Business NZ PMI Aug | 46.1 | 46.3 | 46.6 | |
| 02:00 | CNY | Industrial Production Y/Y Aug | 4.50% | 4.00% | 3.70% | |
| 02:00 | CNY | Fixed Asset Investment YTD Y/Y Aug | 3.20% | 3.30% | 3.40% | |
| 02:00 | CNY | Retail Sales Y/Y Aug | 4.60% | 3.00% | 2.50% | |
| 04:30 | JPY | Tertiary Industry Index M/M Jul | 0.90% | 0.20% | -0.40% | -0.70% |
| 08:30 | GBP | Consumer Inflation Expectations | 3.50% | |||
| 09:00 | EUR | Eurozone Trade Balance (EUR) Jul | 13.5B | 12.5B | ||
| 12:30 | CAD | Manufacturing Sales M/M Jul | -1.70% | |||
| 12:30 | USD | Empire State Manufacturing Sep | -10 | -19 | ||
| 12:30 | USD | Import Price Index M/M Aug | 0.30% | 0.40% | ||
| 13:15 | USD | Industrial Production M/M Aug | 0.20% | 1.00% | ||
| 13:15 | USD | Capacity Utilization Aug | 79.30% | 79.30% | ||
| 14:00 | USD | Michigan Consumer Sentiment Index Sep P | 69.5 | 69.5 |
Oil (CL) Should Extend Higher in Impulsive Structure
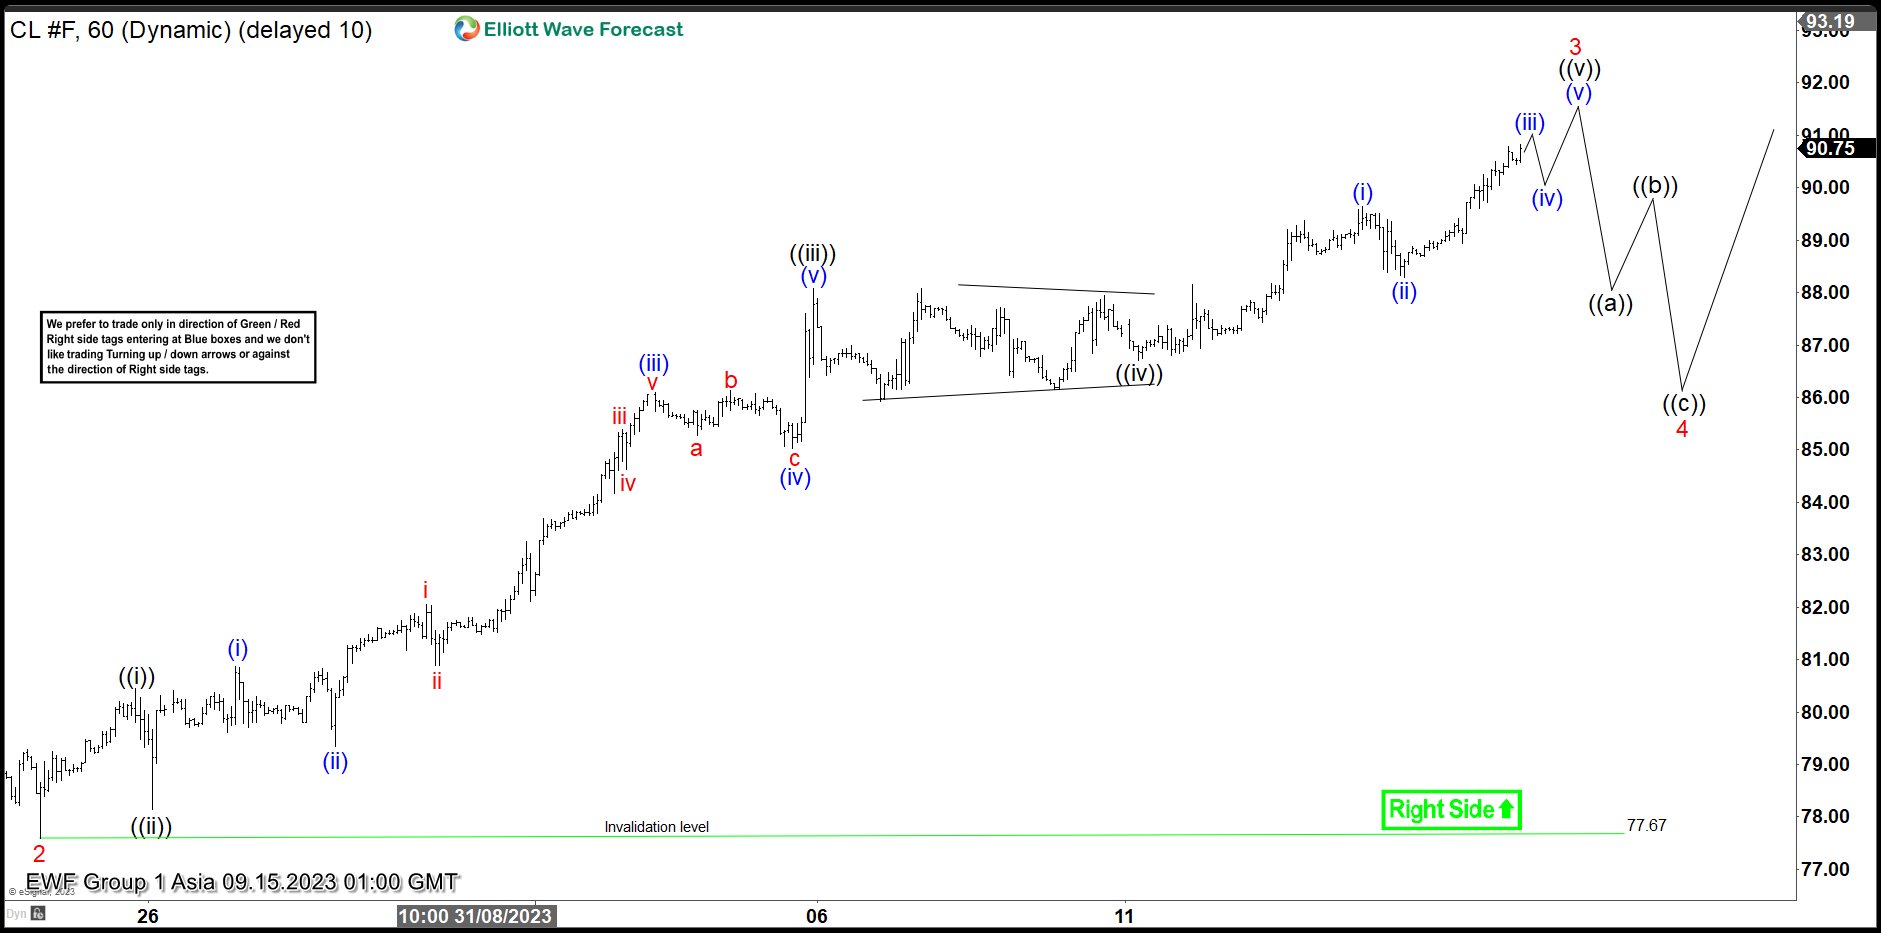
Short Term Elliott Wave View in Oil (CL) suggests the rally from 6.12.2023 low is in progress as a 5 waves impulse structure. Up from 6.12.2023 low, wave 1 ended at 84.89 and pullback in wave 2 ended at 77.59. Oil then extends higher again in wave 3. Internal subdivision of wave 3 unfolded as another 5 waves impulse in lesser degree. Up from wave 2, wave ((i)) ended at 80.45 and pullback in wave ((ii)) ended at 78.14. Oil extended higher in wave ((iii)) towards 88.07 and dips in wave ((iv)) ended at 86.71. Expect wave ((v)) to complete soon and this should end wave 3 in higher degree.
Oil should then pullback in wave 4 to correct the rally from 8.24.2023 low before it resumes higher again. Internal subdivision of wave 4 should unfold in 3 waves such as zigzag structure ((a))-((b))-((c)). Potential target is 23.6 – 38.2% Fibonacci retracement of wave 3. The area can be measured once wave 3 has ended. Near term, as far as pivot at 77.67 low stays intact, expect pullback to find support in 3, 7, or 11 swing for further upside.
Oil (CL) 60 Minutes Elliott Wave Chart
CL Elliott Wave Video
https://www.youtube.com/watch?v=us4DTYXaAh4
Cliff Notes: The Global Tightening Cycle Nears Its End
Key insights from the week that was.
Beginning in Australia, the Westpac-MI Consumer Sentiment survey delivered yet another sour update on confidence. At 79.7, the headline index has held at deeply pessimistic levels for over a year. This is despite a clear shift in the interest rate outlook, with the RBA now having left policy unchanged for three consecutive months. However, consumers continue to report unrelenting cost-of-living pressures, weighing heavily on current spending behaviour and their views of family finances.
Overall, the survey continues to speak to a very weak outlook for Australian consumer spending. For more detail on our views on the Australian economy and international developments, see the latest edition of Market Outlook. Key themes of the moment were also discussed by the team in our September Market Outlook in Conversation podcast.
The strength of Australia’s labour market has been one of the few bright-spots for households over the last year. The August labour force survey reinforced this support remains intact, the +64.9k lift in employment surpassing even Westpac’s near top-of-the-range forecast. Note though, despite the historic level of employment and a 9.4%yr rise in hours worked, the underemployment rate rose to 6.6% in August. This highlights households are willing to work yet more hours, arguably as a result of intense cost-of-living pressures.
Another point worth mentioning was the surprising strength in labour supply. At 67.0%, the participation rate has lifted to a fresh record high, resulting in an expansion in the size of the labour force on par with employment, ultimately seeing the unemployment rate remain unchanged at 3.7%. This highlights the capacity for labour demand to soak up the migration-driven surge in labour supply; if that were not the case, the unemployment rate would have risen further. This will remain an important dynamic in the year going forward. While we anticipate the strength in net migration flows to ease, the softening in labour demand will likely be greater, seeing the unemployment rate rise to a quarter-average rate of 4.7% by 2024’s end.
At least for now though, the overseas arrivals and departures data continues to highlight strength in migration and population growth. The momentum in permanent and long-term net arrivals is at a historic high, a three-month average pace of +39.3k/mth. The visa-related breakdown is also still reflective of strength, albeit off the highs seen earlier this year. Later in the week, official population estimates provided confirmation of our view for net migration, having posted a sizeable lift of +150k in Q1 2023.
Offshore, there was plenty of news.
The European Central Bank raised its three key policy rates by 25bps. This was a split decision, with President Christine Lagarde mentioning during the press conference that some members "wanted more patience". We also received updated forecasts which see inflation at 3.2% in 2024 then back at target in 2025 at 2.1%. The upgrade came as a result of stronger energy prices. Underlying inflation meanwhile, which excludes food and energy, is expected to be lower in 2024 at 2.9%yr and broadly the same level in 2025, 2.2%yr. Most notably, growth projections were downgraded to 0.7% in 2023, 1.0% in 2024 and 1.5% in 2025, downgrades of 0.2ppt, 0.5ppt ad 0.1ppt respectively.
This is likely to be the final ECB rate hike absent an inflation shock as the ECB stipulated "the key ECB interest rates have reached levels that, maintained for a sufficiently long duration, will make a substantial contribution to the timely return of inflation to the target." That said, during the press conference Lagarde was more tight-lipped about explicitly stating if this was the end of the tightening cycle. We expect the ECB to remain on hold from now until mid-2024 after which we expect 150bps of rate cuts to the end of 2025, compared to 200bps for the US Federal Reserve.
In the US, the CPI rose 0.6%mth in August and 3.7% through the year. Energy was the biggest contributor on a monthly basis as a result of the sharp rise in motor fuel prices. Core inflation, which excludes food and energy, also ticked up in the month to 4.3%yr. While increasing transport prices -- both through the transport services and fuel segments -- pose an upward risk to the CPI, we continue to expect abating price pressures elsewhere bring annual inflation back down to 2.5%yr by March 2024 and 2.0%yr come June 2024. Key will be an easing in shelter prices. The shelter component is currently responsible for around 70% of annual inflation, but leading indicators continue to point to a material deceleration ahead. This should create the right conditions for a rate cut by March 2024.
Meanwhile in the UK, the ILO unemployment rate ticked up to 4.3%, rising above the Bank of England's forecast of 4.1%. This came as a result of a large drop in employment, particularly amongst those aged 16-24. Wages came in at a sizzling 8.5%yr however, exceeding the Bank of England's forecast of 6.9%yr for Q3. Private sector wages, of particular importance to the BoE, ticked down to 8.1%yr from 8.2%yr last month, but obviously a much larger reduction is necessary.
Given wages continue to overshoot as slack builds, there is growing support for the argument that the degree of slack needed to contain wages and prices growth is higher than previously thought. Governor Andrew Bailey is optimistic that wages will come down given anchored inflation expectations, but the BoE have repeatedly been surprised in this cycle. In contrast, Catherine Mann's comments this week suggests there a lot more work to be done. She said, "…holding rates constant at the current level risks enabling further inflation persistence which will have to be unwound eventually with a worse trade-off." This hawkish statement supports the case for a further hike at the September meeting next week, bringing the rate to 5.5%. In the absence of supportive data, we are likely to see one more hike thereafter, then a length pause for policy.
China’s economic data surpasses forecasts, but challenges persist
China's economic indicators for August showcased a mixed picture but, on the whole, exceeded analyst expectations in key areas. Industrial production exhibited growth of 4.5% yoy, edging out forecast of 4.0% yoy. Retail sales also outperformed predictions, registering 4.6% yoy increase compared to anticipated 3.0% yoy. However, fixed asset investment lagged slightly, presenting a 3.2% rise year-to-date year-on-year, just shy of the 3.3% expected.
The official communique from the NBS acknowledged the data as revealing a "marginal improvement." Emphasizing the resilience and progress of the national economy, the statement underscored that "high-quality development" was on track and the accumulation of positive factors was evident. However, it also stressed caution. While the recovery is in motion, the bureau pointed out that there are still several "unstable and uncertain factors in the external environment" that China has to contend with.