Sample Category Title
Gold Price Eyes Recovery While Crude Oil Price Surges
Gold price is eyeing a fresh increase above the $1,915 resistance level. Crude oil price is surging, and it could climb further higher toward the $92 resistance.
Important Takeaways for Gold and Oil Prices Analysis Today
- Gold price started a recovery wave from the $1,900 zone against the US Dollar.
- It broke a major bearish trend line with resistance near $1,908 on the hourly chart of gold at FXOpen.
- Crude oil prices rallied above the $88 and $90 resistance levels.
- There is a key bullish trend line forming with support near $89.00 on the hourly chart of XTI/USD at FXOpen.
Gold Price Technical Analysis
On the hourly chart of Gold at FXOpen, the price found support near the $1,900 zone. The price traded as low as $1,900.93 and recently started a recovery wave.
There was a decent move above the 50-hour simple moving average. The bulls pushed the price above a major bearish trend line with resistance near $1,908. It is now testing the 50% Fib retracement level of the downward move from the $1,930 swing high to the $1,900 low.
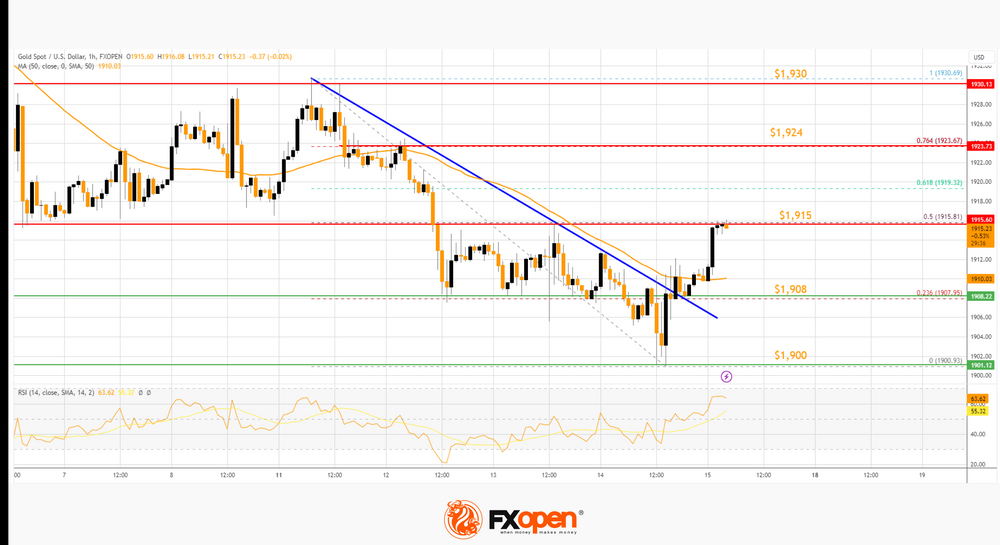
The RSI is back above 50 and the price could aim for more gains. Immediate resistance is near the $1,915 level. The next major resistance is near the $1,924 level.
The 76.4% Fib retracement level of the downward move from the $1,930 swing high to the $1,900 low also sits at $1,925. An upside break above the $1,924 resistance could send Gold price toward $1,930. Any more gains may perhaps set the pace for an increase toward the $1,950 level.
Initial support on the downside is near the 50-hour simple moving average or $1,908. The first major support is $1,900. The main support is $1,888. If there is a downside break below the $1,888 support, the price might decline further. In the stated case, the price might drop toward the $1,865 support.
Oil Price Technical Analysis
On the hourly chart of WTI Crude Oil at FXOpen, the price started a strong increase against the US Dollar. The price gained bullish momentum after it broke the $87.70 resistance as mentioned in the previous analysis.
There was a sustained upward move above the $88.50 and $89.50 resistance levels. The bulls pushed the price toward $90.50. The current price action is positive above the 50-hour simple moving average and RSI is near oversold levels.
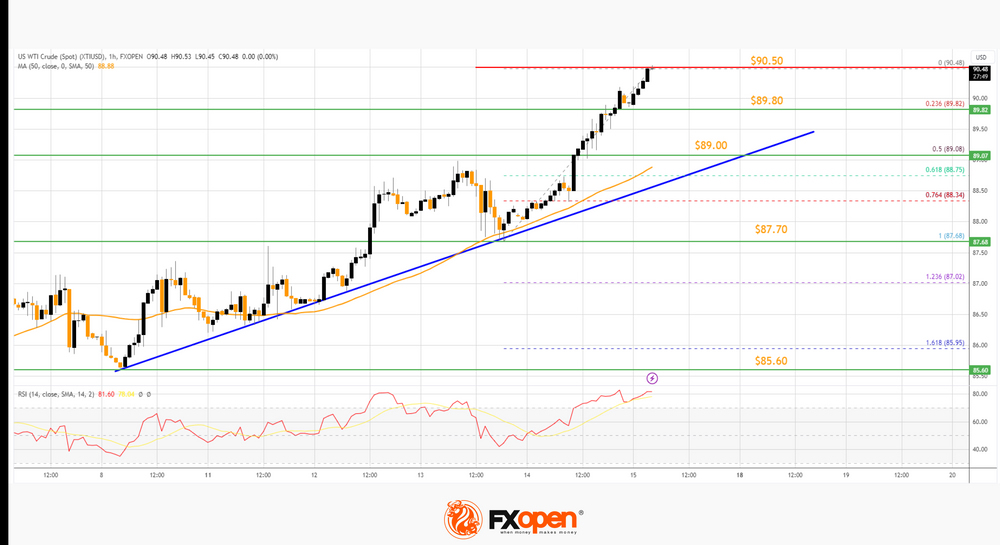
If the price climbs further higher, it could face resistance near $90.80. The first major resistance is near the $91.20 level. Any more gains might send the price toward the $92.00 level.
Conversely, the price might correct gains and test the 23.6% Fib retracement level of the upward move from the $87.68 swing low to the $90.48 high at 89.80. The next major support on the WTI crude oil chart is near a key bullish trend line at $89.00.
The 50% Fib retracement level of the upward move from the $87.68 swing low to the $90.48 high is also near $89.00. If there is a downside break, the price might decline toward $87.70. Any more losses may perhaps open the doors for a move toward the $85.60 support zone.
This article represents the opinion of the Companies operating under the FXOpen brand only. It is not to be construed as an offer, solicitation, or recommendation with respect to products and services provided by the Companies operating under the FXOpen brand, nor is it to be considered financial advice.
Gentle GBPJPY Moves Continue Despite Bears’ Attempts for a Strong Correction
- Gentle downward move continues ahead of key events
- GBPJPY ready to test a key area as intervention rumours linger
- Momentum indicators appear to have reset after the strong rally
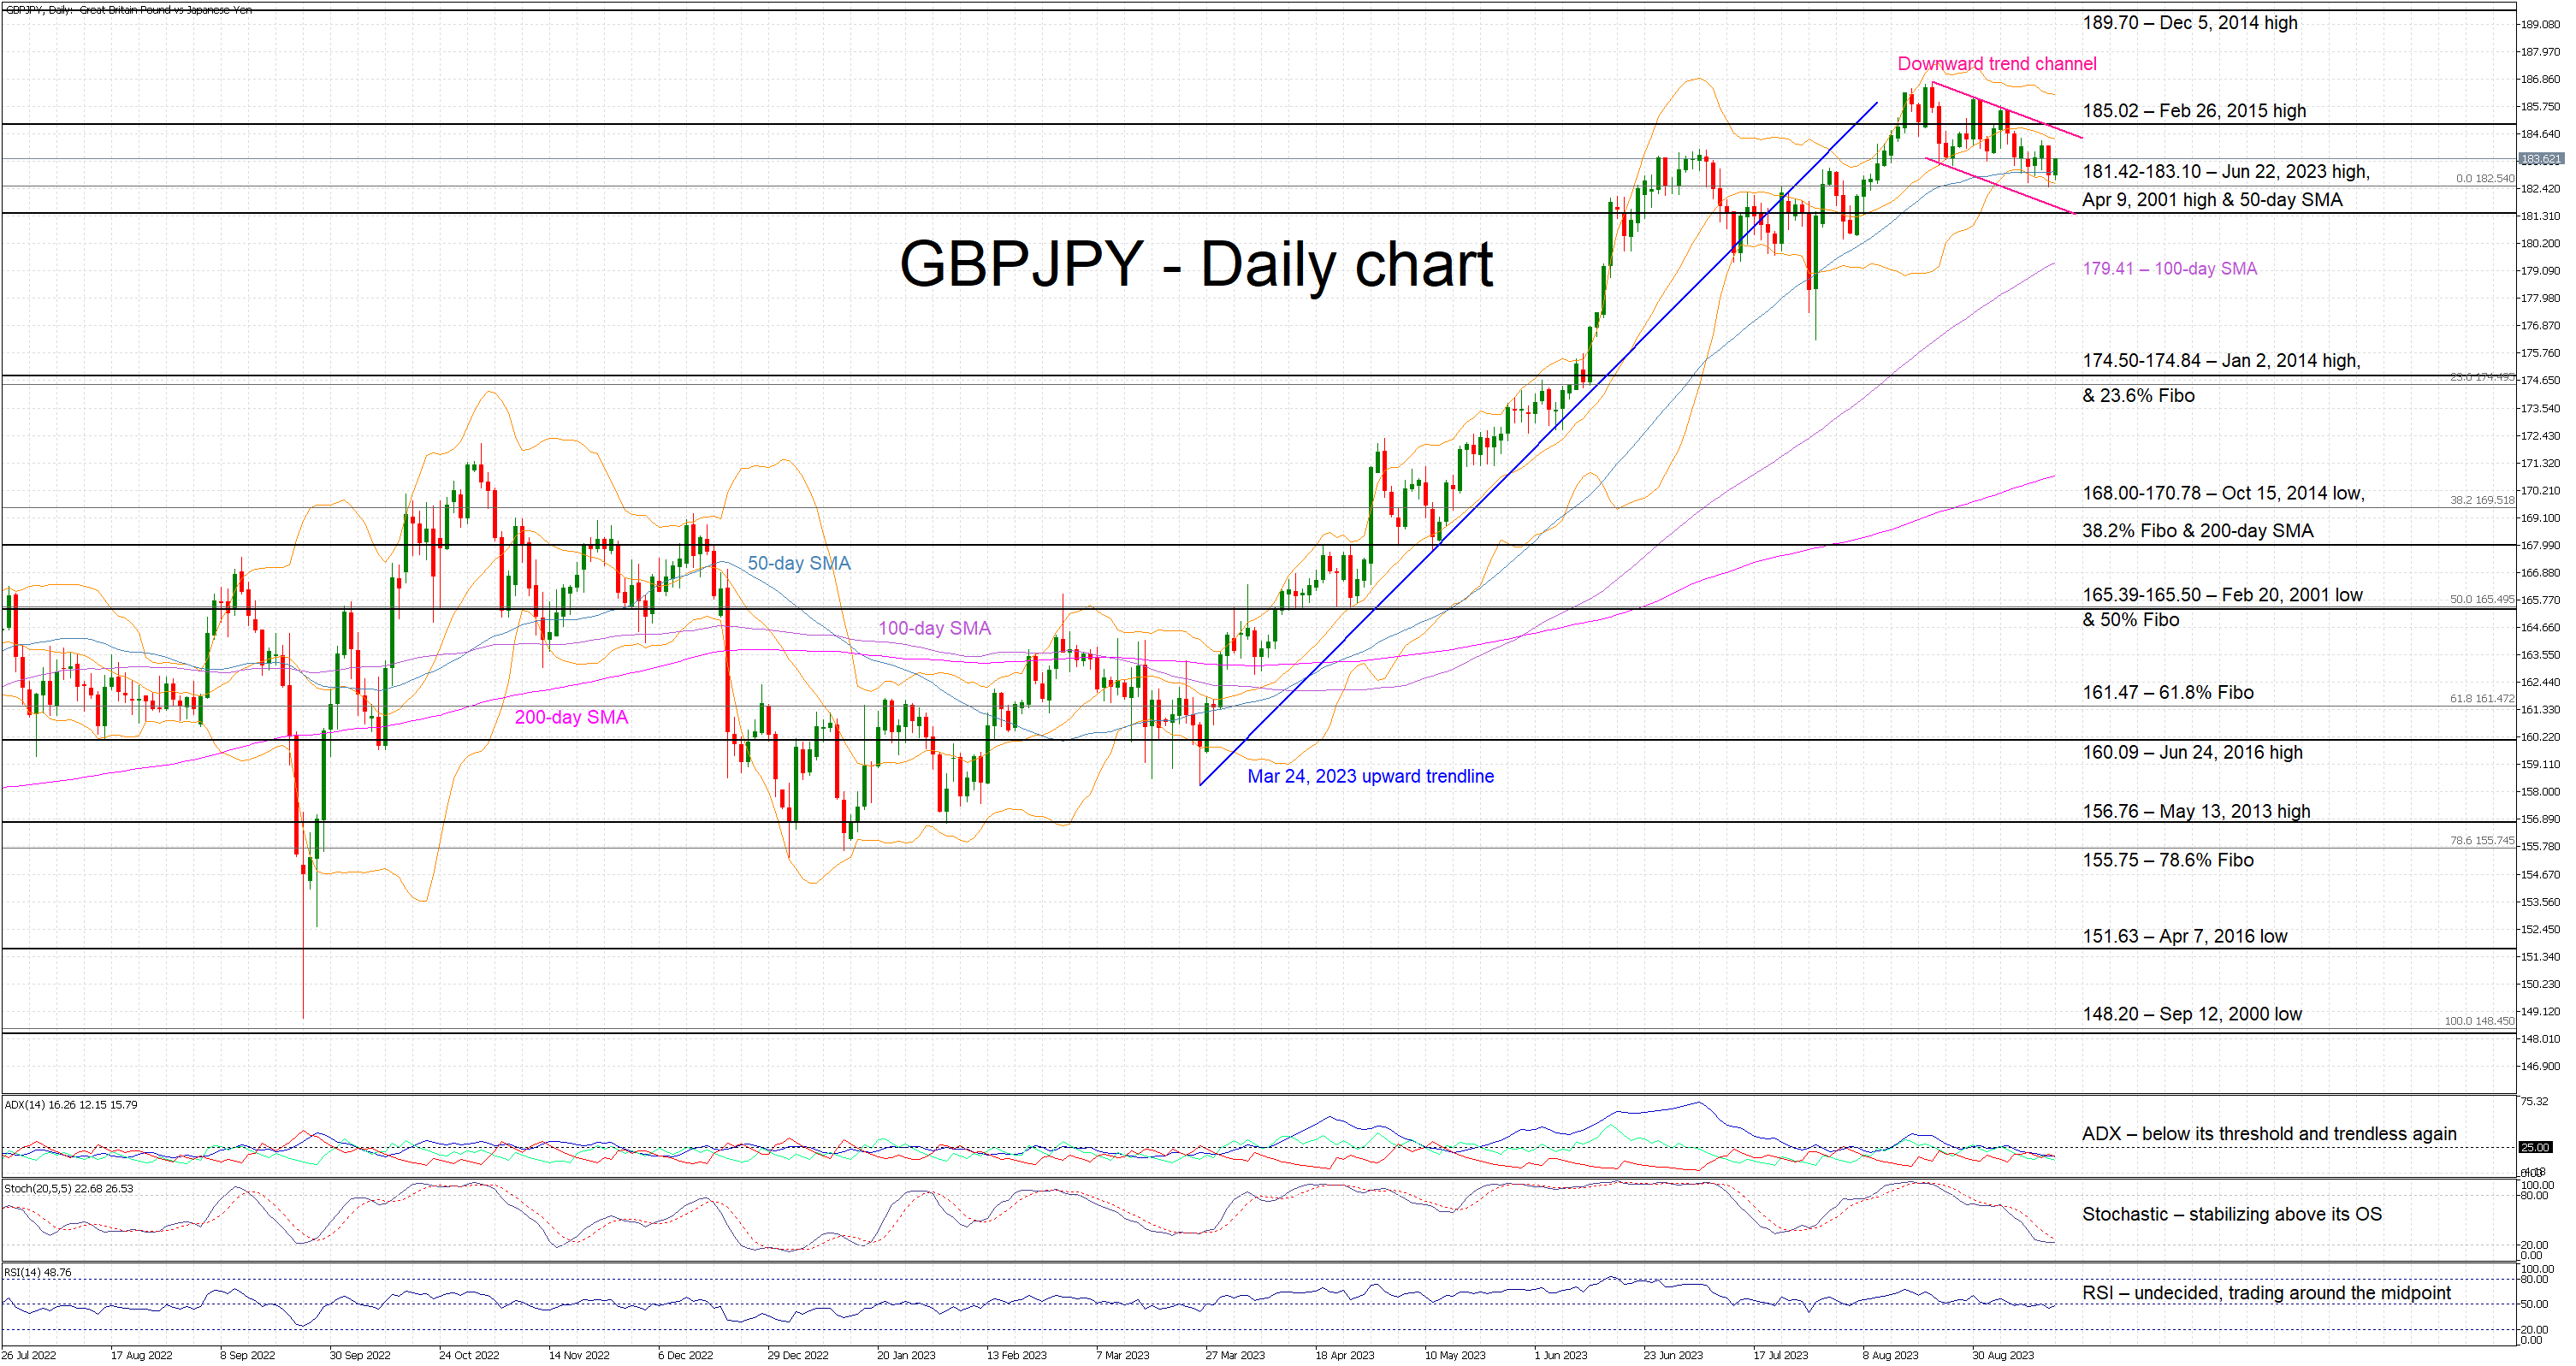
GBPJPY is trading higher today as the market is preparing for next week’s events. The bears are trying to stage a pullback, but such a move could only gather pace if the momentum indicators decide to send strong bearish signals.
However, only the stochastic oscillator has been supportive of the current muted move, but even this indicator appears to have stabilized a tad above its oversold threshold. On the flip side, the Average Directional Movement Index (ADX) remains indifferent to the current downleg as it remains below its 25-threshold; thus signaling a range-trading market. Similarly, the RSI continues to hover around its 50-midpoint, confirming the current indecisiveness of market participants.
Should the bears remain confident, they would try to break the busy 181.42-183.10 range populated by the June 22, 2023 high, the April 9, 2001 high and the 50-day simple moving average (SMA). They could then have a go at testing the support set by the 100-day SMA at 179.41, before having a go at the more important 174.50-174.84 range.
On the other hand, the bulls are probably taking a breather but closely monitoring the current correction. They are keen on keeping GBPJPY above the 181.42 level and gradually stage a move towards the February 26, 2015 high at 185.02. They could then have the chance of making a new 2023 high, before setting sail for the December 5, 2014 high at 189.70.
To sum up, GBPJPY bears are trying to recover part of their significant losses, but they need the support from the mixed momentum indicators for the current pullback to snowball.
Dollar in Case of Strong Data Has Further Upward Potential
Markets
The ECB Yesterday raised its policy rates again by 25 bps to a record 4.0% (depo rate), in what is now mainly labelled as a ‘final dovish‘ rate hike. In advance, the decision was said to be a close call. ECB’s Lagarde at the press conference admitted that some members already preferred a pause, but in the end the decision was supported by a ‘solid majority’ as inflation, while easing, is still ‘expected to remain too high for too long’. This assessment was supported by an upward revision of 2023 (5.6%) and 2024 (3.2%) inflation projections. Even in 2025 (2.1% from 2.2%) inflation is expected to stay above the 2.0% target. At the same time, growth forecasts were substantially downwardly revised to 0.7% this year (from 0.9%) and 1.0% in 2024 (from 1.5%). In this context, ‘the Governing Council considers that the key ECB interest rates have reached levels that, maintained for a sufficiently long duration, will make a substantial contribution to the timely return of inflation to the target.’ Even so, the ECB maintains a data dependent approach and Lagarde said she couldn’t say that ECB rates have reached their peak. According to the ECB president, there had been no discussion about a faster rundown of APP or a start of reducing PEPP holdings (reinvestments till end 2024). The December ECB projections still remain an evaluation point. Even so, markets sees a big chance that the ECB hiking cycle as been finished. German yields eased between 0.4 bps (2-y) and 6.2 bps (5- y). The ECB policy decision was the main dish for markets yesterday, but US data also had a role to play. Retail sales, jobless claims and higher than expected PPI all brought further evidence of a resilient US economy. US yields added 3-4 bps across the curve. A rate hike next week remains unlikely, but a ‘final’ step in November remains on the table. The perceived end of the ECB cycle combined with strong US data pushed EUR/USD off a cliff. The pair dropped from the 1.073 area before the ECB decision to close at 1.0643, after an intraday test of the 1.0635 support. Equities flourished (Eurostoxx 50 1.33%, S&P 500 +0.84%) even as oil continued its ascent (Brent near $94 p/b).
Sentiment in Asia remains positive building on WS gains and positive eco data from China (cf infra). Later today, the eco calendar in Europe is thin. In the US import prices, industrial production, the Empire manufacturing survey and Consumer confidence of the University of Michigan will be published. The data probably won’t change the assessment on the outcome of next week’s Fed meeting. Even so, the Empire manufacturing survey and (inflation expectations of) the U. of Michigan Consumer confidence are worth keeping an eye on. Strong data probably won’t be enough to push US yields beyond key resistance (10-y peak at 4.34/36%). However, the dollar in case of strong data has further upward potential. A break of EUR/USD below 1.0635/32 opens the way to the 1.0516/1.0484 area.
News and views
Chinese monthly data this morning fuels hope the economy is finally bottoming out. Retail sales grew 4.6% y/y in August and are up 7% in the running year (YtD) compared to the same period last year. Industrial production rose 4.5% and 3.9% respectively with the latter gauge having improved slowly but steadily since February of this year. Both indicators (far) exceeded analyst estimates, suggesting peak investor pessimism may be behind us. The unemployment rate slightly eased from 5.3% to 5.2% in another encouraging yet cautious sign. That’s not to say all is over now though. Fixed asset investment stood at a weak 3.2% YtD y/y, extending a losing streak that’s in place since February 2022. The drop from July’s 3.4% came amid the ongoing woes in the property sector, where investments fell 8.8%, further down from -8.5% in July. Prices of new homes also fell at a faster pace (-0.29% m/m) in August than in last month. But markets took this morning’s string of data as a sign that supportive government measures announced over the past weeks are starting to have an effect. Until it is clear that the Chinese economy is on a sustained recovery path, more will probably follow. Just yesterday, the Chinese central bank cut the reserve requirement ratio by 25 bps for a second time this year. With the move, the PBOC boosts banks’ lending capacity and frees up liquidity of as much as 500bn yuan. The central bank this morning also added more cash into the economy through a one-year policy loan. The combo of more stimulative measures with the batch of eco data revives investor appetite. The Chinese yuan strengthens against the dollar. USD/CNY trades around 7.26. Stocks in the broader region rise. Hong Kong is one the outperformers, adding 1.2%.
EUR/AUD Daily Outlook
Daily Pivots: (S1) 1.6450; (P) 1.6591; (R1) 1.6667; More...
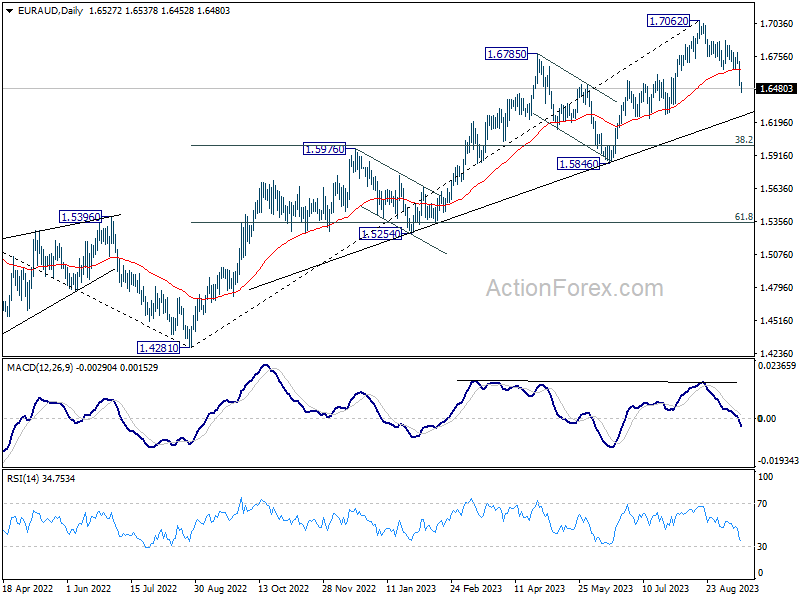
Intraday bias in EUR/AUD stays on the downside, as fall from 1.7062 is extending. Deeper decline would be seen to 1.6259 support. Break there will target 1.6000 fibonacci level. On the upside, above 1.6647 support turned resistance will turn intraday bias neutral first.
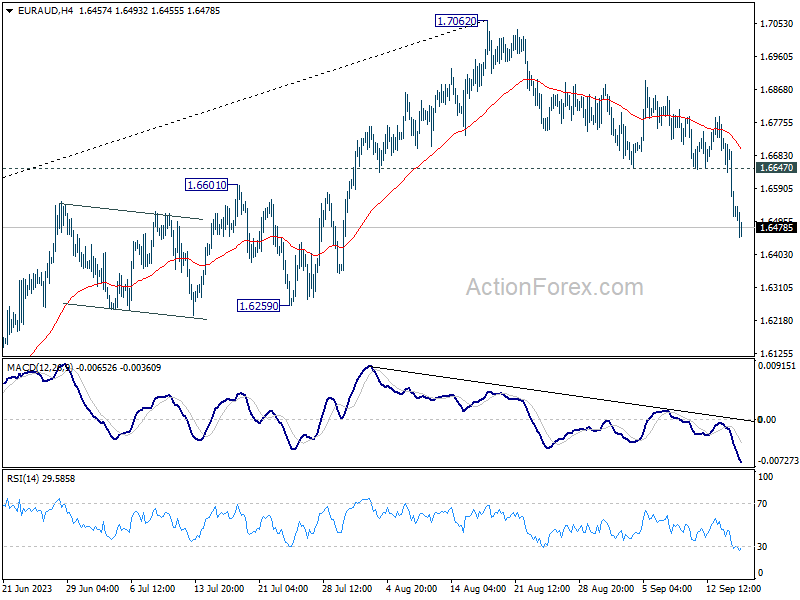
In the bigger picture, current development argues that fall from 1.7062 is probably correcting whole up trend from 1.4281. Deeper decline would be seen to 38.2 retracement of 1.4281 to 1.7062 at 1.6000. Strong support should be seen there to bring rebound, at least on first attempt.
EUR/GBP Daily Outlook
Daily Pivots: (S1) 0.8562; (P) 0.8588; (R1) 0.8604; More...
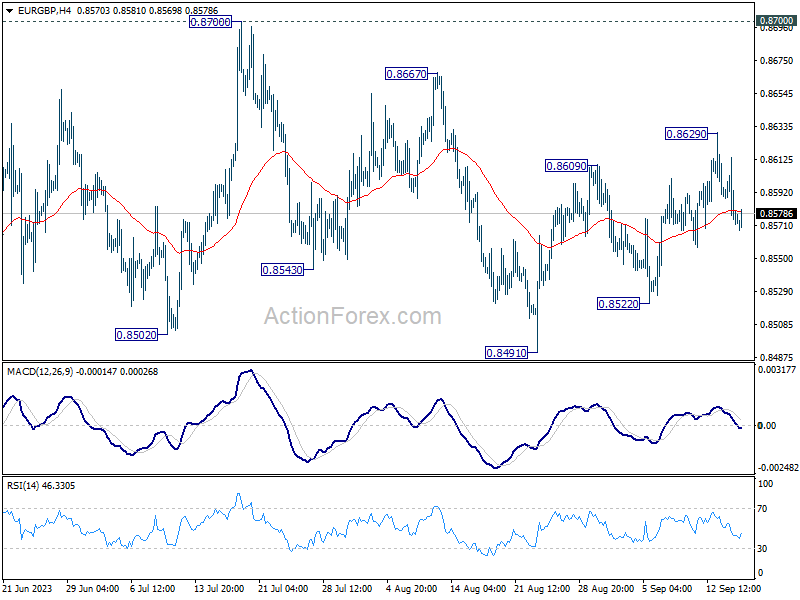
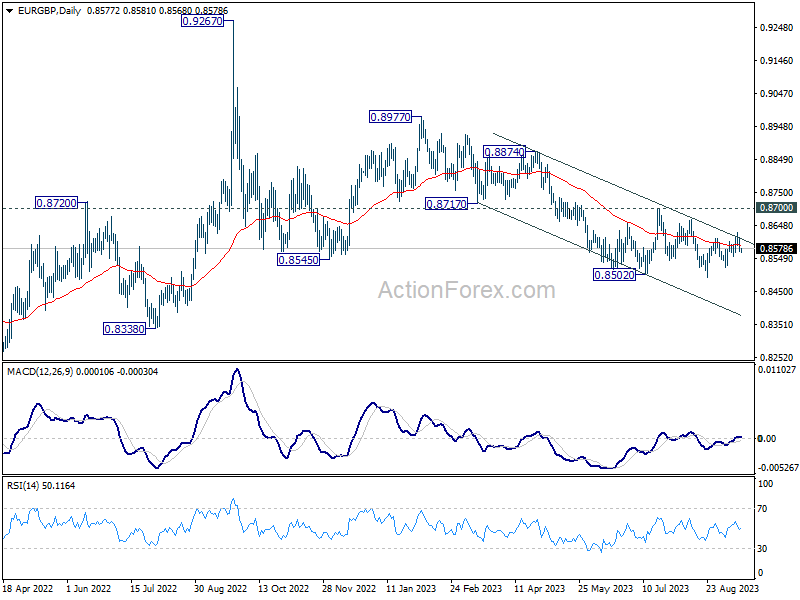
Intraday bias in EUR/GBP stays neutral and outlook is unchanged. Price actions from 0.8502 are a consolidation pattern. Above 0.8629 would bring stronger recovery, but upside should be limited 0.8700 to bring larger decline resumption. On the downside, below 0.8522 will bring retest of 0.8491 support.
In the bigger picture, the down trend from 0.9267 (2022 high) is seen as part of the long term range pattern from 0.9499 (2020 high). Fall from 0.8977 is seen as the third leg. As long as 0.8700 resistance holds, further decline is still expected. Break of 0.8491 will resume the fall towards 0.8201 (2022 low). Nevertheless, firm break of 0.8700 will now be a sign of bullish reversal.
EUR/JPY Daily Outlook
Daily Pivots: (S1) 156.28; (P) 157.33; (R1) 158.02; More....
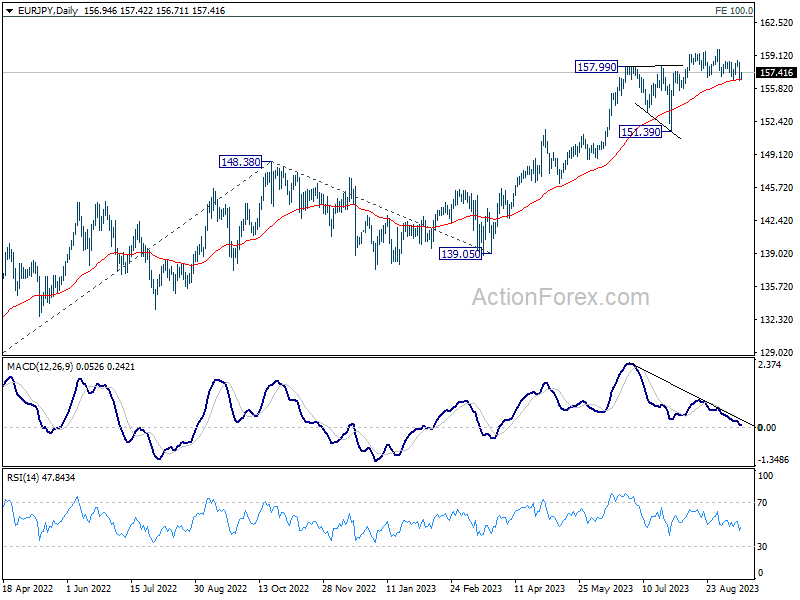
Intraday bias in EUR/JPY stays neutral at this point. Corrective fall from 159.75 could extend lower as long as 158.64 resistance holds. Break of 156.57, and sustained trading below 55 D EMA (now at 156.72) will argue that fall from 159.75 is a larger scale correction. Deeper fall would be seen back towards 151.39 support.
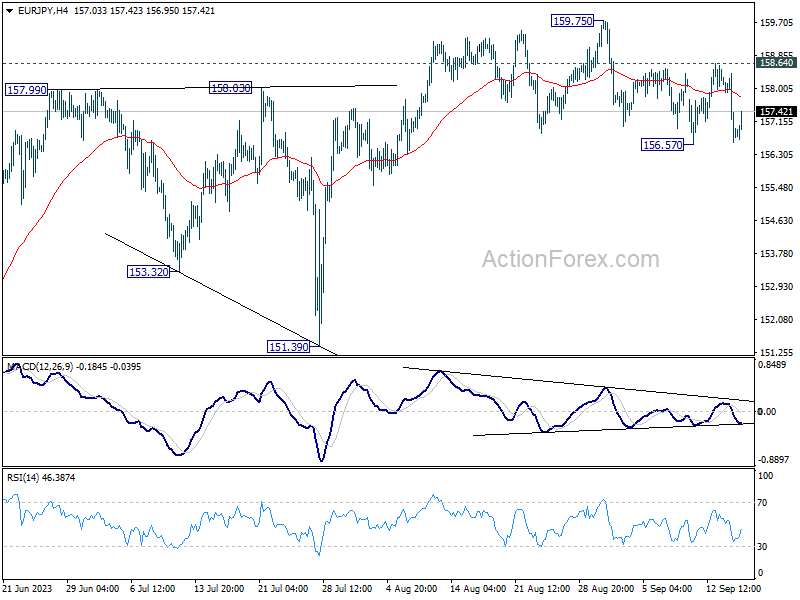
In the bigger picture, rise from 114.42 (2020 low) is in progress. Next target is 100% projection of 124.37 to 148.38 from 139.05 at 163.06. Sustained break there will pave the way to retest long term resistance at 169.96. This will remain the favored case as long as 151.39 support holds, even in case of deep pull back.
GBP/JPY Daily Outlook
Daily Pivots: (S1) 182.31; (P) 183.23; (R1) 183.93; More...
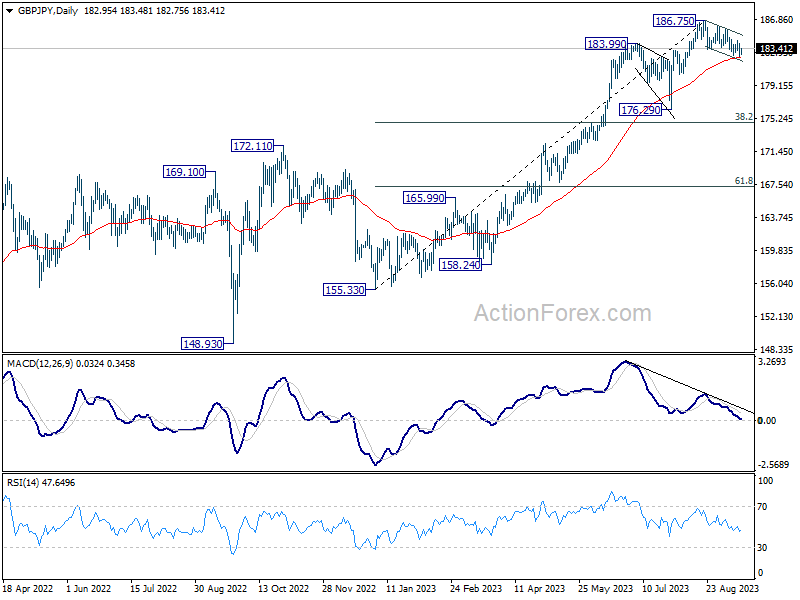
GBP/JPY's fall from 186.75 is extending and further decline is expected as long as 184.39 resistance holds. Sustained trading below 55 D EMA (now at 182.44) will argue that it's already in a larger scale correction and target 176.29 support next. On the upside, break of 184.39 resistance will suggest that the pull back from 186.75 has completed. Intraday bias will be turned back to the upside for 185.76 resistance next.
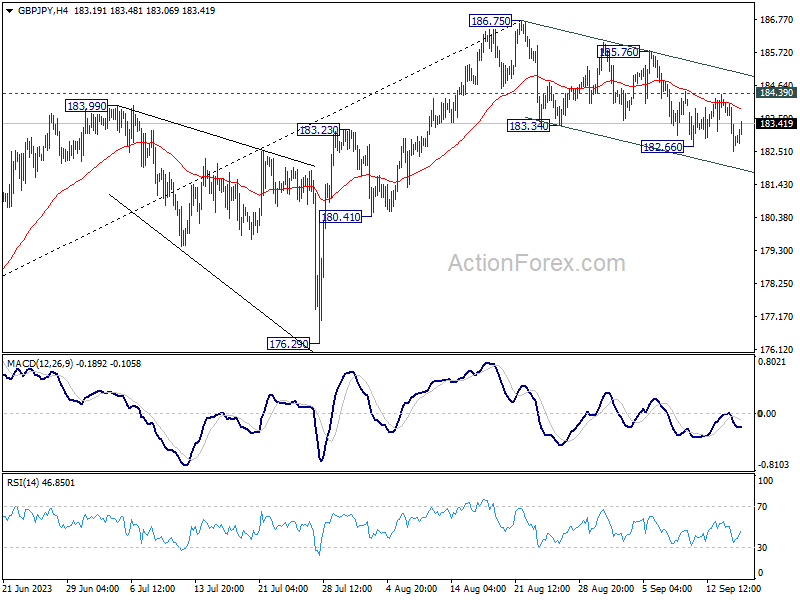
In the bigger picture, up trend from 123.94 (2020 low) is in progress. Next target is 195.86 (2015 high). This will remain the favored case as long as 176.29 support holds, even in case of deeper pull back.
EUR/CHF Daily Outlook
Daily Pivots: (S1) 0.9509; (P) 0.9555; (R1) 0.9580; More...
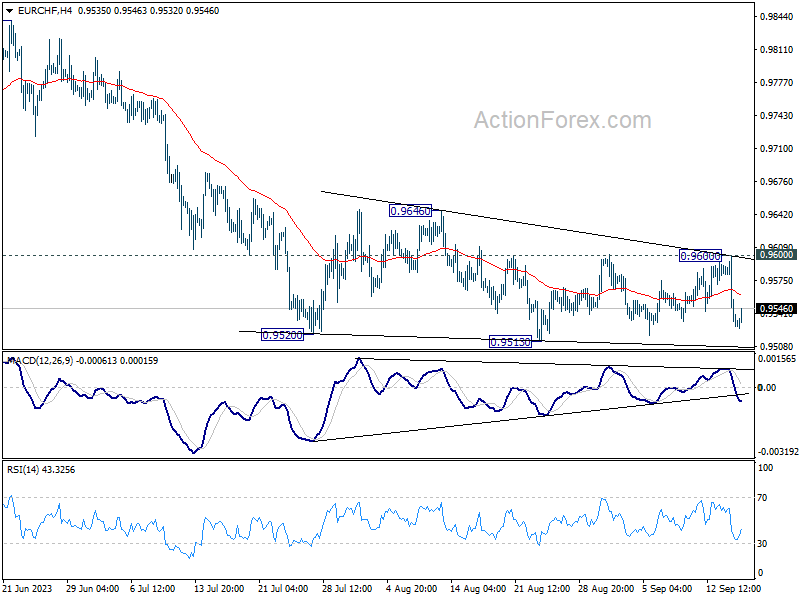
EUR/CHF fell notably but stays in range above 0.9513. Intraday bias remains neutral for the moment. Outlook stays bearish with 0.9600 resistance intact. On the downside, decisive break of 0.9513 will resume the decline from 1.0095, towards 0.9407 low. However, break of 0.9600 resistance will turn bias back to the upside for stronger rebound to 0.9646 resistance and above.
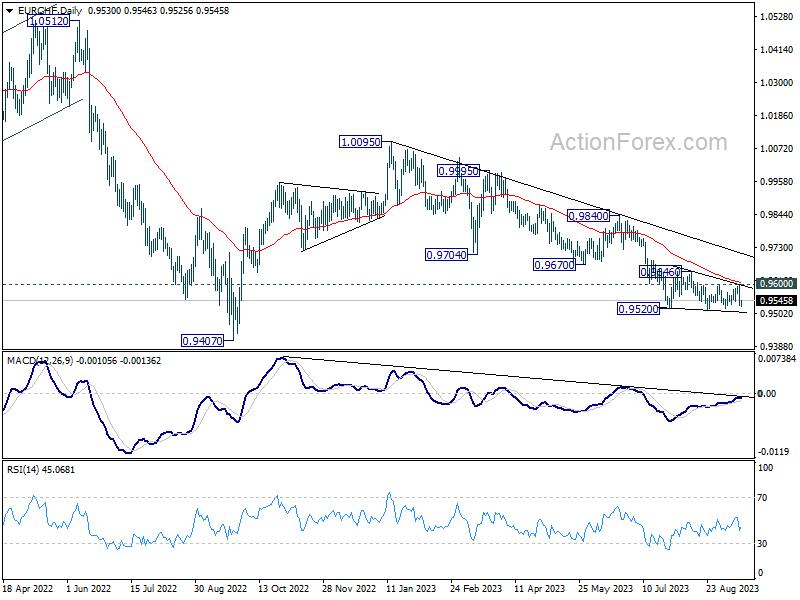
In the bigger picture, medium term outlook is staying bearish as the cross is capped well below falling 55 W EMA (now at 0.9818). Down trend from 1.2004 (2018 high) is in favor to continue. Sustained break of 0.9407 will target 61.8% projection of 1.1149 to 0.9407 from 1.0095 at 0.9018. For now, this will remain the favored case as long as 0.9670 support turned resistance holds, in case of strong rebound.
ECB Hiked and Paused
Market movers today
An eventful week comes to a close with some inflation expectations data. In Sweden, Prospera's quarterly survey should generally show declining inflation expectations, while in the US, rising gasoline prices could have lifted consumers' inflation expectations in the University of Michigan's flash September survey.
US August industrial production data as well as NY Fed's Empire Manufacturing index for September are also due for release.
Markets will naturally pay close attention to any upcoming ECB speeches following the yesterday's meeting, and Lagarde is scheduled to take part in a press conference after Eurogroup meeting today.
The 60 second overview
The ECB meeting was the main event yesterday. We see the 25bp hike as a compromise in the Governing Council - a balancing act in a stagflationary environment. We were quite surprised by the limited optionality for further hikes in the statement, although Lagarde naturally refused to write off the possibility. We see the ECB's monetary policy-setting approach now focusing much more on the time horizon for rates being in restrictive territory. As the new staff projections kept the forecast for headline and core inflation in 2025 above 2%, the road to neutral rates could end up being a long one. Our baseline is for the ECB not to hike further, and we see the next move being gradual cuts starting in the summer 2024. Read our review of the meeting outcome here: Flash ECB Review Confirmed: A final rate hike, but restrictive policies are not over, September 14.
As expected, Danmarks Nationalbank (DN) hiked its key policy rate 25bp to 3.6% following the ECB decision. We expect EUR/DKK to continue trading close to the central rate and that DN will continue follow future ECB rate changes 1-to-1: Flash Comment Denmark - End of the hiking cycle, September 14.
Yesterday's US August Retail sales figures were a mixed bag for the markets, as headline sales grew stronger than expected (0.6% m/m; consensus 0.2%), but the growth was largely attributable to higher gasoline prices and it came with hefty negative revisions to June and July data. Control group sales, which strip away the most volatile categories, grew by a more modest 0.1% m/m, which together with 0.3% core inflation would suggest that real consumption volume took a turn lower in August. While recent macro data releases have generally been stronger than anticipated, we expect to see further signs of cooling consumption towards the fall. And while the Fed is priced to stay on hold next week, we do not anticipate hikes later in the year either, especially when taking into account that US financial conditions have already tightened over the summer. Read our full preview for the next week's meeting at Research US - Fed preview: Plotting the way forward, 15 September.
This morning, United Auto Workers (UAW) started a strike against the three large Detroit car makers, Ford, GM and Stellantis. UAW, representing some 146.000 workers, has pushed for 40% wage increases over the next four and a half years, as well as improved benefits including shorter work weeks and better job protection. The companies have reportedly offered around 20% wage increases, and dismissed improved benefits. 12.700 workers are part of the initial strike, but new strike locations could be added depending on the negotiations. If the issue is resolved over the span of days or few weeks, the negative impact on growth as well as the potential uptick in car prices should remain limited, but a strike lasting several months could meaningfully weaken US economic growth.
Chinese growth data out this morning show some signs of growth stabilization. Industrial production rose 4.5% y/y (consensus: 3.9% y/y) after 3.7% y/y in July, while retail sales was up 4.6% y/y (consensus: 3% y/y) after 2.5% y/y in July. Property investment was in line with consensus down by 8.8% y/y in the first 8 months of 2023. The People's Bank of China (PBoC) decided yesterday to cut the reserve requirement ratio by 25bp for most banks. Overnight, the central bank has additionally injected a net CNY191bn into the financial system through 1-year policy loans. We see room for much further policy support if needed, to counter uncertainty relating to the real estate sector or the financial system.
Equities: Global equities were higher yesterday as investors celebrated a stagflation message from the ECB. It sounds odd and it is odd in our opinion based on what we learned from ECB yesterday. Not so much the interest rate hike but the combination of high headline inflation expectations and lowering of GDP growth expectations for 23, 24, and 25. However, equities markedly higher driven by cyclical value. That being said, it was not an overwhelming risk-on when glancing through the sector and style rotations. VIX ticked lower to 13 and implicitly signalling the world economy being in good shape. In US yesterday, +0.96%, S&P 500 +0.8%, Nasdaq +0.8% and Russell 2000 +1.4%. Stocks in Asia are higher this morning from what could be called a three-way tailwind. In addition, a 25bp cut too RRR in China and a better-than-expected outcome of retail sales and industrial production numbers in China. European and US futures higher this morning.
FI: European bond yields drifted lower following yesterday's ECB decision to hike the key interest rates by 25bp, while also signaling that the peak is likely to have been reached. 10Y Bund yields were down 6bp throughout the day, while the 2s10s curve flattened 3bp. Markets are now pricing in further policy tightening of just 4bp until the turn of the year. The absence of news on the PEPP portfolio roll-down was supportive to peripheral bonds, causing a spread tightening to core peers. The 5y5y EUR inflation swap rate was down 3bp to 2.60% following the ECB meeting.
FX: EUR/USD resumed its downtrend, breaking below 1.0650 on dovish ECB hike and strong US data. USD/JPY remains around 147.5. EUR/GBP declined well below 0.86. EUR/NOK moved to the low 11.40s on the back of the broad-based setback to the EUR, while EUR/SEK edged slightly lower to around 11.90.
Credit: Yesterday, credit spreads were supported towards the end of the trading day by improving risk sentiment following the ECB rate decision and briefing, sending iTraxx Main 1.6bp tighter to close at 68.7bp, while Xover was tighter by 7bp to close at 386.7bp.
Nordic macro
In Sweden, Prospera's quarterly inflation expectations survey is released at 08:00. Inflation expectations should retreat in the 1-2Y segment, whereas 5Y will probably remain close to 2.2%. The long-term expectations is most important for the Riksbank, who likes to take credit for the fact that they have remained relatively anchored throughout the high-inflation/tightening period.
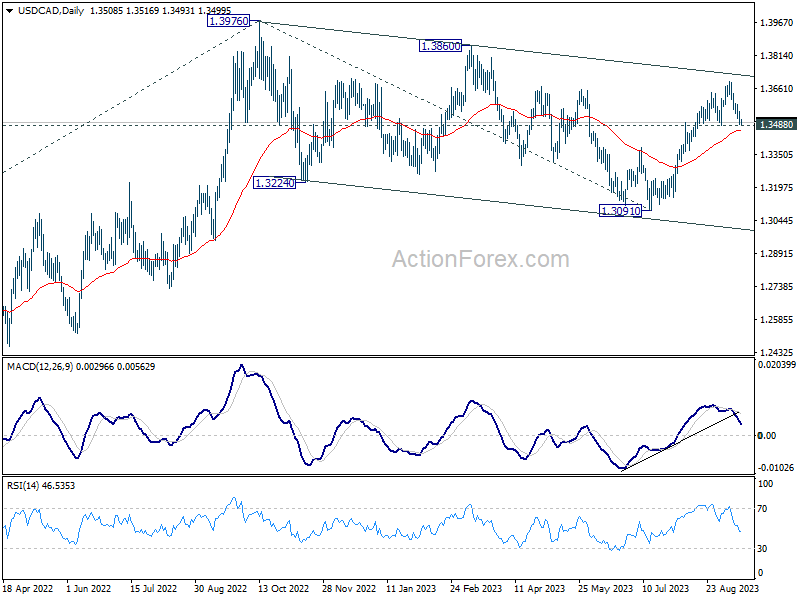
USD/CAD Daily Outlook
Daily Pivots: (S1) 1.3481; (P) 1.3519; (R1) 1.3544; More....
Intraday bias in USD/CAD stays neutral for the moment. Overall, further rally is expected as long as 1.3488 support holds. Above 1.3693 will resume the rally from 1.3091 to 1.3860 resistance, and then 1.3976 high. However, firm break of 1.3488 will turn bias to the downside for deeper decline.
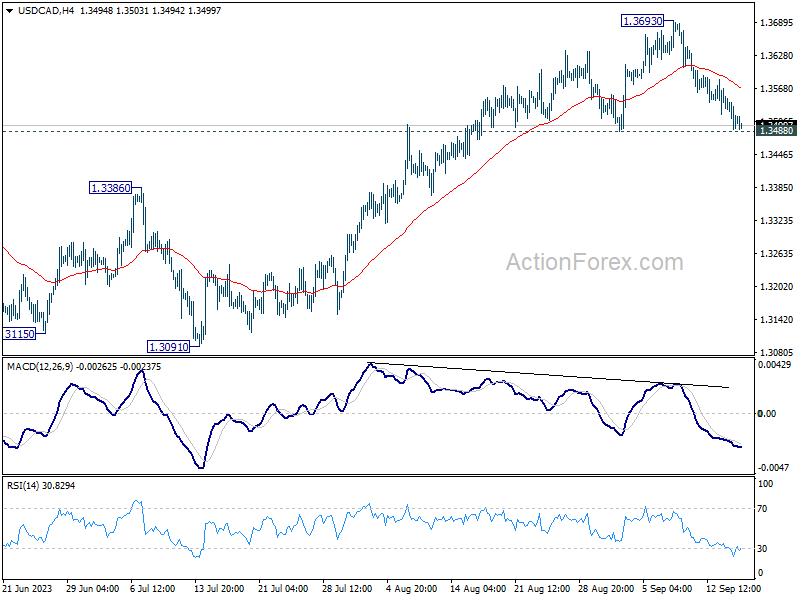
In the bigger picture, price actions from 1.3976 are viewed as a corrective pattern. Strong support from 55 D EMA (now at 1.3465) will solidify the case that it has completed with three waves down to 1.3091 already. Break of 1.3976 will target 61.8% projection of 1.2005 to 1.3976 from 1.3091 at 1.4309. However, sustained break of 55 D EMA will indicate that the pattern is extending with another falling leg before completion.