Sample Category Title
AUD/USD Daily Report
Daily Pivots: (S1) 0.6375; (P) 0.6409; (R1) 0.6436; More...
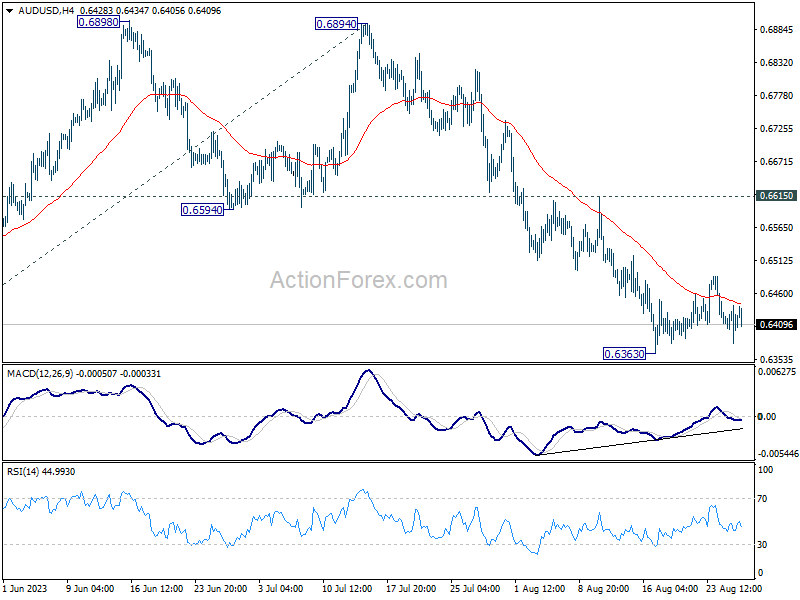
Intraday bias in AUD/USD remains neutral as consolidation from 0.6363 is extending. While stronger recovery cannot be ruled out, upside should be limited by 0.6615 resistance. Break of 0.6363 will resume larger fall from 0.7156 to 100% projection of 0.7156 to 0.6457 from 0.6894 at 0.6195.
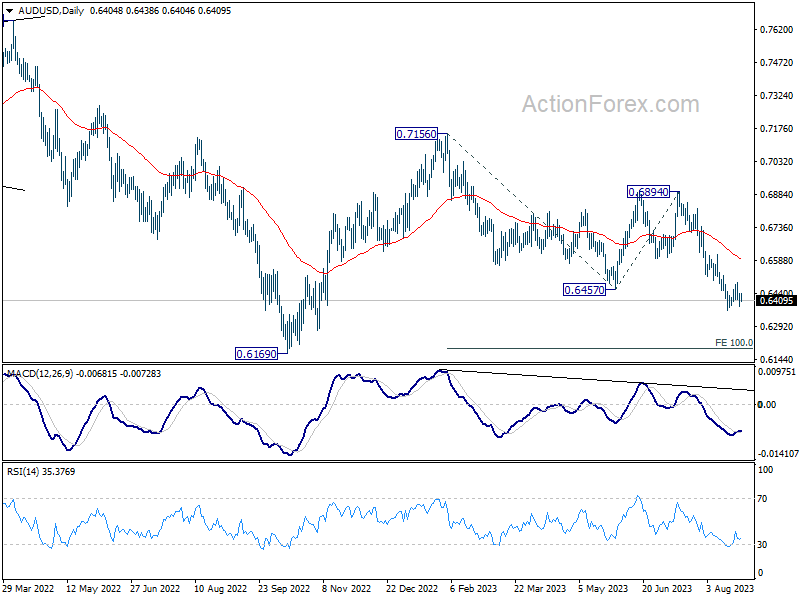
In the bigger picture, current development argues that the down trend from 0.8006 (2021 high) is still in progress. Decisive break of 0.6169 will target 61.8% projection of 0.8006 to 0.6169 to 0.7156 at 0.6021. This will now remain the favored case as long as 0.6894, in case of strong rebound.
USD/JPY Daily Outlook
Daily Pivots: (S1) 145.89; (P) 146.26; (R1) 146.79; More...
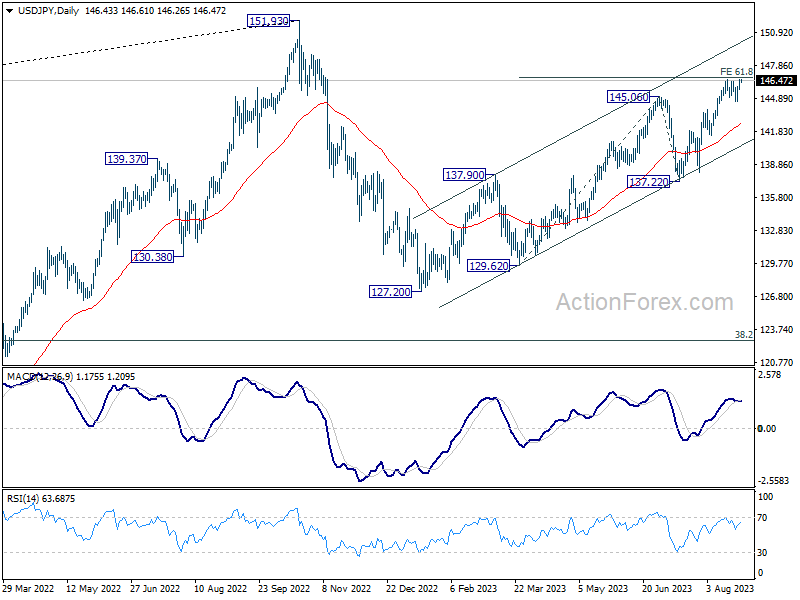
Intraday bias in USD/JPY remains mildly on the upside for the moment. Sustained break of 61.8% projection of 129.62 to 145.06 from 137.22 at 146.76 will pave the way to retest 151.93 high. For now, outlook will stays cautiously bullish as long as 144.52 support holds, in case of retreat.
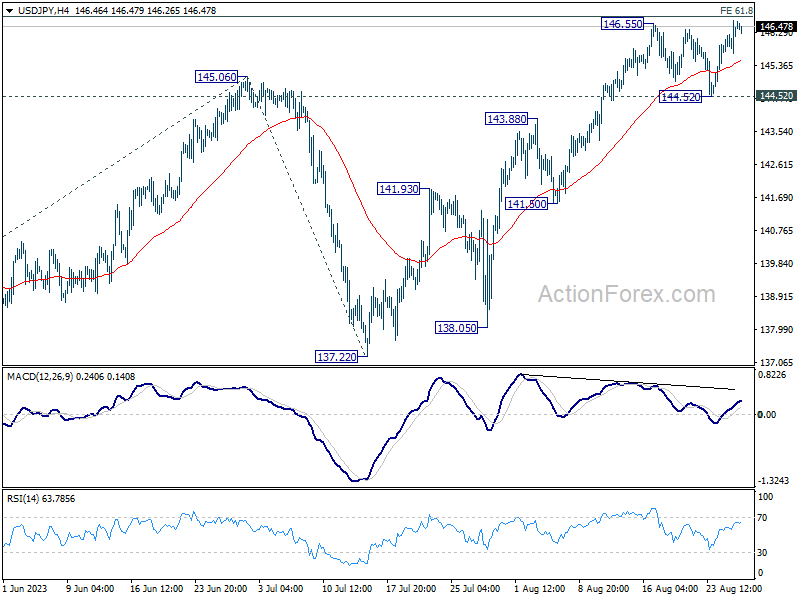
In the bigger picture, overall price actions from 151.93 (2022 high) are views as a corrective pattern. Rise from 127.20 is seen as the second leg of the pattern and could still be in progress. But even in case of extended rise, strong resistance should be seen from 151.93 to limit upside. Meanwhile, break of 137.22 support should confirm the start of the third leg to 127.20 (2023 low) and below.
USD/CHF Daily Outlook
Daily Pivots: (S1) 0.8820; (P) 0.8848; (R1) 0.8874; More....
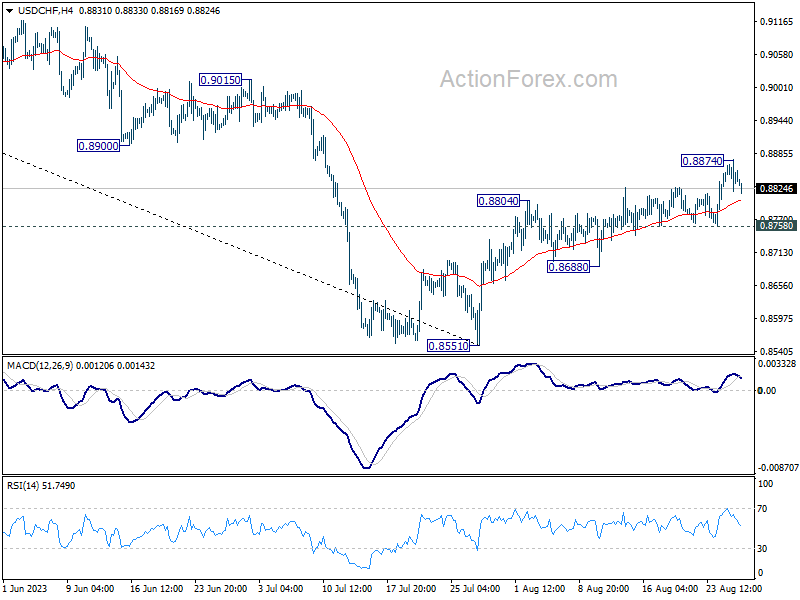
Intraday bias in USD/CHF is turned neutral with today's retreat. But further rally is expected with 0.8758 support intact. Break of 0.8874 will resume the rise from 0.8551 to 0.9146 cluster resistance next.
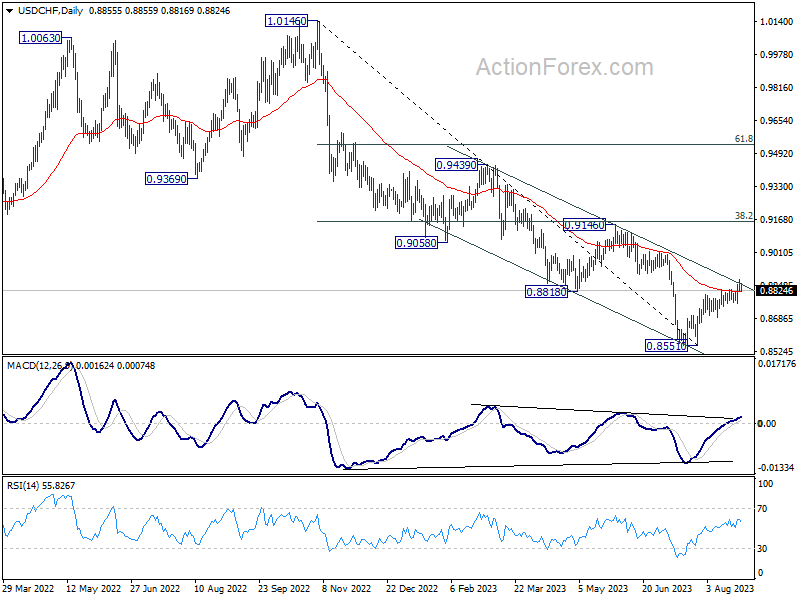
In the bigger picture, rebound from 0.8551 medium term bottom is currently seen as a correction to the downtrend from 1.0146 (2022 high). Further rally would be seen to 0.9146 cluster resistance (38.2% retracement of 1.0146 to 0.8551 at 0.9160). Strong resistance could be seen there to limit upside, at least on first attempt. Nevertheless, medium term outlook is neutral at best as long as 0.8551 holds, until further developments.
EUR/USD Daily Outlook
Daily Pivots: (S1) 1.0761; (P) 1.0801; (R1) 1.0837; More...
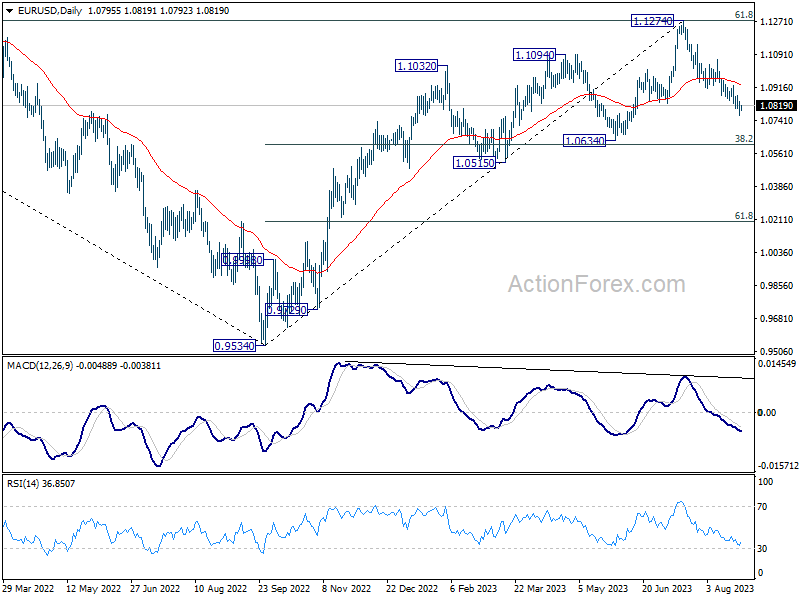
Intraday bias in EUR/USD stays on the downside for the moment. Current fall from 1.1274 should target 1.0609/34 cluster support next. On the upside, break of 1.0929 resistance is needed to indicate short term bottoming. Otherwise, outlook will remain bearish in case of recovery.
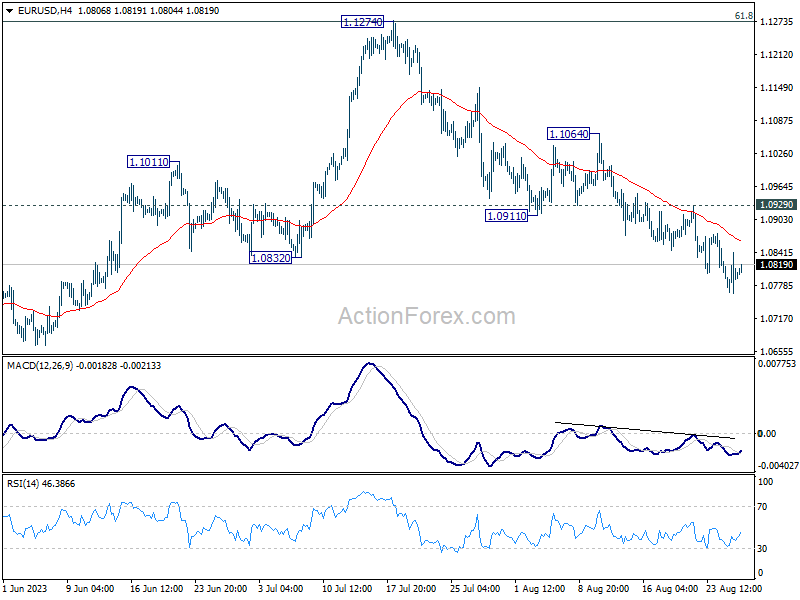
In the bigger picture, fall from 1.1274 medium term top is seen as a correction to up trend from 0.9534 (2022 low). Deeper decline would be seen to 1.0634 cluster support (38.2% retracement of 0.9534 to 1.1274 at 1.0609). Strong support could be seen there, at least on first attempt, to bring rebound. Yet, medium term outlook will be neutral for now, as long as 1.1274 resistance holds.
CADJPY Dips Keep Finding Buyers At Equal Legs Area
In this technical blog, we will look at the past performance of the 1-hour Elliott Wave Charts of the CADJPY. The rally from the 28 July 2023 low showed a higher high sequence & provided a short-term extreme trading opportunity. In this case, the pullback managed to reach the equal legs area & provided a buying opportunity. So, we advised members not to sell it but to buy the equal legs area for a minimum reaction higher to happen. We will explain the structure & forecast below:
CADJPY 1-Hour Elliott Wave Chart From 8.23.2023
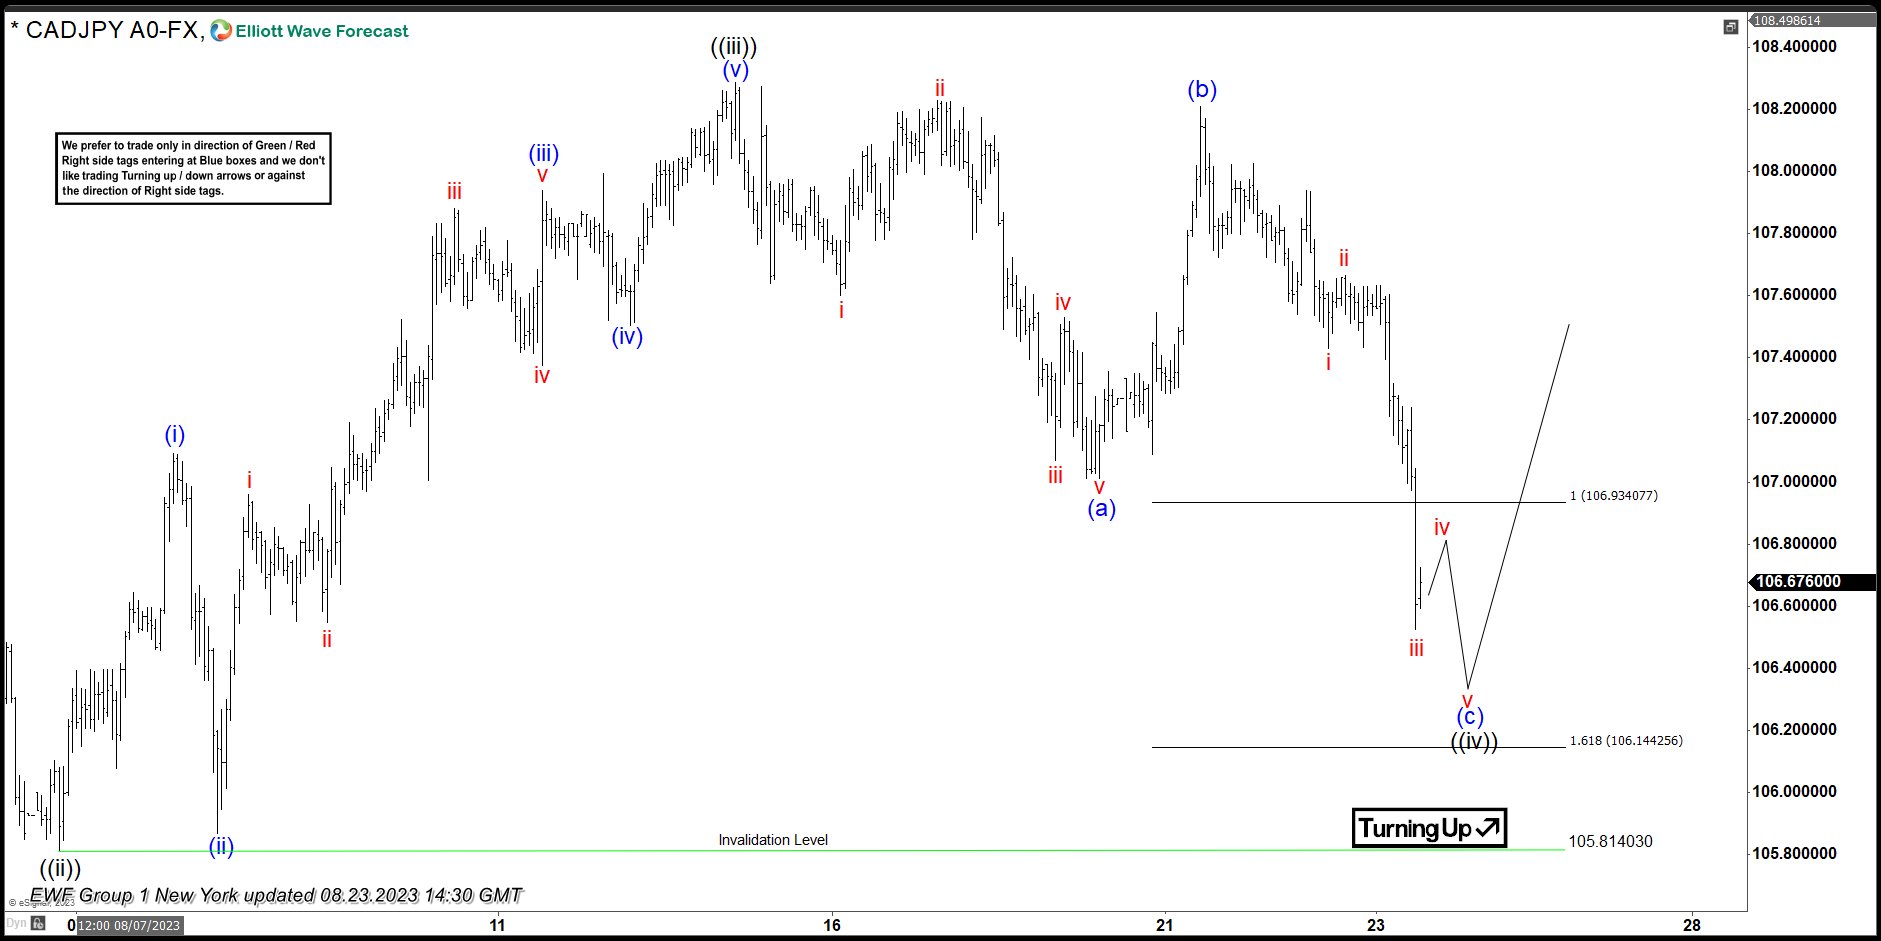
Here’s the 1-hour Elliott wave Chart from the 08/23/2023 New York update. In which, the rally to 108.28 high ended the wave ((iii)) & made a pullback in wave ((iv)). The internals of that pullback unfolded as Elliott wave zigzag structure where lesser degree wave (a) ended at 101.01 low. Then a short-term bounce to 108.20 high ended wave (b) & started the next leg lower in wave (c) towards 106.93- 16.14 equal legs area. From there, buyers were expected to appear looking for new highs ideally or for a 3-wave bounce minimum.
CADJPY Latest 1-Hour Elliott Wave Chart From 8.26.2023
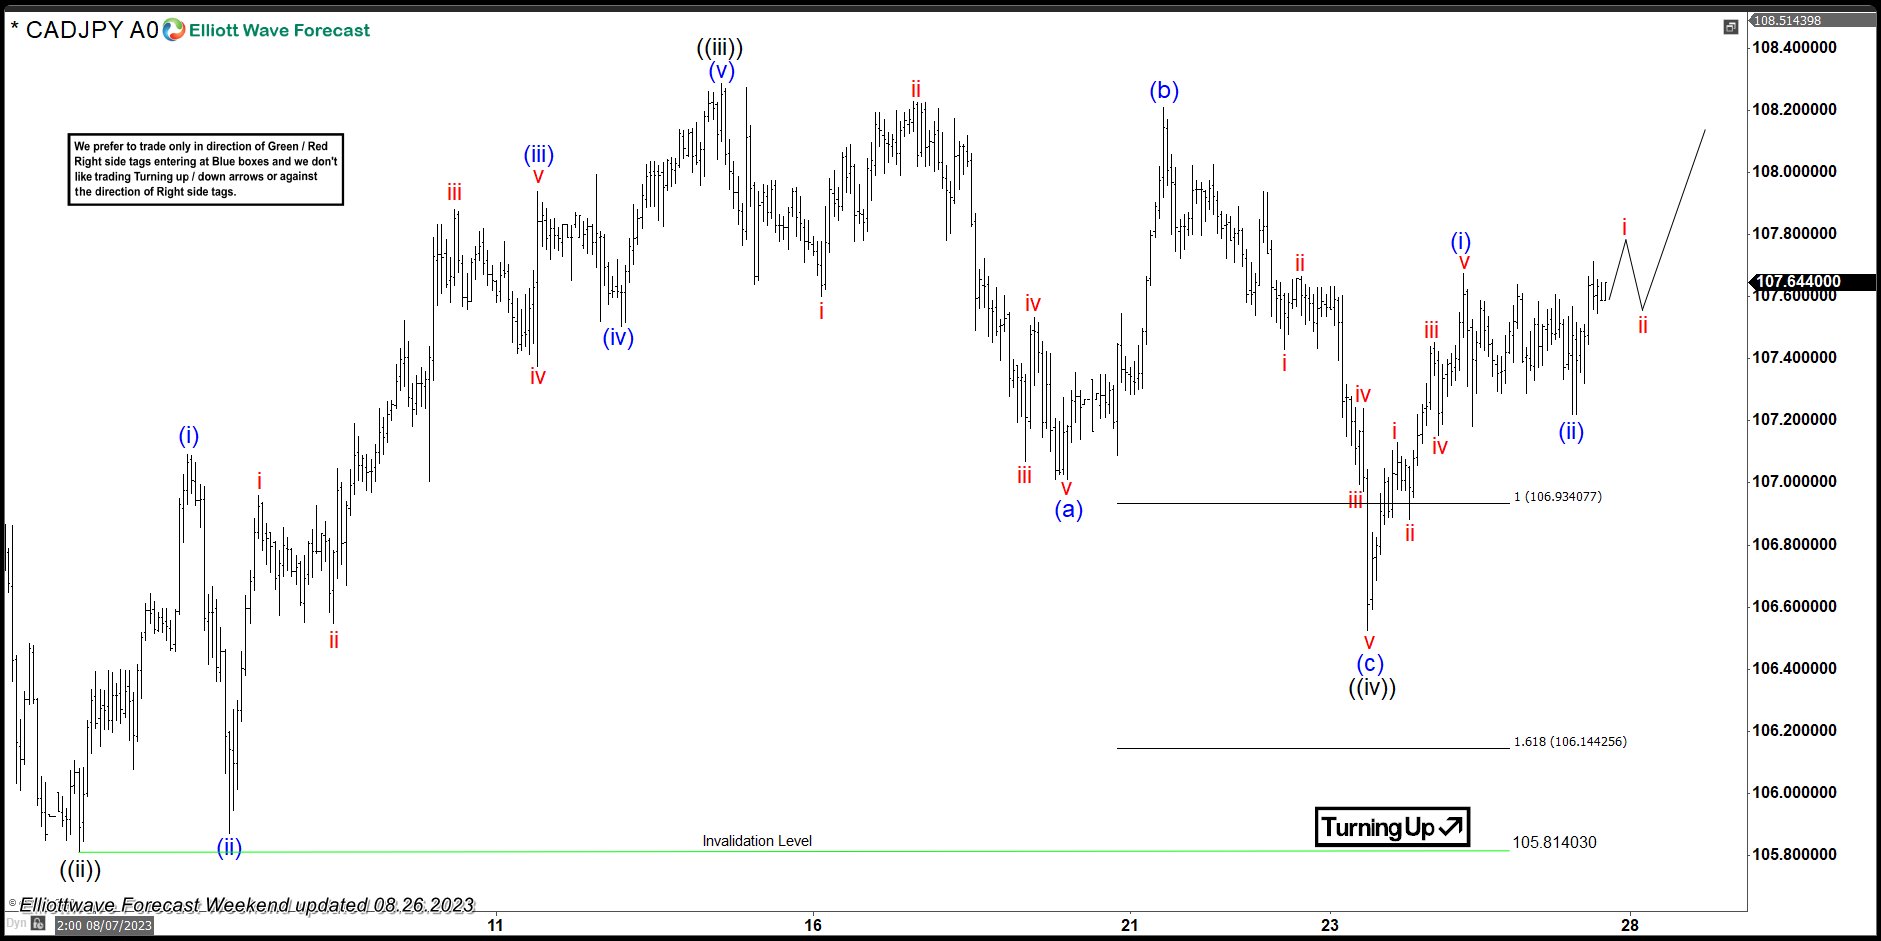
Above is the Latest 1-hour Elliott wave Chart from the 8/26/2023 Weekend update. In which the pair is showing a reaction higher taking place from the equal legs area. Right after ending the zigzag correction. Allowed members to create a risk-free position shortly after taking a long position. But a break above 108.28 high would still be needed to confirm the next leg higher minimum towards the 108.68- 109.35 area before the next pullback takes place.
E-mini S&P 500 Reacts Positively to Powell’s Speech
According to the head of the Fed's Friday words:
→ Strengthening the economy may lead to rising inflation and require new increases;
→ the Fed will tread lightly in upcoming meetings;
→ the Fed is ready to continue raising rates if necessary.
Overall, there were no surprises and the surge in financial market volatility was relatively minor. The dollar index rose sharply, but then by the end of the trading week it gradually decreased — the fact that the bulls could not keep the progress made can be interpreted as a bearish sign due to the emotions of market participants during the speech of the head of the Fed.
And gold, on the contrary, decreased in price, but then won back the losses. The stock market works in a similar way.
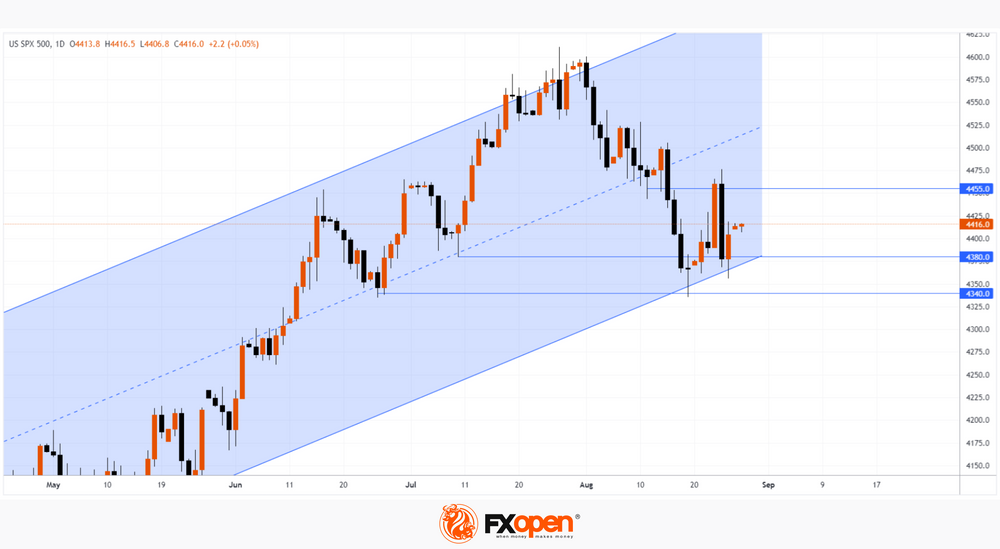
The S&P 500 Index chart shows that:
→ the price of the index finds support in the 4,340-4,380 zone, where the June-July lows were formed;
→ price support is also noticeable from the lower border of the rising channel, which has been operating all summer;
→ the week started near Friday's high – that is, after the weekend, market participants find positivity after the Friday speech of the head of the Fed.
However, the overall picture is thickening with broad bearish impulses:
→ August 15-18;
→ 24th August.
It is possible that supply and demand can find a balance so that the price of the S&P 500 index will consolidate within the range, which is limited by the 4,340-4,380 zone from below and the resistance level of 4,455 from above.
This article represents the opinion of the Companies operating under the FXOpen brand only. It is not to be construed as an offer, solicitation, or recommendation with respect to products and services provided by the Companies operating under the FXOpen brand, nor is it to be considered financial advice.
Aussie Finally Stems Its Losses
The Aussie finally stabilised last week, with US dollar price action mixed and China stepping up its defence of the yuan. This week’s crowded calendar includes Australia July CPI and Q2 capex, a speech by RBA’s Bullock, Eurozone August CPI and US non-farm payrolls.
The Aussie climbed off the mat last week, holding its ground against the US dollar and rising modestly on most key cross rates. Several factors seemed to be helping after about 5 weeks of pressure.
On Wednesday, the US dollar slipped in line with US yields, as advance August PMI surveys reported a slowdown in both manufacturing and services. This was AUD/USD’s strongest day of the week, as it reached what turned out to be the week’s high at 0.6488.
Also lending support on Wednesday was a rebound in equity prices, MSCI World jumping 1%, its best day since 13 July. This rally may have been at least partly inspired by the fall in US rates, but at times last week there was also an improvement in sentiment as Chinese authorities strengthened their attempts to shore up the yuan and – more difficult – restore confidence in local equity markets.
This continued over the weekend, when China’s Ministry of Finance announced it was cutting stamp duty on share transactions from 0.1% to 0.05%, sparking a strong opening to trade to start the week. But investors generally view China’s policy steps as too timid. This included the decision to hold steady at 4.20% the 5-year loan prime rate which is closely linked to mortgage rates. Economists had expected a 15bp cut.
It may be that a very downbeat China view is already priced into markets. The weekly report on US futures markets shows asset managers held a record A$ net short position last week, equivalent to -AUD9.3bn. This could mean that even a fresh round of negative headlines around China’s property market or growth prospects might not have a major impact near term.
The Australian dollar’s direction this week should at least be informed by a lot more data and commentary than last week’s very quiet calendar. Markets seem likely to focus most closely on a speech by RBA Deputy Governor Bullock, July consumer prices and Q2 readings on business investment and construction that will help shape forecasts of Q2 GDP due 6 September.
Of these, July CPI is probably most market-sensitive. Consensus is 5.2%yr versus 5.4%yr in June, but Westpac looks for 4.8%, assuming some downward pressure from state electricity rebates.
Whether the US dollar’s yield support steps higher again will also be key. Markets were volatile as Fed Chair Powell spoke at the annual Jackson Hole conference, but the 2-year yield closed higher on the week. At 5.07%, it is matching its early March level, before it tumbled in response to regional bank failures.
US data is released throughout the week but of course the August employment report is the highlight. Consensus is for non-farm payrolls growth to slow to 150k from 172k but for the unemployment rate to remain at 3.5%.
Event risk
Aust Jul retail sales, UK bank holiday (Mon), RBA Deputy Governor Bullock speaks, US Aug consumer confidence (Tue), Aust Jul CPI, Q2 construction work and Jul dwelling approvals, US revised Q2 GDP (Wed), Aust Q2 private capex, 2023/24 investment plans and Jul private credit, China Aug manufacturing and services PMIs, Eurozone Aug CPI, US Jul personal income and spending (Thu), Aust Aug home prices, Jul housing finance, Singapore holiday, US Aug non-farm payrolls, Aug ISM manufacturing (Fri).
AUD/USD Technical: Potential Minor Countertrend Rebound in Progress
- Medium-term downtrend phase of AUD/USD has reached an oversold condition with downside momentum easing.
- Key short-term support to watch will be at 0.6385.
- Intermediate resistance at 0.6490.
The price actions of AUD/USD have been oscillating in a medium-term downtrend phase in place since the 17 July 2023 high which has been reinforced by the bearish breakdown of its former medium-term ascending trendline support from 13 October 2022 low on 9 August 2023.
So far, the AUD/USD has plummeted by -530 pips from its 17 July 2023 high to its 17 August 2023 low of 0.6365, and the recent four weeks of decline have led to an oversold condition in terms of price actions.
Medium-term downside momentum has shown signs of easing
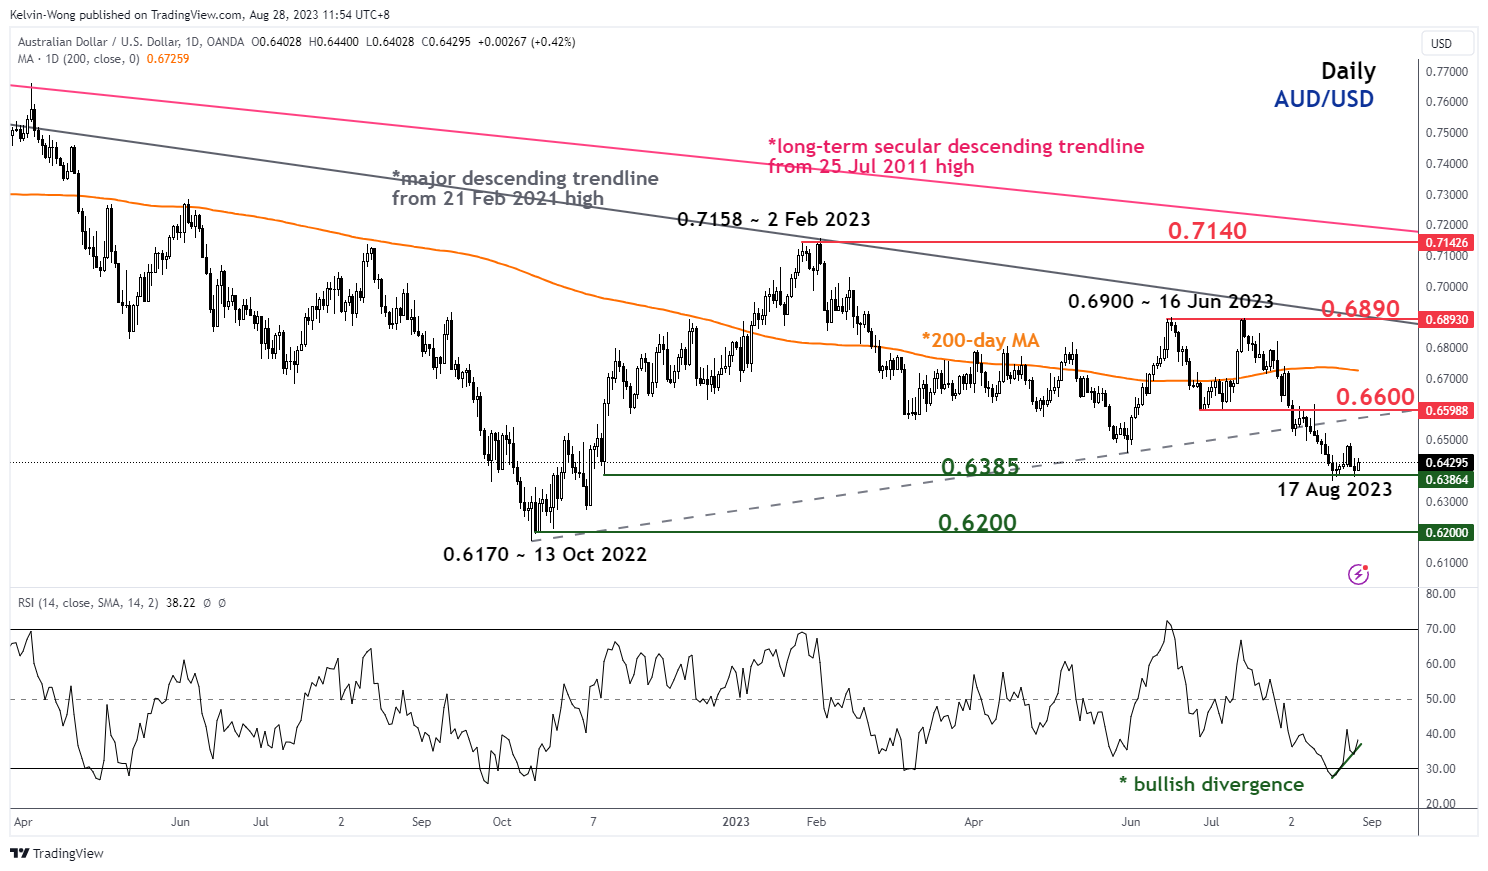
Fig 1: AUD/USD medium-term trend as of 28 Aug 2023 (Source: TradingView, click to enlarge chart)
The daily RSI oscillator of the AUD/USD, a gauge that measures momentum, oversold, and overbought conditions on price actions reached an oversold condition recently on 17 August 2023 and shaped a bullish divergence condition (a higher low) thereafter on last Friday, 25 August.
These observations suggest that the downside momentum of the ongoing medium-term downtrend of AUD/USD may have eased which supports a potential imminent minor countertrend/consolidation phase.
These positive elements have also occurred at a key support of 0.6385 that coincided with the 10 November 2022 low and the 76.4% Fibonacci retracement of the prior medium-term up move from 13 October 2022 low to 2 February 2023 high.
Watch minor range resistance at 0.6490
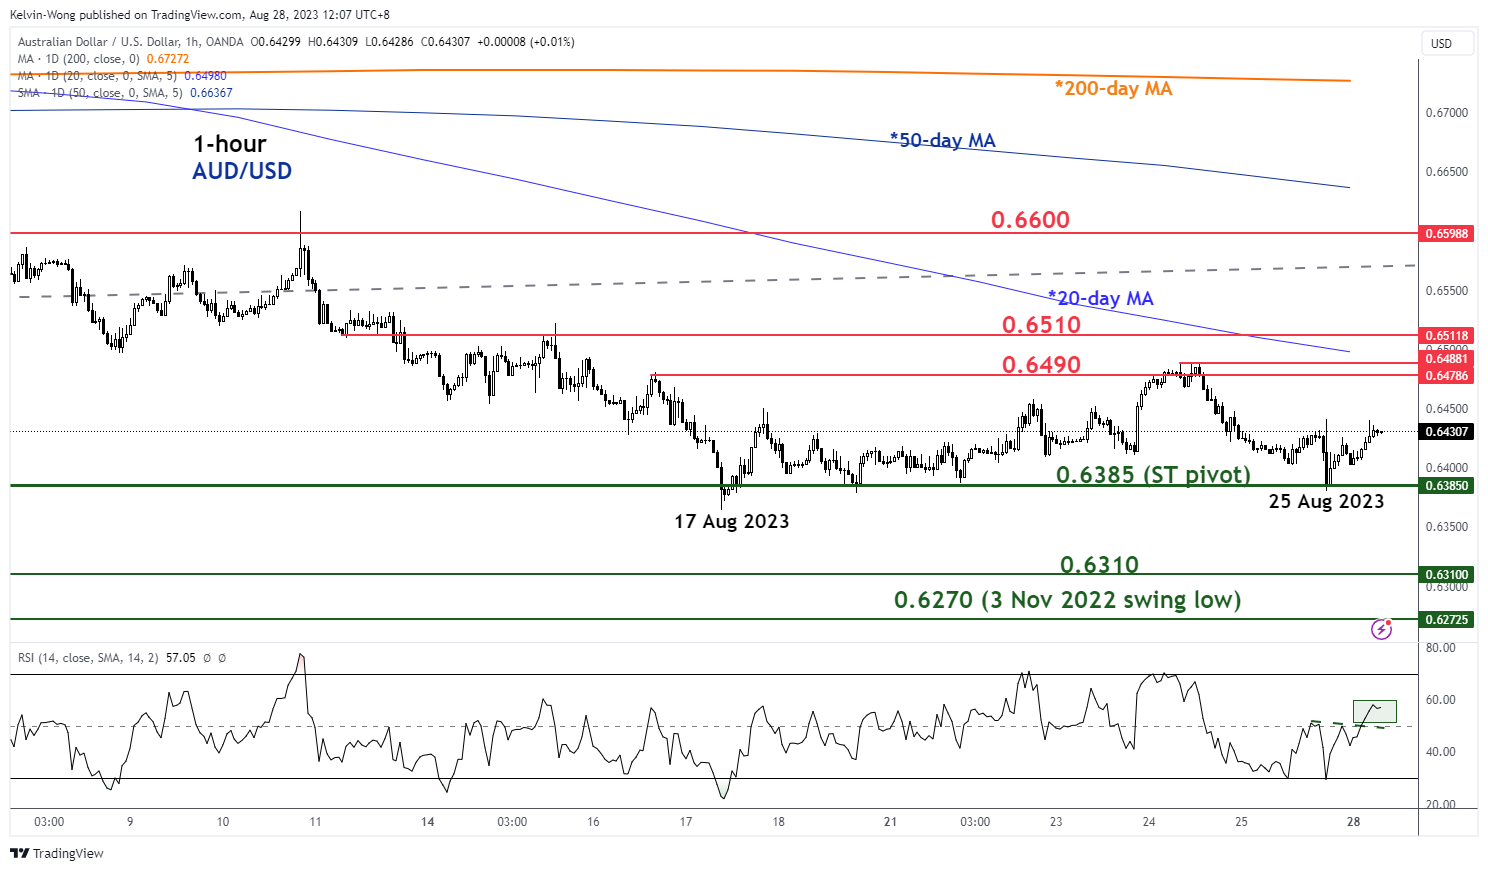
Fig 2: AUD/USD minor short-term trend as of 28 Aug 2023 (Source: TradingView, click to enlarge chart)
Since its 17 August 2023 low, the price actions of AUD/USD have started to evolve into a minor range configuration with its key short-term pivotal support at 0.6385 and respective minor range resistance at 0.6490 (also the 20-day moving average).
A clearance above 0.6490 sees the next resistances coming in at 0.6510 and 0.6600 (5 August/10 August 2023 minor swing highs areas, pull-back resistance of the former medium-term ascending trendline support from 13 October 2022 low & the 50-day moving average).
However, failure to hold the 0.6385 key short-term support invalidates the minor countertrend rebound scenario for a continuation of the impulsive down move sequence of the medium-term downtrend phase towards the next supports at 0.6310 and 0.6270 in the first step.
Chinese Stock Markets Outperform This Morning
Markets
In its long awaited speech at the Jackson Hole Symposium, Chair Powell reiterated the Fed’s commitment to bring inflation back to the 2% target. Economic developments and the Fed’s policy have brought inflation down from peak levels, but prices rises remain too high. Powell didn’t bring any specifics on the cycle peak rate. But in a data dependent approach the Fed remains prepared to raise rates further if needed and intends to hold the policy rate at a restrictive level until it can be confident data inflation will settle near the target in a sustainable way. Goods inflation has fallen sharply and housing related inflation turned the corner. Core services inflation recently also show signs of easing, but the process develops slowly as it is affected by a tight labour market. There are signs of labour market normalization and of wage increases easing, but this process is incomplete. The Fed remains attentive that the economy may not be cooling as expected/needed. Powell didn’t elaborate on the topic of a potential higher neutral rate. Even as the Fed Chair didn’t give any specifics on what to expect for the September meeting, markets (correctly) understood the message as guardedly hawkish. The curve inverted slightly with the 2-y rising 5.6 bps and holding well above 5.0%. The 30-y declined marginally (-1.8 bps). German yields staged a catch-up move after the post-PMI Bund outperformance with yields rising between 7.7 bps (2-y) and 4.4 bps (30-y). ECB Chair Lagarde also didn’t give concrete guidance on the ECB’s intentions for the upcoming meeting. (US) investors felt comfortable with Powell’s ‘guidance’ that the Fed will proceed carefully when deciding on next steps (S&P 500 +0.67%). The dollar mostly closed slightly higher, but off the intraday peak levels (DXY close 104.07; EUR/USD 1.0796.). The yen still underperformed with USD/JPY almost exactly testing the YTD top of 146.62.
This morning, sentiment on Asian markets is constructive in the wake of Friday’s WS performance and measures from Chinese authorities to support market activity (cf infra). The eco calendar is thin today, but keep an eye at the sale of US 2 & 5-year notes. Later this week, interesting US data include consumer confidence and JOLTS job openings (Tuesday), ADP labour market report (Wednesday), the US PCE deflator (Thursday) and the payrolls and the manufacturing ISM on Friday. In EMU, German and EMU inflation data will take center stage (Thursday/Friday). We assume the downside in US and German yields to stay well protected going into Friday’s US payrolls. The dollar remains captured in a buy-on-dips pattern. A break of USD/JPY above 146.63 and/or DXY above 104.7 would further improve the picture for the US currency.
News and views
The Chinese Ministry of Finance reduced the stamp duty on stock trades for the first time since 2008. The levy will halve from 0.1% to 0.05% and is one of several measures to “invigorate capital markets and boost investor confidence”. The Chinese Securities Regulatory Commission also announced a slowdown in the pace of IPO’s while top stakeholders will be restricted to sell shares at firms whose stock prices have fallen below IPO levels or net asset levels. Another measure is to lower margin ratios for leveraged trades. Chinese stock markets outperform this morning, gaining up to 2%. Part of the optimism is tempered though by the 87% share price drop in Chinese property giant Evergrande after a 17-month trading halt. The defaulted developer is undergoing a debt restructuring process and this weekend reported a loss attributable to shareholders of 33bn yuan for H1 2023. They also delayed creditor meetings on its offshore debt restructuring proposal hours before they were planned (today). The yuan remains in dire straits, failing to leave the USD/CNY 7.30 area (matching 2022 top & weakest CNY since end 2007).
Rating agency Fitch on Friday affirmed the Czech Republic’s AA- rating with a negative outlook. The latter reflects a deterioration in public finances. Increased government spending on energy compensation measures and pensions is expected to increase this year’s budget deficit to 3.8% of GDP with lower than expected revenue from indirect taxes playing a role as well. The debt to GDP ratio is expected to increase marginally from 44.2% to 44.7% and remain near this level until 2027. Growth is projected to flatline this year and recover to 2.2% and 2.4% in 2024 and 2025.
GBP/USD Daily Outlook
Daily Pivots: (S1) 1.2535; (P) 1.2594; (R1) 1.2641; More...
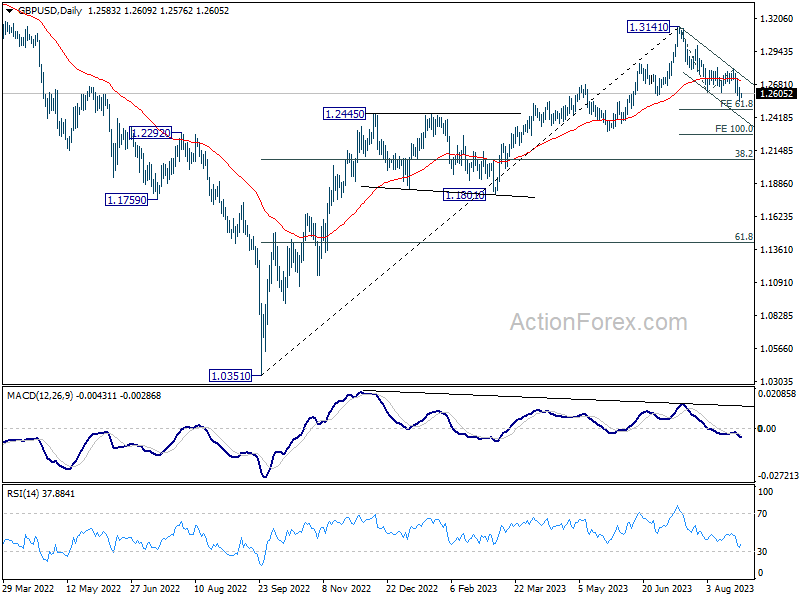
Intraday bias in GBP/USD is turned neutral first with today's recovery. But near term outlook stays mildly bearish as long as 1.2799 resistance holds. Below 1.2546 will resume whole fall from 1.3141 to 61.8% projection of 1.3141 to 1.2618 from 1.2799 at 1.2476. Firm break there could prompt downside acceleration to 100% projection at 1.2276.
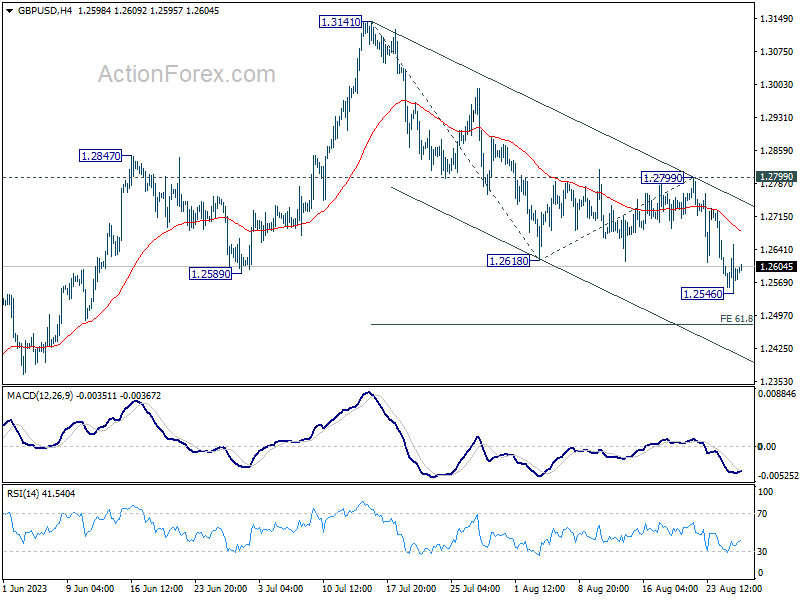
In the bigger picture, for now, fall from 1.3141 medium term top is seen as a correction to up trend from 1.0351 (2022 low). Deeper decline would be seen to 38.2% retracement of 1.0351 to 1.3141 at 1.2075. Strong support would be seen there to bring rebound on first attempt. But outlook will be neutral at best as long as 1.3141 resistance holds, and consolidation from there is set to extend, until further development.