Sample Category Title
Stocks Surge on China’s Investor “Friendly” Measures; Markets Brace for Important Data This Week
Asian equities witnessed an upswing today, buoyed by China's announcement of several initiatives aimed at enticing investors back into the market. Among these measures, the decision to trim the stamp duty on stock transactions and a more gradual roll-out of initial public offerings captured investors' attention. Adding to the positive sentiment was the unexpected move by regulators to impose restrictions on share sales by major stakeholders of companies whose share prices have plunged below IPO or net asset values. Additionally, regulators have tweaked the margin ratios for leveraged trades, a move that took many by surprise.
On the forex front, Australian Dollar experienced an uptick, bolstered by a revival in risk appetite and further supported by the upbeat retail sales data. New Zealand Dollar and Sterling followed closely, staking their positions as the next strongest currencies. Conversely, Dollar and Yen are trailing the pack for the day. Euro, Swiss Franc, and Canadian Dollar are mixed.
Despite these dynamics, overall market fluctuations remain on the restrained side. Traders are poised with anticipation for the array of high-caliber economic releases set to be unveiled later this week. Among these, US non-farm payrolls, Eurozone's CPI flash estimates, and China's PMIs are particularly in the limelight.
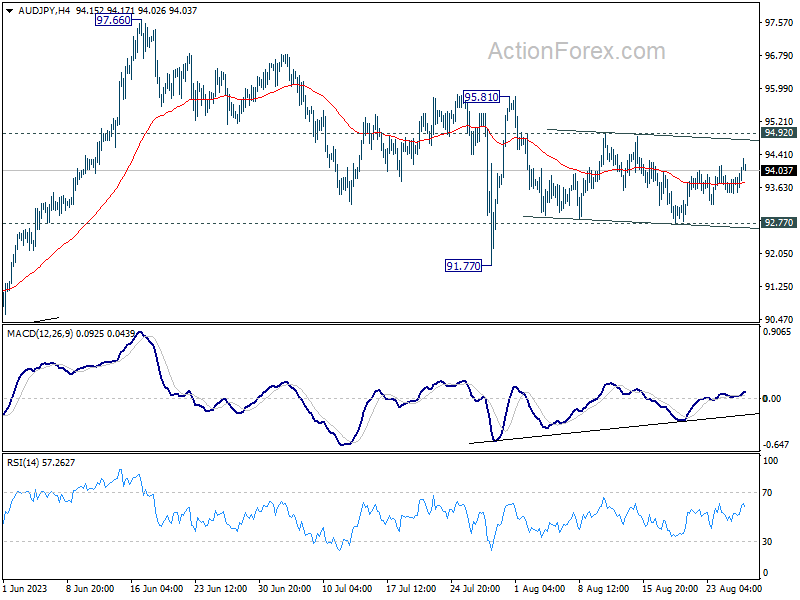
Technically, while AUD/JPY is one of the top movers for the day, it's actually still bounded in familiar range established since last week. For now, further decline will remain in favor as long as 94.92 minor resistance holds. Break of 92.77 support should resume whole fall from 97.66 high through 91.77 support. Nevertheless, break of 94.92 will now be a sign of bullish reversal and turn focus to 95.81 structural resistance.
In Asia, Nikkei closed up 1.73%. Hong Kong HSI is up 1.12%. China Shanghai SSE is up 1.02%. Singapore Strait Times is up 0.98%. Japan 10-year JGB yield is up 0.0016 at 0.662.
BoJ Ueda: Underlying inflation is still a bit below our target
In the face of mounting economic uncertainties, BoJ Governor Kazuo Ueda provided insights on Japan's monetary stance and the regional economic dynamics. Bank of Japan, despite witnessing annual inflation of 3.1% in July, anticipates softening of this rate towards year-end.
Speaking on Saturday at the Jackson Hole Symposium, Ueda remarked, "We think that underlying inflation is still a bit below our target," subsequently justifying their persistence with the current monetary easing framework by stating, "This is why we are sticking with our current monetary easing framework."
Despite the inflationary indicators, health of Japan's domestic demand remains a focal point for the central bank. Ueda highlighted that domestic demand appears to maintain a "healthy trend," but swiftly added a caveat: "although that's something that needs to be checked with" Q3 data.
Addressing the wider Asian economic landscape, Ueda did not mince his words, labeling China's recent economic deceleration a "disappointment," and highlighting July's data as skewing "on the weak side." Diving deeper into China's challenges, he pinpointed, "The underlying problem appears to be the adjustment in the property sector and the spillover to the rest of the economy."
However, it's not all gloomy on the horizon. Ueda acknowledged the US economy's resilience, noting its "relative strength" as a potential counterbalance, offering "some offset" to Japan amidst regional economic fluctuations.
Fed Mester: Another hike needed as timing crucial in taming inflation
Cleveland Fed President Loretta Mester indicated her support for another rate hike, albeit with flexibility on its exact timing. "It doesn't necessarily have to be September, but I think this year," she commented on Saturday.
Mester's focus was clear: Fed needs to bring inflation down to 2% target by the end of 2025. "The longer we let inflation remain above 2%, we're building in a higher and higher price level," she stressed, adding, "that's why timely matters to me."
Mester acknowledged that her stance in June favored rate cuts in the latter half of 2024. However, this could be subject to revision at the upcoming September rate-setting meeting, in light of the current inflation dynamics.
"I'm going to have to reassess that because, again, it's going to be, how quickly do you think inflation is moving down?" she mused. "I do not want to be in a position of prematurely loosening policy."
Australia retail sales rose 0.5% mom in Jul, but underlying growth subdued
Australia's retail sales turnover for July showed a 0.5% mom increase, reaching AUD 35.38B, surpassing anticipated 0.3% mom rise. When compared to figures from July 2022, turnover has risen by 2.1% yoy.
Commenting on the rebound, Ben Dorber, ABS head of retail statistics, noted, "The rise in July is a partial reversal of last month's sharp decline in turnover." He attributed the June dip to "weaker-than-usual end of financial year sales."
However, Dorber cautioned against interpreting July numbers as a sign of robust retail health. Elaborating on the sector's underlying momentum, he stated, "While there was a rise in July, underlying growth in retail turnover remained
Supporting this perspective, Dorber pointed out the lack of substantial movement in the trend terms: "In trend terms, retail turnover was unchanged in July and up only 1.9 per cent compared to July 2022, despite considerable price growth over the year."
US jobs, Eurozone inflation, and China
As the curtain rises on a crucial week for global financial markets, a myriad of economic data awaits interpretation. Whether it's gauging the job market and prices pressures in the US, assessing Eurozone's inflationary pulse, or understanding the ripples of China's property market turmoil, every piece of data promises to be a significant piece in puzzle, which might chart the course for the remainder of the year.
From the US, eyes are keenly set on PCE inflation data and non-farm payrolls. July's core PCE is anticipated to show a marginal uptick, and there is an impending sense of a slowdown in job and wage growth, as indicated by the forthcoming NFP report. Although the market is largely leaning towards a pause from Fed in September, Chair Jerome Powell's recent emphasis on combating inflation at the Jackson Hole symposium cannot be ignored. Unexpected leaps in inflation or employment data might further fuel speculations about an additional rate hike from Fed this year. Moreover, ISM Manufacturing and consumer confidence metrics are also in the spotlight.
Turning to Eurozone, release of August CPI flash estimates is predicted to exhibit a slight deceleration in both headline and core inflation. ECB President Christine Lagarde has adeptly sidestepped signaling her plan in September. However, the hawkish sentiment seems to be resonating louder among ECB members in recent times. Should the data align with market forecasts, this could solidify expectations of an impending rate increase. The next steps for ECB remain uncertain, contingent heavily on the future economic projections.
Down under, Australia's monthly CPI release is under the magnifying glass. A split opinion exists on whether the existing 4.10% stands as the peak for the tightening cycle. With the expectations leaning towards a more stringent stance, all eyes will be on RBA Gov-Designate Michelle Bullock, whose insights could offer some direction.
Lastly, in the heart of Asia, China's PMI data will be closely scrutinized. Amidst ongoing supply chain realignment across the continent, hopes for a significant recovery in the manufacturing sector seem dim. The larger quandary revolves around the recent turbulence in China's real estate sector and its ripple effects on the service industry. August's PMI figures could shed light on these developments and are expected to profoundly influence risk markets across Asia.
Here are some highlights for the week:
- Monday: Australia retail sales; Eurozone M3 money supply.
- Tuesday: Japan unemployment rate; Germany Gfk consumer sentiment; US house price index, consumer confidence.
- Wednesday: New Zealand building permits; Australia monthly CPI, building approvals; Japan consumer confidence; Germany import prices, CPI flash; Swiss KOF economic barometer, Credit Suisse economic expectations; UK M4 money supply, mortgage approvals; US ADP employment, GDP revision, goods trade balance; wholesale inventories, pending home sales.
- Thursday: Japan industrial production, retail sales, housing starts; New Zealand ANZ business confidence; China PMIs; Germany retail sales, unemployment; Swiss retail sales; France consumer spending; Eurozone CPI flash, unemployment rate, ECB meeting accounts; Canada current account; US jobless claims, personal income and spending, PCE inflation, Chicago PMI.
- Friday: Japan capital spending, PMI manufacturing final; China Caixin PMI manufacturing; Swiss CPI, PMI manufacturing; Eurozone PMI manufacturing final; UK PMI manufacturing final; Canada GDP, PMI manufacturing; US non-farm payrolls, ISM manufacturing, construction spending.
GBP/USD Daily Outlook
Daily Pivots: (S1) 1.2535; (P) 1.2594; (R1) 1.2641; More...
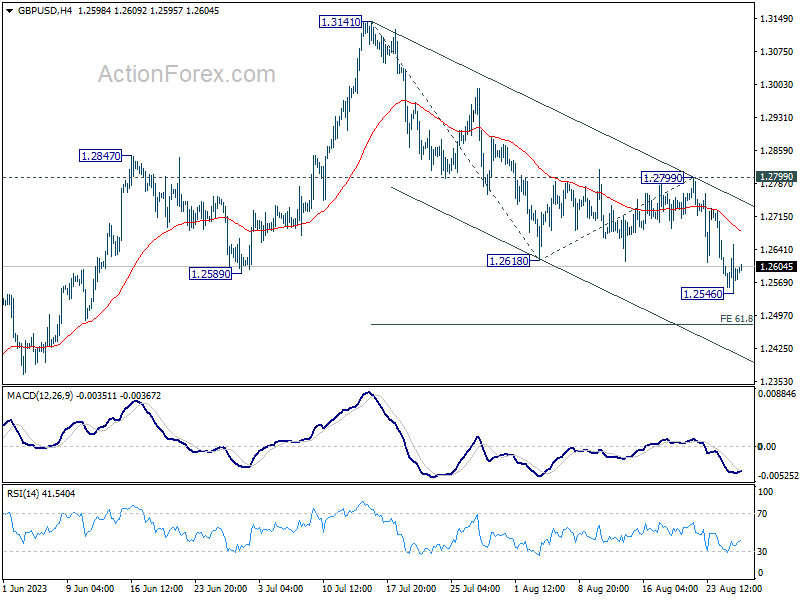
Intraday bias in GBP/USD is turned neutral first with today's recovery. But near term outlook stays mildly bearish as long as 1.2799 resistance holds. Below 1.2546 will resume whole fall from 1.3141 to 61.8% projection of 1.3141 to 1.2618 from 1.2799 at 1.2476. Firm break there could prompt downside acceleration to 100% projection at 1.2276.
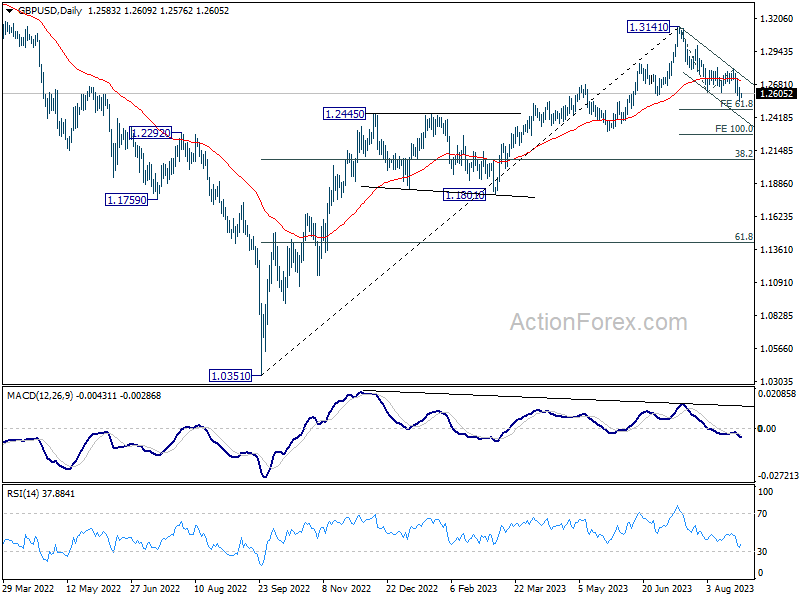
In the bigger picture, for now, fall from 1.3141 medium term top is seen as a correction to up trend from 1.0351 (2022 low). Deeper decline would be seen to 38.2% retracement of 1.0351 to 1.3141 at 1.2075. Strong support would be seen there to bring rebound on first attempt. But outlook will be neutral at best as long as 1.3141 resistance holds, and consolidation from there is set to extend, until further development.
Economic Indicators Update
| GMT | Ccy | Events | Actual | Forecast | Previous | Revised |
|---|---|---|---|---|---|---|
| 01:30 | AUD | Retail Sales M/M Jul | 0.50% | 0.30% | -0.80% | |
| 08:00 | EUR | Eurozone M3 Money Supply Y/Y Jul | 0.00% | 0.60% |
Here, Get More Stimulus
The Federal Reserve (Fed) Chair Jerome Powell’s Jackson Hole speech was boring, wasn’t it? Powell repeated that inflation risks remain to the upside despite recent easing and pointed at resilient US growth and tight US jobs market, and reiterated the Fed’s will to keep the interest rates at restrictive levels for longer. The US 2-year pushed above 5%, as Powell’s comments kept the idea of another 25bp hike on the table before the year end, but the rate hike will probably be skipped in September meeting and could be announced in the November meeting instead, according to activity on Fed funds futures. The US 10-year yield is steady between the 4.20/4.30%. The S&P500 gained a meagre 0.8% last week, yet managed to close the week above the 4400 mark and above its ascending trend base building since last October, while Nasdaq 100 gained 2.3% over the week, although Nvidia’s stunning results failed to keep the share price above the $500 mark, even though that level was hit after the results were announced last week. And the disappointing jump in Nvidia despite beating its $11bn sales forecast and despite boosting its sales forecast for this quarter to $16bn, was a sign that the AI rally is now close to exhaustion.
What’s up this week?
This week will be busy with some important economic data from the US. We will watch JOLTS job openings tomorrow, Australian and German CPIs and US ADP and GDP reports on Wednesday, to see if the US economy continues to be strong, and the jobs market continues to be tight. On Thursday, Chinese PMI numbers, the Eurozone’s CPI estimate and the US core PCE will hit the wire, and on Friday, we will watch the US jobs report and ISM numbers. Note that the US dollar index pushed to the highest levels since May after Powell’s Jackson Hole speech. The EURUSD is now trading a touch below its 200-DMA, even though the European Central Bank (ECB) chief Lagarde repeated that the ECB will push the rates as high as needed. Yet, the worsening business climate, and expectations in Germany somehow prevent the euro bulls from getting back to the market lightheartedly, while the yen shorts are comforted by the Bank of Japan (BoJ) governor’s relaxed view on price growth – which remains slower than the BoJ’s goal, but the possibility of a direct FX intervention to limit the USDJPY’s upside potential keeps the yen shorts reasonably on the sidelines, despite the temptation to sell the heck out of the yen with the BoJ’s incredible policy divergence versus the rest of the developed nations.
Here, get more stimulus
The week started upbeat in China and in Hong Kong, after the government announced measures to boost appetite for Chinese equities. Beijing halved the stamp duty on stock trades, while Hong Kong said it plans a task force to boost liquidity. The CSI 300 rallied more than 2% and HSI jumped more than 1.5%. But gains remain vulnerable as data released yesterday showed that Chinese company profits fell 6.7% last month from a year earlier. That’s lower than 8.3% printed in June, but note that for the first seven months of 2023, profits declined 15.5%, and that is highly disquieting given the slowing economic growth and rising deflation risks, along with the default risks for some of the country’s biggest companies. Evergrande, for example, posted a $4.5 billion loss in the H1.
Therefore, energy traders remain little impressed with China stimulus measures. The barrel of US crude trades around the $80pb level, yet the failure to break below a major Fibonacci support last week – major 38.2% Fibonacci retracement on the latest rally, keeps oil bulls timidly in charge of the market despite the weak China sentiment. Oil trading volumes show an unusual fall since July when compared to volumes traded in the past two years. That’s partly due to weakening demand fears and falling gasoline inventories, but also due to tightening oil markets as a result of lower OPEC supply. We know that the demand will advance toward fresh records despite weak Chinese demand. We also know that OPEC will keep supply limited to push prices higher. Consequently, we are in a structurally positive price setting, although any excessive rally in oil prices would further fuel inflation expectations, rate hike expectations and keep the topside limited in the medium run.
Focus Turns to Key Data Releases This Week
Market movers today
Focus this week will turn to US non-farm payrolls, ISM manufacturing, Chinese PMI and Euro Flash inflation for August.
We have a slow start to an otherwise interesting week where markets will likely digest the signals from the Jackson Hole speeches on Friday. On the data front, only Euro area money and credit growth and Norwegian retail sales are of interest.
The 60 second overview
Jackson Hole with few new policy signals: The speeches by Fed governor Jerome Powell and ECB President Christine Lagarde on Friday at Jackson Hole did not provide much new information. It is clear they are data-dependent and will take a holistic approach when looking at data to judge if more tightening is necessary. Powell made it clear it was too early to declare victory over inflation saying "there is substantial further ground to cover to get back to price stability". This is not new, though, and the wording on monetary policy was unchanged from the recent Fed meeting saying "At upcoming meetings, we will assess our progress based on the totality of the data and the evolving outlook and risks". His speech was interpreted as a bit hawkish by the rate markets, though, and 2-year yields ended Friday higher at 5.07%. Lagarde's speech was mostly on structural changes affecting monetary policy in general but without policy signals.
China takes measures to lift equity sentiment: China yesterday reduced the stamp duty on stock trading, lowered the margin ratio for margin trading and curbed share sales in an effort to lift market sentiment. The measures had been flagged recently but the scale was wider than expected and Chinese equities have seen a lift of more than 2% in overnight trading. Whether the gains will be sustained will depend on what other policy measures China takes in the near future to lift the economy and reduce financial risks.
Equities swung between gains and losses after Powell's speech. In the end, it did not change the needle much. Those believing in a Fed pivot early next year still have arguments to do so, and vice versa. Hence, equities finally rose with US equities particularly strong. S&P 500 gained 0.7%, Nasdaq a notch more, while Europe closed unchanged on Friday. More importantly, Powell did not say anything to hinder investor appetite for large cap growth stocks. Consumer discretionary and tech outperformed, large cap outperformed small cap and growth were generally preferred over value.
FI: Friday's session ended with a bearish flattening as e.g. the 2y point rose 5bp while the 10y point rose 2bp. Powell's speech in Jackson Hole did not contain new policy signals, nor did Lagarde's late speech on Friday night. Late on Friday, Nagel and Holzmann repeated their hawkish signals with Nagel particularly saying that it is too early to pause the hiking cycle. Reuters sources reported a growing momentum for a pause in September but the debate is still open without a market impact.
FX: The CNY has stabilised over the last week with Chinese authorities stepping up their efforts to counter currency weakness. Otherwise, the USD continues to trade bid with EUR/USD falling below the 1.08 mark towards the end of last week for the first time since June. Both EUR/SEK and EUR/NOK have been range trading in recent sessions while GBP was last week's primary underperformer returning EUR/GBP to the 0.858-mark.
Credit: Credit markets exhibited a slight tightening tendency on Friday. iTraxx Xover closed 2.2bp tighter and Main 0.6bp tighter.
Nordic macro
Sweden: Riksbank's Flodén will give a speech on the topic "Where is the economy heading? Status after the summer." In the latest minutes, Flodén highlighted (1) the weak SEK, (2) high service sector inflation, and (3) the stronger-than-expected economy as factors supporting a continued tight monetary policy. While he believes that more rate hikes are highly likely, he can still be characterized as the most dovish board member (possibly together with Bunge who speaks tomorrow). In the minutes he opened up for the possibility of an unchanged policy rate if a rapid economic downturn were to occur simultaneously with inflation being in line with the Riksbank's forecasts, contingent with SEK not weakening significantly. Therefore, it will be interesting to hear his interpretation of the macro data from the summer, not the least the (overly?) negative GDP indicator print for Q2.
Technical Outlook and Review
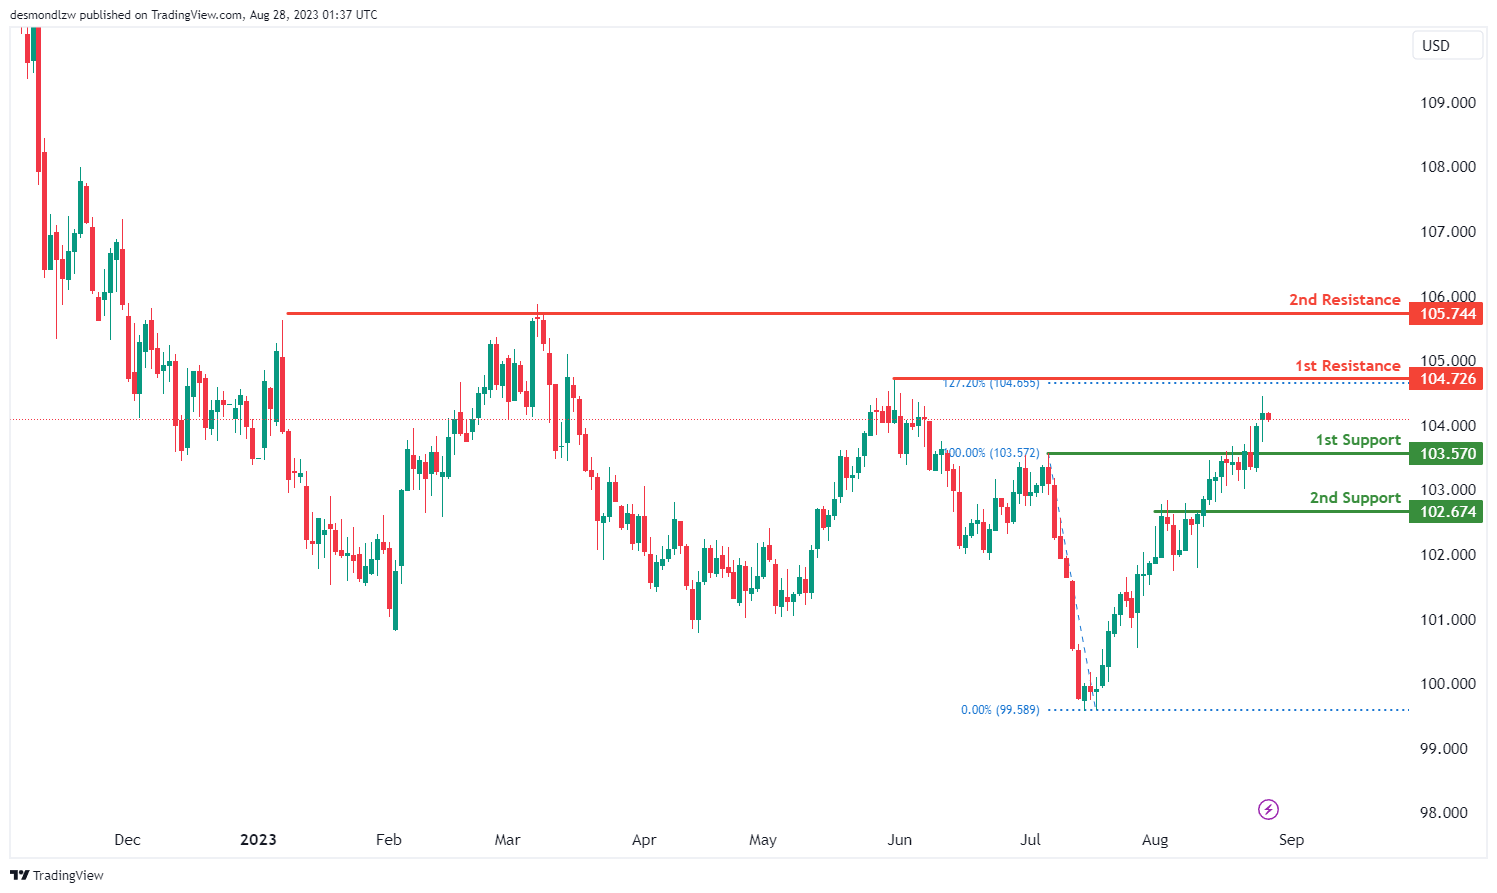
DXY:
The DXY (U.S. Dollar Index) chart currently exhibits a bullish momentum. This suggests the possibility that the price could continue its bullish trajectory, aiming towards the first resistance level.
The first support for the price is located at 103.57, acting as a pullback support. This level is expected to serve as a significant safety net for any short-term pullbacks. The 2nd support is at 102.67, which also holds the characterization of a pullback support.
On the potential barrier front, the first resistance is set at 104.72. What accentuates its significance is its confluence with the 127.20% Fibonacci Extension, cementing its position as a swing high resistance. The 2nd resistance is found at 105.74, marking another critical threshold in the potential upward journey of the DXY.
EUR/USD:
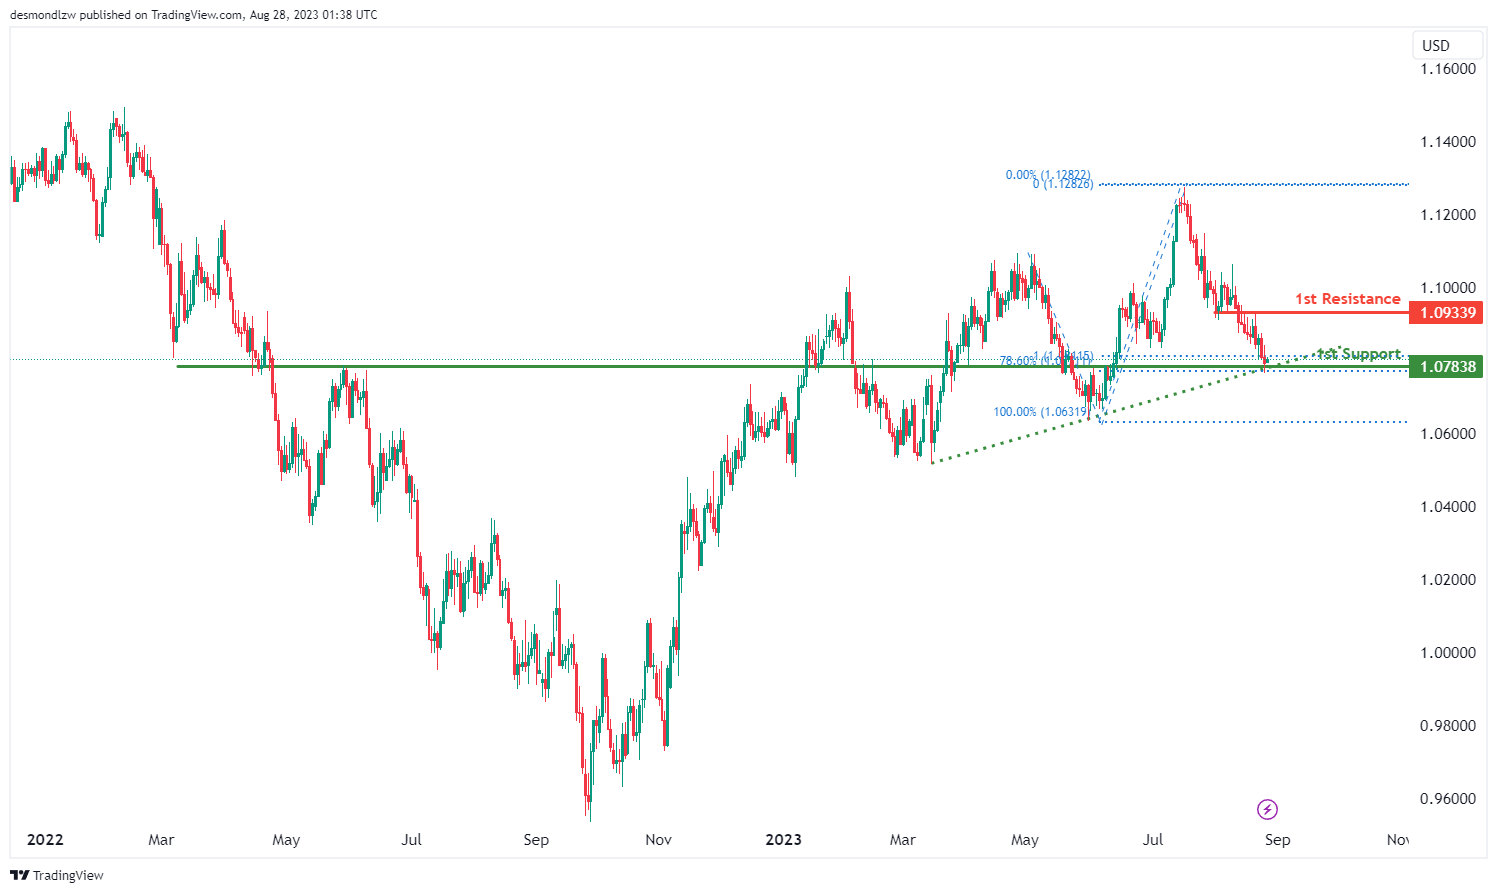
The EUR/USD chart is currently displaying bullish momentum, primarily influenced by the price’s position above a major ascending trend line. This position suggests that there’s a strong possibility for further bullish momentum in the future. Within this context, there’s potential for the price to experience a bullish bounce from the first support at 1.0783 and then make its way towards the first resistance at 1.0933. The first support at 1.0783 is particularly noteworthy because it’s an overlap support, and it aligns with both the 78.60% and 100% Fibonacci Projections, highlighting a Fibonacci confluence.
On the other side, the first resistance at 1.0933 is identified as an overlap resistance, indicating a potential area where selling interest might arise.
EUR/JPY:
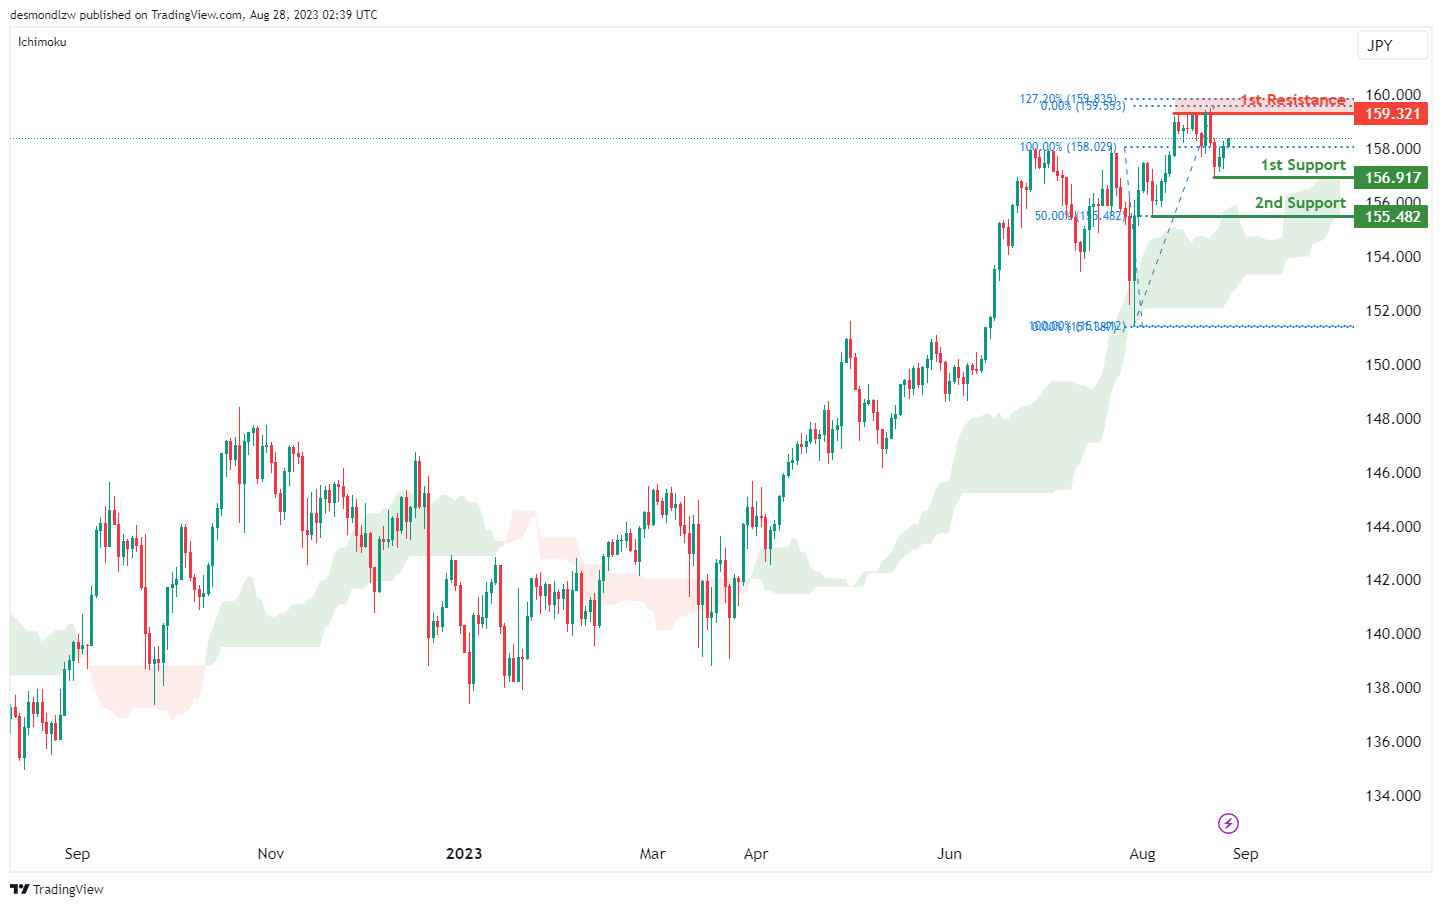
The EUR/JPY chart is currently experiencing a bullish overall momentum and is positioned above the bullish Ichimoku cloud. Based on the analysis, there’s a potential scenario for a bullish continuation towards the first resistance level.
The first support at 156.91 is a significant level due to its swing low support characteristics.
The 2nd support at 155.48 is also valuable as it represents a swing low support and coincides with the 50% Fibonacci Retracement.
In terms of resistance levels, the first resistance at 159.32 stands out due to its multi-swing high resistance attributes, as well as its alignment with the 127.20% Fibonacci Extension.
EUR/GBP:
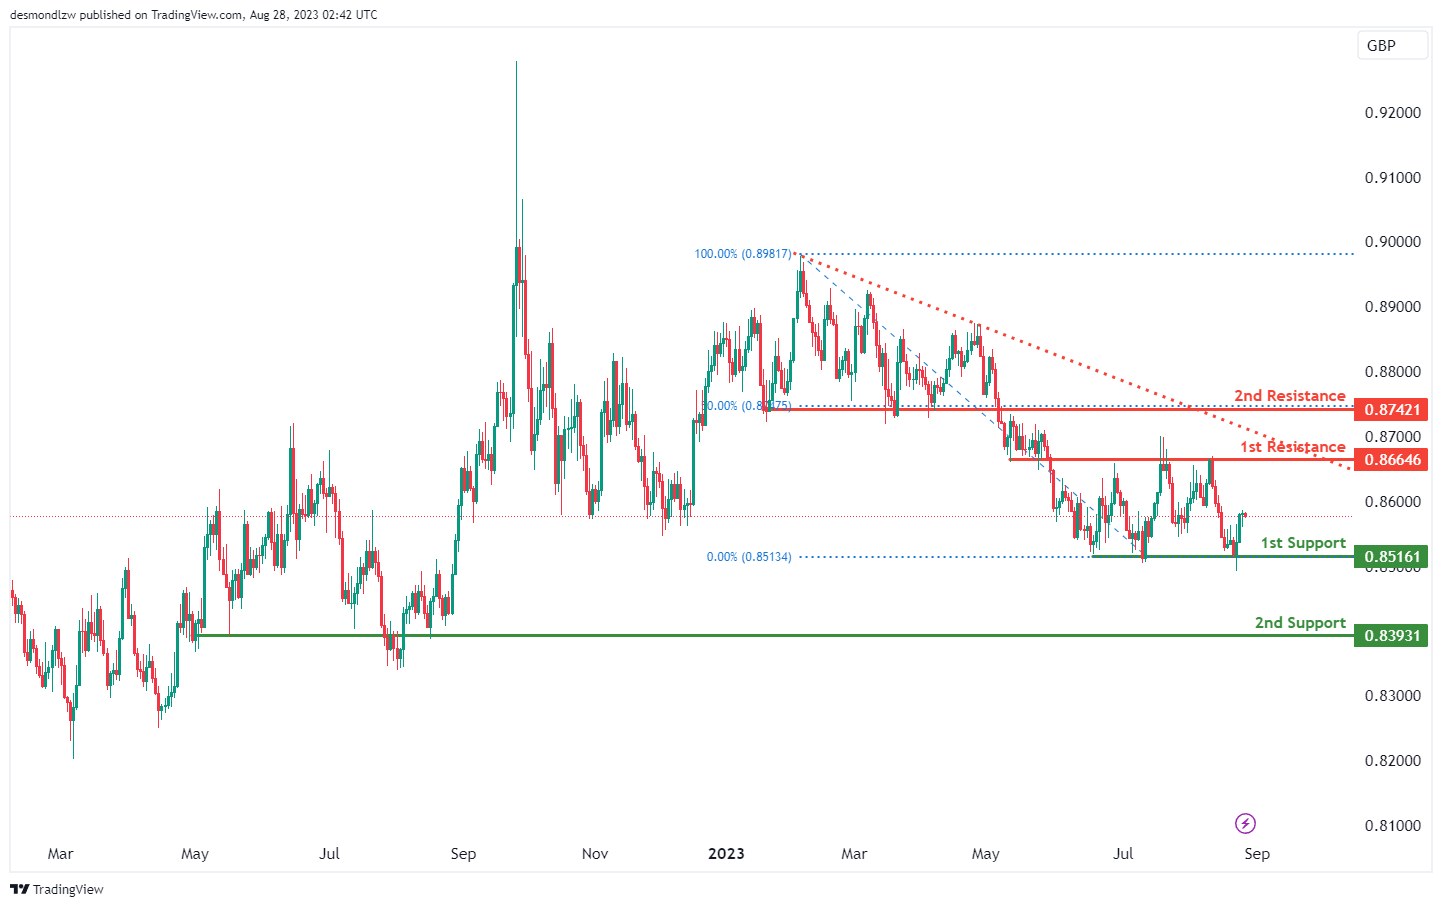
The EUR/GBP chart is exhibiting a bullish overall momentum. According to the analysis, there’s potential for a bullish continuation towards the first resistance level.
The first support at 0.8516 is notable for its multi-swing low support characteristics.
The 2nd support at 0.8393 is also significant as it represents an overlap support.
On the resistance side, the first resistance at 0.8664 stands out due to its overlap resistance characteristics.
The 2nd resistance at 0.8742 is noteworthy for being a pullback resistance and coincides with the 50% Fibonacci Retracement.
GBP/USD:
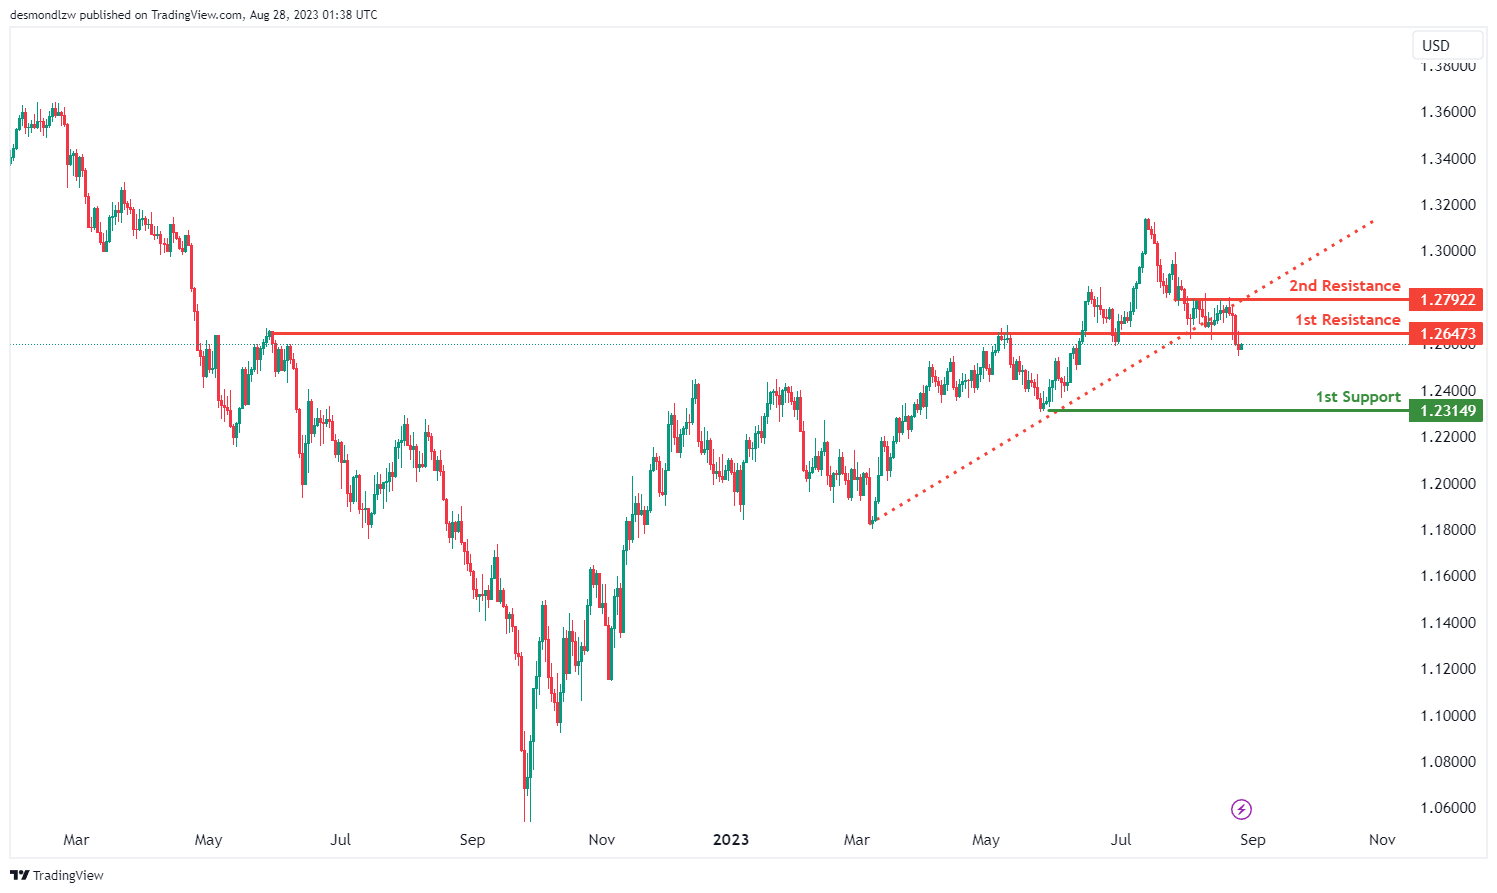
The GBP/USD currency pair’s technical landscape reveals a tentative bearish undertone, albeit with subdued conviction. The recent breach below a critical ascending support line has precipitated a potential bearish inclination. This evolving narrative suggests the likelihood of a bearish continuation targeting the first support level pegged at 1.2314, identified due to its function as a swing low support.
On the other hand, any rallies might confront resistance barriers. The first resistance, set at 1.2647, is delineated as an overlap resistance, making it an essential point of observation. Similarly, a secondary resistance level is pinpointed at 1.2792, which also carries the classification of an overlap resistance. These technical demarcations offer pivotal zones to monitor, both for potential reversals and continuations in line with the emerging bearish sentiment.
GBP/JPY:
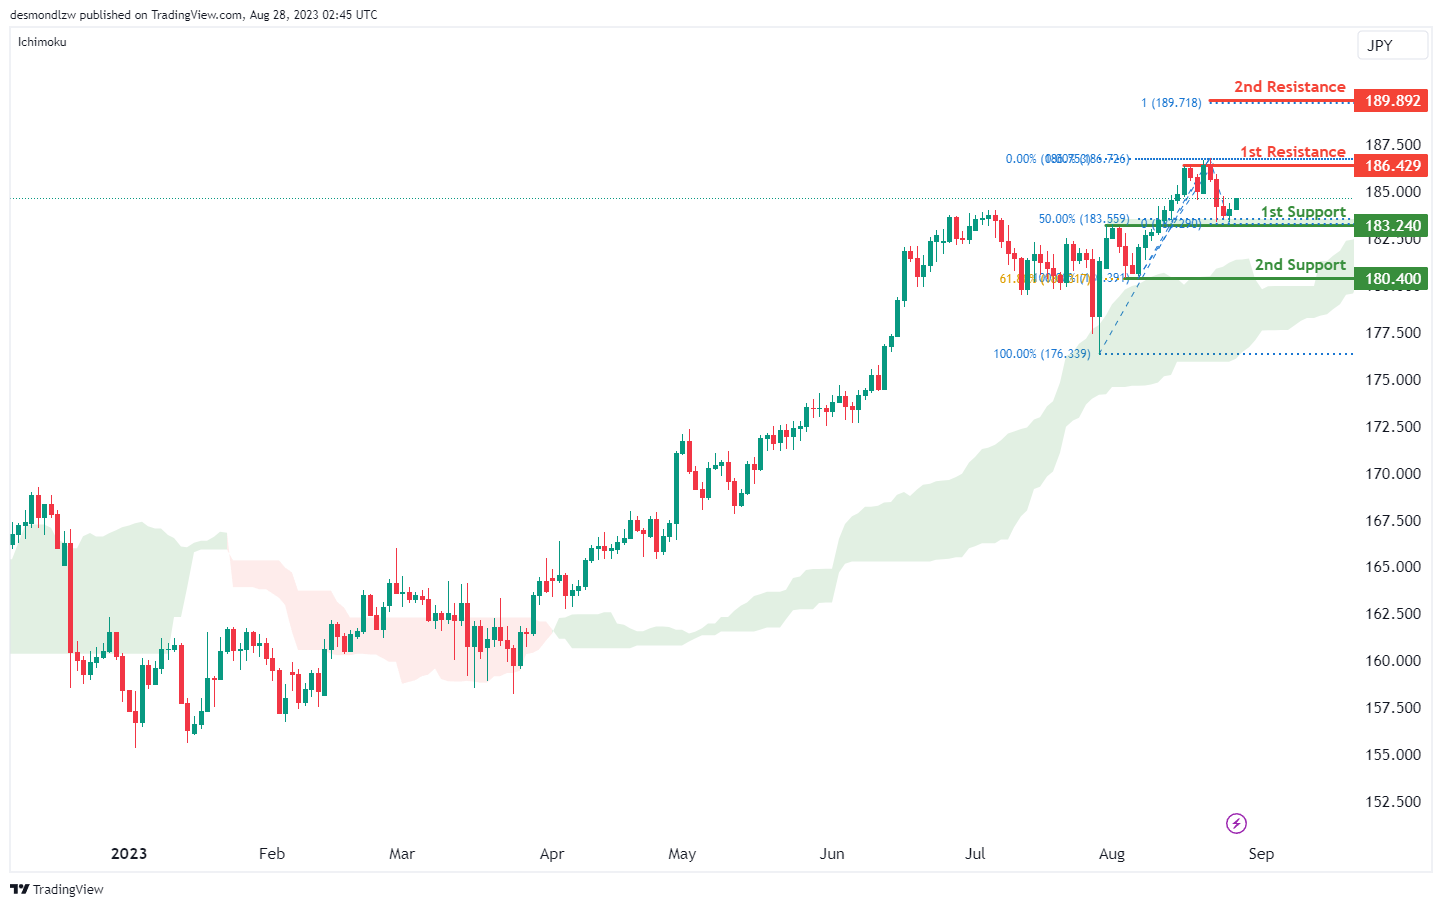
The GBP/JPY chart is demonstrating a bullish overall momentum, and this is further supported by the fact that the price is currently above the bullish Ichimoku cloud. Based on the analysis, there’s potential for a bullish continuation towards the first resistance level.
The first support at 183.24 is significant due to its overlap support characteristics and its alignment with the 50% Fibonacci Retracement.
The 2nd support at 180.40 is noteworthy as it represents a swing low support and coincides with the 61.80% Fibonacci Retracement.
Regarding resistance levels, the first resistance at 186.42 stands out due to its multi-swing high resistance features.
The 2nd resistance at 189.89 is meaningful as it corresponds to the 100% Fibonacci Projection.
USD/CHF:
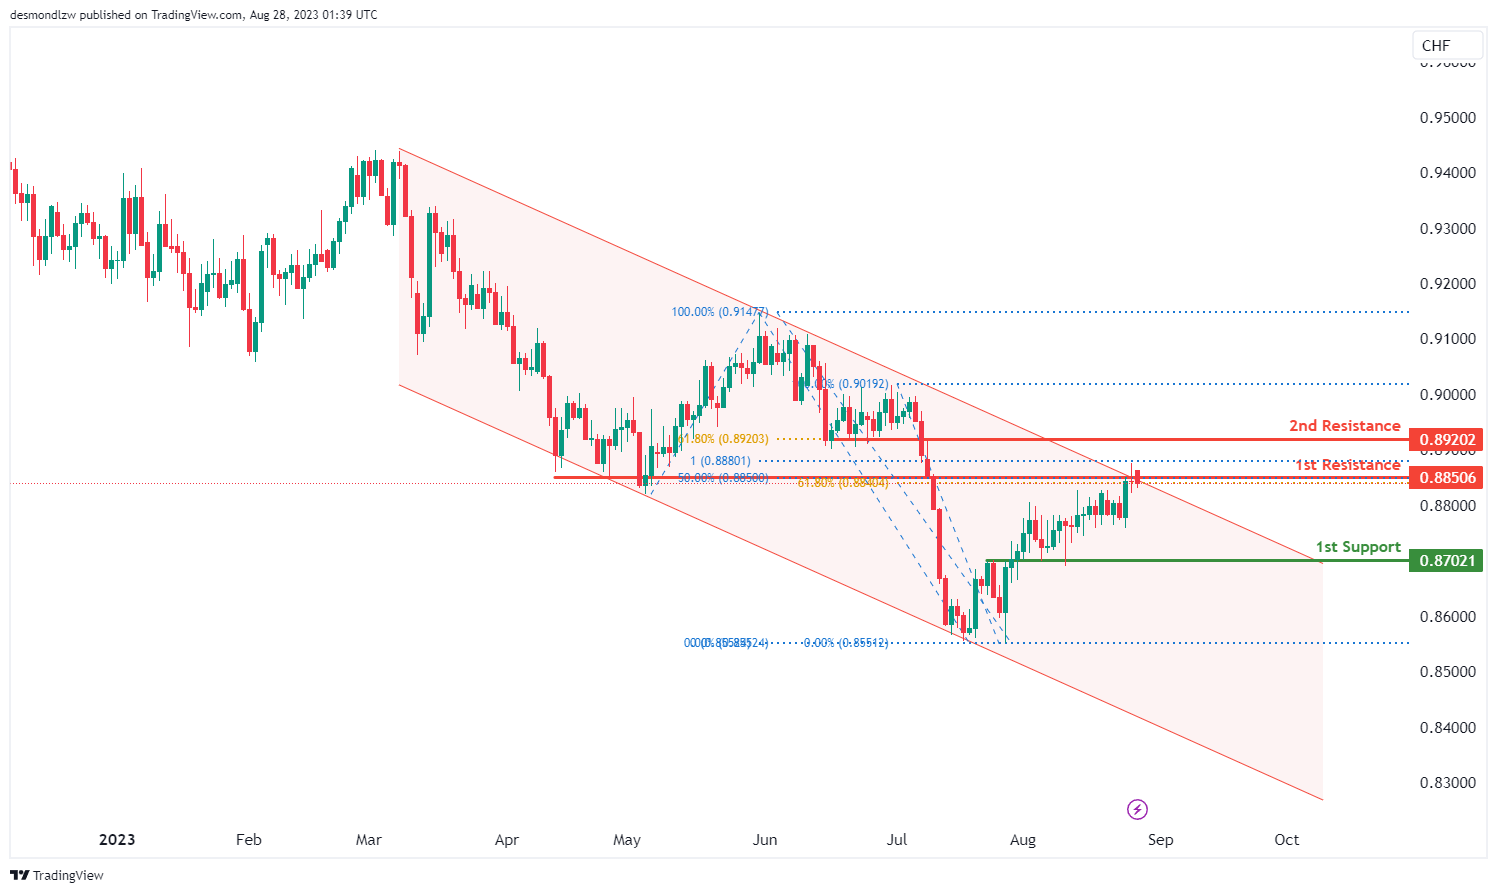
The USD/CHF chart currently manifests a bearish momentum, predominantly influenced by the price’s movement within a descending channel. This channel further accentuates the bearish trend, suggesting the likelihood that the price might persist in its decline due to the prevailing bearish impetus.
Within this environment, there’s a foreseeable scenario wherein the price may exhibit a bearish response upon approaching the first resistance at 0.8850 and subsequently descend towards the first support level at 0.8702. The first support level is notable for its designation as an overlap support, signifying a potential zone where the price could find stability.
Conversely, the first resistance at 0.8850 is of particular interest not only because it’s identified as an overlap resistance but also due to its alignment with both the 50% and 61.80% Fibonacci Retracement levels, presenting a Fibonacci confluence. This confluence may amplify its role as a barrier to any upward movement. Additionally, the 2nd resistance at 0.8920, marked as an overlap resistance, is also aligned with the 61.80% Fibonacci Retracement, further accentuating its potential significance in the price dynamics.
USD/JPY:
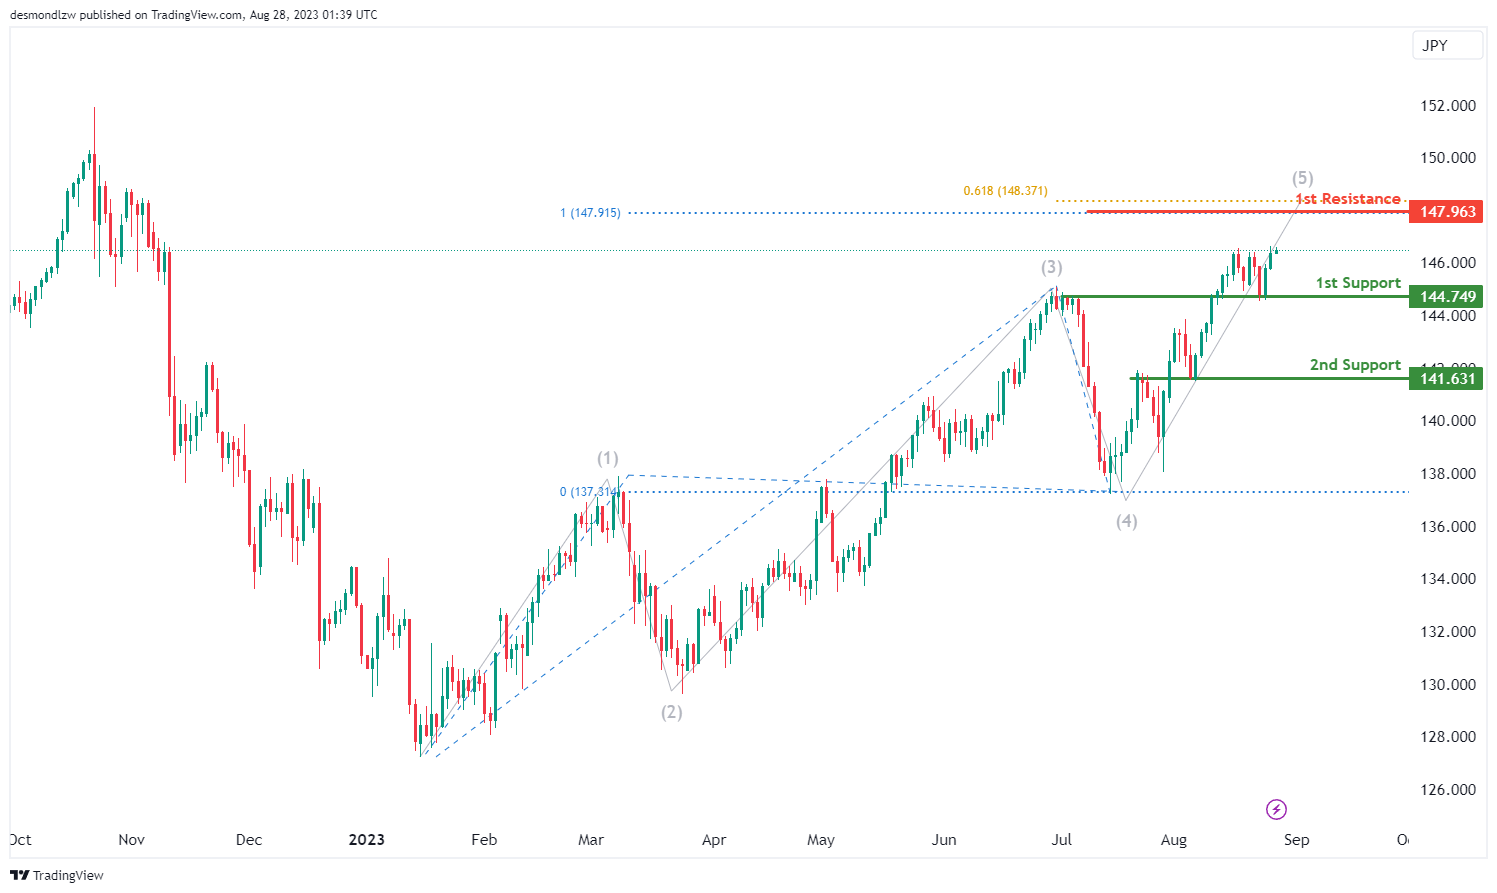
The USD/JPY chart currently displays a bullish momentum. Within this favorable trend, it is anticipated that the price might continue its bullish path, targeting the first resistance at 147.96. This resistance level is notable not just because it acts as a pullback resistance, but also due to its alignment with both the 61.80% and 100% Fibonacci Projections, highlighting a significant Fibonacci confluence that could influence price behavior.
Additionally, the first support is also situated at 147.96, which is identified as an overlap support. This suggests that this level might play a dual role, serving as both a potential floor for price retractions and an impending target for bullish pursuits. Further reinforcing the chart’s structure is the 2nd support at 141.63, which is similarly characterized as an overlap support.
USD/CAD:
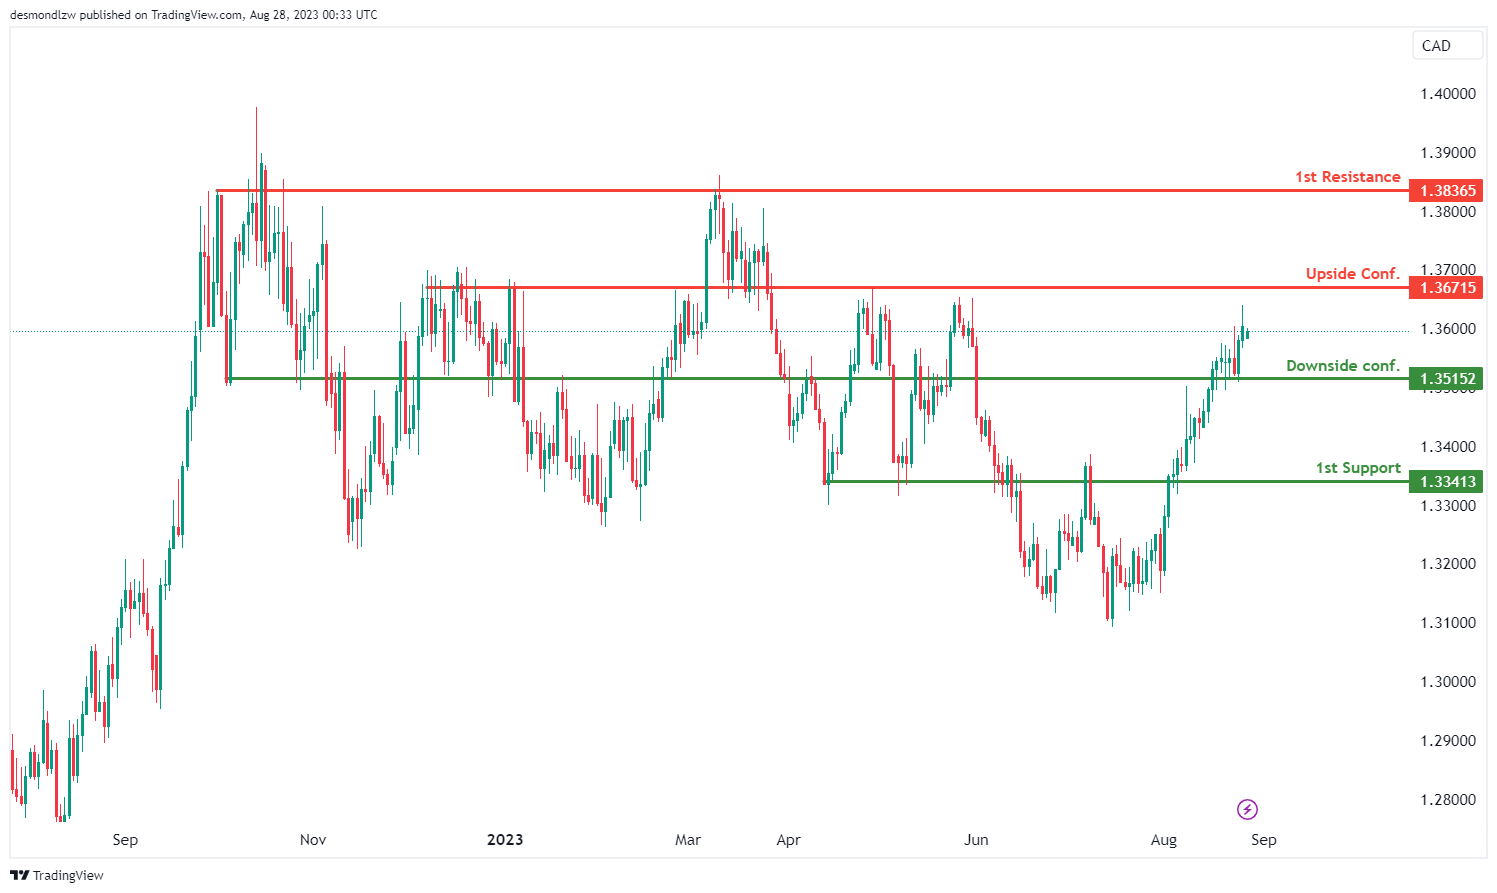
The USD/CAD chart has been showing an overall bullish momentum but could now exhibit a neutral momentum. There is a possibility for price to fluctuate between the upside and downside confirmation levels before price breaking through either level.
The upside confirmation level at 1.3672 is identified as an overlap resistance. Should price break through this level, there is a potential for further upward movement towards the first resistance. This first resistance level at 1.3837 is identified as an overlap resistance, implying that it could act as a hurdle to the price’s upward movement.
On the other hand, the downside confirmation level at 1.3515 is identified as an overlap support. Should price break through this level, there is a potential for further downward movement towards the first support. This first support level at 1.3341 is also identified as an overlap support, suggesting that it might provide additional support to the price.
AUD/USD:
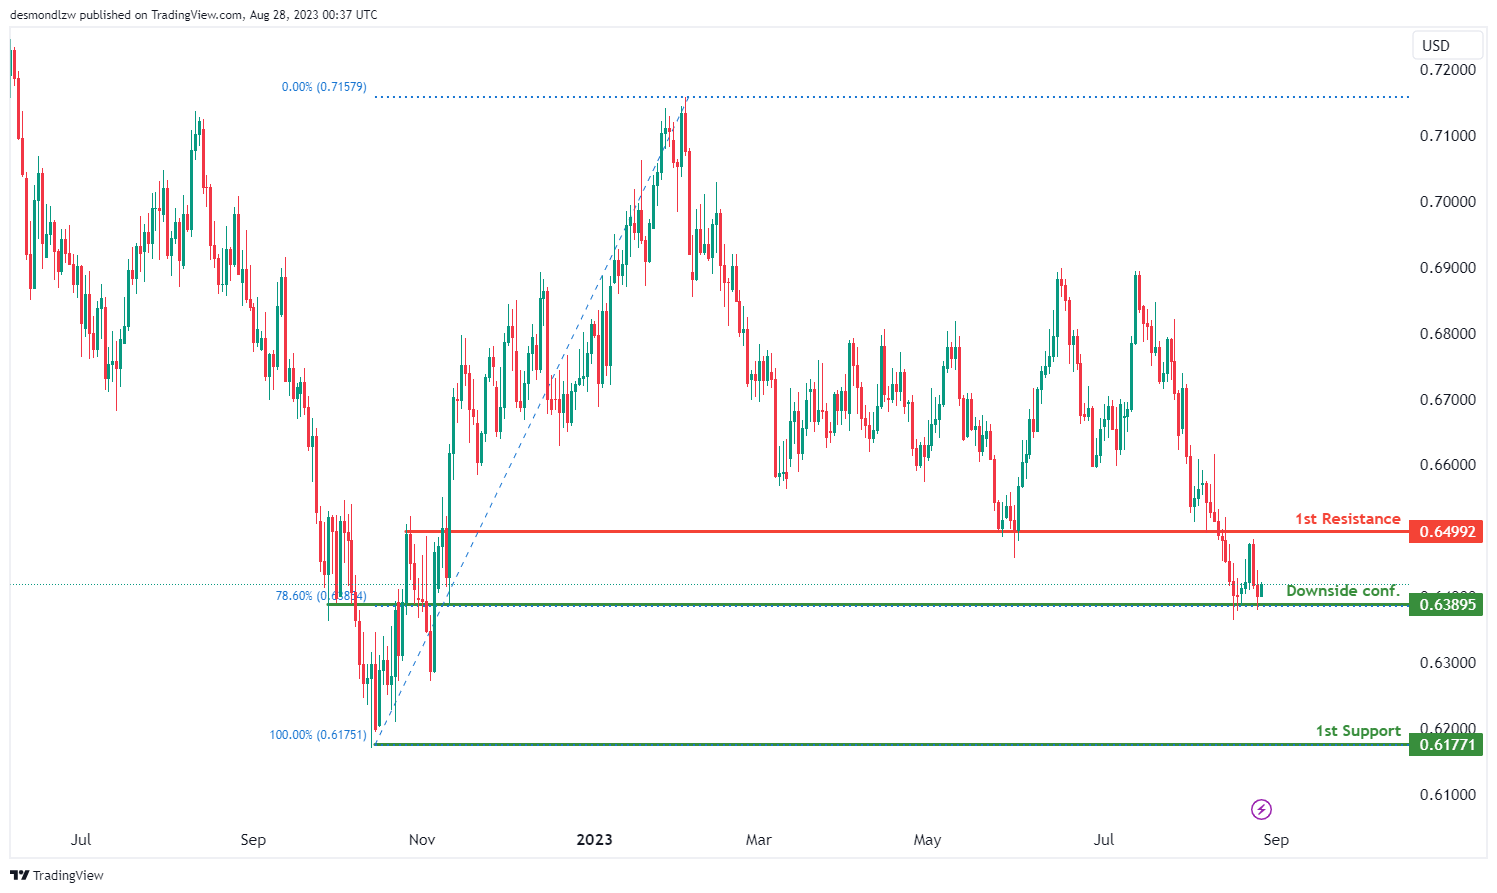
The AUD/USD chart is currently exhibiting an overall bearish momentum, indicating a prevailing downtrend. Given this momentum, there’s a possibility that the price might experience a bearish reaction off the downside confirmation level and subsequently drop towards the first support level.
The potential downward movement could continue should price break below the downside confirmation level at 0.6389 which is identified as an overlap support that aligns with the 78.60% Fibonacci retracement level. Furthermore, the first support level at 0.6177 is identified as a swing-low support, indicating that it has previously acted as a point of support during previous price swings.
To the upside, the first resistance level at 0.6499 is identified as an overlap resistance, suggesting that historical price action has seen resistance around this level.
NZD/USD
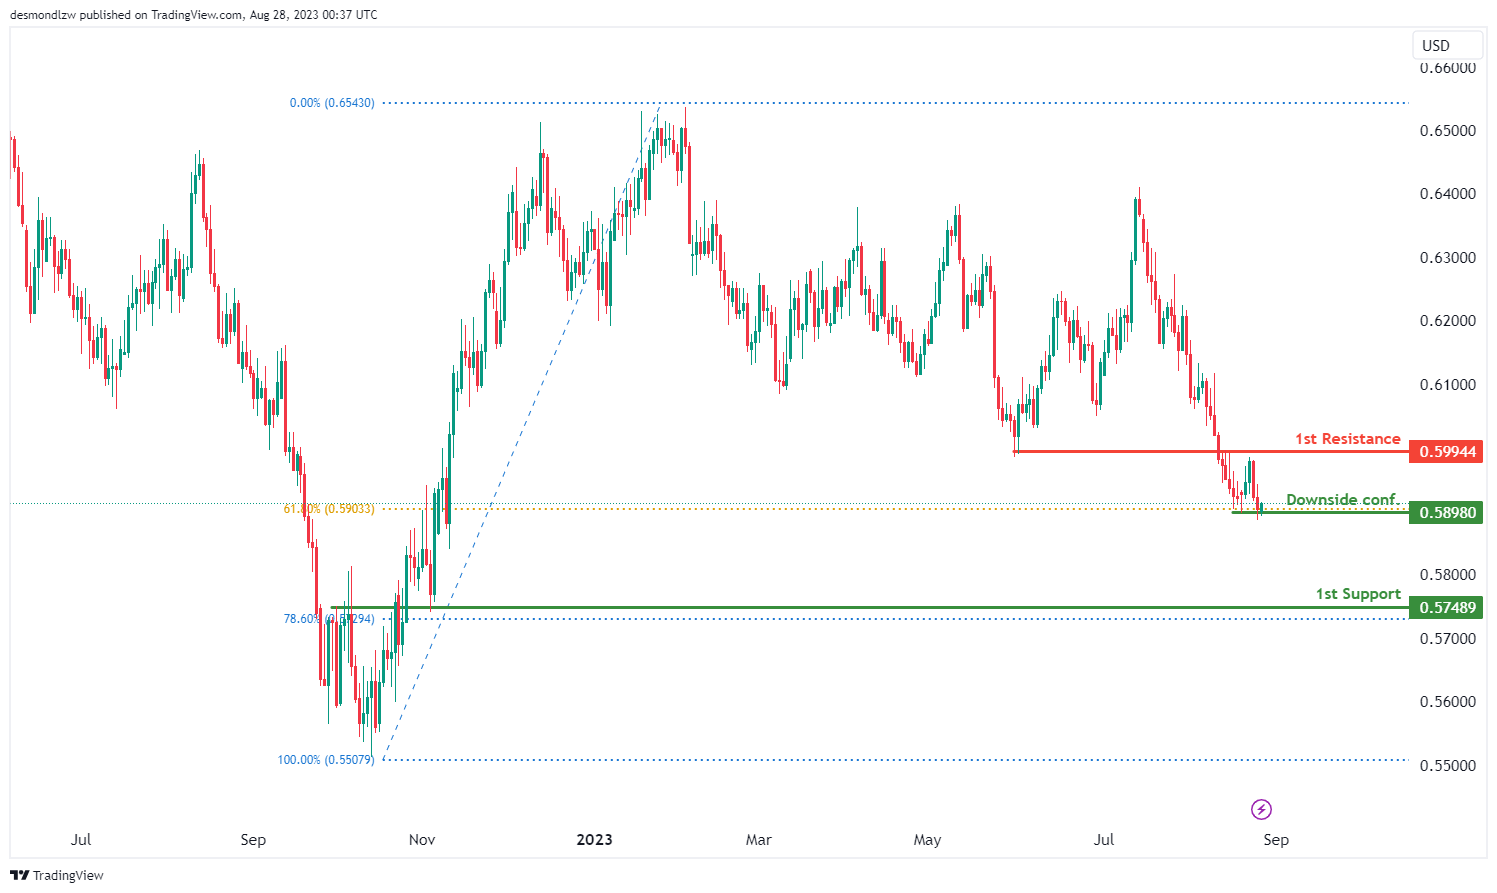
The overall momentum of the NZD/USD chart is currently bearish, indicating a prevailing trend of downward movement. In this scenario, there is a possibility that the price could experience a bearish breakout off the downside confirmation level and potentially drop towards the first support level.
The downside confirmation level at 0.5898 is identified as a multiple swing-low support that corresponds to the 61.80% Fibonacci retracement level. In addition, the first support level at 0.5749 is identified as an overlap support that aligns with the 78.60% Fibonacci retracement level.
To the upside, the first resistance level at 0.5994 is identified as an overlap resistance where price may encounter a significant barrier to upward movement.
DJ30:
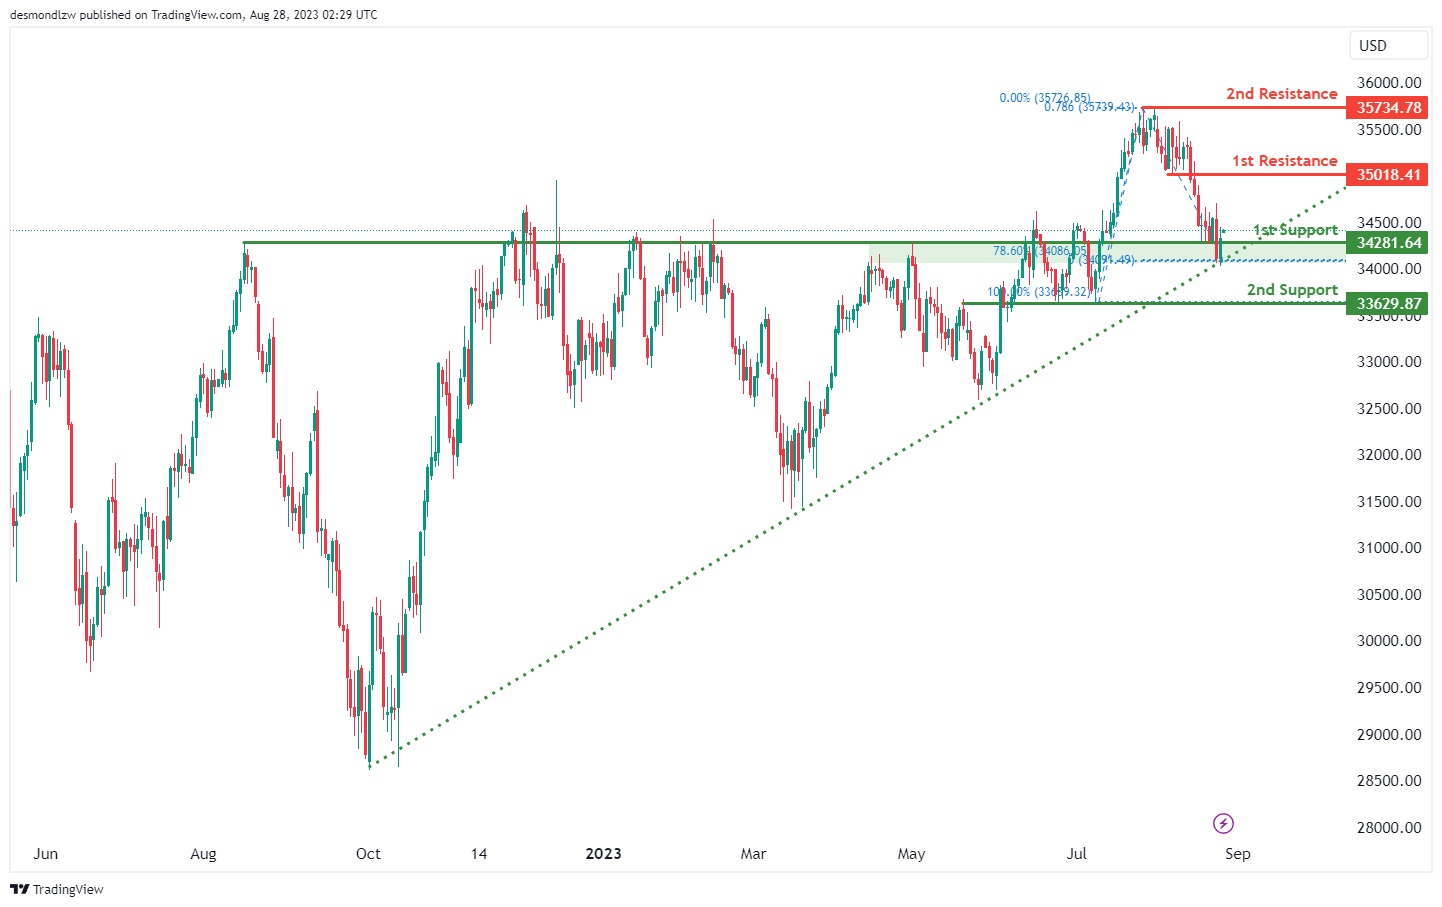
The DJ30 (Dow Jones Industrial Average) chart indicates a bullish overall momentum, and there are factors contributing to this momentum, including the price being above a major ascending trend line, which suggests further bullish potential.
The potential scenario on the chart suggests a bullish continuation towards the first resistance level.
The first support at 34281.64 is valuable as it represents an overlap support and aligns with the 78.60% Fibonacci Retracement. The 2nd support at 33629.87 is also significant as it represents an overlap support.
On the resistance side, the first resistance level at 35018.41 is noteworthy as it represents a pullback resistance. The 2nd resistance at 35734.78 is valuable as it coincides with a swing high resistance and the 78.60% Fibonacci Projection.
GER30:
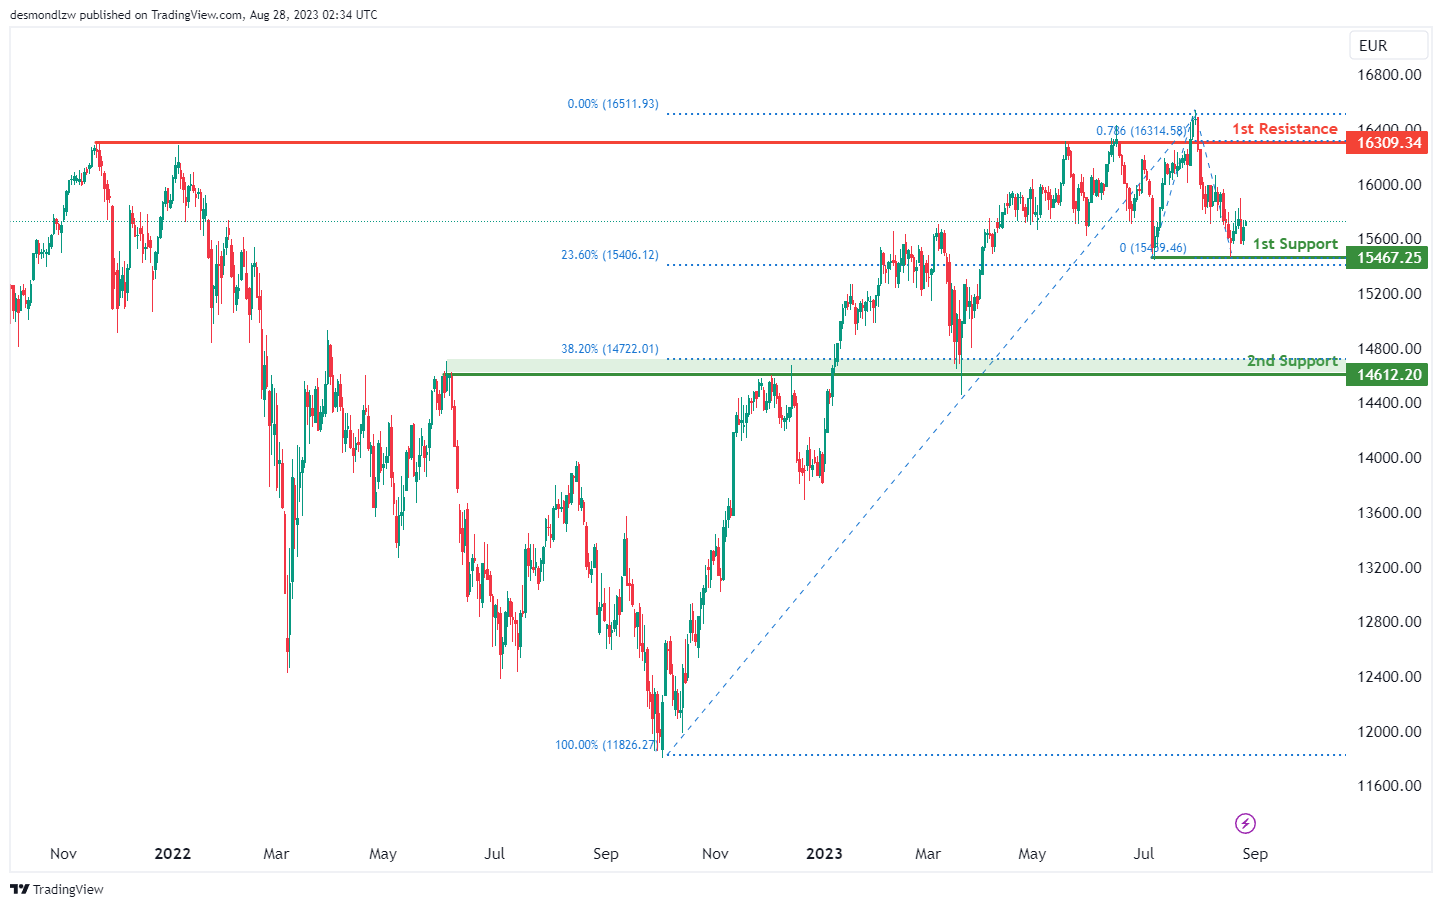
The GER30 (Germany 30) chart still maintains a bullish overall momentum. The potential scenario on the chart indicates a bullish continuation towards the first resistance level.
The first support at 15467.25 holds its value as a multi-swing low support, and it’s further supported by the presence of the 23.60% Fibonacci Retracement.
The 2nd support at 14612.20 is also significant, representing an overlap support and aligning with the 38.20% Fibonacci Retracement.
Regarding resistance levels, the first resistance at 16309.34 remains noteworthy due to its overlap resistance characteristics and confluence with the 78.60% Fibonacci Projection.
US500
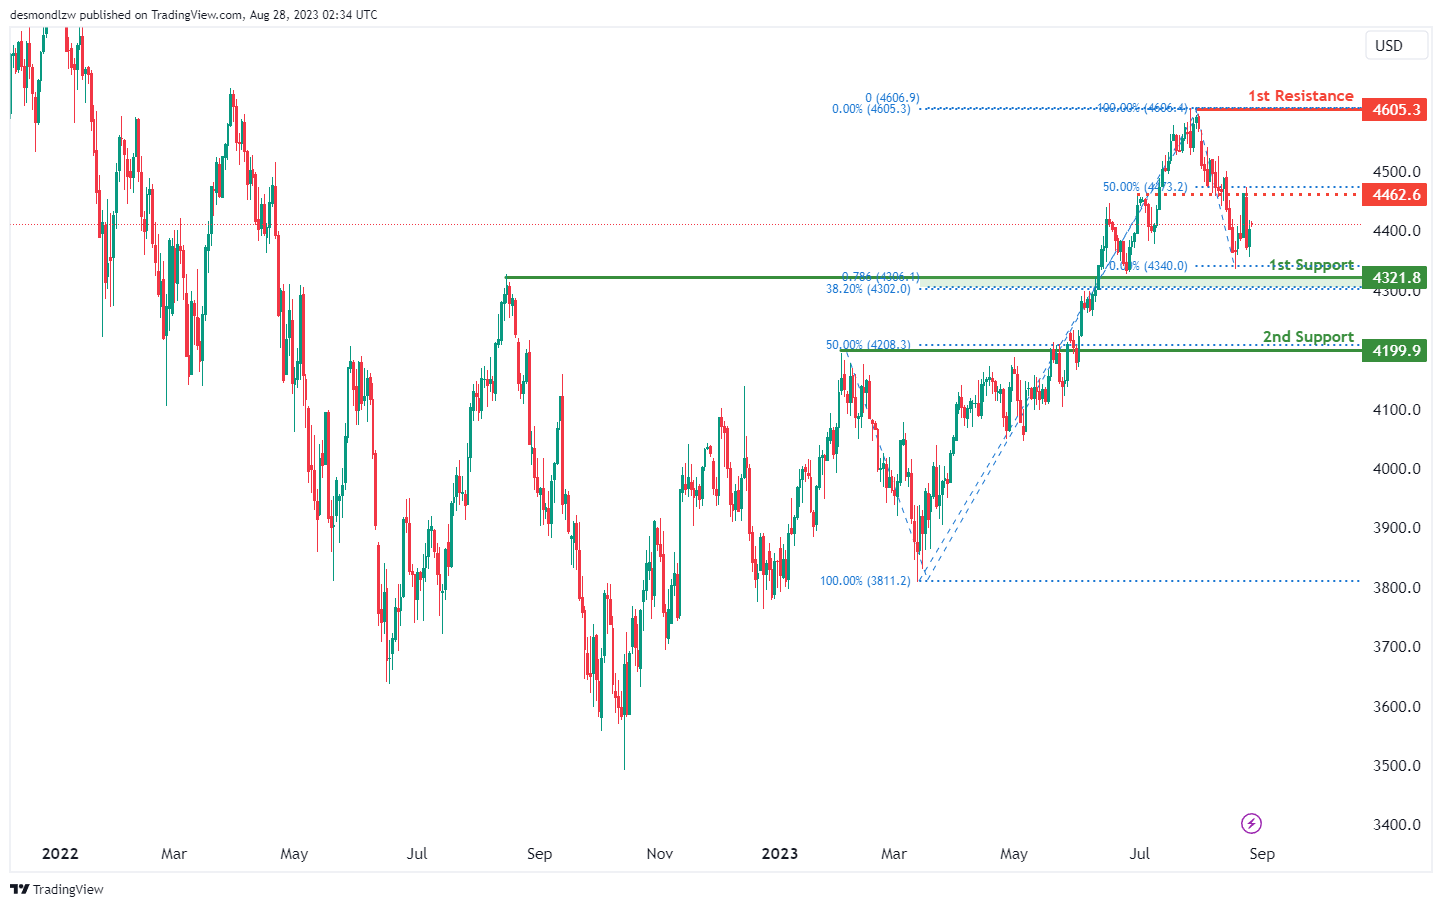
The US500 (S&P 500) chart is maintaining a bullish overall momentum and is within the bullish Ichimoku cloud. Based on the current analysis, there’s a potential scenario for a bullish continuation towards the first resistance level.
The first support at 4327.3 is supported by its overlap support characteristics and also coincides with the 38.20% Fibonacci Retracement. The 2nd support at 4199.9 is significant as it represents an overlap support and aligns with the 50% Fibonacci Retracement.
Regarding resistance levels, the first resistance at 4605.3 stands out due to its swing high resistance attributes. An intermediate resistance at 4462.6 is also important, being an overlap resistance and also aligning with the 50% Fibonacci Retracement.
BTC/USD:
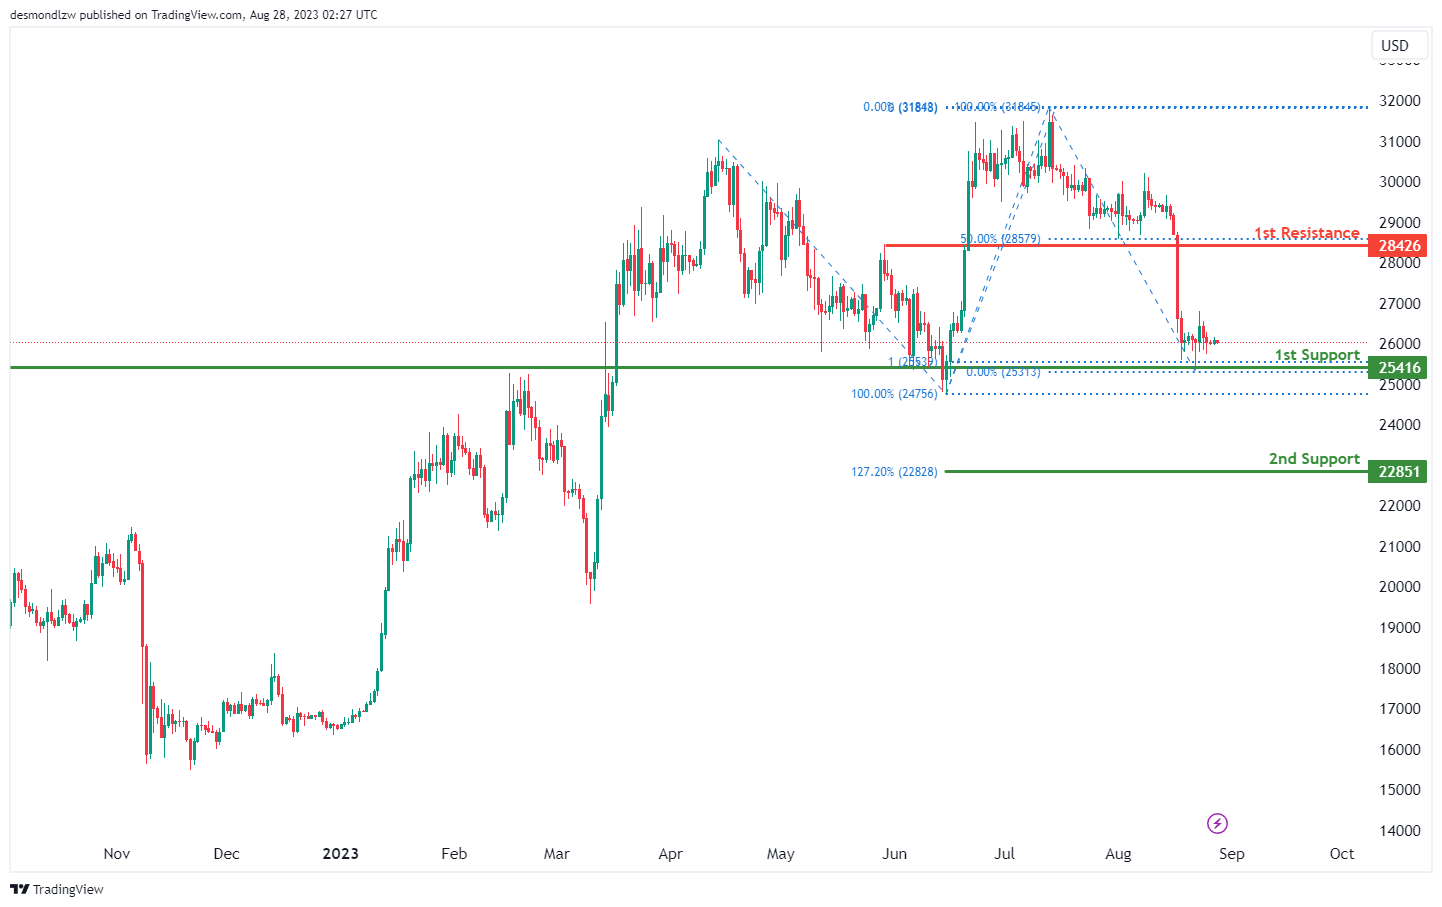
The BTC/USD chart indicates a bullish overall momentum, and there is a possibility of a bullish continuation towards the first resistance level.
The first support at 25416 is significant as it represents an overlap support, and it aligns with the 100% Fibonacci Projection.
The 2nd support at 22851 is noteworthy as it aligns with the 127.20% Fibonacci Extension.
On the resistance side, the first resistance level at 28426 is important as it represents a pullback resistance and coincides with the 50% Fibonacci Retracement.
ETH/USD:
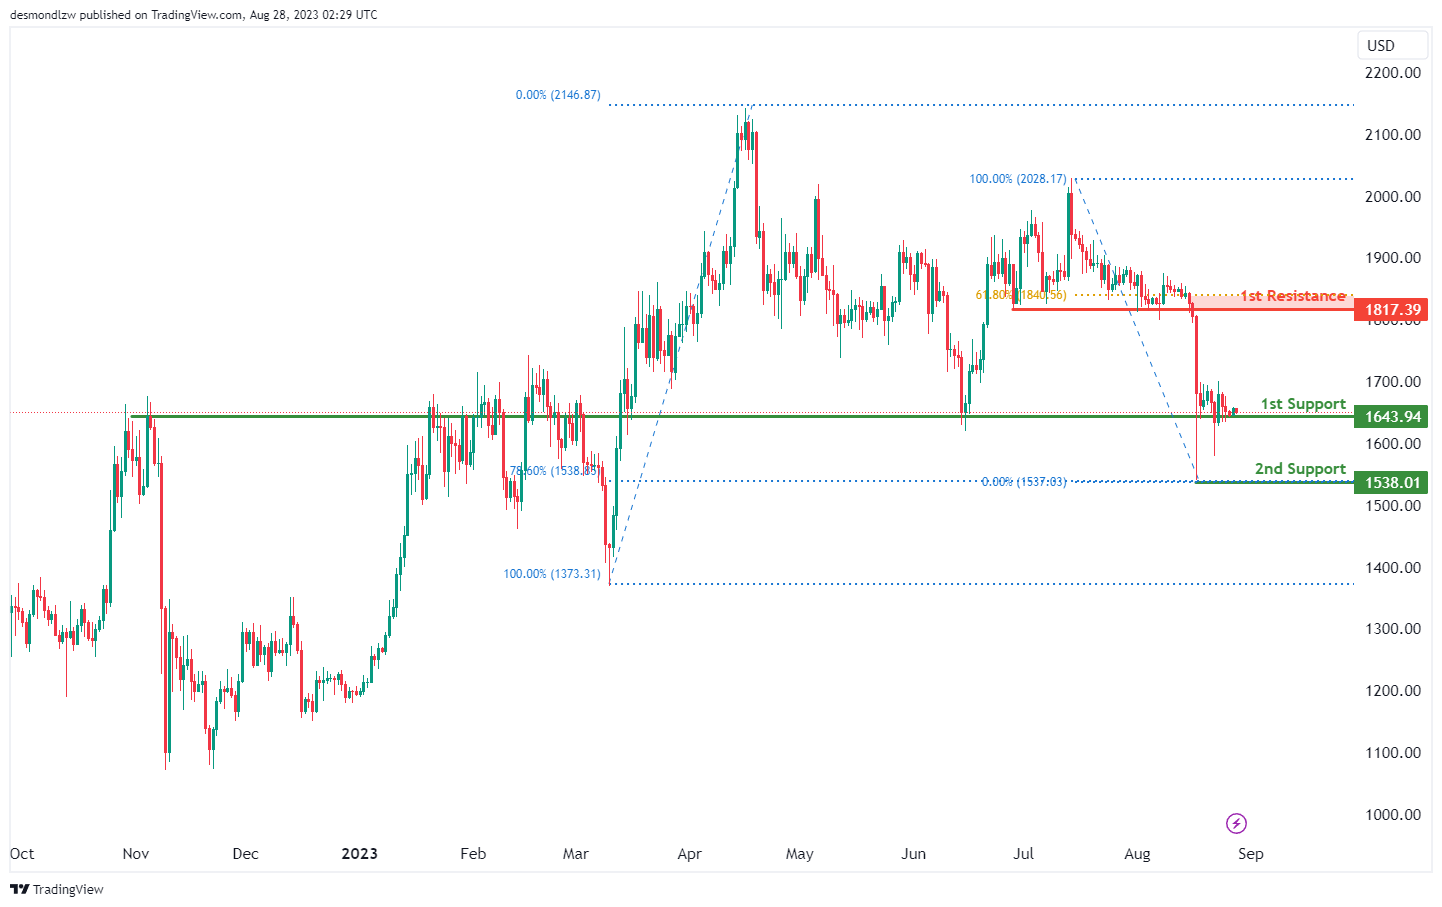
The ETH/USD chart indicates a bullish overall momentum, and there is a potential for a bullish bounce off the first support level with a subsequent move towards the first resistance level.
The first support at 1643.94 is significant as it represents an overlap support.
The 2nd support at 1538.01 is valuable as it aligns with a swing low support and the 78.60% Fibonacci Retracement.
On the resistance side, the first resistance level at 1817.39 is noteworthy as it represents a pullback resistance and coincides with the 61.80% Fibonacci Retracement.
WTI/USD:
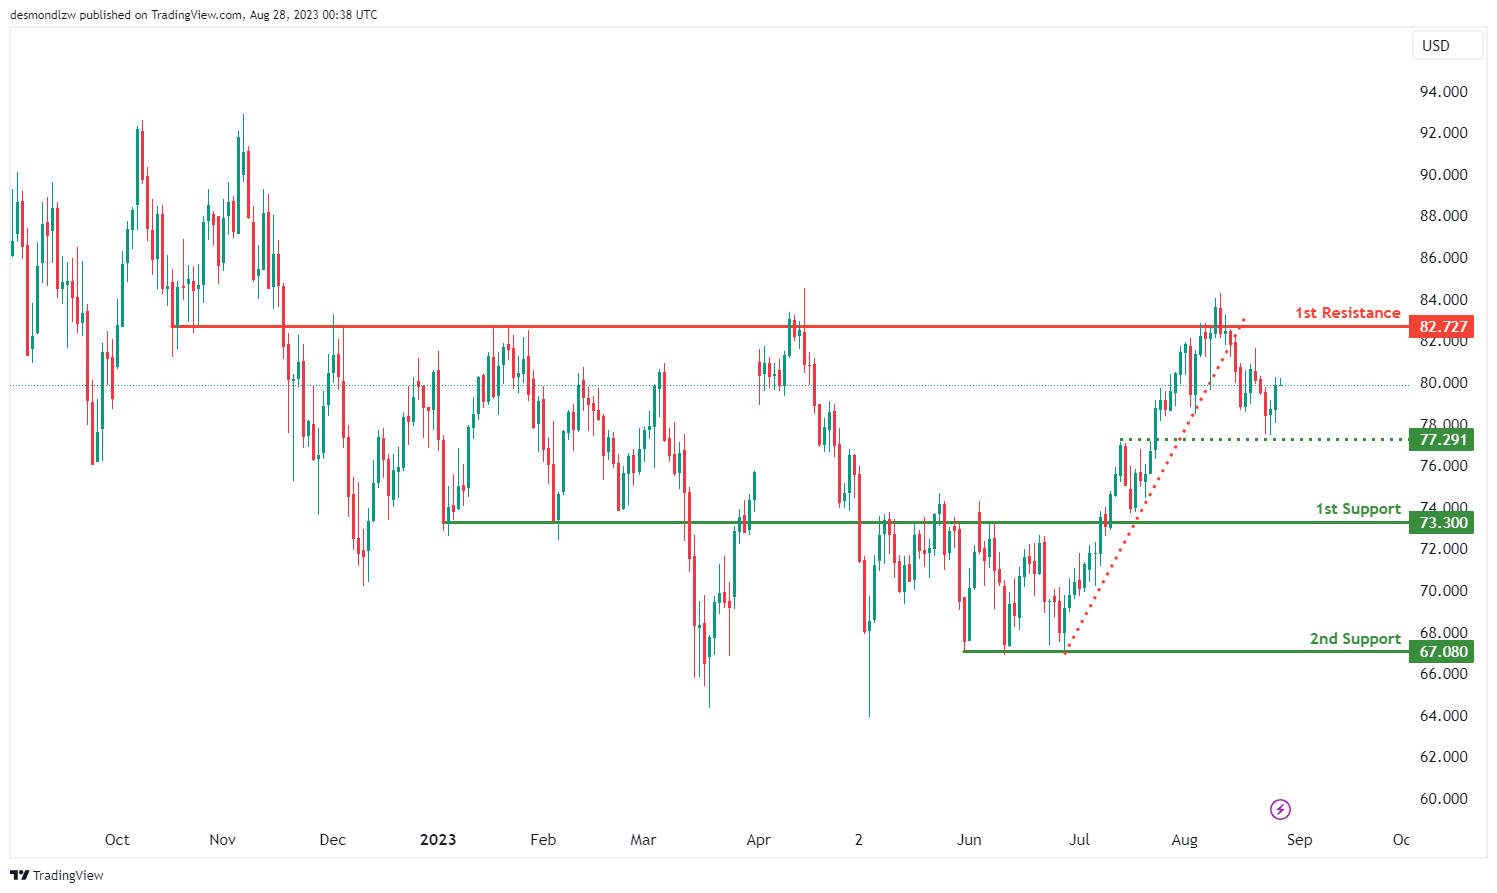
The overall momentum of the WTI (West Texas Intermediate) chart is currently bearish, indicating a prevailing trend of downward movement. In this context, there is a possibility that the price could continue its bearish trajectory towards the first support level should intermediate support level be broken. Although overall momentum is bearish, there is a possibility for price to rise towards the first resistance level before reversing to resume the downward movement.
The intermediate support level at 77.29 is identified as an overlap support. Should this level be broken, price could fall towards the first support level at 73.30 which is also identified as an overlap support. Furthermore, the 2nd support level at 67.08 holds importance as it is identified as a multi-swing low support.
To the upside, the first resistance level at 82.73 is identified as an overlap resistance, acting as a significant barrier of resistance since December of 2023.
XAU/USD (GOLD):
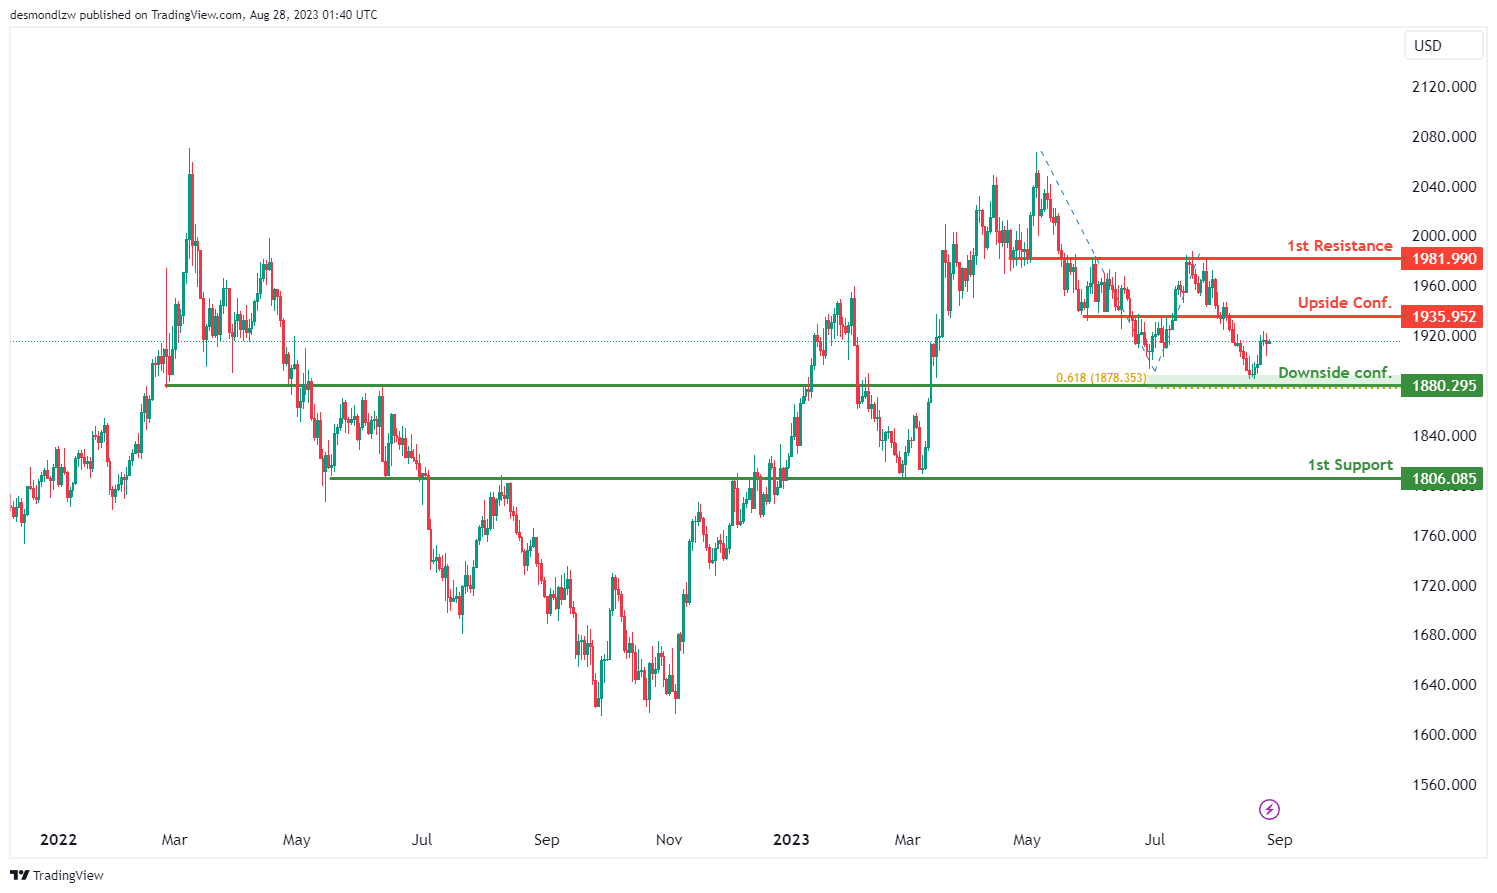
The XAUUSD chart currently exhibits a neutral momentum. In light of this, the price is expected to fluctuate, potentially oscillating between the first resistance at 1981.99 and the first support at 1806.08.
The first support at 1806.08 stands out as an overlap support, highlighting its significance as a potential area where buying interest might emerge. Just above this level, at 1880.29, there’s another region of interest to consider. This particular point is awaiting downside confirmation and its relevance is accentuated due to its categorization as an overlap support. Furthermore, its alignment with the 61.80% Fibonacci Projection enhances its importance as a strategic level to watch.
On the upside, the first resistance is located at 1981.99 and is defined as an overlap resistance, which could act as a barrier to further upward movement. Before reaching this resistance, a key level at 1935.95 is poised for upside confirmation. This level is significant, being identified as a pullback resistance.
Australia retail sales rose 0.5% mom in Jul, but underlying growth subdued
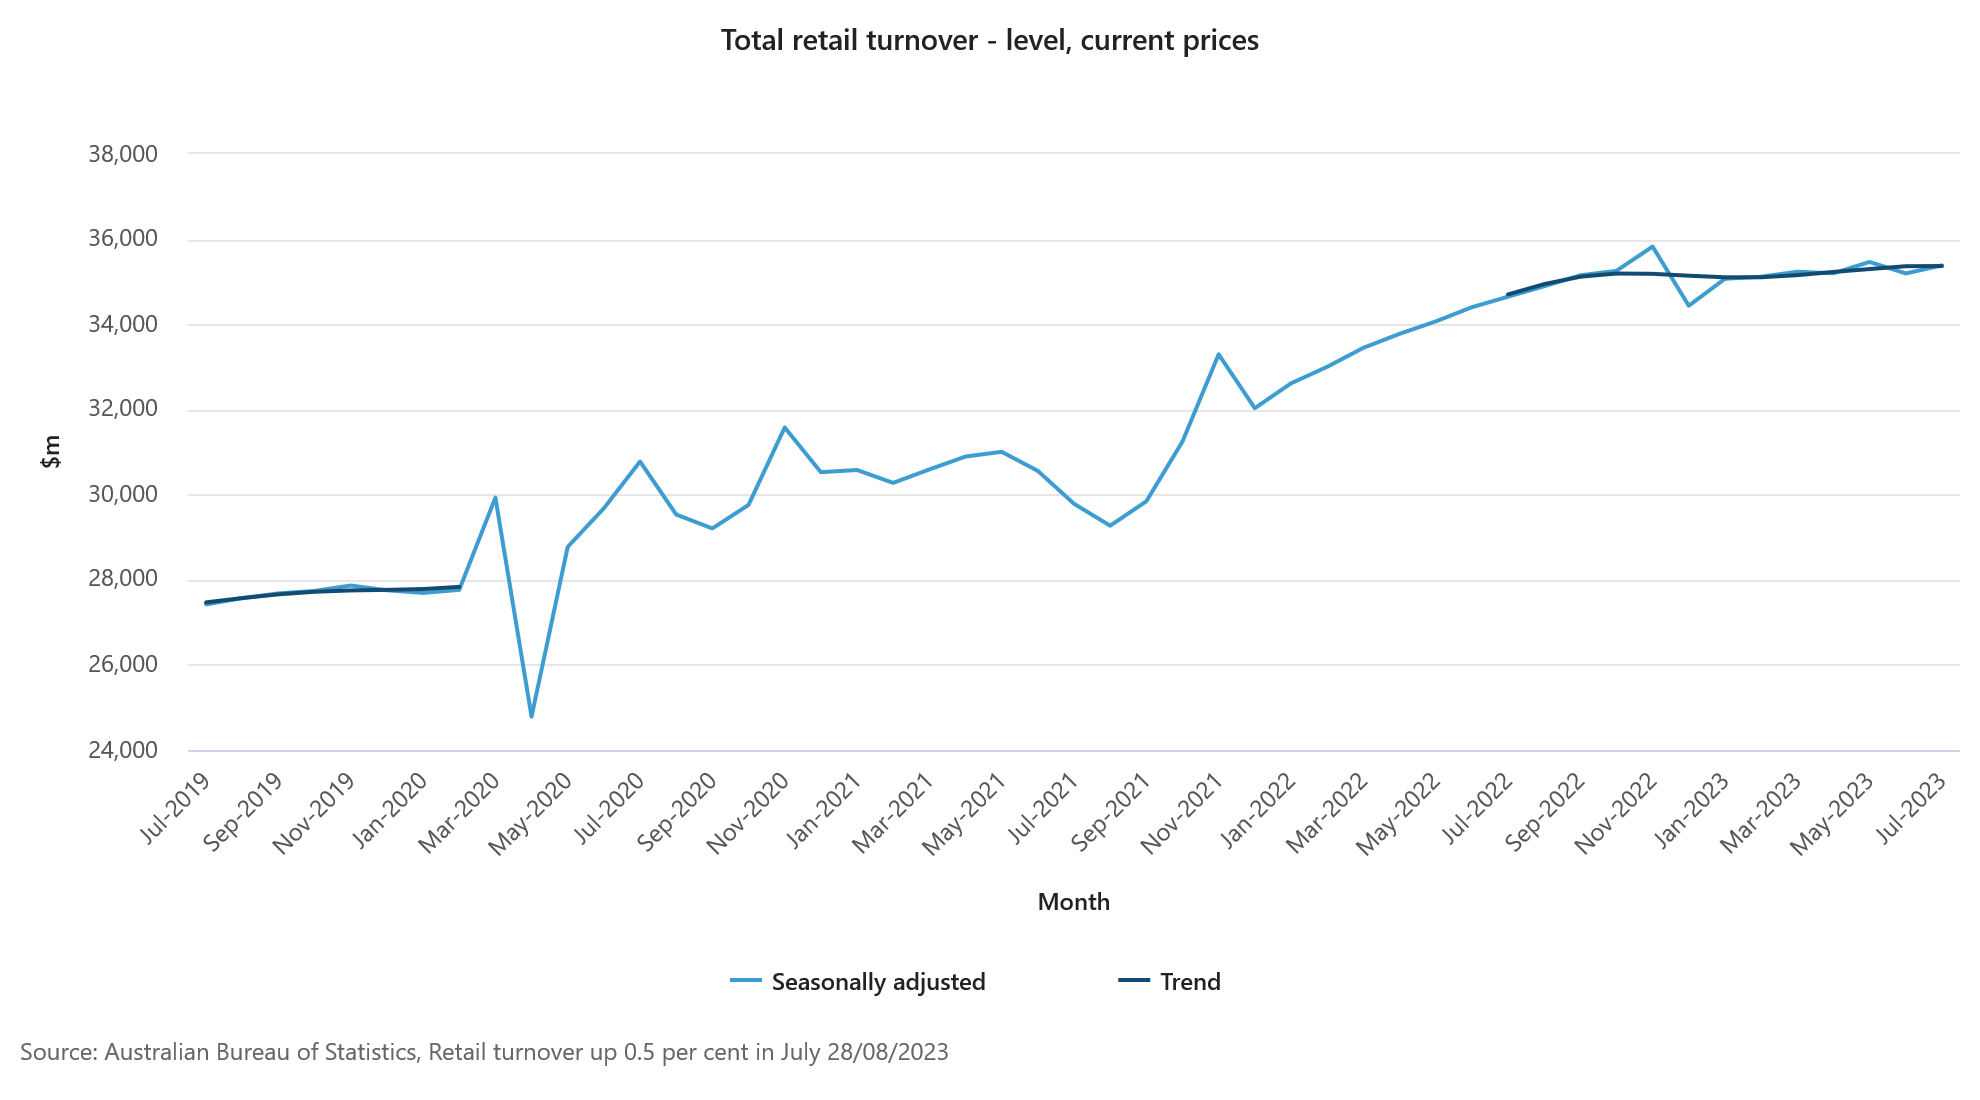
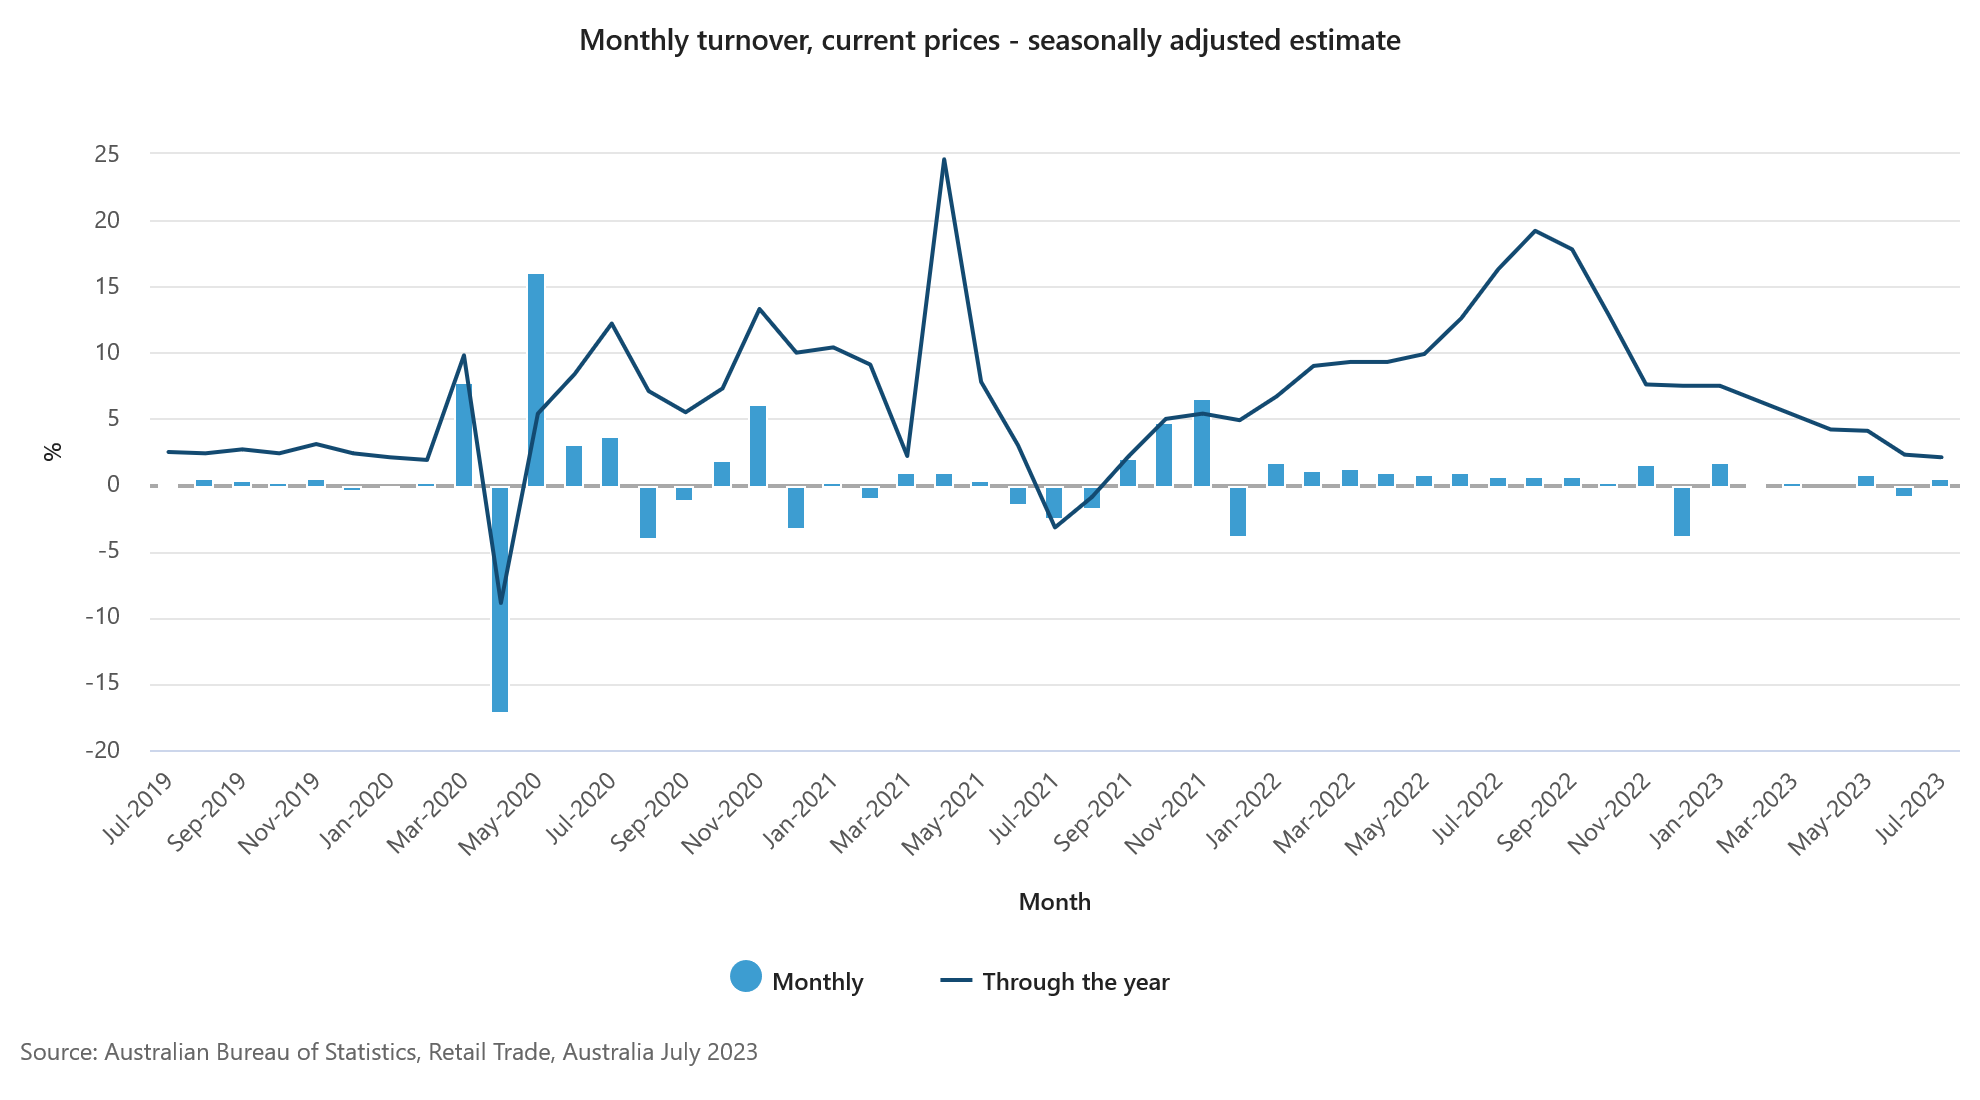
Australia's retail sales turnover for July showed a 0.5% mom increase, reaching AUD 35.38B, surpassing anticipated 0.3% mom rise. When compared to figures from July 2022, turnover has risen by 2.1% yoy.
Commenting on the rebound, Ben Dorber, ABS head of retail statistics, noted, "The rise in July is a partial reversal of last month's sharp decline in turnover." He attributed the June dip to "weaker-than-usual end of financial year sales."
However, Dorber cautioned against interpreting July numbers as a sign of robust retail health. Elaborating on the sector's underlying momentum, he stated, "While there was a rise in July, underlying growth in retail turnover remained
Supporting this perspective, Dorber pointed out the lack of substantial movement in the trend terms: "In trend terms, retail turnover was unchanged in July and up only 1.9 per cent compared to July 2022, despite considerable price growth over the year."
Fed Mester: Another hike needed as timing crucial in taming inflation
Cleveland Fed President Loretta Mester indicated her support for another rate hike, albeit with flexibility on its exact timing. "It doesn't necessarily have to be September, but I think this year," she commented on Saturday.
Mester's focus was clear: Fed needs to bring inflation down to 2% target by the end of 2025. "The longer we let inflation remain above 2%, we're building in a higher and higher price level," she stressed, adding, "that's why timely matters to me."
Mester acknowledged that her stance in June favored rate cuts in the latter half of 2024. However, this could be subject to revision at the upcoming September rate-setting meeting, in light of the current inflation dynamics.
"I'm going to have to reassess that because, again, it's going to be, how quickly do you think inflation is moving down?" she mused. "I do not want to be in a position of prematurely loosening policy."
BoJ Ueda: Underlying inflation is still a bit below our target
In the face of mounting economic uncertainties, BoJ Governor Kazuo Ueda provided insights on Japan's monetary stance and the regional economic dynamics. Bank of Japan, despite witnessing annual inflation of 3.1% in July, anticipates softening of this rate towards year-end.
Speaking on Saturday at the Jackson Hole Symposium, Ueda remarked, "We think that underlying inflation is still a bit below our target," subsequently justifying their persistence with the current monetary easing framework by stating, "This is why we are sticking with our current monetary easing framework."
Despite the inflationary indicators, health of Japan's domestic demand remains a focal point for the central bank. Ueda highlighted that domestic demand appears to maintain a "healthy trend," but swiftly added a caveat: "although that's something that needs to be checked with" Q3 data.
Addressing the wider Asian economic landscape, Ueda did not mince his words, labeling China's recent economic deceleration a "disappointment," and highlighting July's data as skewing "on the weak side." Diving deeper into China's challenges, he pinpointed, "The underlying problem appears to be the adjustment in the property sector and the spillover to the rest of the economy."
However, it's not all gloomy on the horizon. Ueda acknowledged the US economy's resilience, noting its "relative strength" as a potential counterbalance, offering "some offset" to Japan amidst regional economic fluctuations.
EUR/USD Faces Uphill Task Near 1.0850
Key Highlights
- EUR/USD extended decline and tested the 1.0765 level.
- A connecting bearish trend line is forming with resistance near 1.0850 on the 4-hour chart.
- GBP/USD is now trading below the 1.2650 resistance.
- USD/JPY is eyeing more gains above the 146.55 resistance.
EUR/USD Technical Analysis
The Euro remained in a bearish zone below the 1.1000 level against the US Dollar. EUR/USD extended decline and traded below the 1.0920 support.

Looking at the 4-hour chart, the pair settled below the 1.0850 level, the 100 simple moving average (red, 4 hours) and the 200 simple moving average (green, 4 hours).
The pair tested the 1.0765 zone. A low is formed near 1.0766 and the pair is now consolidating losses. It is trading just above the 23.6% Fib retracement level of the downward move from the 1.0930 swing high to the 1.07616 low.
On the upside, an initial resistance is near the 1.0830 level. There is also a connecting bearish trend line forming with resistance near 1.0850 on the same chart.
The trend line is near the 50% Fib retracement level of the downward move from the 1.0930 swing high to the 1.07616 low. A close above 1.0850 could start a decent increase. In the stated case, the pair could rise toward the 1.0920 level. Any more gains could start a fresh increase toward the 1.0980 level.
If not, the pair might react to the downside toward the 1.0765 support. The next key support is seen near the 1.0740 level.
If there is a move below 1.0740, the pair could dive toward 1.0650. Any more gains might open the doors for a test of 1.0500.
Looking at GBP/USD, the pair is still trading in a bearish zone and there is a risk of more downsides below the 1.2600 level.
Economic Releases
- Dallas Fed Manufacturing Business Index for August 2023 – Forecast -21.6, versus -20.0 previous.
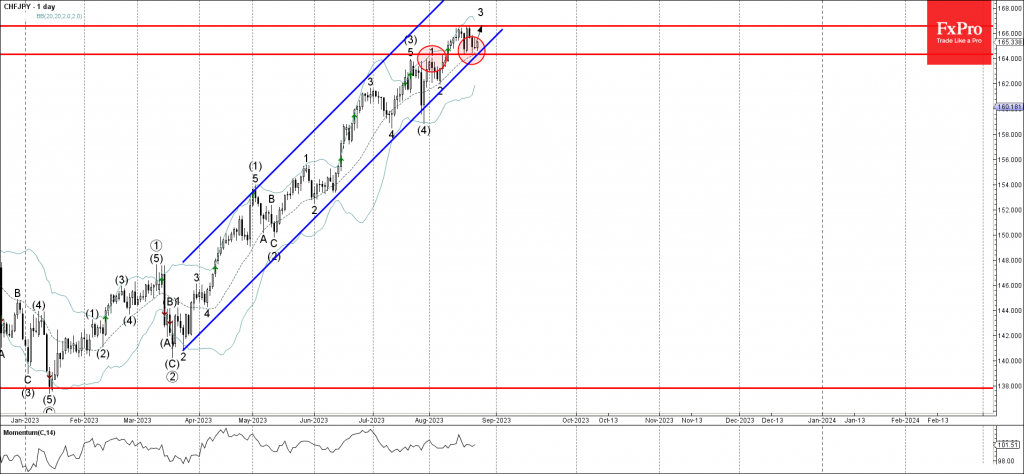
CHFJPY Wave Analysis
- CHFJPY reverses from support level 164.30
- Likely to rise to resistance level 166.60
CHFJPY currency pair earlier reversed up from the support level 164.30 (former resistance that stopped the previous impulse wave 1 at the start of August).
The support level 164.30 was strengthened by the nearby 20-day moving average and by the support trendline of the daily up channel from March.
Given the strong daily uptrend, CHFJPY can be expected to rise further to the next resistance level 166.60 (which reversed the pair earlier this month).
USDCAD Wave Analysis
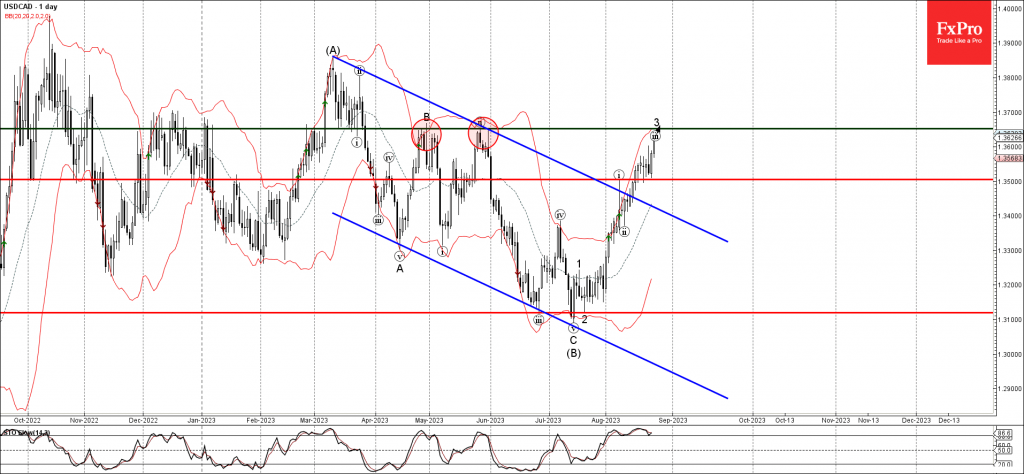
- USDCAD reverses from support at 1.3500
- Likely to rise to resistance level 1.3650
USDCAD recently bounced back from the support level 1.3500 (former resistance that stopped the previous impulse wave (i) at the start of August).
The pair had previously broken the daily descending channel from March, which accelerated the active short-term impulse wave 3 of the intermediate impulse wave (C) from July.
Given the strong gains in the USD, USDCAD is expected to continue rising towards the next resistance level of 1.3650 (which reversed the previous waves B and ii, the target for the completion of the active impulse wave 3).