Sample Category Title
Crypto Market Holds Positions But Still Looks Down
Market Picture
Despite a mid-week spike in volatility, the cryptocurrency market remained virtually unchanged from the previous week’s capitalisation level, hovering around $1.050 trillion (-1% in 7 days). Bitcoin’s decline was a negligible 0.7%, while altcoins suffered losses of around 2%.
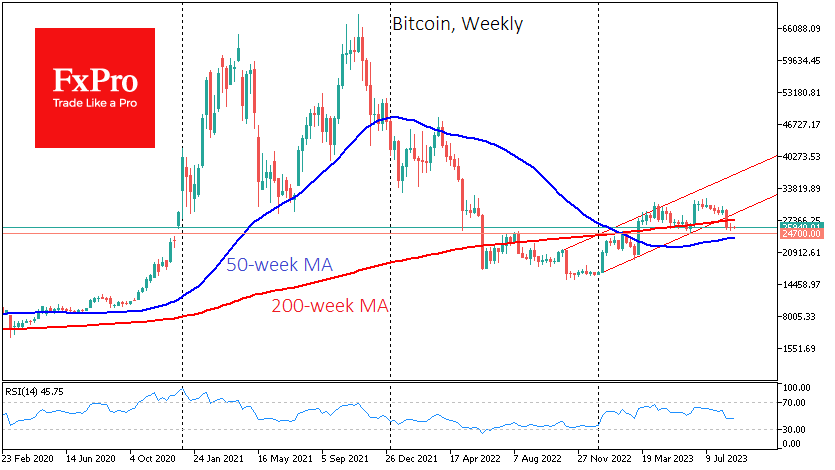
The technical picture for Bitcoin remains bearish on weekly timeframes, as the price is below its 200-week average and outside of its ascending channel. The most likely short-term outlook is for a decline to the $23.9-24.6K region, with the lower boundary being the 50-week average and the upper one being the pivot area from last August.
According to Santiment, large investors continue to accumulate positions. The number of wallets with balances between 10 and 10,000 BTC totalled 156,600, and these accounts have accumulated $308.6 million since the 17th of August.
News Background
Bitcoin and other cryptocurrencies could fall in the short term, although the decline will be limited, JPMorgan warned. The bank said the liquidation of long positions is nearing completion rather than being in its early stages.
Tether has updated its report on the state of reserves providing liquidity to the USDT. The data shows assets exceed $86.1 billion, and liabilities exceed $82.8 billion.
Mastercard and Visa refuse to issue cryptocurrency payment cards for Binance amid the exchange’s regulatory troubles. In March, the CFTC filed a civil lawsuit against Binance. In June, the SEC filed 13 charges against the exchange.
GBP/JPY Daily Outlook
Daily Pivots: (S1) 183.55; (P) 183.98; (R1) 184.60; More...
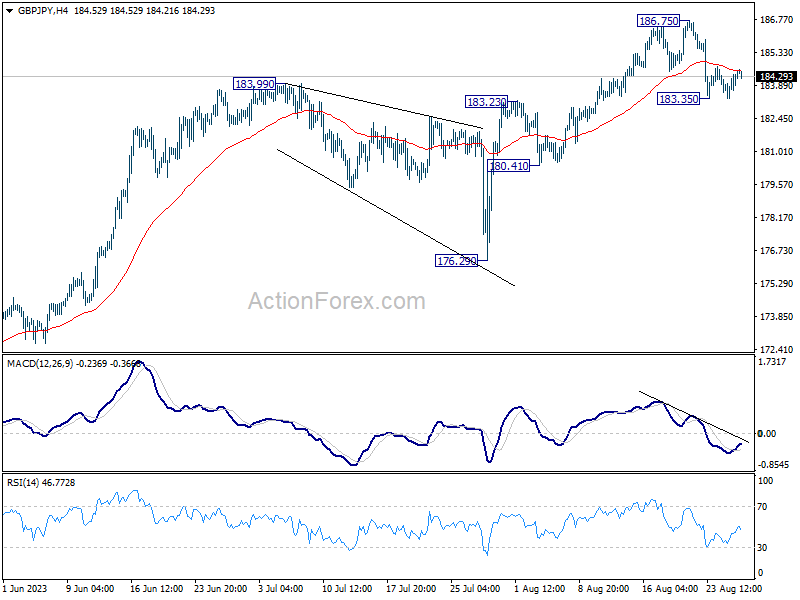
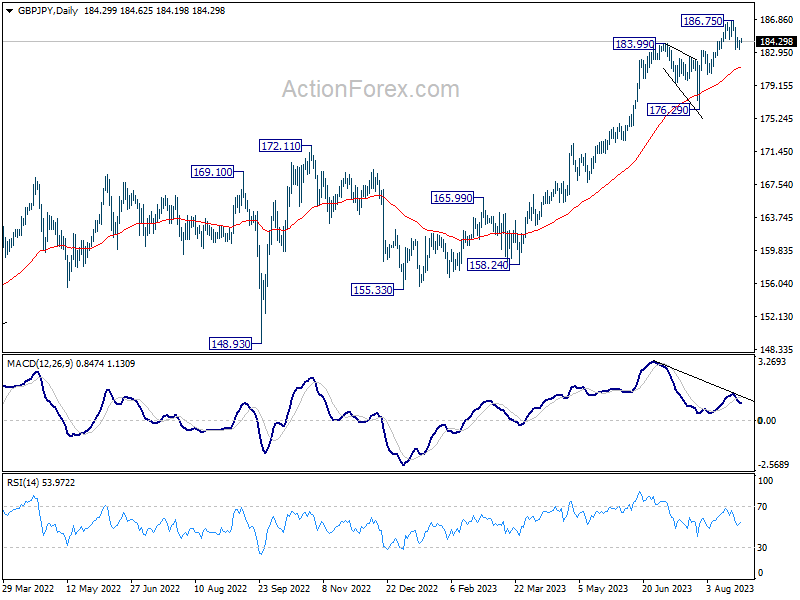
Intraday bias in GBP/JPY remains neutral for the moment. Risk will stays on the downside as long as 186.75 resistance holds. Break of 183.35 will resume the correction from 186.75 short term top to 55 D EMA (now at 181.17) and possibly below.
In the bigger picture, up trend from 123.94 (2020 low) is in progress. Next target is 195.86 (2015 high). This will remain the favored case as long as 176.29 support holds, even in case of deeper pull back.
EUR/JPY Daily Outlook
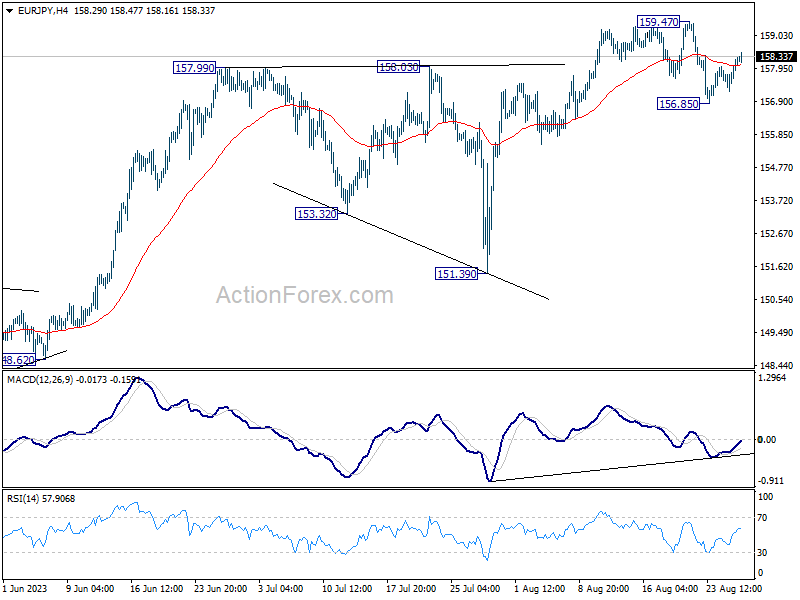
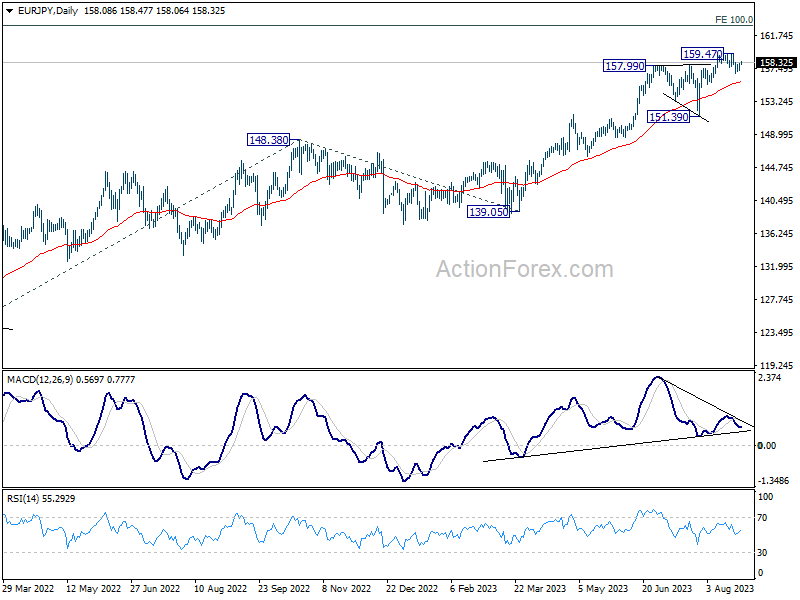
Daily Pivots: (S1) 157.45; (P) 157.85; (R1) 158.47; More....
Intraday bias in EUR/JPY remains neutral at this point. Risk will stay mildly on the downside as long as 159.47 short term top holds. Break of 156.85 will resume the corrective fall to 55 D EMA (now at 155.87) and possibly below.
In the bigger picture, rise from 114.42 (2020 low) is in progress. Next target is 100% projection of 124.37 to 148.38 from 139.05 at 163.06. Sustained break there will pave the way to retest long term resistance at 169.96. This will remain the favored case as long as 151.39 support holds, even in case of deep pull back.
EUR/GBP Daily Outlook
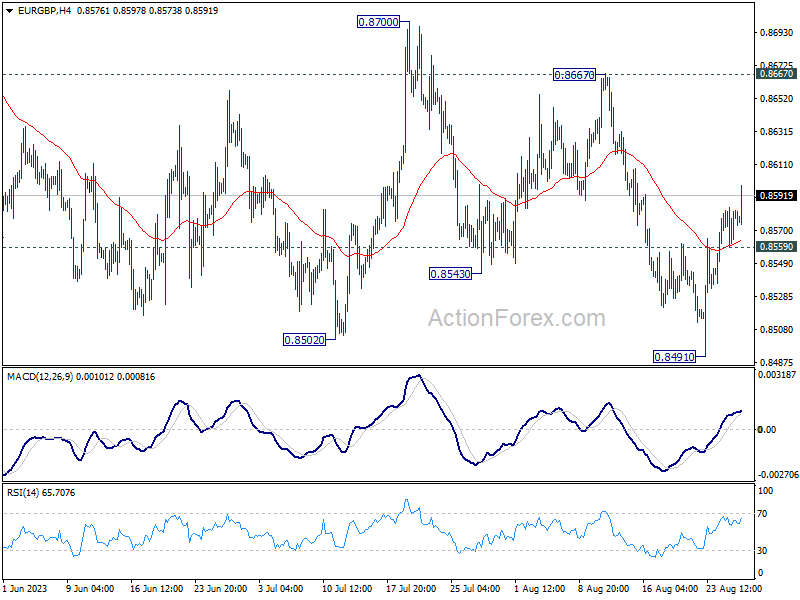
Daily Pivots: (S1) 0.8567; (P) 0.8576; (R1) 0.8592; More...
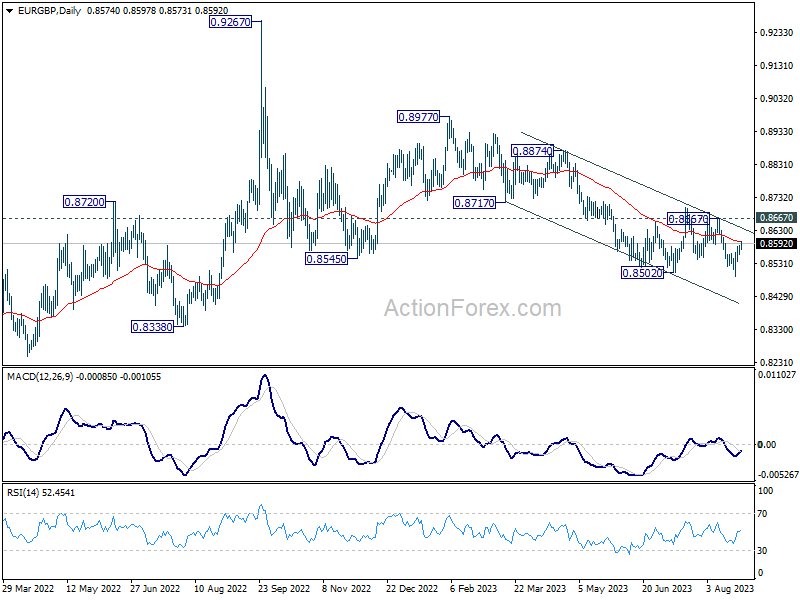
Intraday bias in EUR/GBP remains mildly on the upside as rebound from 0.8491 is extending higher today. Still, overall outlook will stay bearish as long as 0.8667 resistance holds. That is, larger down trend from 0.8977 is in favor to continue. Below 0.8559 minor support will bring retest of 0.8491 low first.
In the bigger picture, the down trend from 0.9267 (2022 high) is seen as part of the long term range pattern from 0.9499 (2020 high). Further decline is in favor as long as 0.8667 resistance holds. Break of 0.8502 will resume the fall towards 0.8201 (2022 low).
EUR/AUD Daily Outlook
Daily Pivots: (S1) 1.6796; (P) 1.6841; (R1) 1.6907; More...
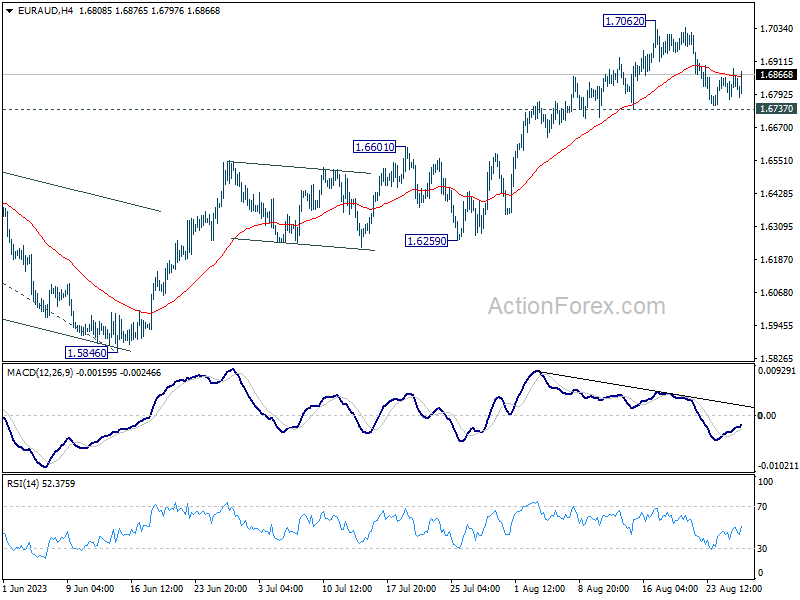
Intraday bias in EUR/AUD stays neutral at this point. And further rally is in favor with 1.6737 support intact. On the upside, firm break of 1.7062 resistance will resume larger up trend to 1.7377 projection level next. However, firm break of 1.6737 will bring deeper pull back to 1.6601 resistance turned support instead.
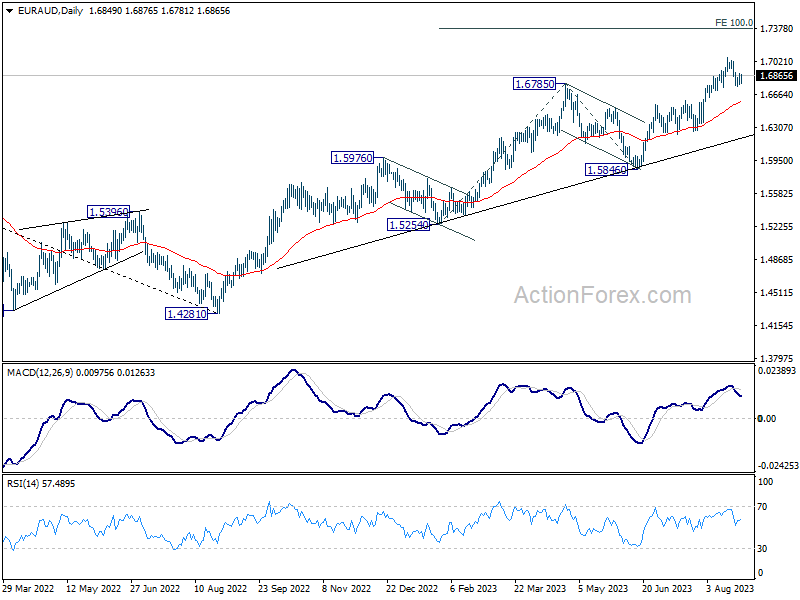
In the bigger picture, the rise from 1.4281 (2022 low) is in progress. Next target is 100% projection of 1.5254 to 1.6785 from 1.5846 at 1.7377. For now, outlook will stay bullish as long as 1.5846 support holds, even in case of another pull back.
EUR/CHF Daily Outlook
Daily Pivots: (S1) 0.9541; (P) 0.9555; (R1) 0.9565; More...
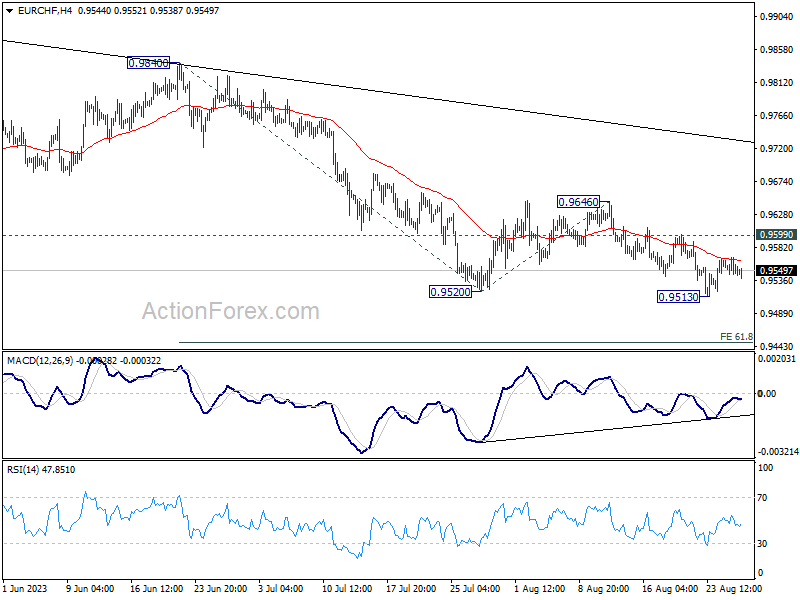
Range trading continues in EUR/CHF and intraday bias remains neutral at this point. Further decline is expected as long as 0.9599 resistance. Break of 0.9513 will target 61.8% projection of 0.9840 to 0.9520 from 0.9646 at 0.9448.
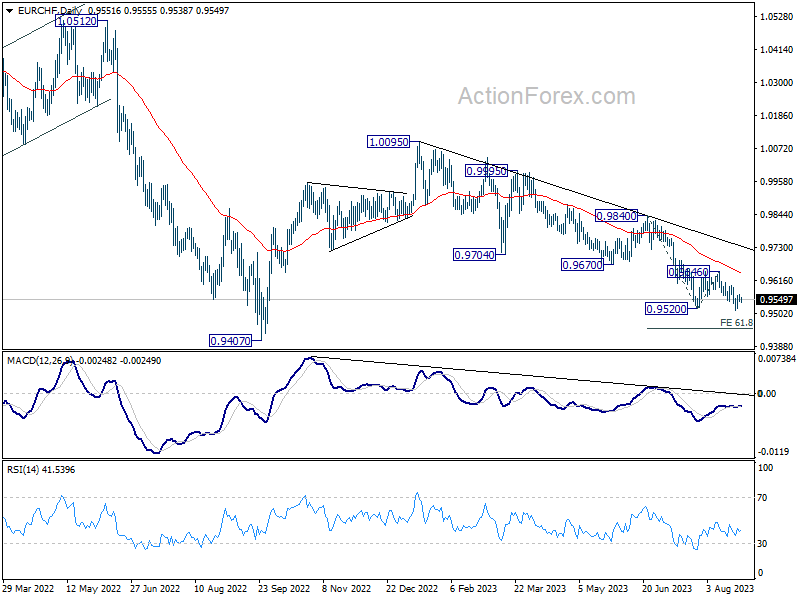
In the bigger picture, medium term outlook is staying bearish as the pair is capped well below falling 55 W EMA (now at 0.9839). Down trend from 1.2004 (2018 high) is in favor to continue. Sustained break of 0.9407 will target 61.8% projection of 1.1149 to 0.9407 from 1.0095 at 0.9018. For now, this will remain the favored case as long as 0.9670 support turned resistance holds, in case of strong rebound.
Gold Reclaims 200-day SMA After Bouncing Off 5-month Low
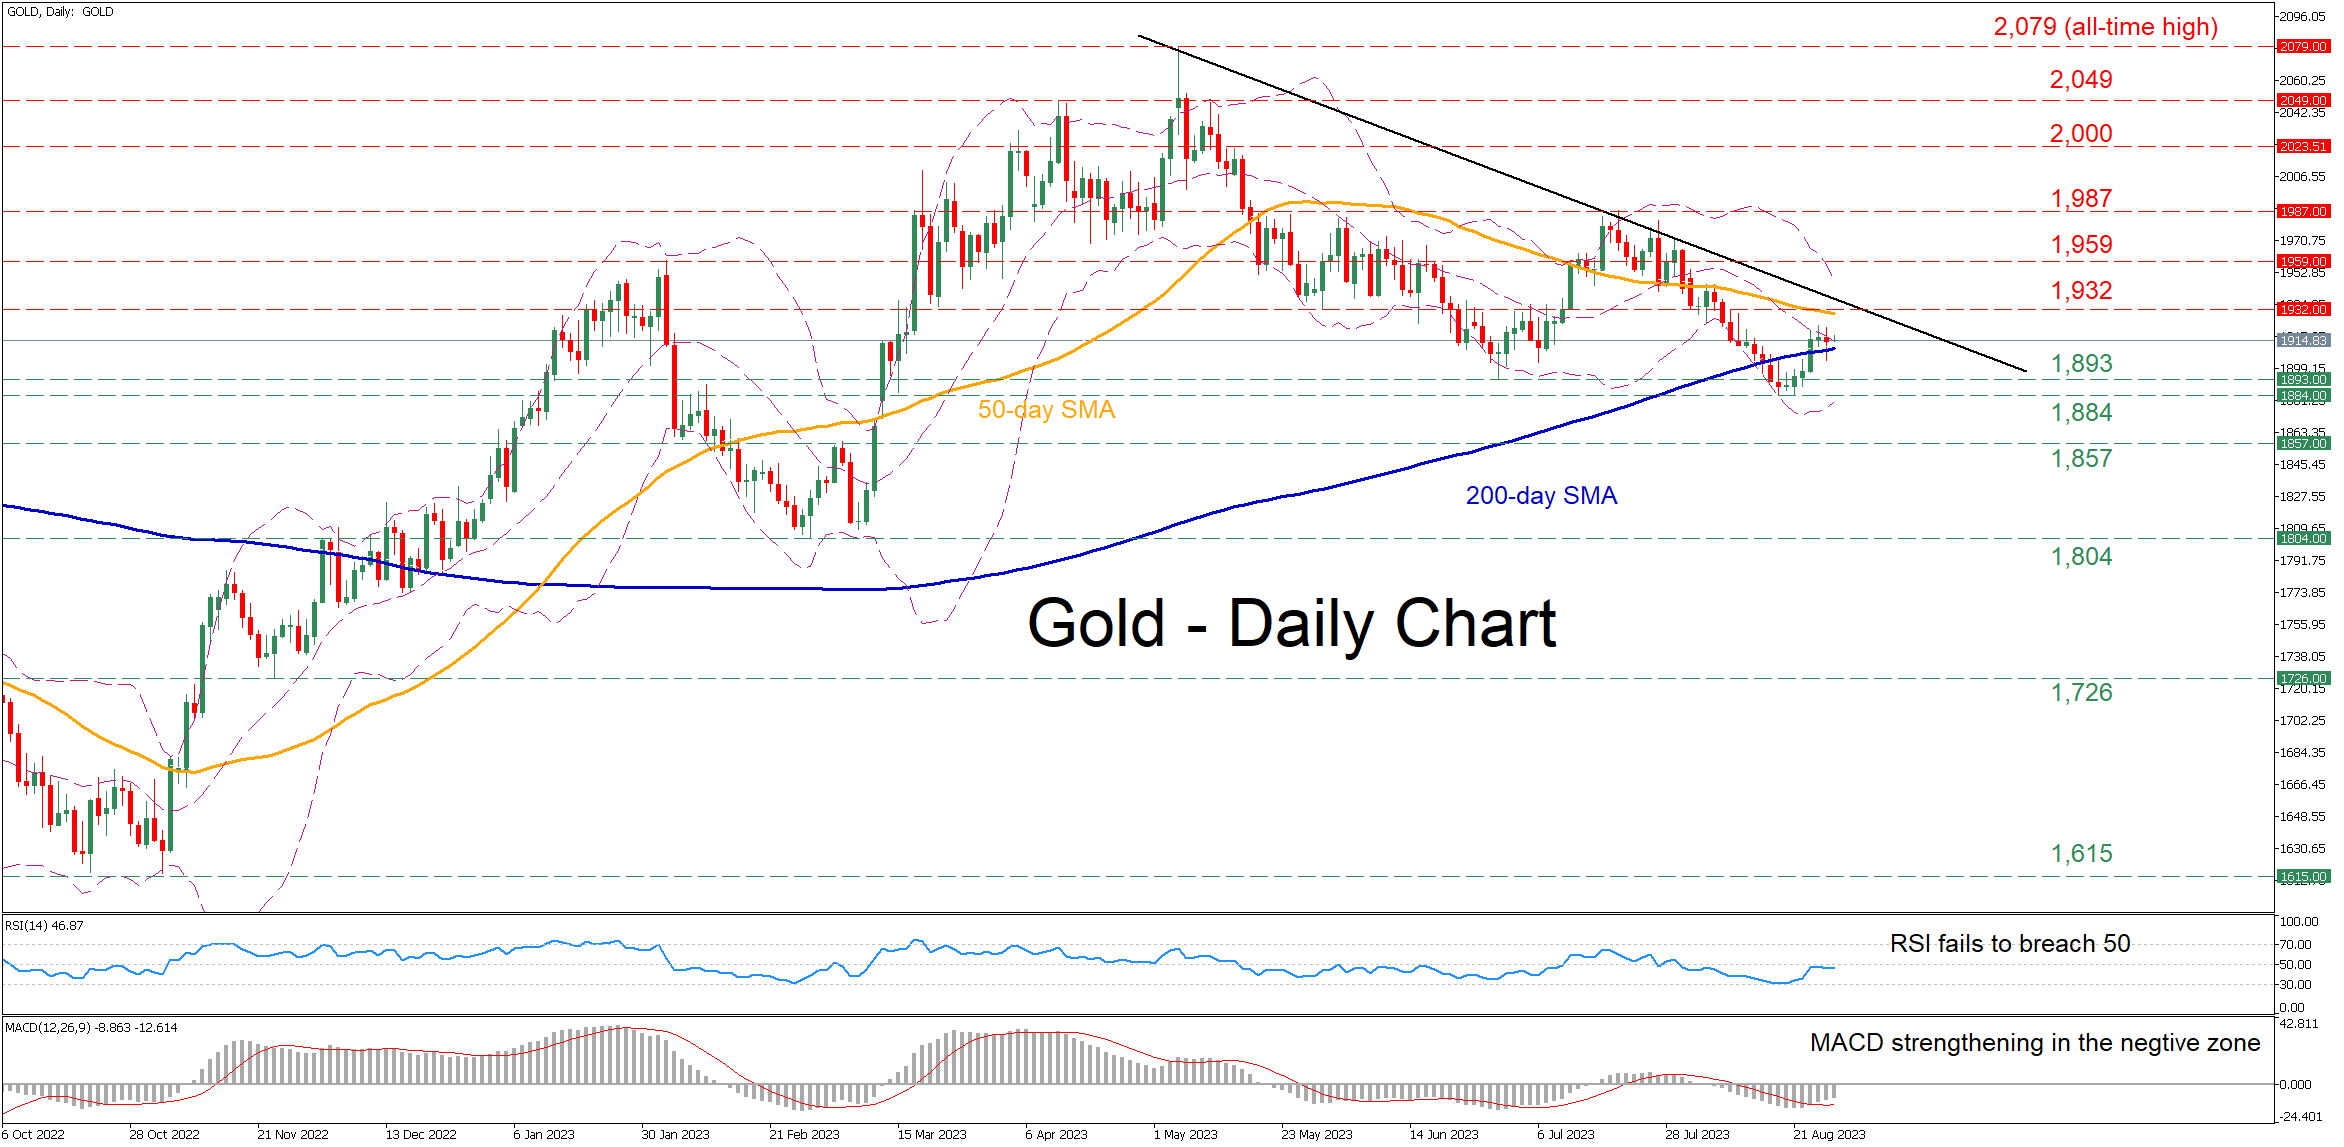
Gold had been experiencing a strong pullback following its recent peak at 1,987, with the price falling to a fresh five-month low of 1,884. However, bullion managed to find its footing and recoup some losses, jumping back above the crucial 200-day simple moving average (SMA).
The momentum indicators currently suggest that bearish forces are fading but remain in control. Specifically, the RSI gained significant ground but failed to pierce through its 50-neutral threshold, while the MACD is strengthening above its red signal line in the negative zone.
If the price extends its recent recovery, immediate resistance could be found at the May low of 1,932, which overlaps with the 50-day SMA. Conquering this barricade, the bulls could attempt to propel the price above the descending trendline that connects its recent lower highs before it tests the February high of 1,959. Further advances may then cease at the July peak of 1,987.
Alternatively, should bullion reverse back lower, the June bottom of 1,893 could act as the first line of defense. A violation of that territory might open the door for the five-month low of 1,884. Should that barricade also fail, the spotlight could turn to the March resistance of 1,857.
In brief, gold appears to be regaining traction after bouncing off strongly from its five-month low. However, a break above the downward sloping trendline is needed for the short-term picture to turn back to bullish.
USD/CAD Daily Outlook
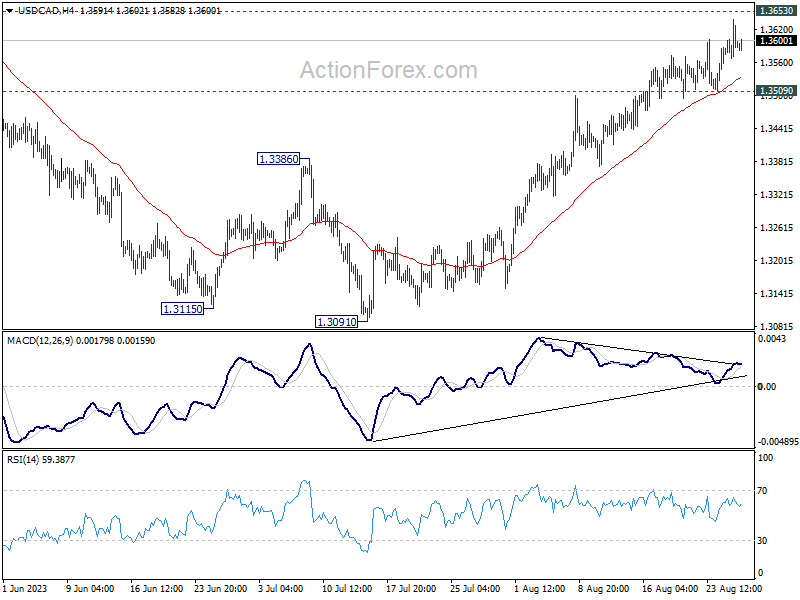
Daily Pivots: (S1) 1.3569; (P) 1.3605; (R1) 1.3640; More....
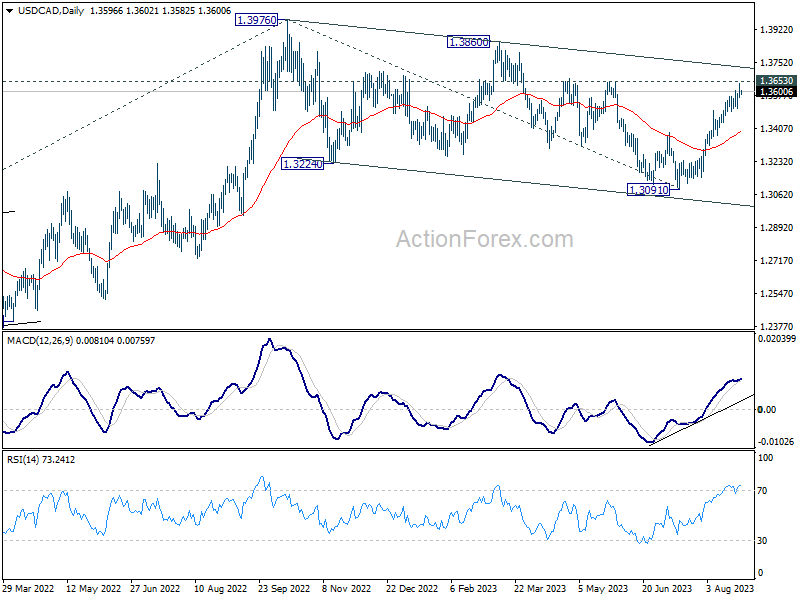
Intraday bias in USD/CAD remains on the upside at this point. Decisive break of 1.3653 resistance there will confirm that correction from 1.3976 has completed, and target a test on this high. On the downside, however, break of 1.3509 support will indicate short term topping, and turn bias to the downside for some correction first.
In the bigger picture, price actions from 1.3976 are viewed as a corrective pattern only. Upon completion, rise from 1.2005 (2021 low) would resume through 1.3976. Next target is 61.8% projection of 1.2005 to 1.3976 from 1.3091 at 1.4309. For now, this will remain the favored case as long as 55 D EMA (now at 1.3387) holds.
AUD/USD Daily Report
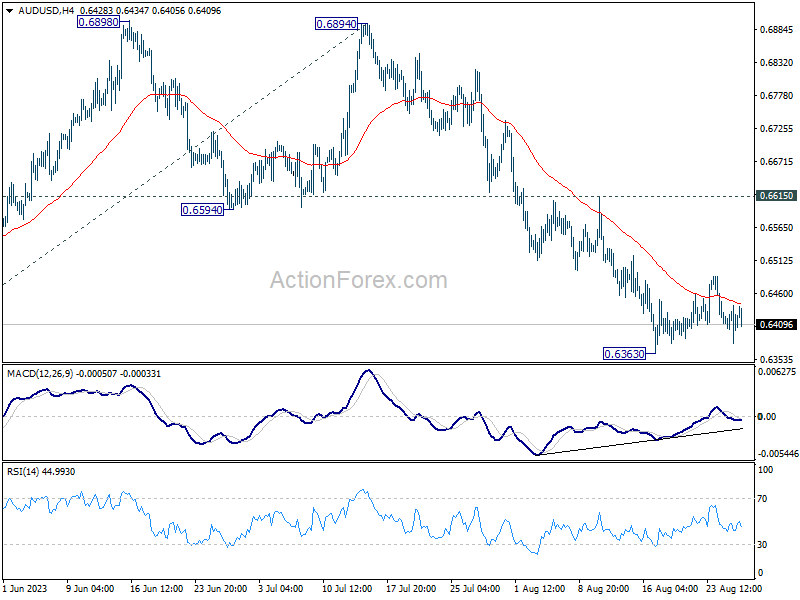
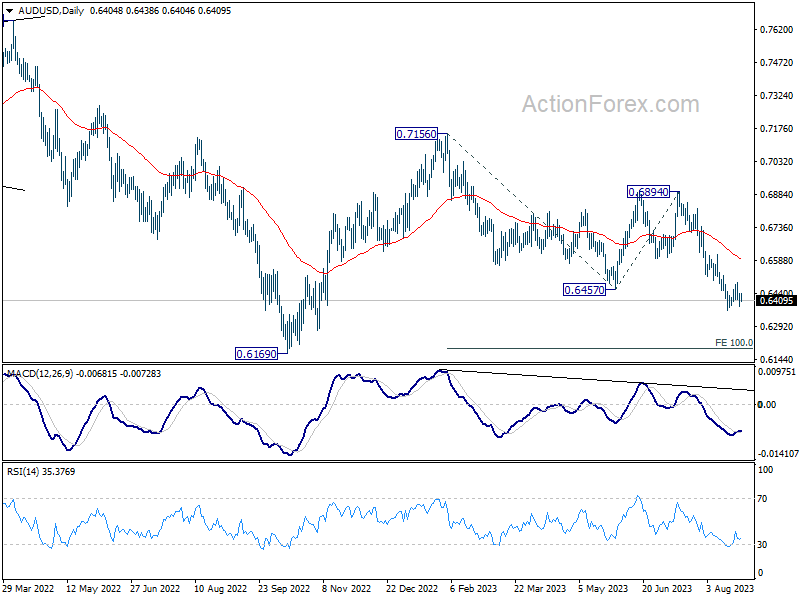
Daily Pivots: (S1) 0.6375; (P) 0.6409; (R1) 0.6436; More...
Intraday bias in AUD/USD remains neutral as consolidation from 0.6363 is extending. While stronger recovery cannot be ruled out, upside should be limited by 0.6615 resistance. Break of 0.6363 will resume larger fall from 0.7156 to 100% projection of 0.7156 to 0.6457 from 0.6894 at 0.6195.
In the bigger picture, current development argues that the down trend from 0.8006 (2021 high) is still in progress. Decisive break of 0.6169 will target 61.8% projection of 0.8006 to 0.6169 to 0.7156 at 0.6021. This will now remain the favored case as long as 0.6894, in case of strong rebound.
USD/JPY Daily Outlook
Daily Pivots: (S1) 145.89; (P) 146.26; (R1) 146.79; More...
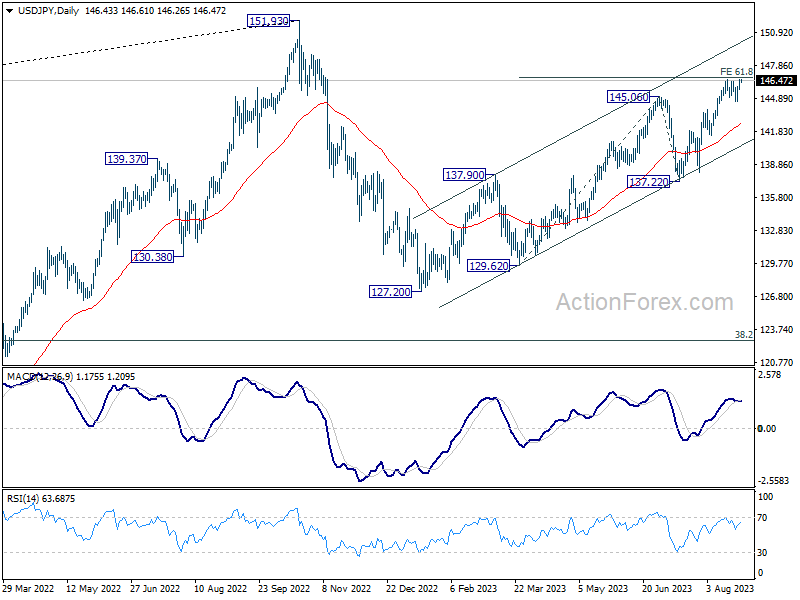
Intraday bias in USD/JPY remains mildly on the upside for the moment. Sustained break of 61.8% projection of 129.62 to 145.06 from 137.22 at 146.76 will pave the way to retest 151.93 high. For now, outlook will stays cautiously bullish as long as 144.52 support holds, in case of retreat.
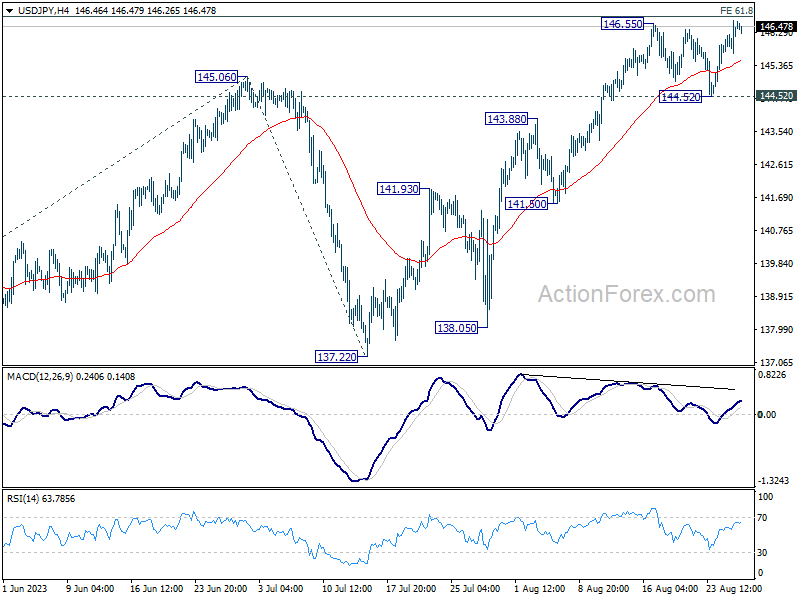
In the bigger picture, overall price actions from 151.93 (2022 high) are views as a corrective pattern. Rise from 127.20 is seen as the second leg of the pattern and could still be in progress. But even in case of extended rise, strong resistance should be seen from 151.93 to limit upside. Meanwhile, break of 137.22 support should confirm the start of the third leg to 127.20 (2023 low) and below.