Sample Category Title
EUR/AUD Daily Outlook
Daily Pivots: (S1) 1.6682; (P) 1.6781; (R1) 1.6832; More...
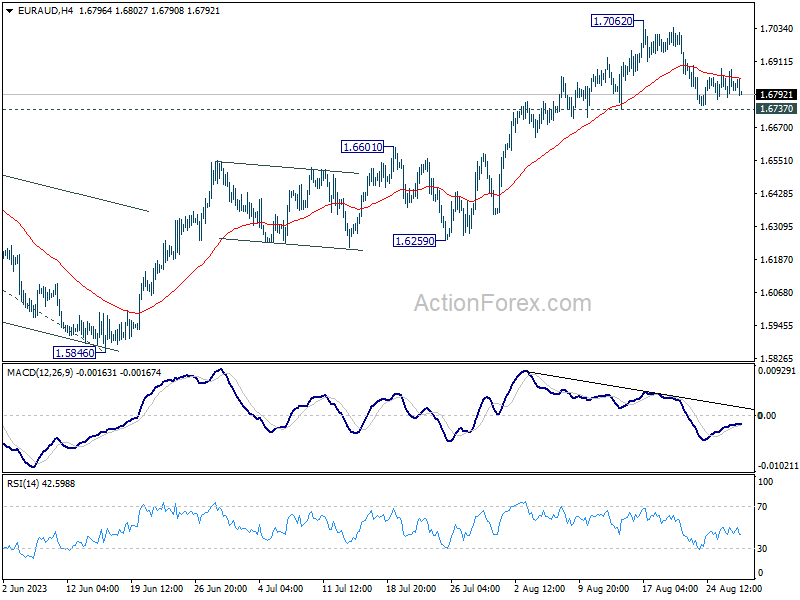
Intraday bias in EUR/AUD remains neutral and outlook is unchanged. Further rise is mildly in favor as long as 1.6737 support holds. On the upside, break of 1.7062 resistance will resume larger up trend to 1.7377 projection level next. However, firm break of 1.6737 will bring deeper pull back to 1.6601 resistance turned support instead.
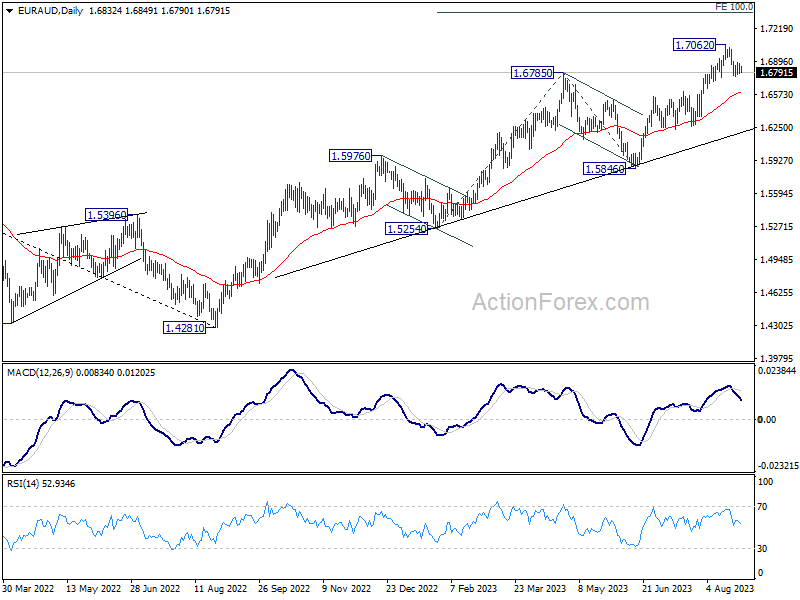
In the bigger picture, the rise from 1.4281 (2022 low) is in progress. Next target is 100% projection of 1.5254 to 1.6785 from 1.5846 at 1.7377. For now, outlook will stay bullish as long as 1.5846 support holds, even in case of another pull back.
EUR/CHF Daily Outlook
Daily Pivots: (S1) 0.9541; (P) 0.9555; (R1) 0.9565; More...
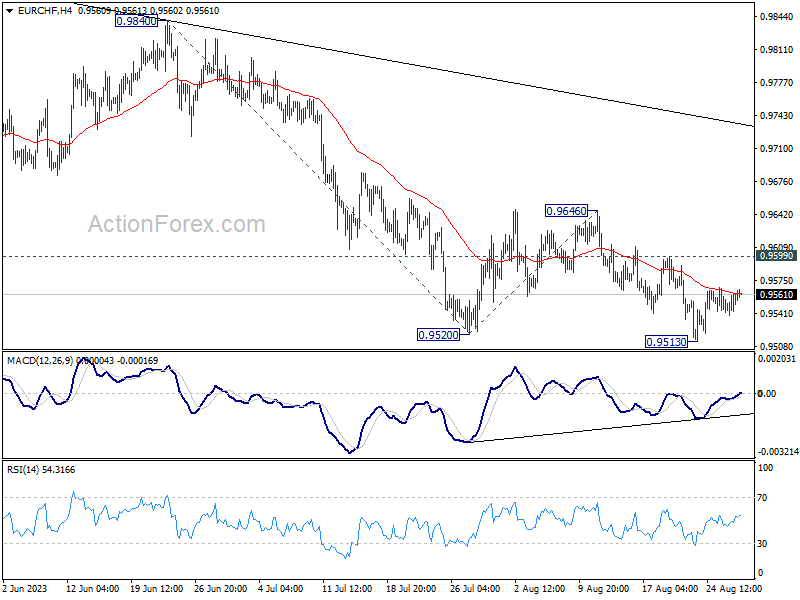
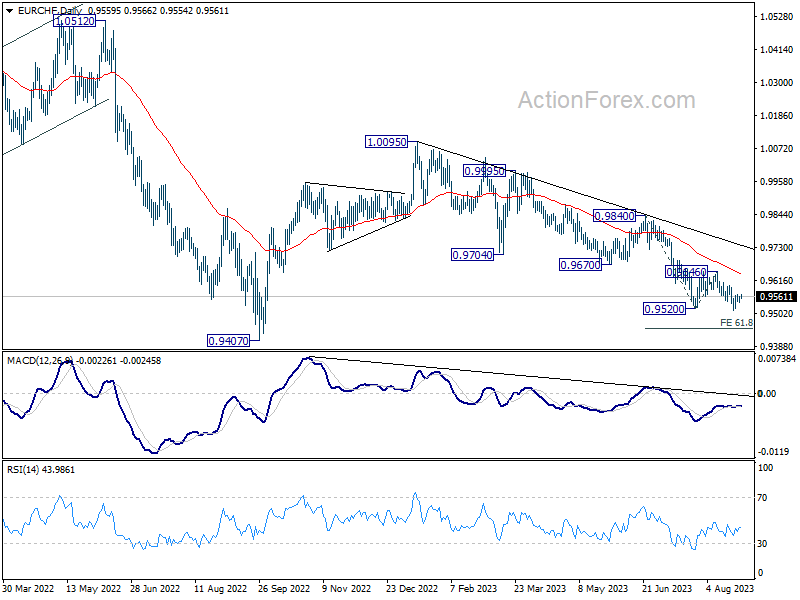
EUR/CHF is extending the consolidation above 0.9513 and intraday bias stays neutral. With 0.9599 resistance intact, further decline is expected. On the downside, firm break of 0.9513 will resume larger down trend from 1.0095. Next target is 61.8% projection of 0.9840 to 0.9520 from 0.9646 at 0.9448.
In the bigger picture, medium term outlook is staying bearish as the pair is capped well below falling 55 W EMA (now at 0.9829). Down trend from 1.2004 (2018 high) is in favor to continue. Sustained break of 0.9407 will target 61.8% projection of 1.1149 to 0.9407 from 1.0095 at 0.9018. For now, this will remain the favored case as long as 0.9670 support turned resistance holds, in case of strong rebound.
Hang Seng Index Technical: Downside Pressure Has Eased
- The recent three weeks of -13.90% decline has reached a key medium-term support level of 17,530.
- The latest reading of its daily MACD trend indicator has indicated a possible pause in the medium-term downtrend movement.
- Key short-term support to watch will be at 17,970 with intermediate resistances at 18,600 and 18,910.
The Hang Seng Index is set to record its worst monthly performance since October 2022 as it recorded a month-to-date loss of -9.70% as of yesterday, 28 August 2023, on the track to be one of the worst-performing major benchmark stock indices in August.
The current medium-term bearish onslaught has been primarily attributed to a heightened deflationary risk spiral in China and contagion risk from indebted property developers coupled with a lack of material stimulus measures to negate these negative repercussions.
In the lens of technical analysis, price actions of liquid tradable financial assets do not move in a vertical movement where there are certain periods of time, consolidation or countertrend movements can occur within a longer period of trending phases as market participants infer and digest new information.
Interestingly, the current price actions of the Hong Kong 33 Index (a proxy of the Hang Seng Index futures) are suggesting a potential countertrend movement may be taking shape within a medium-term downtrend phase that is still intact since the 27 January 2023 high of 22,688.
Price actions tested key medium-term support with positive elements
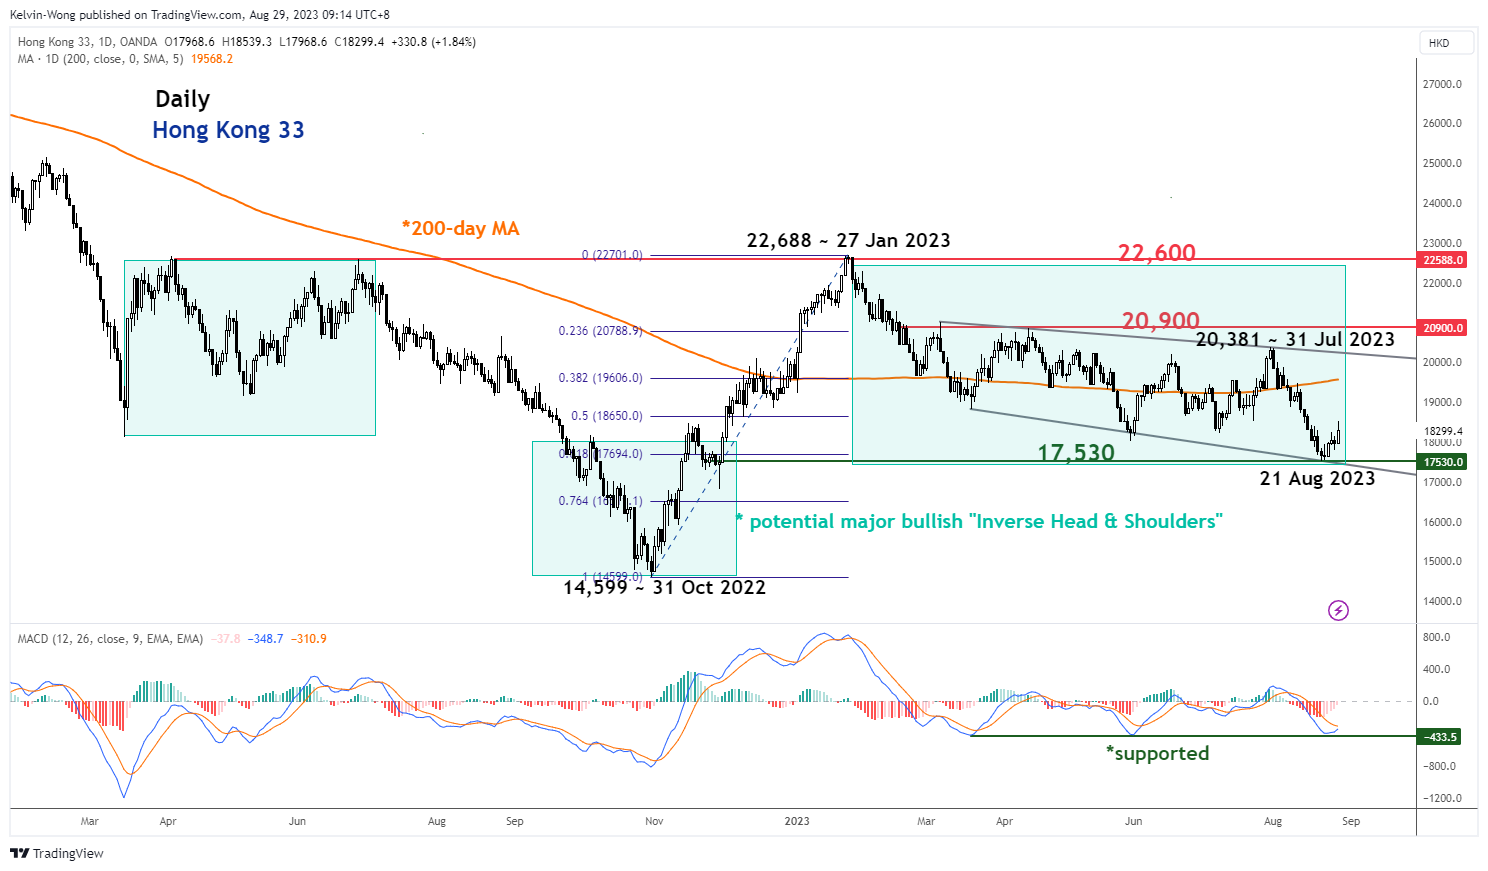
Fig 1: Hong Kong 33 medium-term trend as of 29 Aug 2023 (Source: TradingView, click to enlarge chart)
The recent three weeks of -13.90% decline seen in the Hong Kong 33 Index from its 31 July high of 20,381 has managed to stall and rebounded from a key medium-term support of 17,530 that is being confluence by several different elements; the 28 November 2022 swing low, lower boundary of the “Expanding Wedge” configuration, 76.4% Fibonacci retracement of the prior medium-term up move from 31 October 2022 to 27 January 2023 high.
In addition, the daily MACD trend indicator has managed to stall at parallel horizontal support (bullish divergence) while price actions traced out “lower lows” over a similar period. These observations suggest a possible slowdown in medium-term downside momentum which in turn increases the odds of a countertrend rebound scenario.
Watch the 17,970 key short-term support
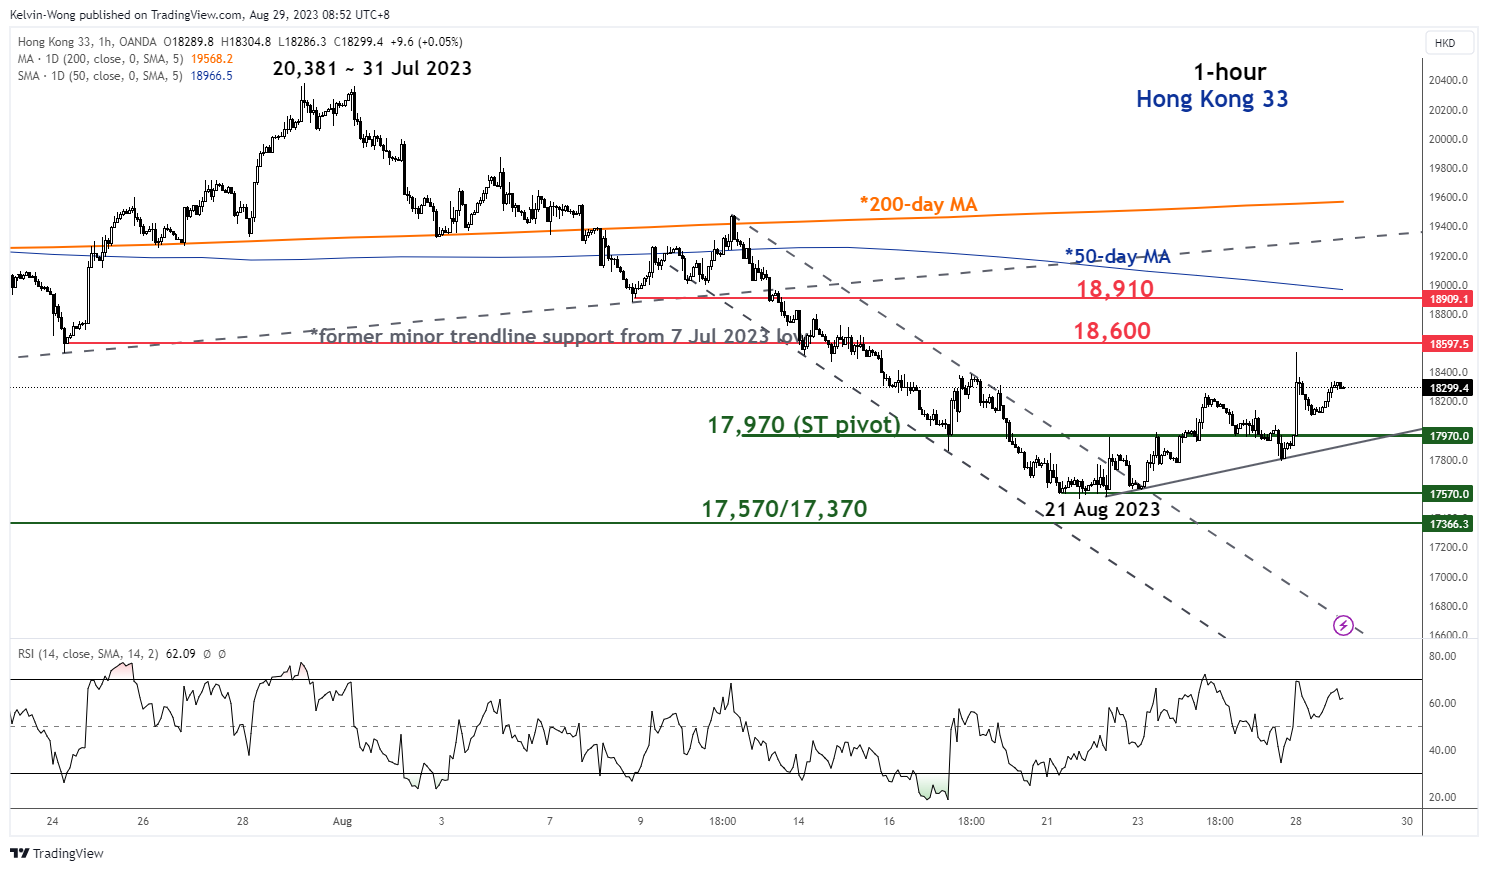
Fig 2: Hong Kong 33 minor short-term trend as of 29 Aug 2023 (Source: TradingView, click to enlarge chart)
The Index has staged a minor rebound of +5.65% from its 21 August 2023 low to print an intraday high of 18,539 yesterday, 28 August on the backdrop of a positive new measure to boost short-term investors’ sentiment in the China stock market where policymakers enacted a 50% reduction to stock trading levy, its first cut since 2008 Great Financial Crisis.
If the 17,970 short-term pivotal support manages to hold ground, the Index may see a further bounce within its ongoing minor countertrend rebound phase towards the next intermediate resistances at 18,600 and 18,910 (also the 50-day moving average).
On the flip side, a break below 17,970 invalidates the countertrend rebound scenario to expose the next immediate support at 17,570/17,370.
GBPUSD Has Scope to Extend lower in Zigzag Correction
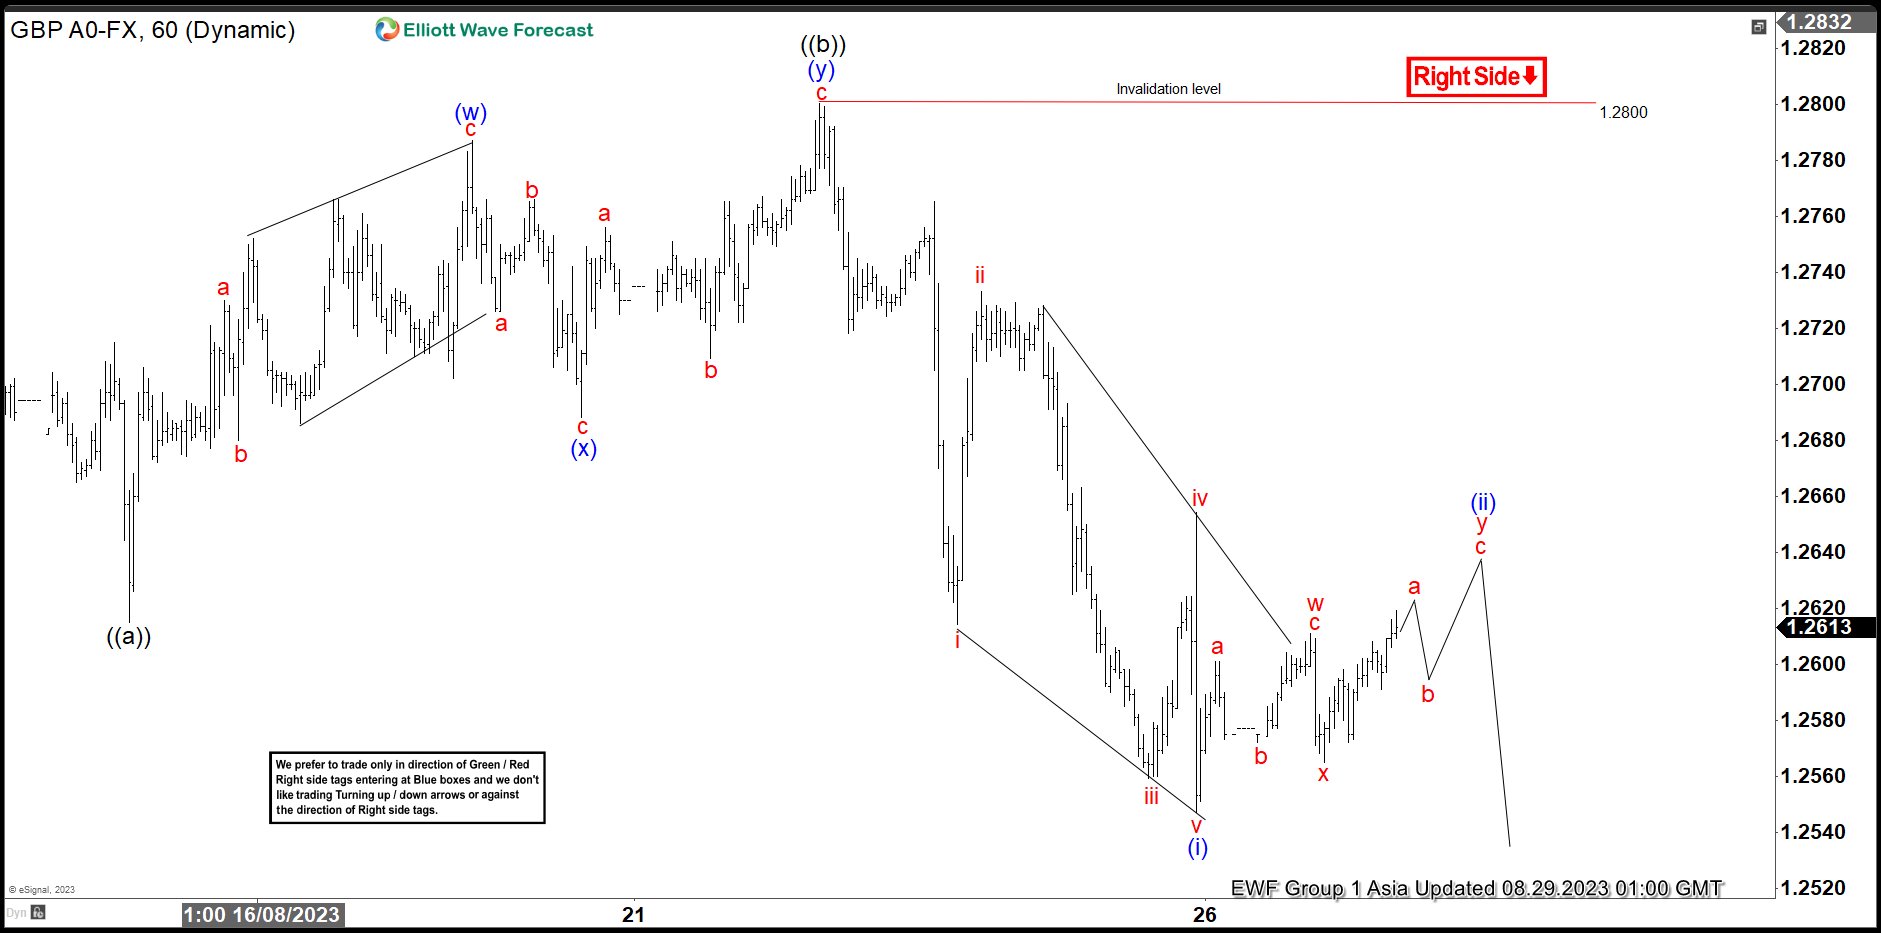
Short Term Elliott Wave view suggests decline from 7.14.2023 high is in progress as a zigzag structure. Down from 7.14.2023 high, wave (i) ended at 1.2797 and wave (ii) rally ended at 1.299. The pair then extended lower in wave (iii) towards 1.2619 and wave (iv) rally ended at 1.2819. Final leg lower wave (v) ended at 1.2615 which completed wave ((a)). The 1 hour chart below shows the wave ((a)) as a starting point. Wave ((b)) corrective rally then unfolded as a double three Elliott Wave structure. Up from wave ((a)), wave (w) ended at 1.278 and dips in wave (x) ended at 1.268. Wave (y) higher ended at 1.28 which completed wave ((b)) in higher degree.
Pair resumed lower in wave ((c)) with subdivision as a 5 waves impulse. Down from wave ((b)), wave i ended at 1.261 and wave ii rally ended at 1.273. The pair resumed lower in wave iii towards 1.256 and rally in wave iv ended at 1.265. Final leg wave v ended at 1.2547 which completed wave (i). Rally in wave (ii) is in progress as 7 swing double three to correct cycle from 8.22.2023 high before it turns lower. Near term, as far as pivot at 1.28 high stays intact, expect the pair to extend lower.
GBPUSD 60 Minutes Elliott Wave Chart
GBPUSD Elliott Wave Video
https://www.youtube.com/watch?v=mj3-h08MkSI
Technical Outlook and Review
DXY:
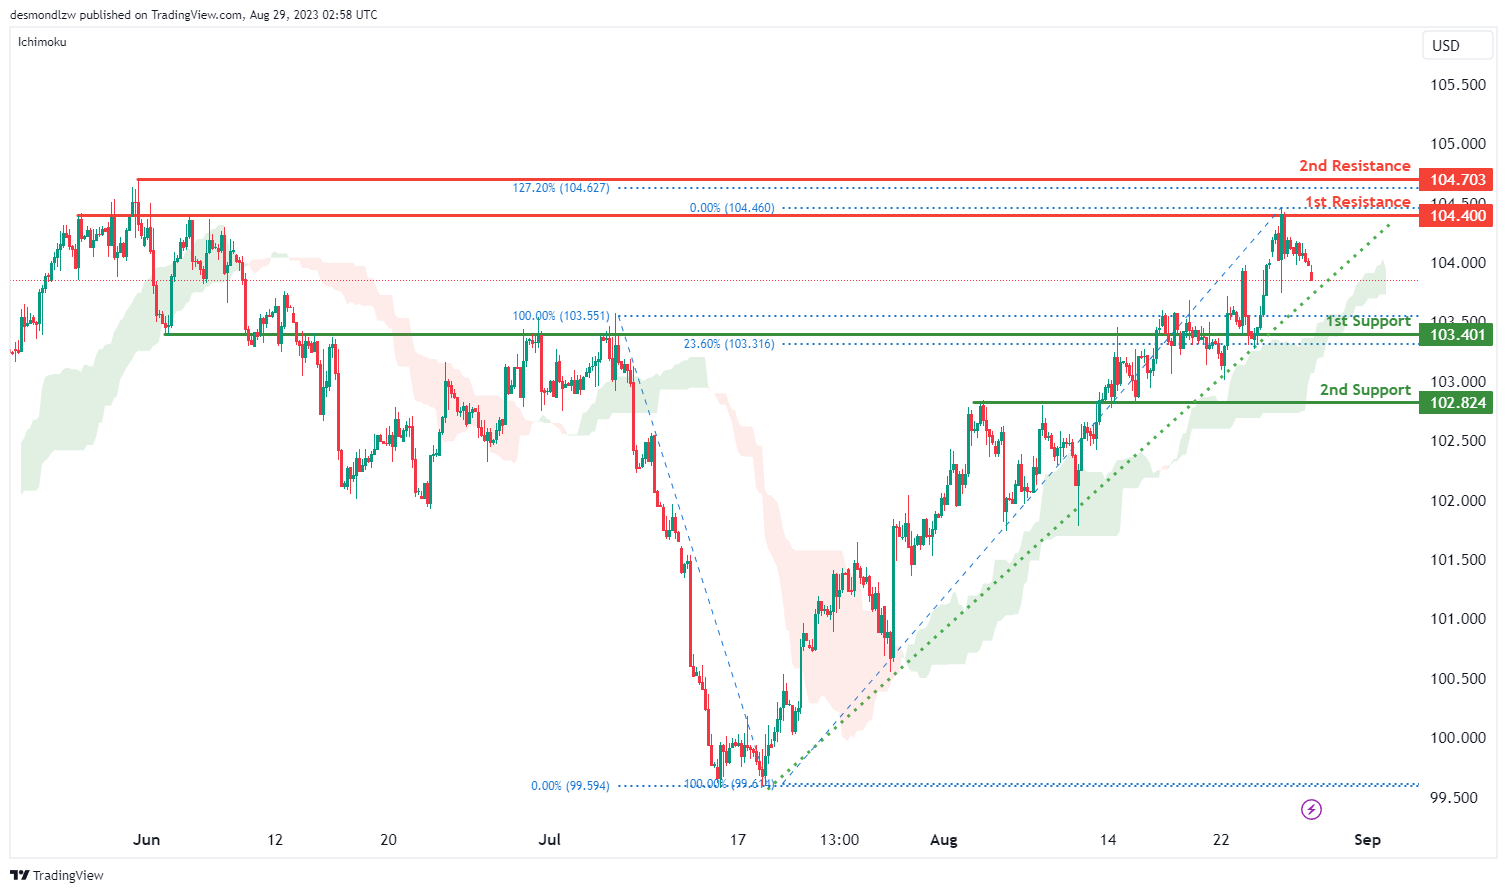
The DXY (US Dollar Index) chart is currently showing bullish overall momentum, suggesting a potential upward trend in the price. The price is above a major ascending trend line, indicating the possibility of further bullish movement, and it’s also above the bullish Ichimoku cloud, which reinforces the bullish sentiment.
There is a potential price movement scenario: a short-term drop to the 1st support level before a bounce and a subsequent rise to the 1st resistance level.
The 1st support level at 103.40 is considered as pullback support. This suggests that if the price experiences a temporary decline, it might find support around this level due to the historical significance of pullback support zones.
The 2nd support level at 102.82 is an overlap support, indicating that this level has acted as support in the past. This adds to the potential strength of this support level, especially since it aligns with the ascending trend line and the Ichimoku cloud, both of which could act as additional support factors.
On the bullish side, the 1st resistance level at 104.40 is marked as an overlap resistance. This means that historical price action has encountered resistance around this level, making it a potentially important area for the price to overcome.
EUR/USD:
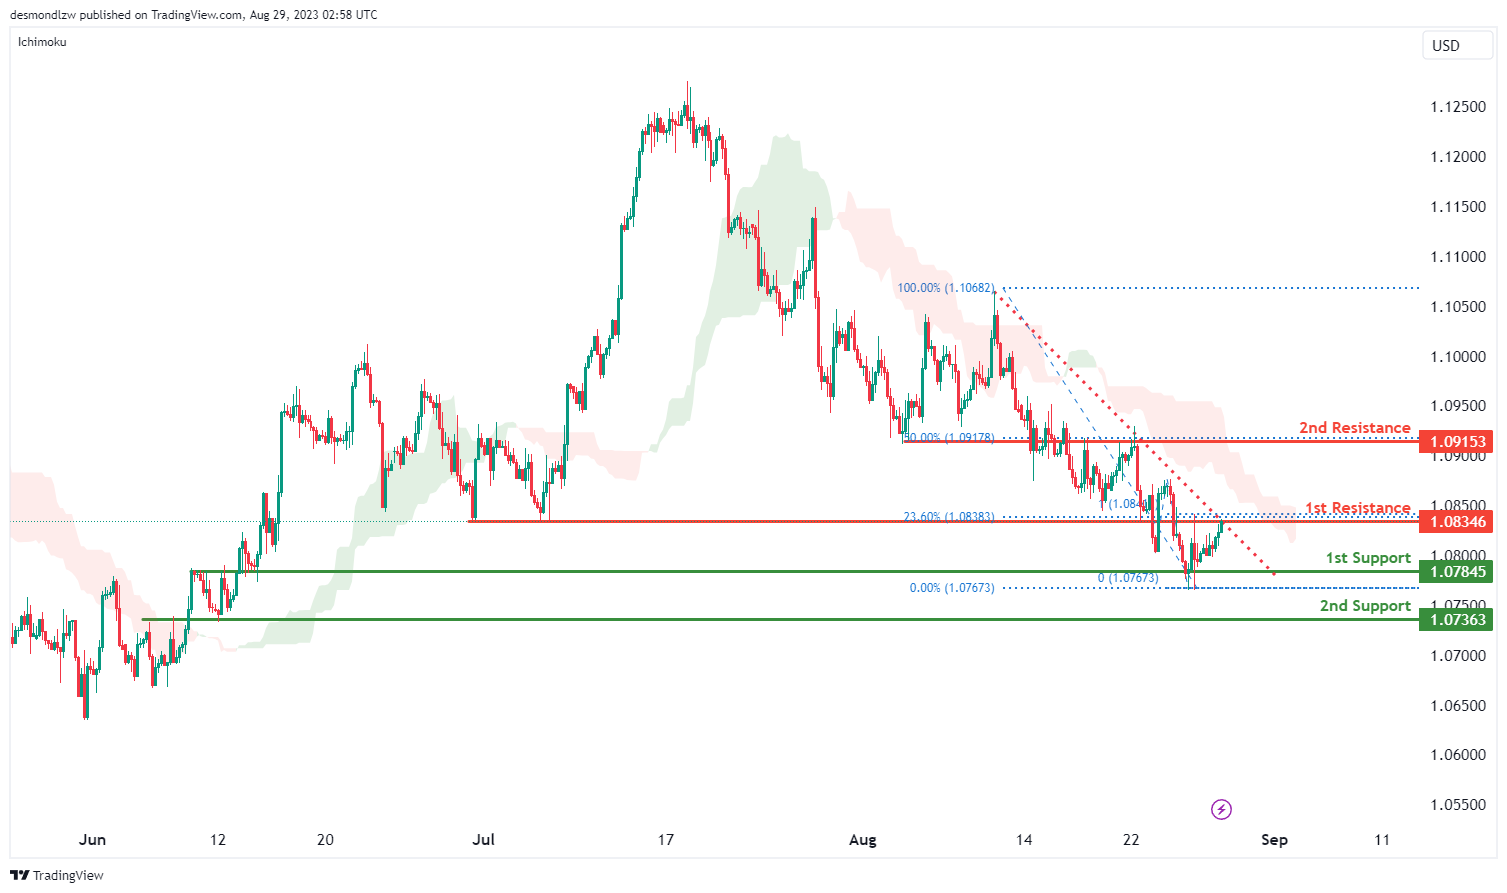
The EUR/USD chart is currently displaying bearish overall momentum, indicating the potential for a downward trend in the price. Additionally, the price is below a major descending trend line, suggesting the presence of bearish momentum. It is positioned just below the bearish Ichimoku cloud, which commonly implies a possible price reversal from that level.
A potential price movement scenario could involve a bearish reaction off the 1st resistance level, leading to a drop towards the 1st support level.
The 1st support level at 1.0736 is identified as an overlapping support. This suggests that historical price action has found support around this level in the past.
The 2nd support level at 1.0736 is also an overlapping support. This further reinforces the potential significance of this level as a support zone.
On the resistance side, the 1st resistance level at 1.0834 is marked as an overlapping resistance. Historical price action has encountered resistance around this level previously, which could make it an important barrier.
The 2nd resistance level at 1.0915 is identified as an overlapping resistance as well as a 50% Fibonacci Retracement level. These factors together contribute to its significance as a potential resistance area.
EUR/JPY:
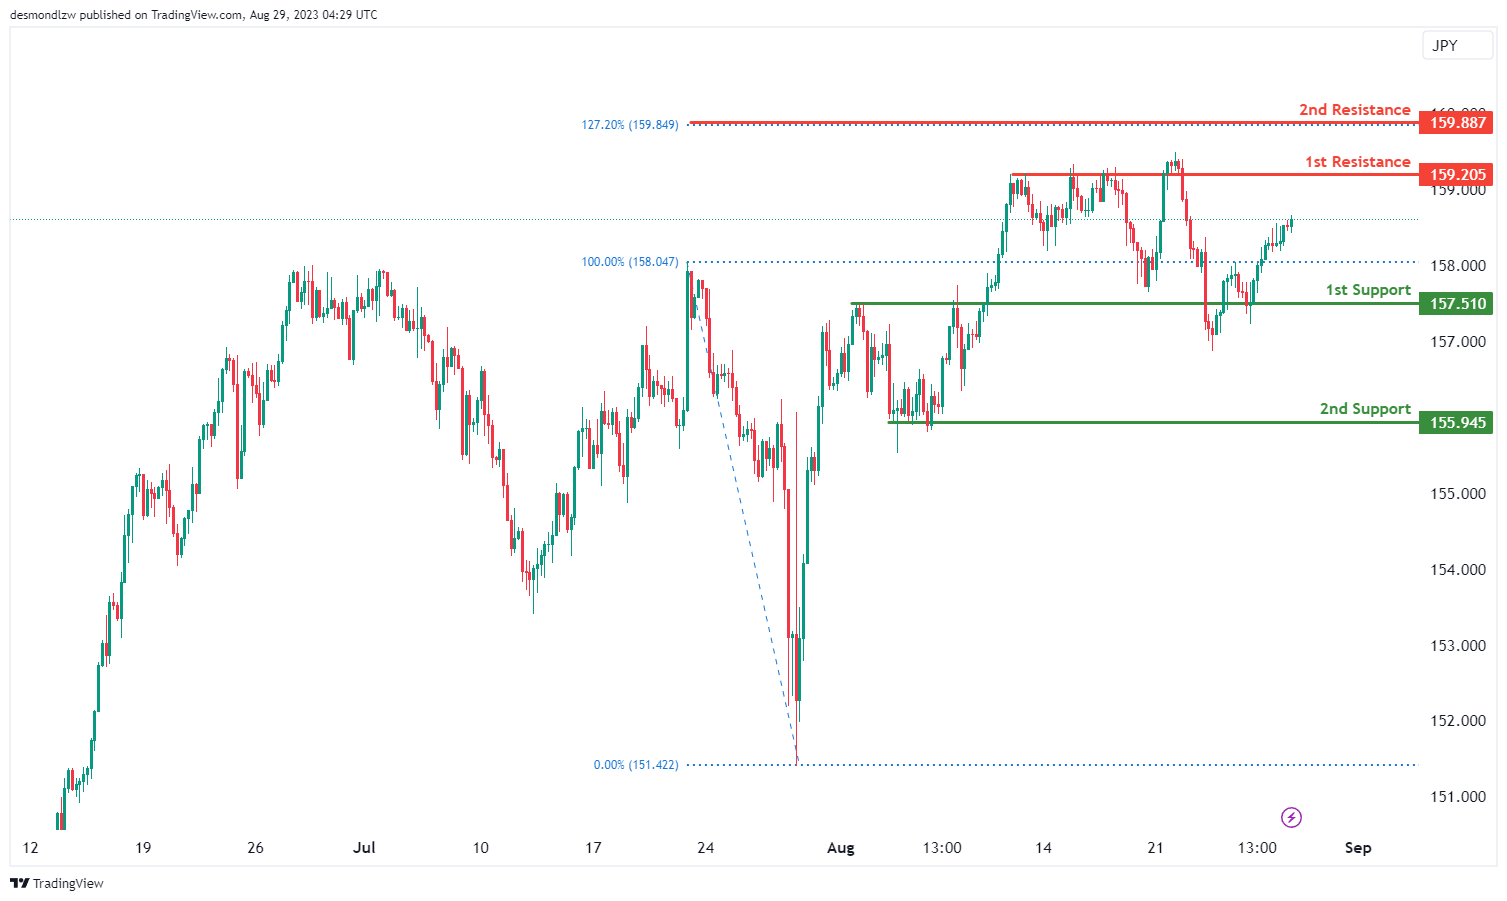
The EUR/JPY chart indicates a bullish overall momentum. Based on the analysis, there is potential for a bullish continuation towards the 1st resistance level.
The 1st support at 157.51 is an overlap support.
The 2nd support at 155.94 is significant due to its multi-swing low support characteristics.
On the resistance side, the 1st resistance at 159.20 is an overlap resistance.
The 2nd resistance at 159.88 is noteworthy as it represents a 127.20% Fibonacci Extension.
EUR/GBP:
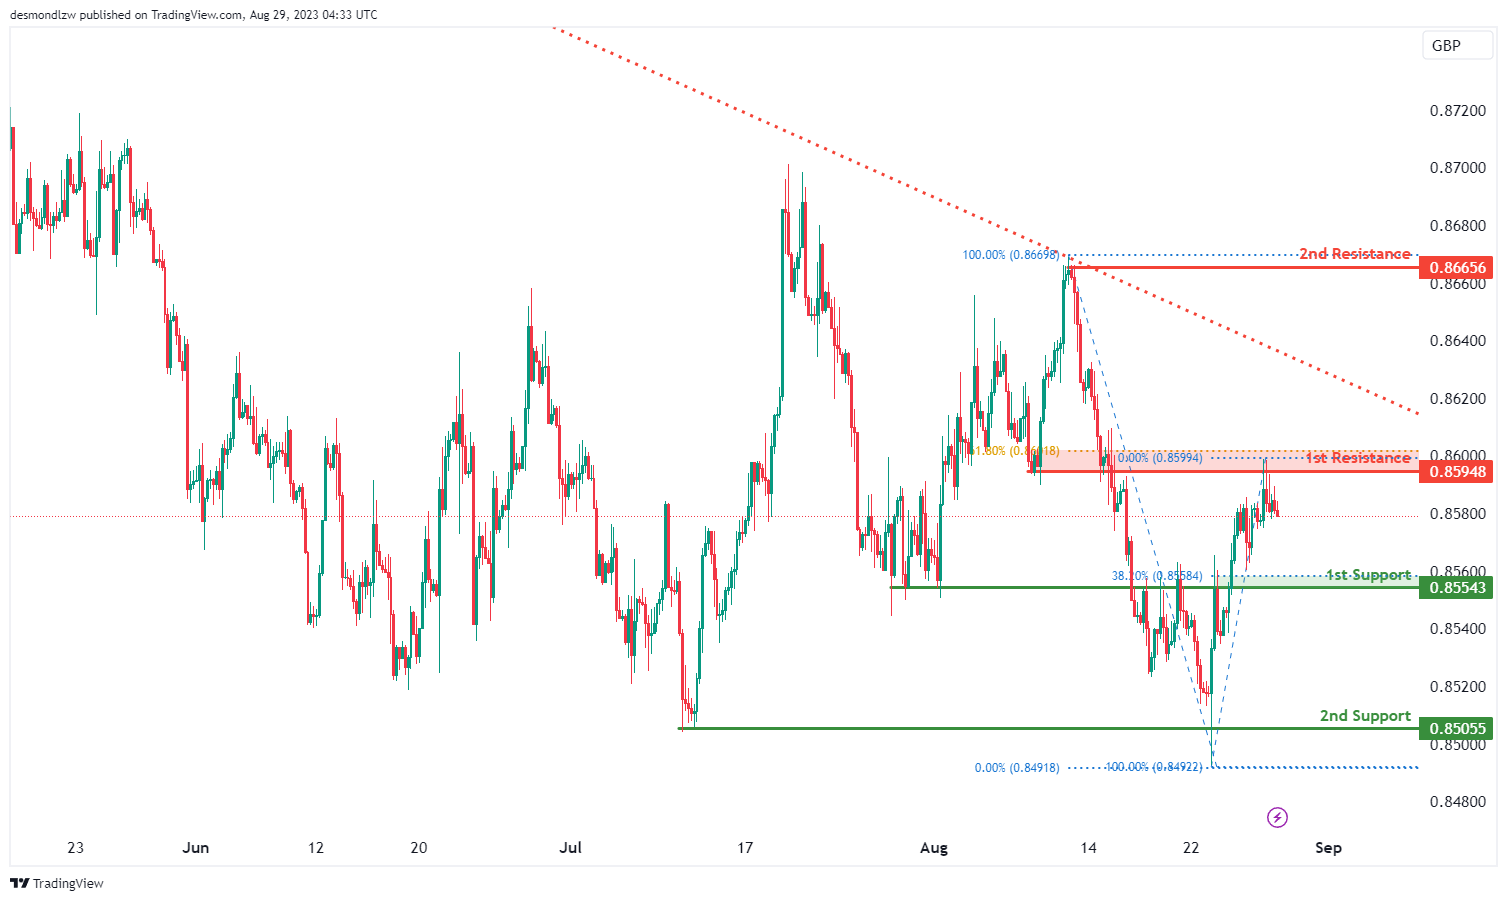
The EUR/GBP chart suggests a bearish overall momentum, with the price below a major descending trend line, indicating the potential for further bearish movement.
The 1st support level at 0.8554 is considered an overlap support.
The 2nd support level at 0.8505 is important due to its characteristics as a swing low support.
On the resistance side, the 1st resistance level at 0.8594 is an overlap resistance.
The 2nd resistance level at 0.8665 is significant as it represents a swing high resistance.
GBP/USD:
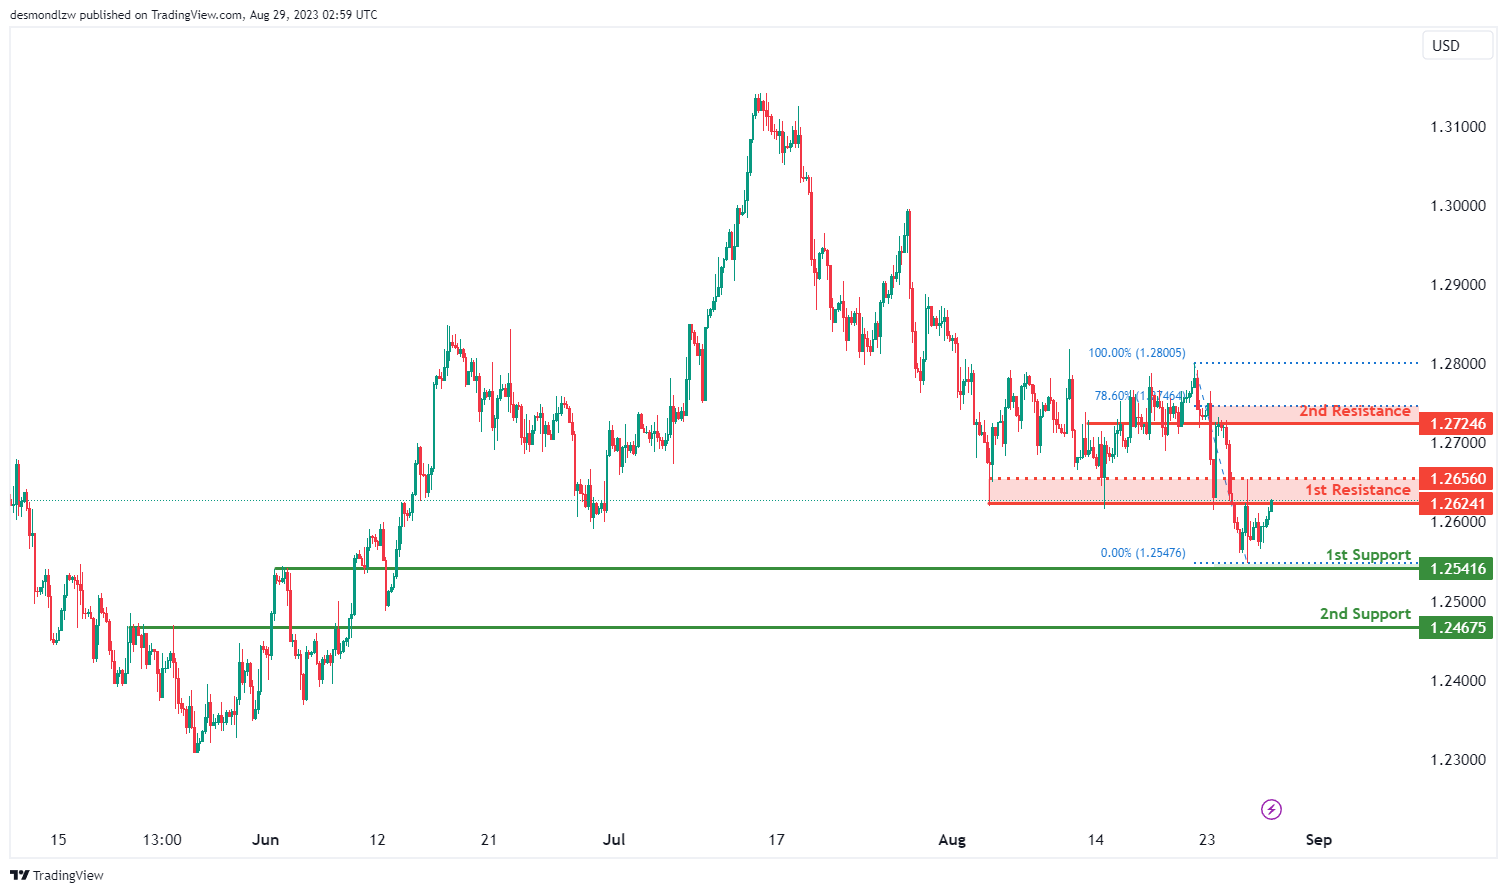
The GBPUSD chart is demonstrating a bearish overall momentum The potential price movement scenario suggests a bearish reaction could occur off the 1st resistance level, leading to a drop in price towards the 1st support level. The 1st support level at 1.2541 is considered significant due to it being an overlap support, indicating historical instances of price finding support around this level.
Additionally, the 2nd support level at 1.2467 is recognized as a pullback support, further enhancing its potential as a level of price support. On the resistance side, the 1st resistance level at 1.2624 holds importance as an overlap resistance, signifying historical instances of price encountering resistance at this level. The 2nd resistance level at 1.2724 is notable for being an overlap resistance as well as representing the 78.60% Fibonacci Retracement level. These factors combine to emphasize the significance of the 2nd resistance level as a potential area of resistance.
GBP/JPY:
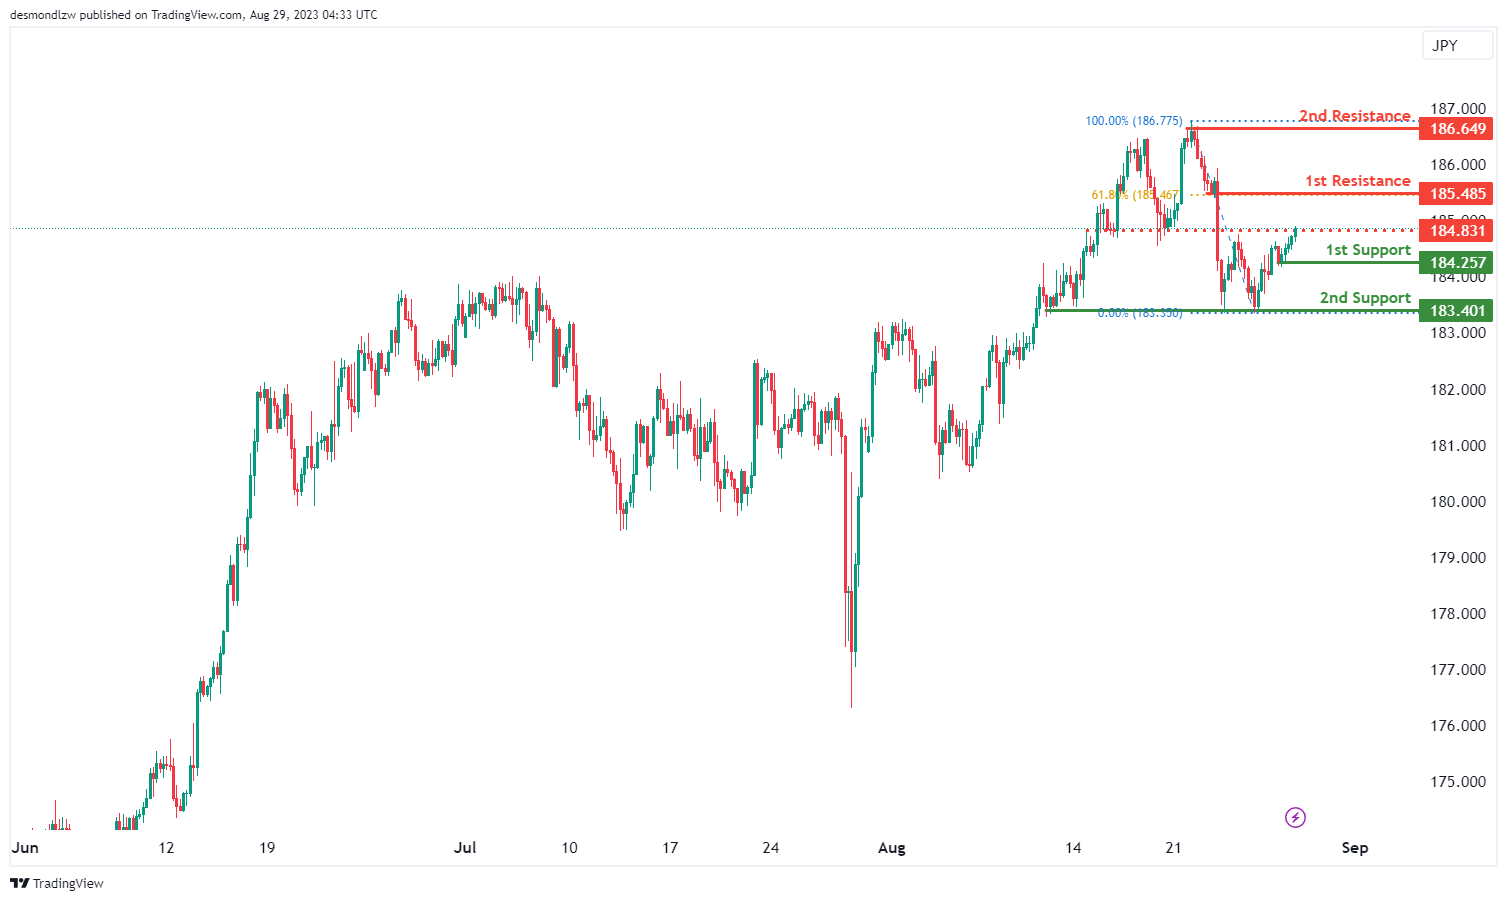
The GBP/JPY chart suggests a bullish overall momentum.
The 1st support level at 184.25 is important as it is a swing low support. The 2nd support level at 183.40 gains significance due to its characteristics as a multi-swing low support.
On the resistance side, the 1st resistance level at 185.48 is considered a pullback resistance and coincides with the 61.80% Fibonacci retracement level. The 2nd resistance level at 186.64 is a significant swing high resistance.
An intermediate resistance at 184.83, being an overlap resistance, adds to the overall analysis.
USD/CHF:
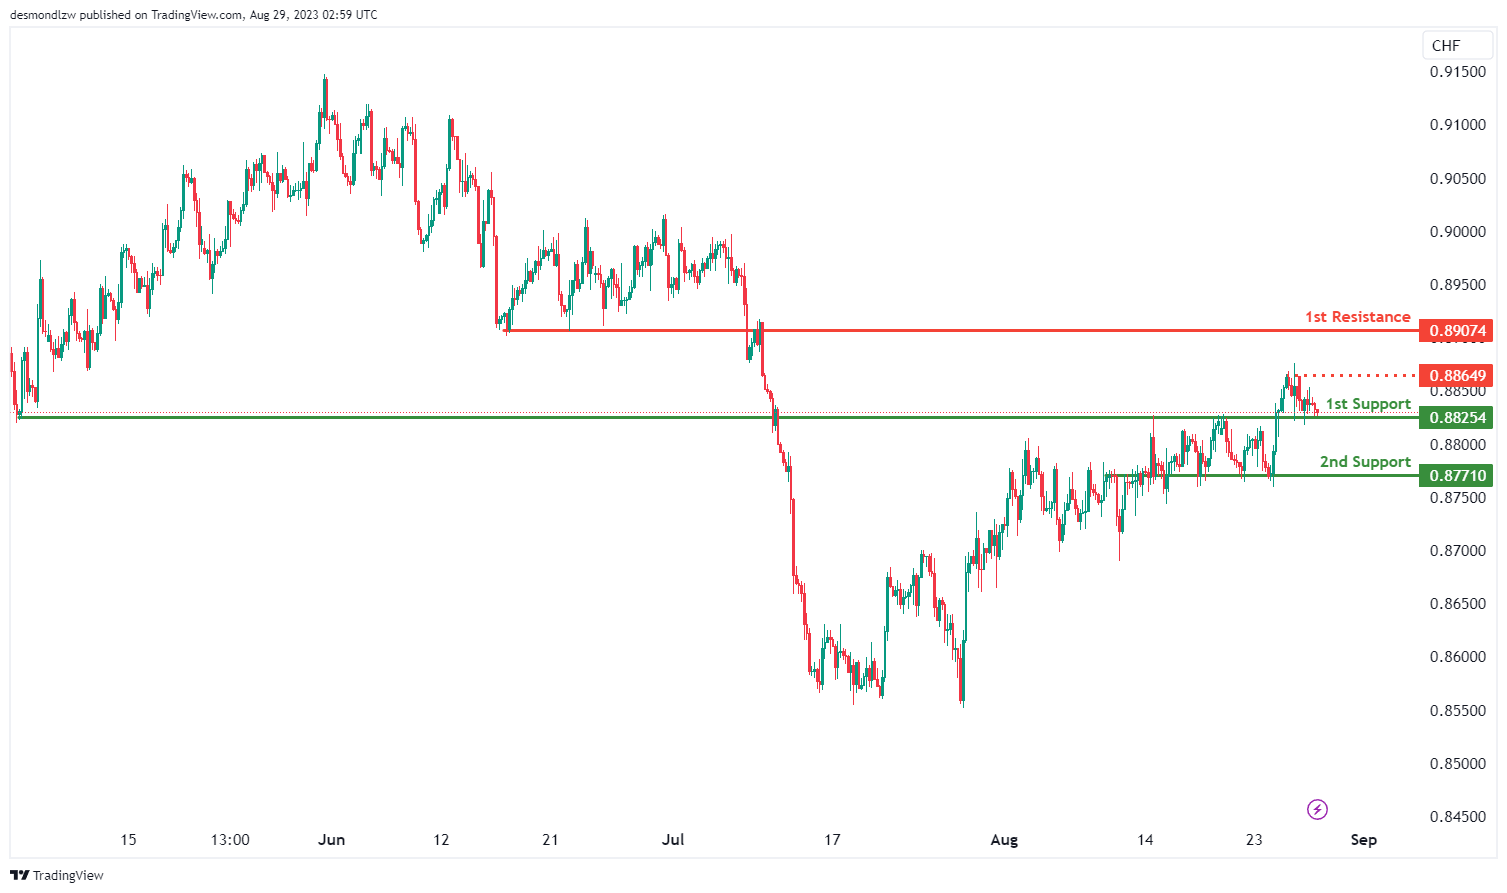
The USD/CHF chart is demonstrating a bullish momentum. A potential price movement scenario suggests the possibility of a bullish bounce occurring off the 1st support level, leading the price towards the 1st resistance level. The significance of these levels is as follows:
The 1st support level at 0.8825 holds importance due to being an overlap support, indicating instances in the past where the price found support around this level. Similarly, the 2nd support level at 0.8771 is also considered significant as an overlap support, further strengthening its potential as a level of price support.
On the resistance side, the 1st resistance level at 0.8907 is noteworthy for being a pullback resistance, suggesting historical occurrences of the price encountering resistance at this level after a pullback. Additionally, the intermediate resistance at 0.8864 is identified as a swing high resistance, implying that the price previously faced resistance around this level during swing highs.
USD/JPY:
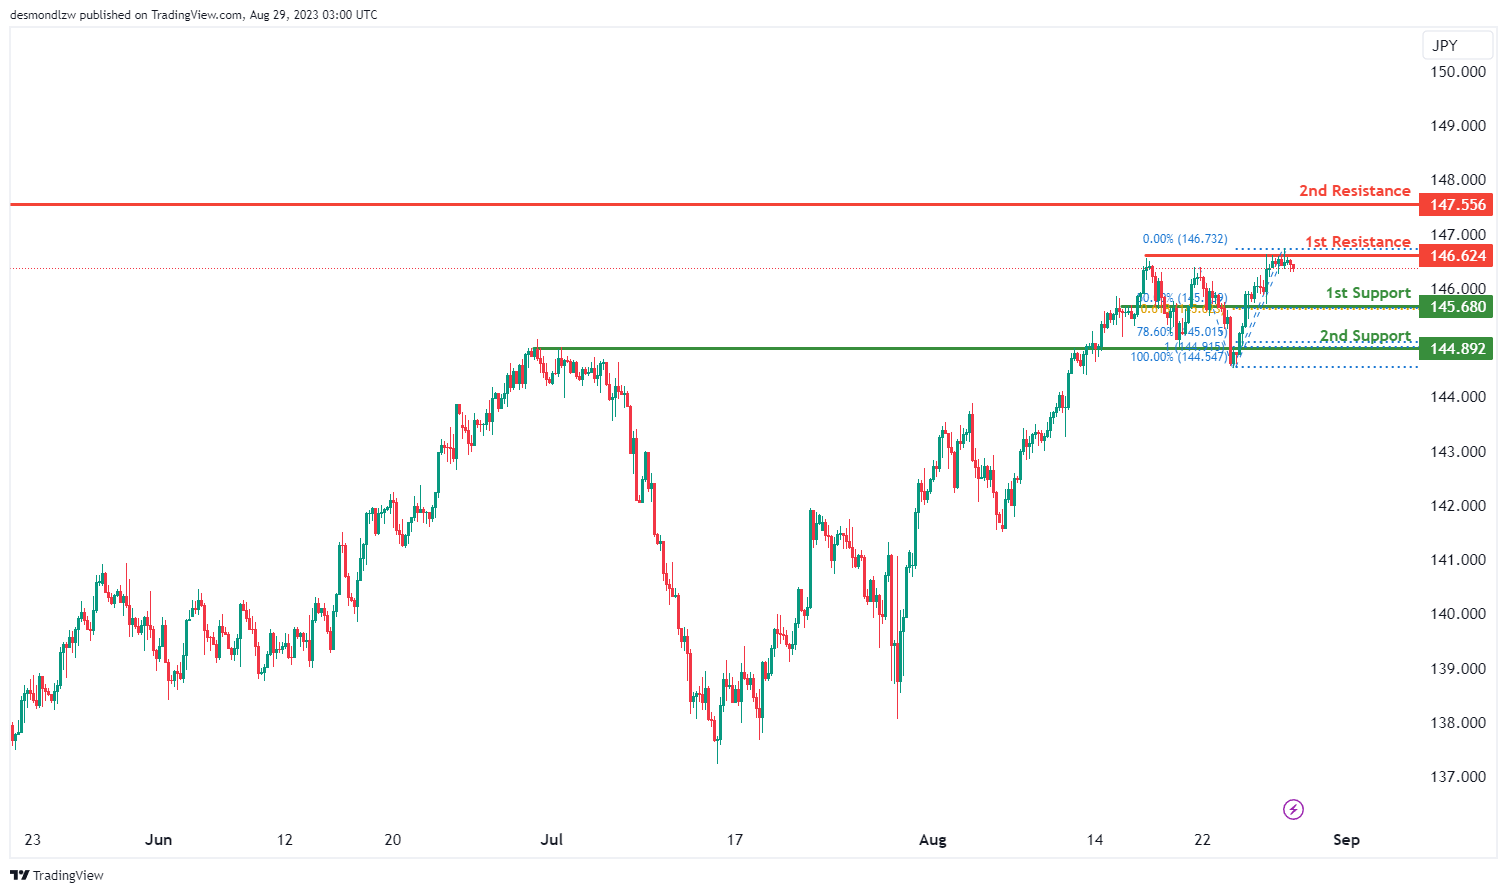
The USD/JPY chart currently displays a bearish momentum. A potential price movement scenario suggests the potential for a bearish continuation. The 1st support level at 145.68 is considered significant due to being an overlap support, indicating historical instances where the price found support around this level. Moreover, this level aligns with the 50% Fibonacci Retracement and the 61.80% Fibonacci Projection, adding to its significance as a potential support area.
The 2nd support level at 144.89 is identified as a pullback support, suggesting that the price might experience support around this level, particularly given its alignment with the 78.60% Fibonacci Retracement.
On the resistance side, the 1st resistance level at 146.62 is noted for being a multi-swing high resistance. This implies that the price has previously encountered resistance around this level during multiple swing highs.
Similarly, the 2nd resistance level at 147.55 is recognized as a swing high resistance, indicating instances where the price faced resistance around this level during past swing highs.
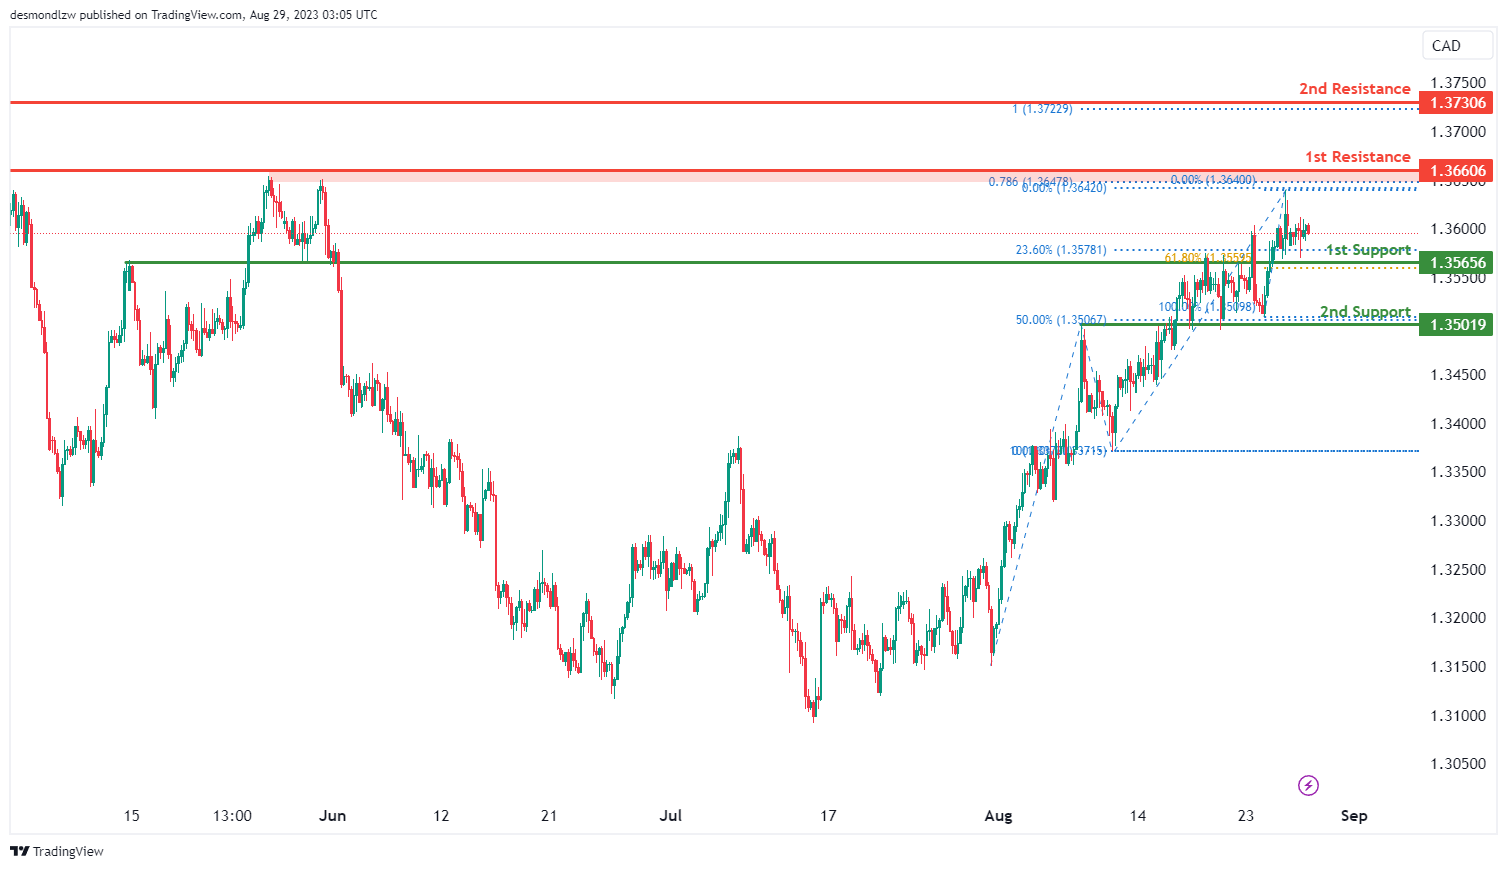
USD/CAD:
The USD/CAD chart is currently exhibiting an overall bearish momentum, implying a downward trend in price. In this scenario, there is potential for price to continue its bearish movement and potentially reach the 1st support level.
The 1st support level at 1.3566 is identified as an overlap support that aligns with a confluence of Fibonacci levels i.e. the 23.60% and the 61.80% retracement levels. In addition, the 2nd support level at 1.3502 is also identified as an overlap support that coincides with the 50.00% Fibonacci retracement level.
To the upside, the 1st resistance level at 1.3661 is identified as an overlap resistance that aligns with the 78.60% Fibonacci projection level. Furthermore, the 2nd resistance level at 1.3731 is also identified as an overlap resistance that aligns with the 100.00% Fibonacci projection level.
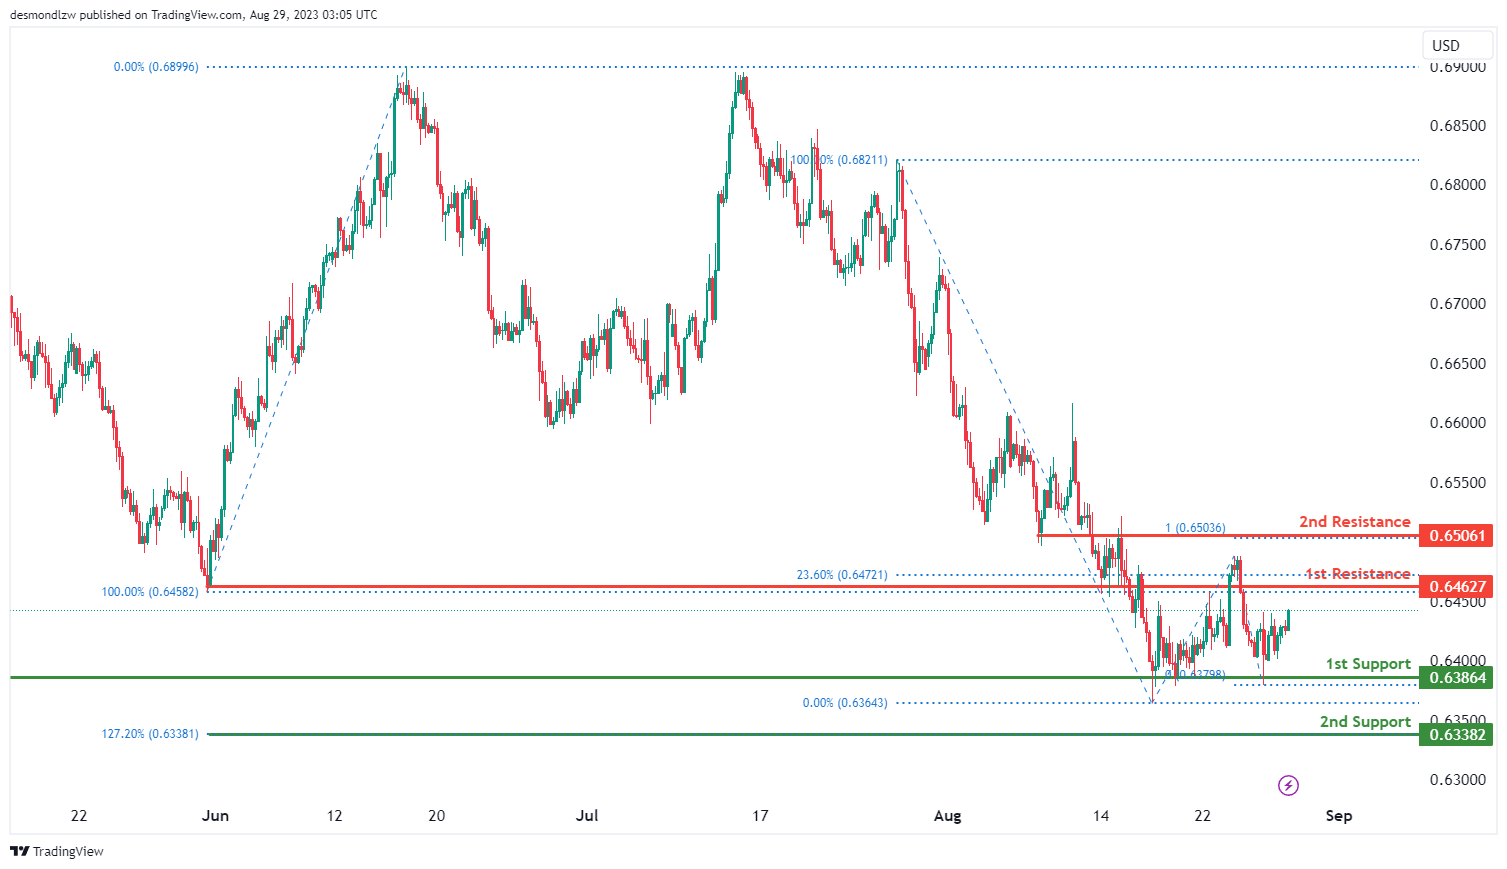
AUD/USD:
The AUD/USD chart is currently showing an overall bullish momentum, indicating an upward trend in price. Within this context, there is potential for price to continue its bullish movement and potentially reach the 1st resistance level.
The 1st resistance level at 0.6463 is identified as an overlap resistance that aligns with the 23.60% Fibonacci retracement level. In addition, the 2nd resistance level at 0.6506 is also identified as an overlap resistance that aligns with the 100.00% Fibonacci projection level.
To the downside, the 1st support level at 0.6386 is identified as an overlap support while the 2nd support level at 0.6338 is identified as a support level that aligns with the 127.20% Fibonacci extension level.
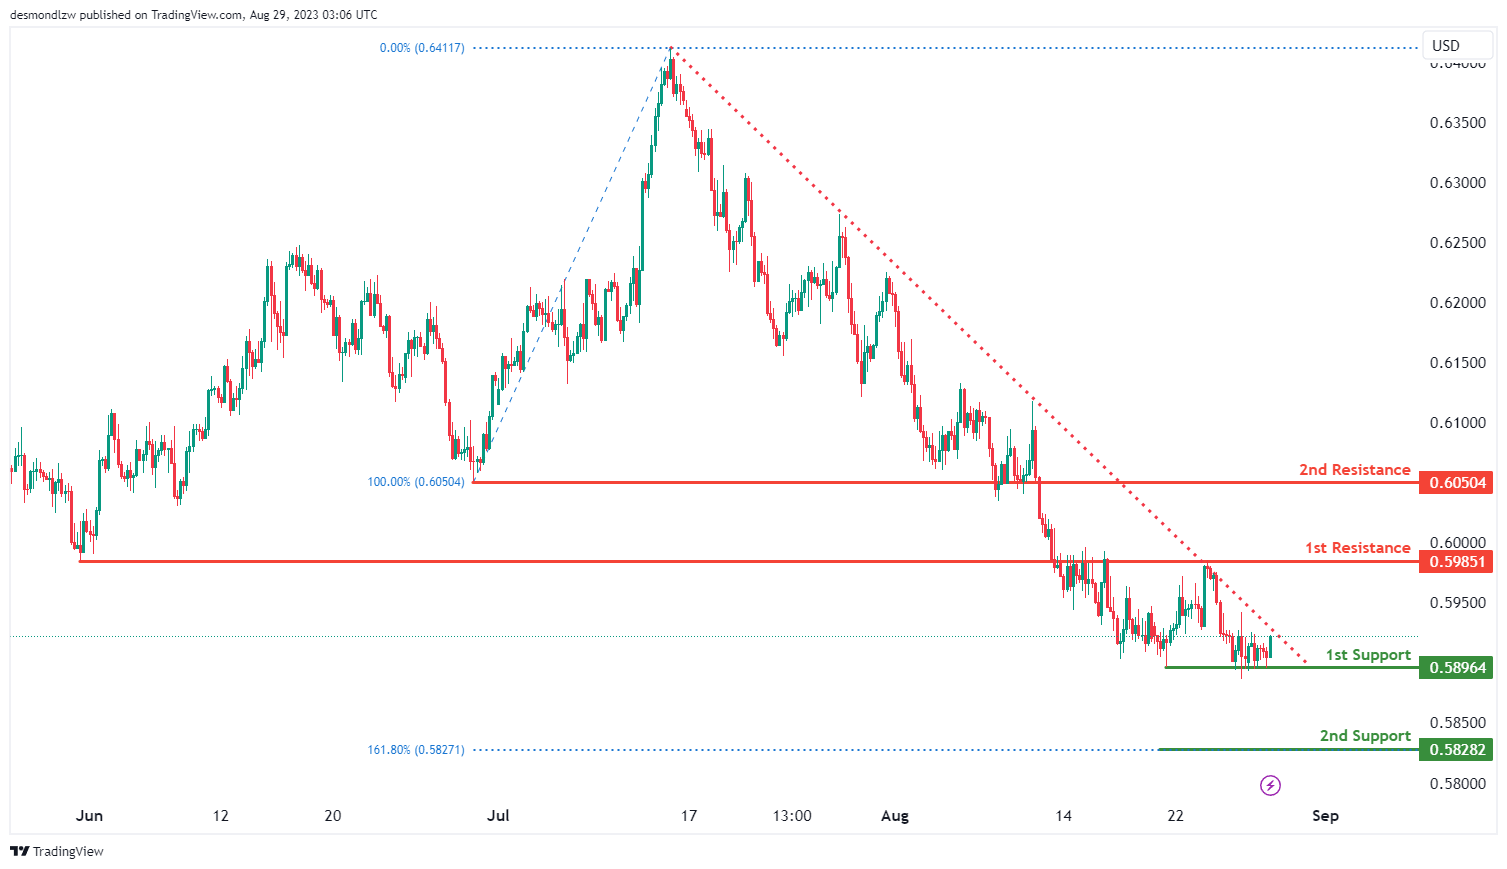
NZD/USD
The NZD/USD chart is currently experiencing a bullish overall momentum with price attempting to breakout above a descending resistance line. This potential breakout could initiate a bullish price movement towards the 1st resistance.
The 1st resistance level at 0.5985 is identified as an overlap resistance. Similarly, the 2nd resistance level at 0.6050 is also identified as an overlap resistance.
To the downside, the 1st support level at 0.5896 is identified as a multiple swing-low support. Furthermore, the 2nd support level at 0.5828 is identified as a support level that aligns with the 161.80% Fibonacci extension level that strengthens its relevance as a pullback support.
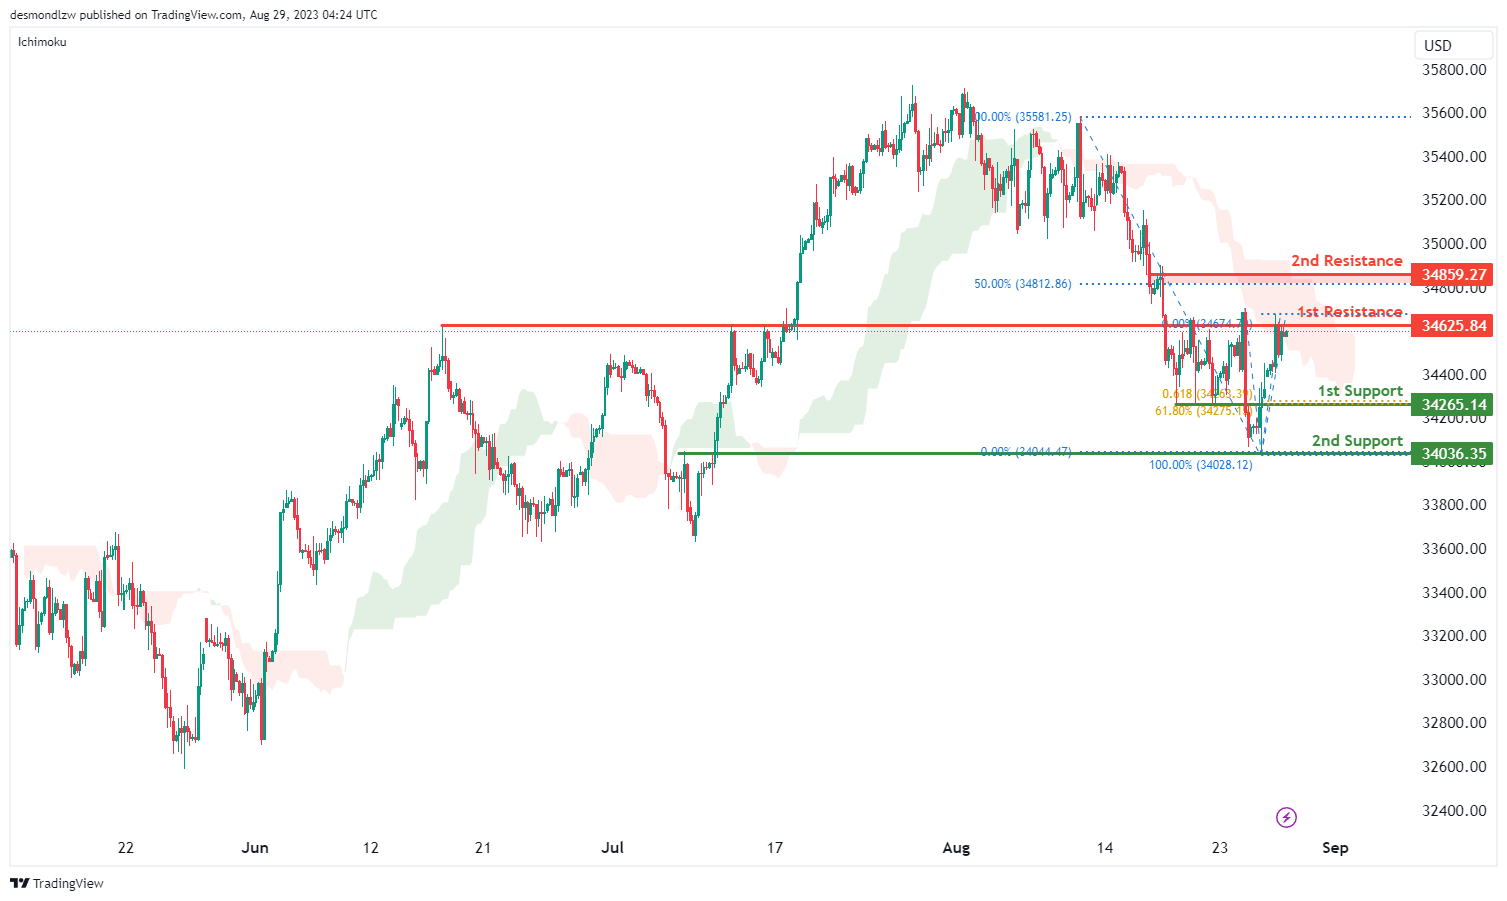
DJ30:
The DJ30 chart currently indicates a bearish overall momentum, with the price being within the bearish Ichimoku cloud. Based on the analysis, there’s potential for a bearish continuation towards the 1st support level.
The 1st support at 34265.14 is noteworthy due to its overlap support features, and it also coincides with both the 61.80% Fibonacci Retracement and the 61.80% Fibonacci Projection, suggesting a Fibonacci confluence.
The 2nd support at 34036.35 is also significant as it represents an overlap support.
On the resistance side, the 1st resistance at 34265.84 is identified as an overlap resistance. The 2nd resistance at 34859.27 is seen as pullback resistance.
GER30:
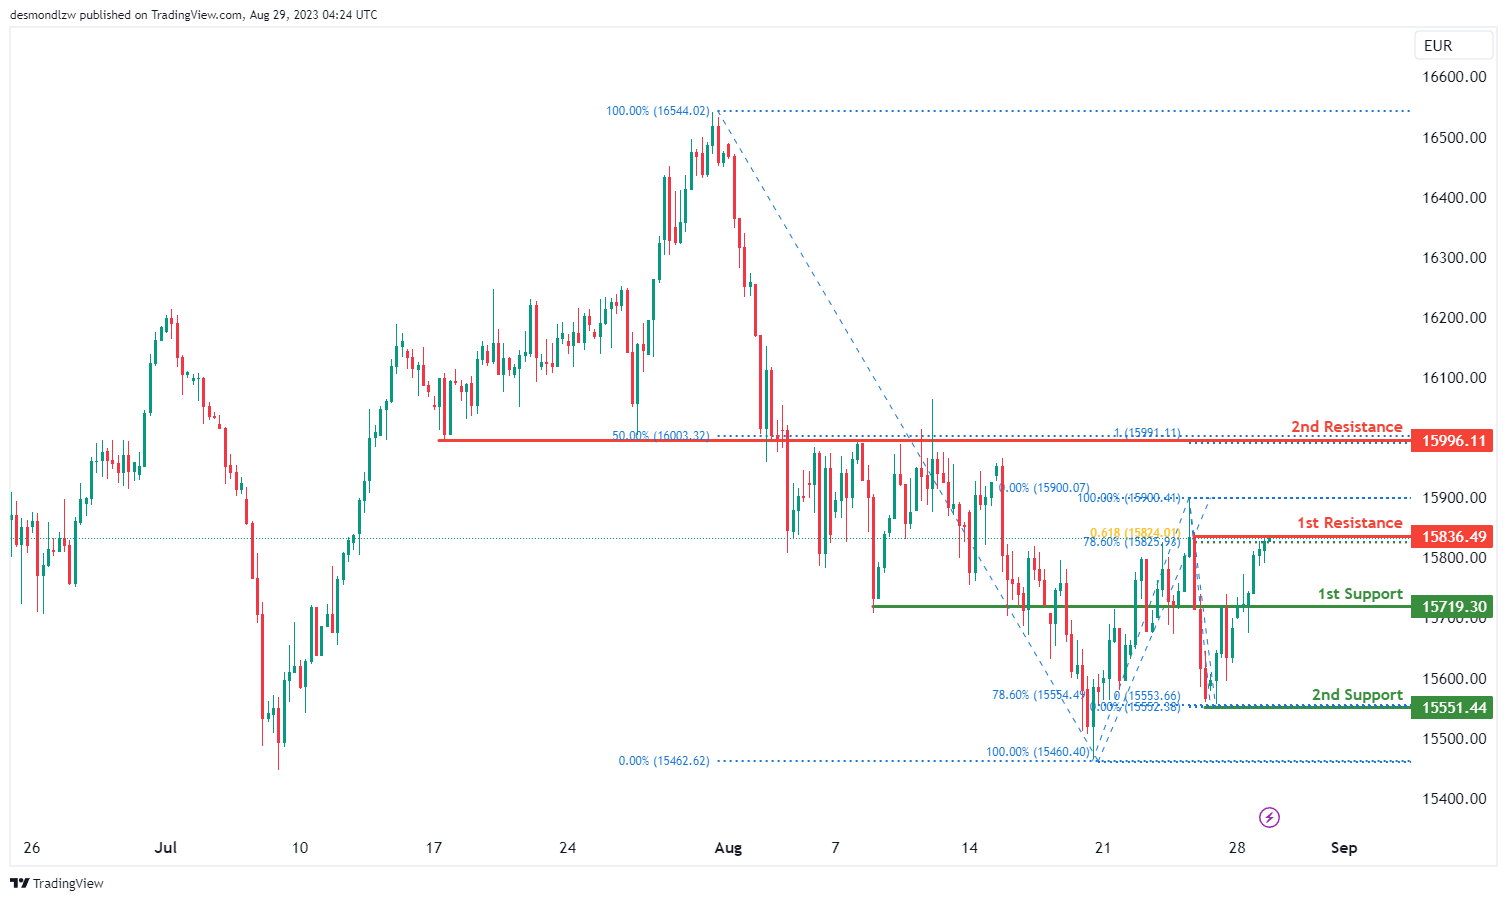
The GER30 (Germany 30) chart currently shows a bearish overall momentum. Based on the analysis, there is a possibility for a bearish reaction off the 1st resistance level, leading to a potential drop towards the 1st support level.
The 1st support at 15719.30 is considered advantageous as it represents an overlap support.
The 2nd support at 15551.44 is significant due to its overlap support characteristics and also coincides with the 78.60% Fibonacci Retracement.
On the resistance side, the 1st resistance at 15836.49 is a swing high resistance, and it also coincides with both the 78.60% Fibonacci Retracement and the 61.80% Fibonacci Projection, suggesting a Fibonacci confluence.
The 2nd resistance at 15996.11 is also noteworthy as it represents an overlap resistance and coincides with both the 50% Fibonacci Retracement and the 100% Fibonacci Projection, indicating another Fibonacci confluence.
US500
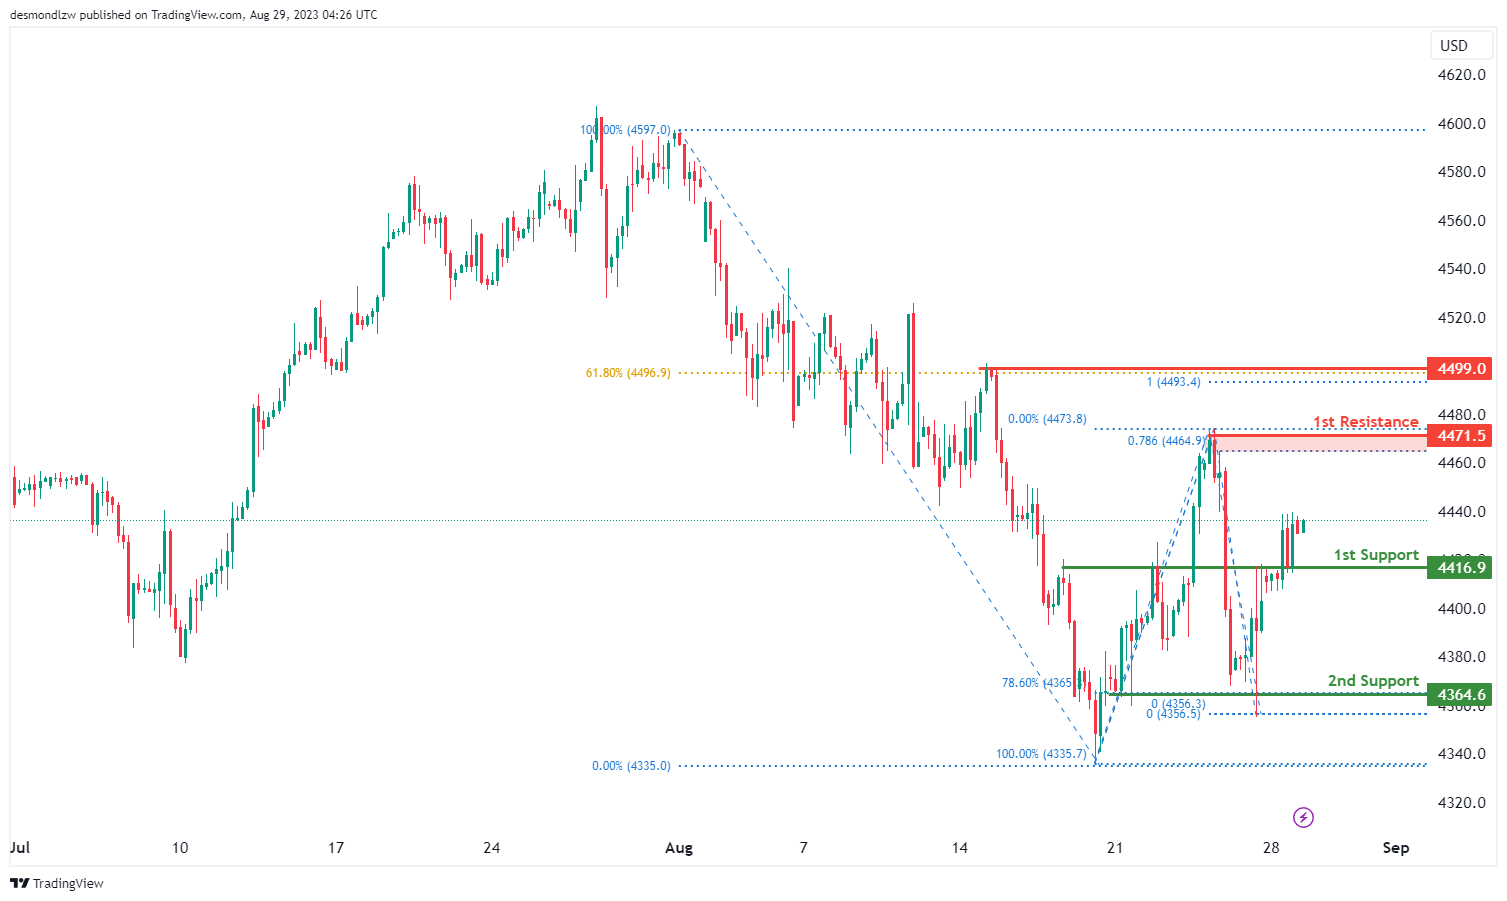
The US500 (U.S. 500) chart indicates a bullish overall momentum. Based on the analysis, there is potential for a bullish continuation towards the 1st resistance level.
The 1st support at 4416.9 is considered an overlap support.
The 2nd support at 4364.6 is significant due to its multi-swing low support characteristics and it also coincides with the 78.60% Fibonacci Retracement.
On the resistance side, the 1st resistance at 4471.5 is a swing high resistance, and it coincides with the 78.60% Fibonacci Projection.
The 2nd resistance at 4499.0 is also noteworthy as it represents a swing high resistance. Moreover, it coincides with both the 61.80% Fibonacci Retracement and the 100% Fibonacci Projection, suggesting a Fibonacci confluence.
BTC/USD:
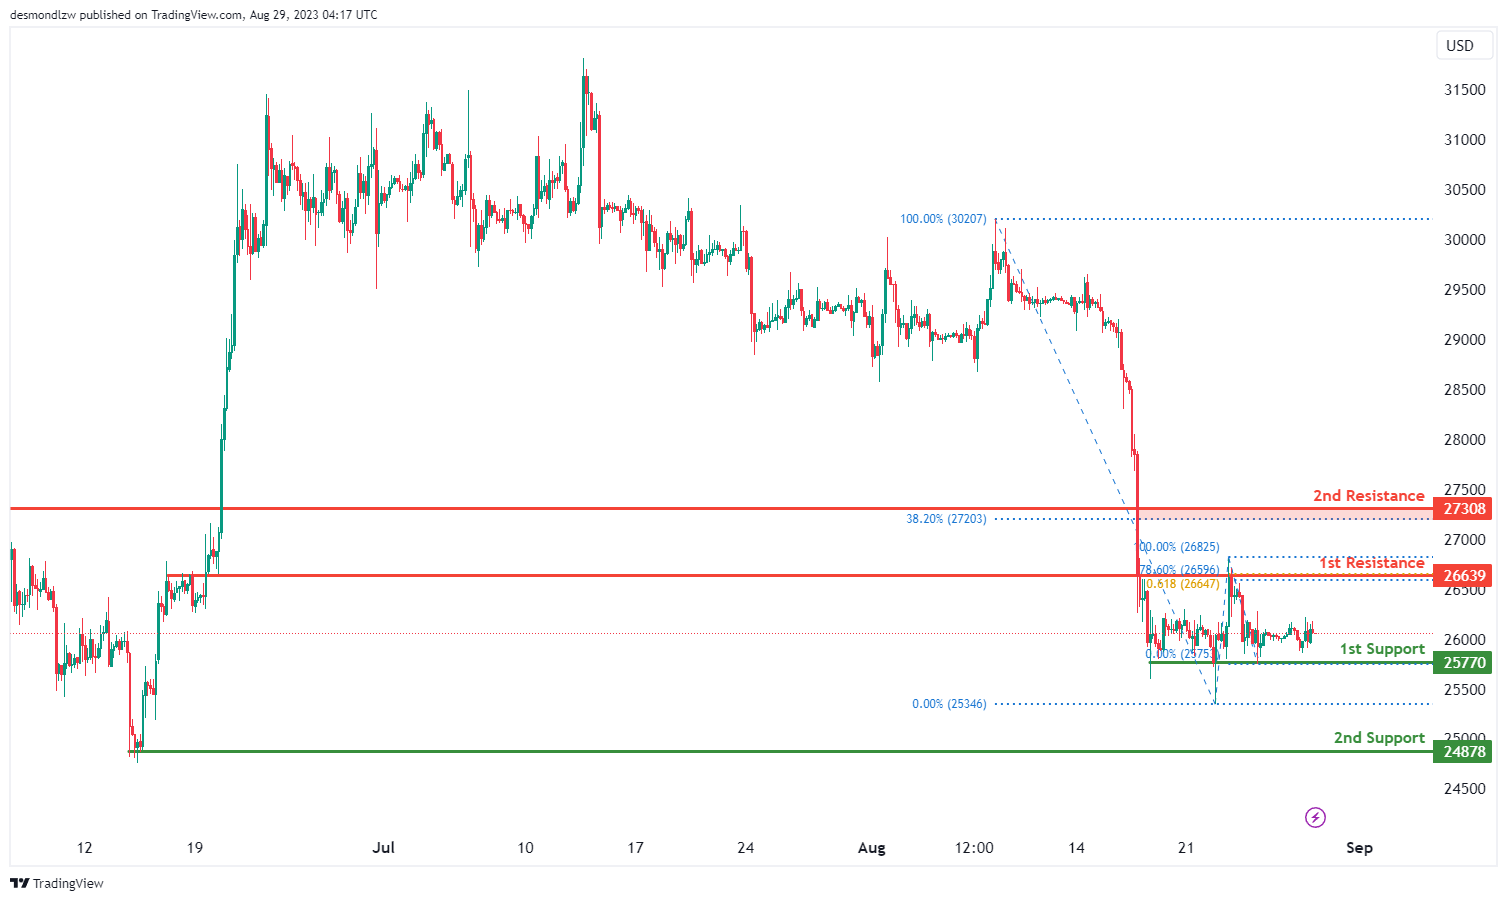
The BTC/USD chart is currently indicating a bullish overall momentum. Based on the analysis, there’s potential for a bullish continuation towards the 1st resistance level.
The 1st support at 25770 holds significance due to its multi-swing low support characteristics.
The 2nd support at 24878 is also notable as it represents a swing low support.
On the resistance side, the 1st resistance at 26639 stands out due to its overlap resistance features, as well as the confluence of the 78.60% Fibonacci Retracement and the 61.80% Fibonacci Projection.
The 2nd resistance at 27308 is significant due to its overlap resistance features and its alignment with the 38.20% Fibonacci Retracement.
ETH/USD:
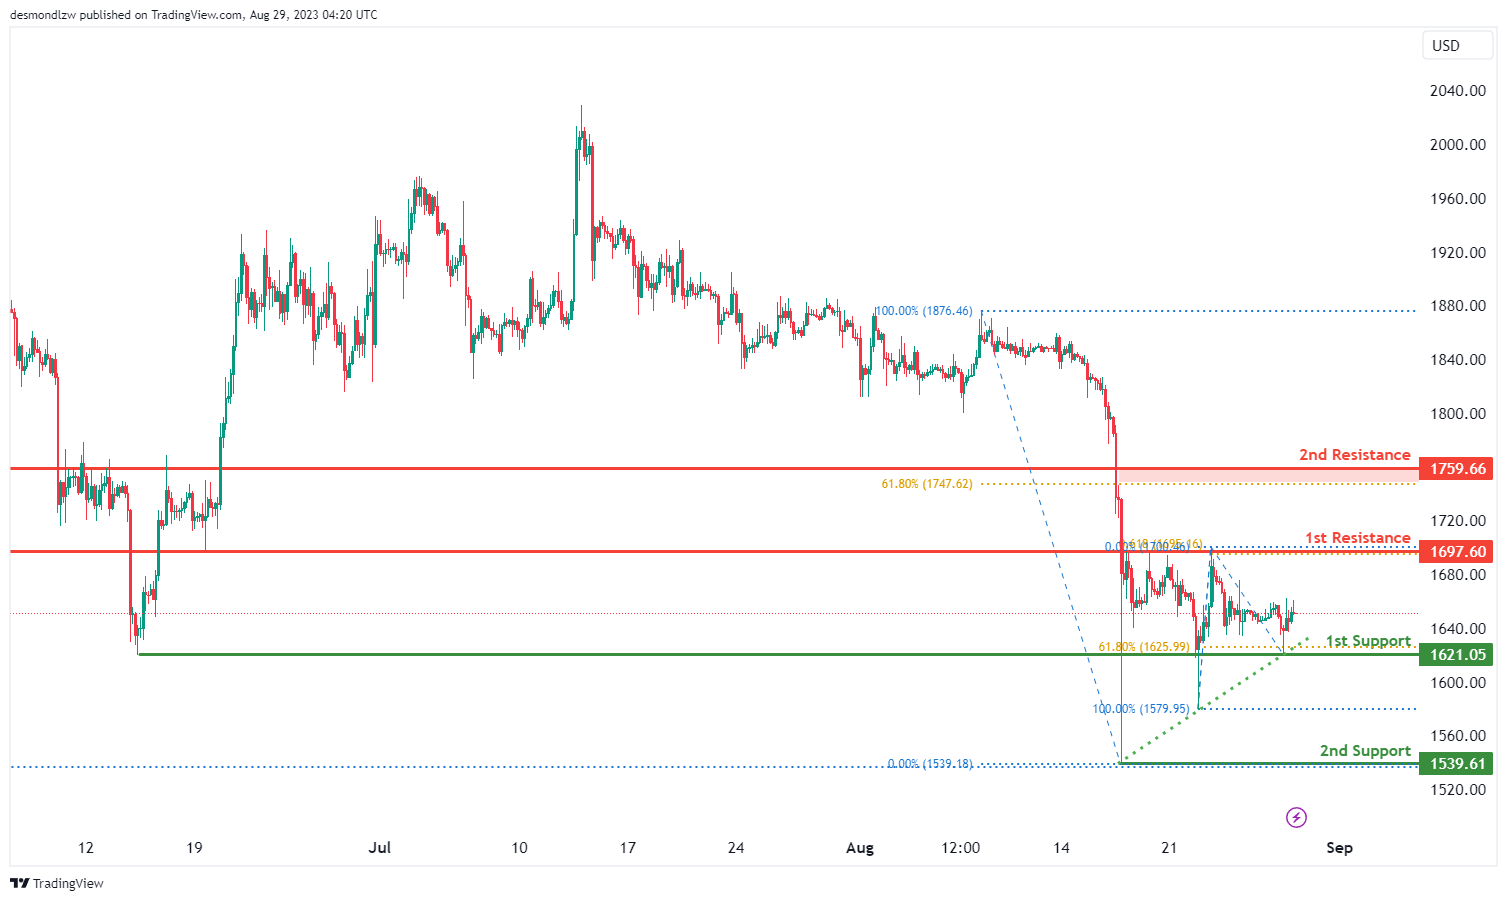
The ETH/USD chart currently displays a bullish overall momentum. Based on the analysis, there’s potential for a bullish continuation towards the 1st resistance level.
The 1st support at 1621.05 is considered significant due to its multi-swing low support characteristics and its alignment with the 61.80% Fibonacci Retracement.
The 2nd support at 1539.61 is also noteworthy as it represents a swing low support.
On the resistance side, the 1st resistance at 1697.60 stands out due to its overlap resistance features and its alignment with the 61.80% Fibonacci Projection.
The 2nd resistance at 1759.66 is significant due to its overlap resistance features and its alignment with the 61.80% Fibonacci Retracement.
WTI/USD:
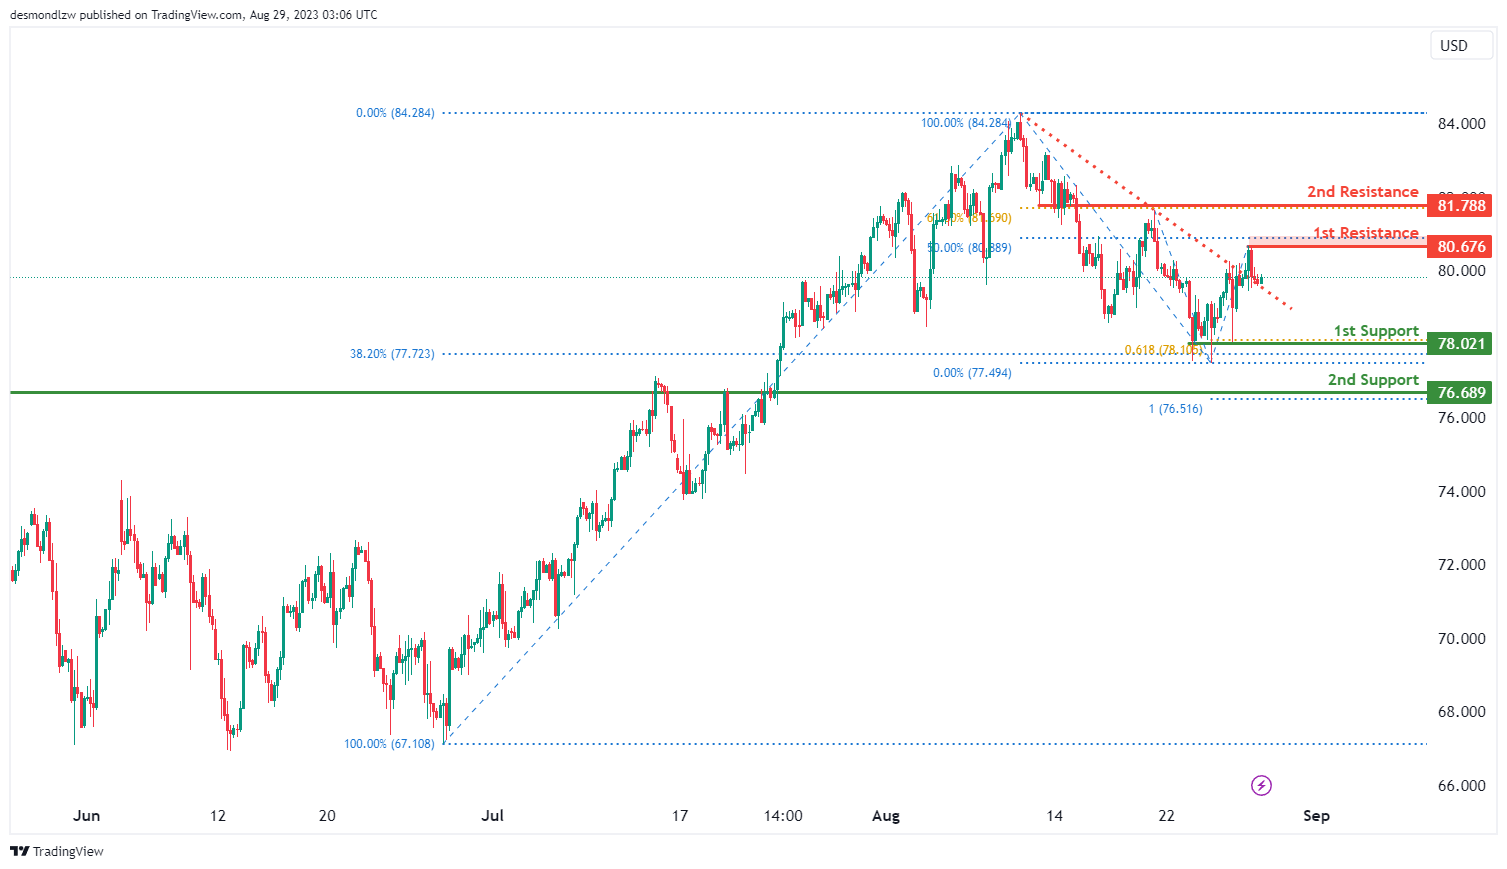
The WTI chart currently exhibits a weak bearish momentum with low confidence, indicating a tentative downward trend in the price movement. There is potential for a bearish continuation towards the 1st support level.
The 1st support level at 78.02 is identified as a multiple swing-low support that aligns with a confluence of Fibonacci levels i.e. the 38.20% retracement and the 61.80% projection levels. In addition, the 2nd support level at 76.69 is identified as an overlap support that coincides with the 100.00% Fibonacci projection level.
To the upside, the 1st resistance at 80.68 is marked as pullback resistance that aligns with the 50.00% Fibonacci retracement level. Furthermore, the 2nd resistance level at 81.79 is identified as an overlap resistance that aligns with the 61.80% Fibonacci retracement level.
XAU/USD (GOLD):
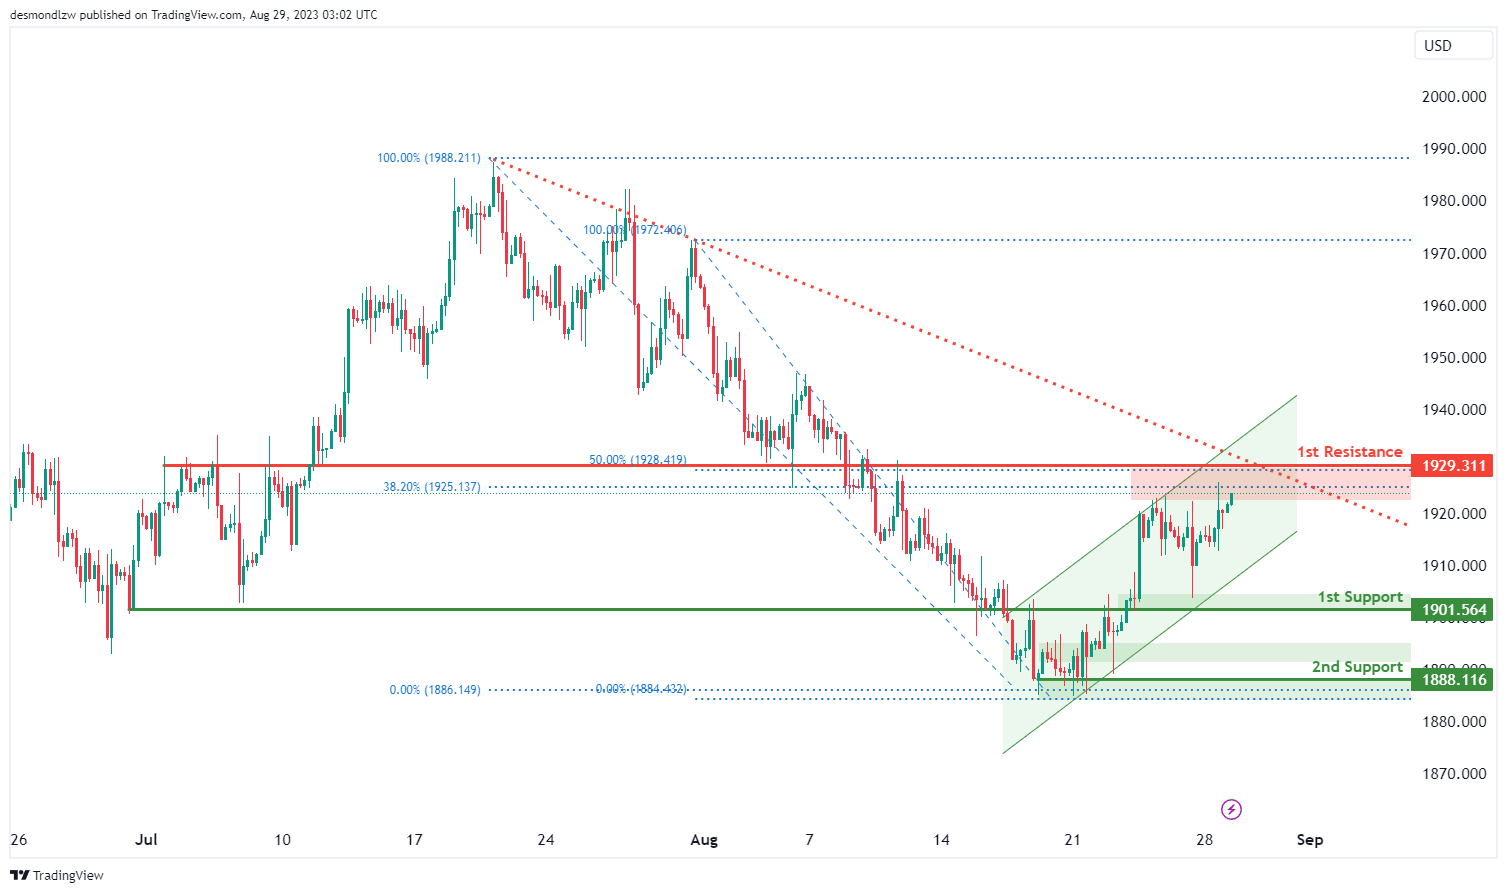
The XAUUSD chart currently exhibits bearish momentum, with the price positioned below a major descending trend line, indicating the presence of bearish momentum. However, it’s also worth noting that the price is within a bullish ascending channel, which could lead to a potential rise towards the 1st resistance before a potential reversal. There’s a likelihood of a bearish reaction occurring off the 1st resistance level, causing the price to decline towards the 1st support level. Here’s an analysis of these levels:
The 1st support level at 1901.56 holds significance due to its role as an overlap support, pointing to instances in the past where the price found support around this level.
The 2nd support level at 1888.11 is identified as a multi-swing low support, indicating historical price action has found support around this level during multiple instances of swing lows.
On the resistance side, the 1st resistance level at 1929.31 is noteworthy for being an overlap resistance. Additionally, this level aligns with both the 50% Fibonacci Retracement and the 38.20% Fibonacci Retracement, indicating a Fibonacci confluence.
GBP/USD Trend Overwhelmingly Negative Unless It Breaks 1.2750
Key Highlights
- GBP/USD declined further and tested the 1.2550 region.
- A key bearish trend line is forming with resistance near 1.2725 on the 4-hour chart.
- EUR/USD could struggle to recover above the 1.0850 resistance.
- Crude oil price is aiming for a fresh increase toward $82.00.
GBP/USD Technical Analysis
The British Pound extended its decline below the 1.2650 level against the US Dollar. GBP/USD even broke the 1.2600 level to move further into a bearish zone.
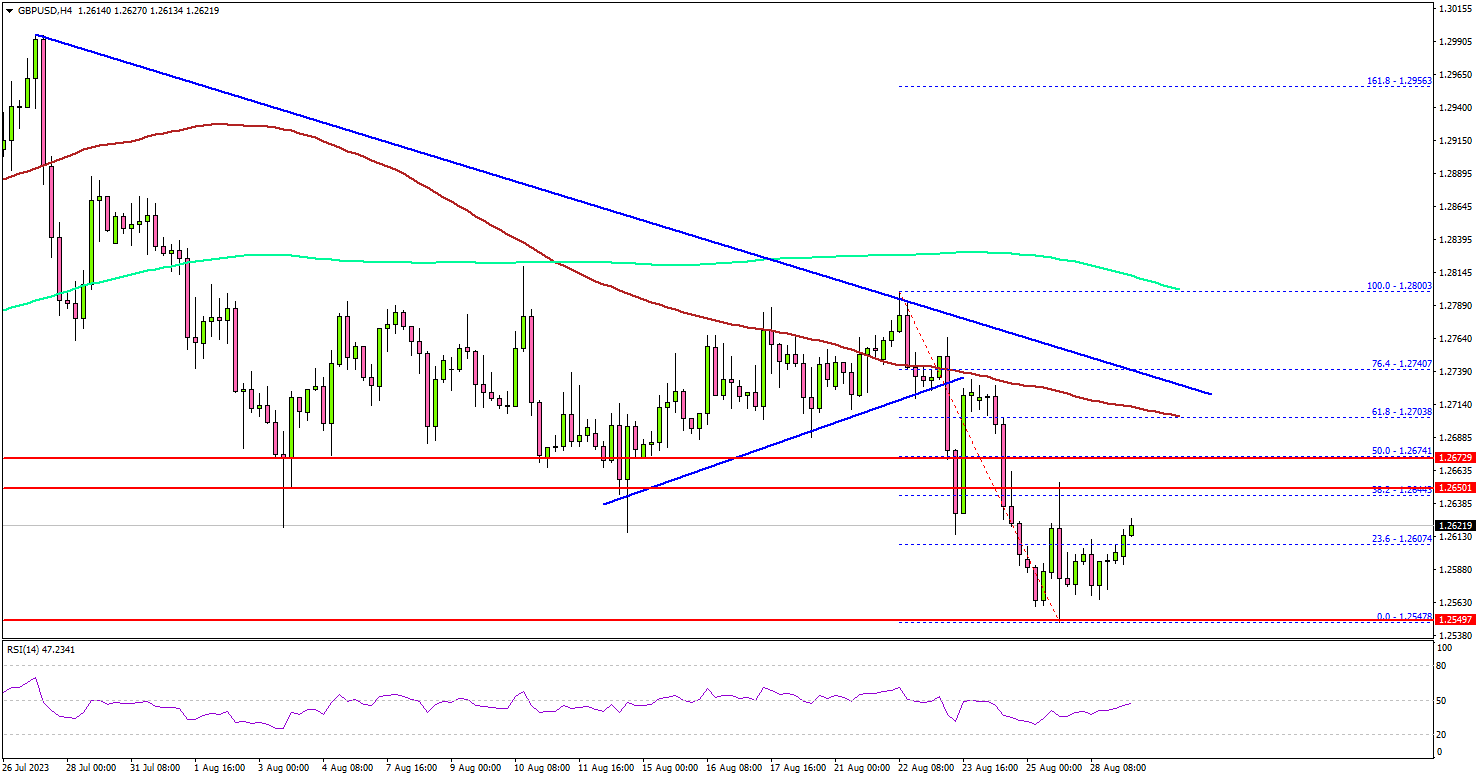
Looking at the 4-hour chart, the pair settled below the 1.2650 level, the 100 simple moving average (red, 4 hours) and the 200 simple moving average (green, 4 hours).
The pair tested the 1.2550 zone. A low was formed near 1.2547 and the pair is now consolidating losses. It tested the 38.2% Fib retracement level of the downward move from the 1.2800 swing high to the 1.2547 low.
On the upside, an initial resistance is near the 1.2640 level. The first major resistance is near the 1.2675 level or the 50% Fib retracement level of the downward move from the 1.2800 swing high to the 1.2547 low.
The main resistance is forming near the 1.2720 zone. There is also a key bearish trend line forming with resistance near 1.2720 on the same chart.
A close above 1.2720 and then 1.2750 could start a decent increase. In the stated case, the pair could rise toward the 1.2880 level. Any more gains could start a fresh increase toward the 1.3000 level.
If not, the pair might continue to move down below the 1.2550 support. The next key support is seen near the 1.2500 level. If there is a move below 1.2500, the pair could dive toward 1.2320.
Looking at EUR/USD, the pair is still trading in a bearish zone and it could struggle to recover above the 1.0850 resistance.
Economic Releases
- US Housing Price Index for June 2023 (MoM) - Forecast +0.2%, versus +0.7% previous.
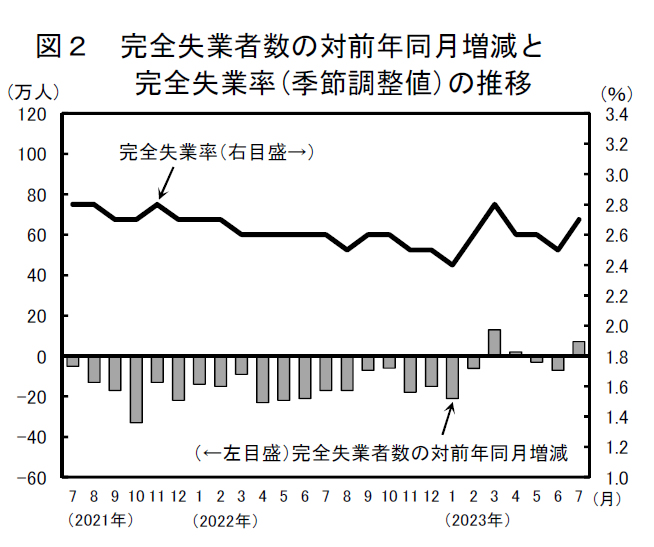
Japan’s unemployment rate up to 2.7%, first rise in four months
Japan's job market showed unexpected signs of weakening in July, as the unemployment rate rose to 2.7%, defying expectations of remaining steady at June's 2.5% level. This marks the first uptick in unemployment in four months. The data reveals that the number of employed workers decreased by -100k during the month, while the ranks of those without jobs swelled by 110k.
Adding to the concern, jobs-to-applicants ratio—a leading indicator of labor market health—dipped to 1.29 in July from 1.30. This is the third consecutive monthly decline, counter to median economist forecasts that predicted the ratio would remain flat. These figures indicate that there were only 129 job openings for every 100 applicants, a metric that is closely watched for signs of labor market tightness or slack.
GBPJPY Wave Analysis
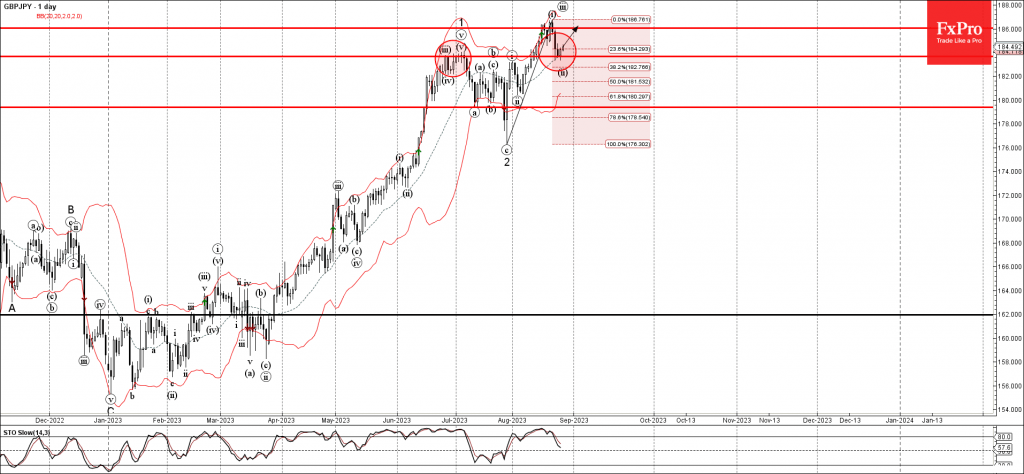
- GBPJPY reversed from key support level 183.65
- Likely to test resistance level 186.00
GBPJPY currency pair recently reversed up from the key support level 183.65, which reversed the pair in June and July.
The upward reversal from the support level 183.65 stopped the earlier short-term correction ii.
Given the clear daily uptrend, GBPJPY currency pair can be expected to rise further toward the next resistance level 186.00 (which reversed the pair earlier this month).
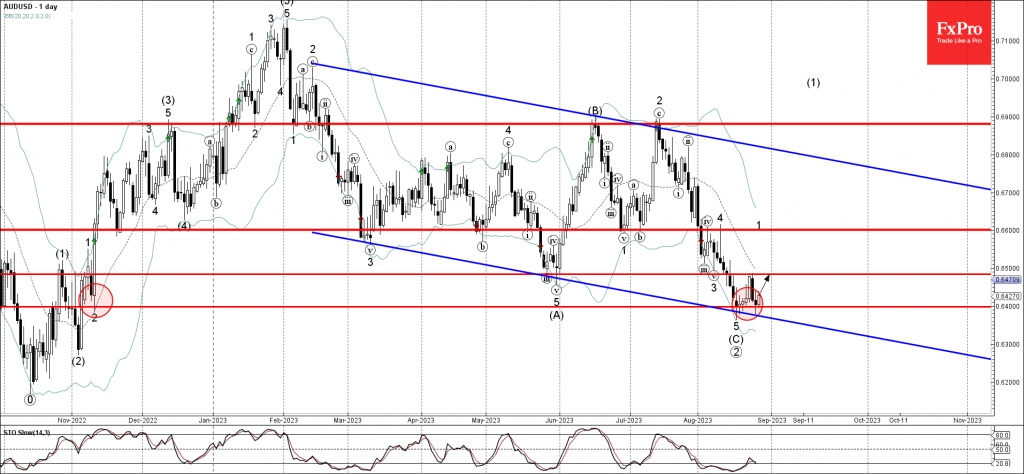
AUDUSD Wave Analysis
- AUDUSD reversed from the support level 0.6400
- Likely to rise to resistance level 0.6500
AUDUSD currency pair recently reversed up from the support level 0.6400, which has been reversing the pair since last November.
The support level 0.6400 was strengthened by the nearby lower daily Bollinger Band and the support trendline of the wide down channel from February.
Given the strength of the support level 0.6400, AUDUSD currency pair can be expected to rise further toward the next resistance level 0.6500 (former multi-month support from May).