Sample Category Title
Dollar’s Commanding Surge Amid China’s Property and Financial Tremors
Dollar surges broadly today, breaking through near term support against Euro, 145 handle against Yen, as well as near high of the year against Chinese Yuan. Worries over China's property, as well as finance sector are weighing heavily down on sentiment. But Swiss Franc and Yen are not benefiting much from risk aversion as in early US session. Indeed, European majors are trading as the worst performers for now, while commodity currencies are trying to recover. That's a development that warrants more monitoring.
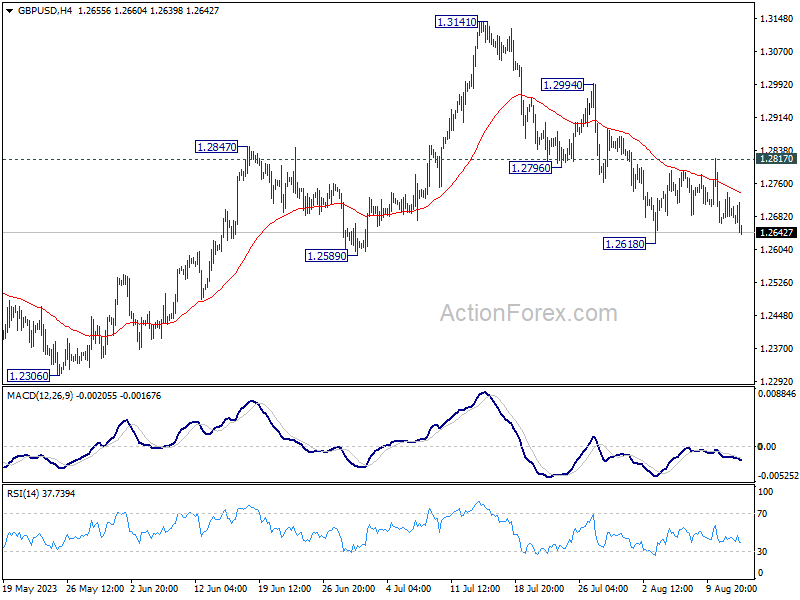
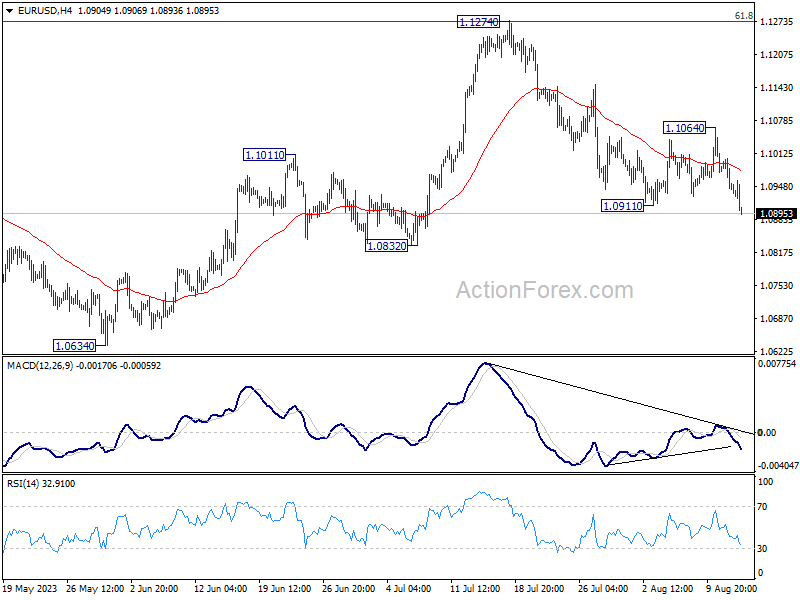
Technically, both EUR/USD has taken out 1.0911 support while USD/CHF broke 0.8804 resistance. Both developments indicate resumption of Dollar's rebound. A focus is now on when GBP/USD would follow by breaking through 1.2618 support to resume the fall from 1.3141. The imminent question though revolves around tomorrow's UK job data – could this potentially breathe life into the Pound, triggering a rebound?
In Europe, at the time of writing, FTSE is down -0.42%. DAX is up 0.30%. CAC is down -0.04%. Germany 10-year yield is up 0.0034 at 2.629. Earlier in Asia, Nikkei dropped -1.27%. Hong Kong HSI dropped -1.58%. China Shanghai SSE dropped -0.34%. Singapore Strait Times dropped -1.41%. Japan 10-year JGB yield rose 0.0296 to 0.619.
Chinese Yuan nosedives to year low amid deepening property sector concerns
The Chinese Yuan nosedived to its lowest mark this year, echoing growing anxieties that spread from the real estate domain to the financial sector. Fueling this downturn, JPMorgan Chase & Co. rang alarm bells today, highlighting heightened liquidity strains for debt-ridden developers and their non-bank stakeholders. This follows a notable hiccup by a subsidiary of Zhongzhi Enterprise Group Co., which stands among China's premier private wealth management entities. The said unit stumbled in ensuring timely payments across multiple products.
These defaults in the trust sector could potentially trigger a detrimental cycle impacting the onshore debt of privately-owned enterprise developers. The escalating apprehensions regarding potential developer defaults have soured the investment climate. Consequently, trust entities may either find it challenging or may express reluctance in rolling over existing products tied to real estate.
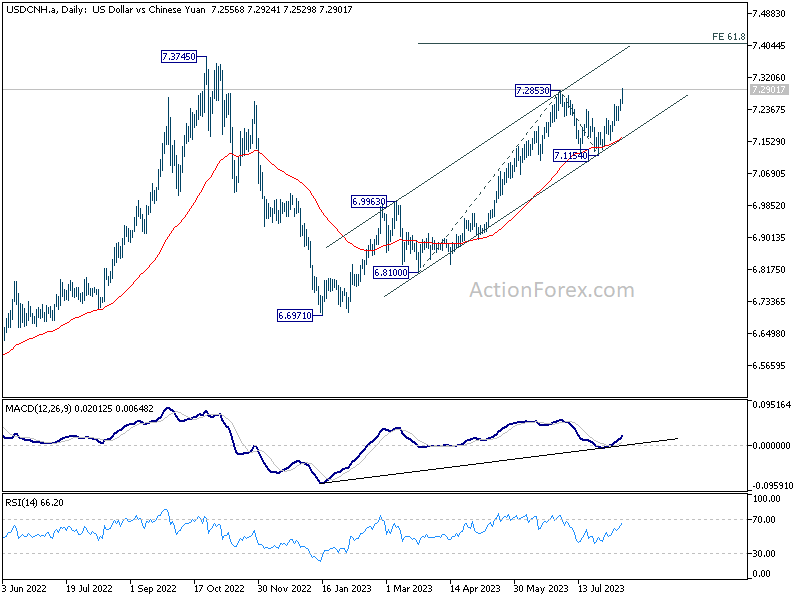
USD/CNH's break of 7.2853 resistance confirms resumption of whole rally from 6.6971 (Jan low). Purely technically speaking, current rise should target 7.3745 resistance first (2022 high), and then 61.8% projection of 6.8100 to 7.2853 from 7.1154 at 7.4091. However, market watchers are most intrigued by a looming question: When will China's authoritative bodies intervene to arrest the Yuan's descent?
Japan in Spotlight: Q2 GDP, Nikkei, and Yen dynamics garner attention
Investor attention is set to pivot towards Japan's Q2 GDP data in the upcoming Asian session. Preliminary forecasts project a qoq growth of 0.8%, translating to an annualized expansion of 3.1%. In today's trading, Nikkei took a significant hit, sliding by -1.27% or -413.7 points, largely influenced by bearish sentiments rooted in China's property sector. Meanwhile, Yen showed signs of wavering post an initial surge, setting the stage for a keen watch on its reaction, as well as Nikkei's, to the impending GDP figures.
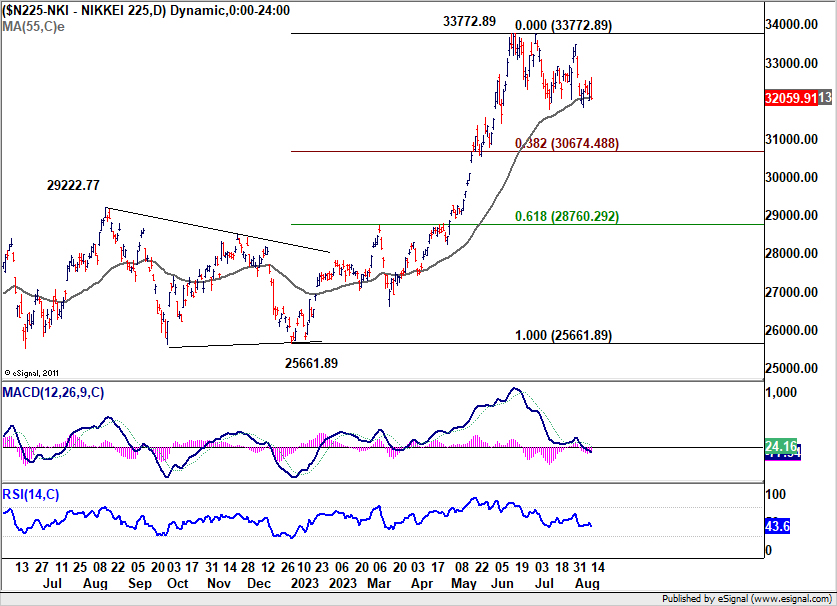
After some initial volatility following BoJ's adjustment on YCC on July 28, Nikkei has weakened notably. Technically, it's now pressing 55 D MEA and looks vulnerable to deeper decline. Nevertheless, Overall price actions from 33772.89 are just viewed as a corrective move to the long term up trend only, as also supported by the structure. Hence, even in case of a deeper pull back, strong support should be seen from 38.2% retracement of 25661.89 to 33772.89 to contain downside. Meanwhile, strong rebound from current level, would bring retest of 33772.89 high.
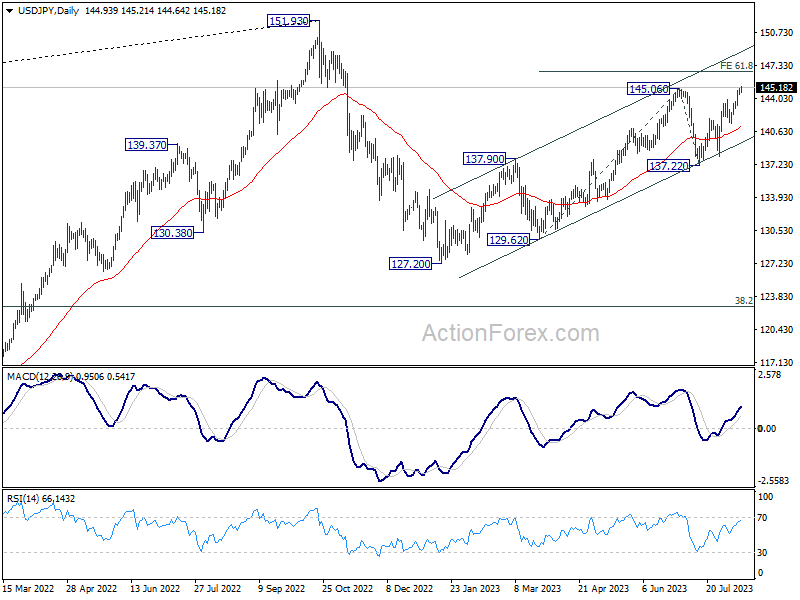
Meanwhile, Yen continued to weaken after brief post-BoJ spike, with USD/JPY breaking through 145 handle today. Market chatter suggests a potential pushback by Ministry of Finance in the 145-148 range, though tangible signs of intervention remain absent. Yet it's a wait-and-watch game to discern if Japan would act beyond the 145 mark. Nevertheless, technically, 61.8% projection of 129.62 to 145.06 from 137.22 at 146.76 doe present a resistance to overcome.
NZ BNZ services plunges down to 47.8, deepening contraction as activity dives
New Zealand's service sector, as gauged by the BusinessNZ Performance of Services Index, experienced a marked decline in July, descending from 49.6 to a worrying 47.8. This latest reading is not only the lowest since January 2022 but also trails the long-term average of 53.5 significantly.
A detailed analysis of the index highlights concerning trends. The activity component has sharply dropped from 50.9 to 39.6, marking its worst performance since August 2021 and setting a gloomy record. Specifically, this month's reading stands as the worst non-lockdown related reading on record since 2007. New orders within businesses have taken a substantial hit, plummeting from 50.4 to 43.8.
Meanwhile, employment showed a marginal decrease, moving from 49.1 to 49.0. On a brighter note, stocks or inventories observed an increase, jumping from 47.2 to 54.0, with supplier deliveries also ticking up from 51.0 to 52.1.
BusinessNZ's Chief Executive, Kirk Hope, said. "The further fall into contraction during July also saw another lift in the proportion of negative comments," he remarked, drawing attention to the sharp increase in negative feedback, which escalated to 67% from 55.6% in June and 49.4% in May.
Hope continued, "Overall, negative comments received were strongly dominated by a general downturn in the economic conditions/slowing economy, as well as ongoing increased costs."
BNZ Senior Economist, Doug Steel, weighed in on the data, highlighting a distressing pattern. "The results all point to a sharp drop in demand in July, significantly accelerating the slowing trend that had been evident for many months," he said.
EUR/USD Mid-Day Outlook
Daily Pivots: (S1) 1.0926; (P) 1.0965; (R1) 1.0988; More...
Break of 1.0911 support indicates resumptions of fall from 1.1274. Intraday bias in EUR/USD is back on the downside for 1.0832 support. Sustained trading below there will target 1.0609/34 cluster support. On the upside, break of 1.1064 resistance is needed to indicate completion of the fall. Otherwise, outlook will stay cautiously bearish in case of recovery.
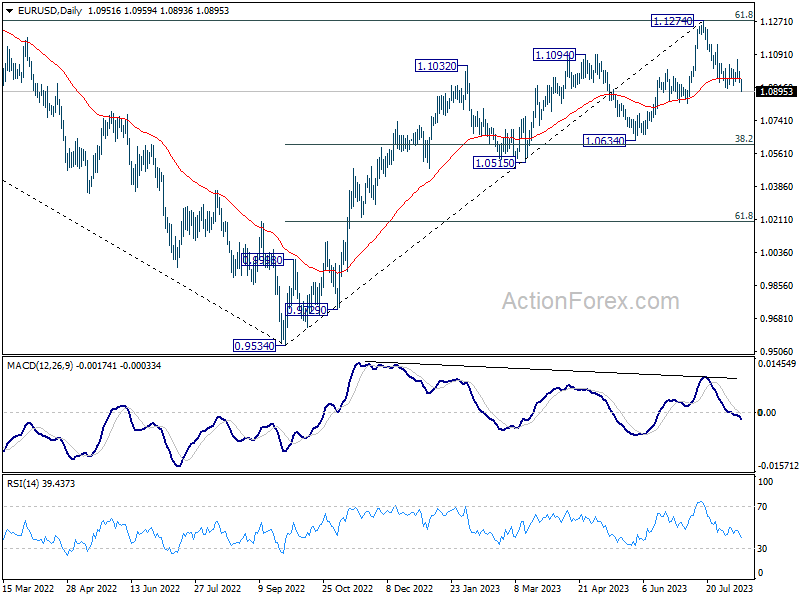
In the bigger picture, a medium term top could be formed at 1.1274, after failing to break through 61.8% retracement of 1.2348 (2021 high) to 0.9534 at 1.1273 decisively, on bearish divergence condition in D MACD. Sustained trading below 55 D EMA (now at 1.0966) will bring deeper correction to 1.0634 cluster support (38.2% retracement of 0.9534 to 1.1274 at 1.0609). Strong support could be seen there, at least on first attempt, to set the range for consolidation.
Economic Indicators Update
| GMT | Ccy | Events | Actual | Forecast | Previous | Revised |
|---|---|---|---|---|---|---|
| 22:30 | NZD | Business NZ PSI Jul | 47.8 | 50.1 | 49.6 | |
| 06:00 | EUR | Germany Wholesale Price Index M/M Jul | -0.20% | -0.20% |
Chinese Yuan nosedives to year low amid deepening property sector concerns
The Chinese Yuan nosedived to its lowest mark this year, echoing growing anxieties that spread from the real estate domain to the financial sector. Fueling this downturn, JPMorgan Chase & Co. rang alarm bells today, highlighting heightened liquidity strains for debt-ridden developers and their non-bank stakeholders. This follows a notable hiccup by a subsidiary of Zhongzhi Enterprise Group Co., which stands among China's premier private wealth management entities. The said unit stumbled in ensuring timely payments across multiple products.
These defaults in the trust sector could potentially trigger a detrimental cycle impacting the onshore debt of privately-owned enterprise developers. The escalating apprehensions regarding potential developer defaults have soured the investment climate. Consequently, trust entities may either find it challenging or may express reluctance in rolling over existing products tied to real estate.
USD/CNH's break of 7.2853 resistance confirms resumption of whole rally from 6.6971 (Jan low). Purely technically speaking, current rise should target 7.3745 resistance first (2022 high), and then 61.8% projection of 6.8100 to 7.2853 from 7.1154 at 7.4091. However, market watchers are most intrigued by a looming question: When will China's authoritative bodies intervene to arrest the Yuan's descent?
Japan in Spotlight: Q2 GDP, Nikkei, and Yen dynamics garner attention
Investor attention is set to pivot towards Japan's Q2 GDP data in the upcoming Asian session. Preliminary forecasts project a qoq growth of 0.8%, translating to an annualized expansion of 3.1%. In today's trading, Nikkei took a significant hit, sliding by -1.27% or -413.7 points, largely influenced by bearish sentiments rooted in China's property sector. Meanwhile, Yen showed signs of wavering post an initial surge, setting the stage for a keen watch on its reaction, as well as Nikkei's, to the impending GDP figures.
After some initial volatility following BoJ's adjustment on YCC on July 28, Nikkei has weakened notably. Technically, it's now pressing 55 D MEA and looks vulnerable to deeper decline. Nevertheless, Overall price actions from 33772.89 are just viewed as a corrective move to the long term up trend only, as also supported by the structure. Hence, even in case of a deeper pull back, strong support should be seen from 38.2% retracement of 25661.89 to 33772.89 to contain downside. Meanwhile, strong rebound from current level, would bring retest of 33772.89 high.
Meanwhile, Yen continued to weaken after brief post-BoJ spike, with USD/JPY breaking through 145 handle today. Market chatter suggests a potential pushback by Ministry of Finance in the 145-148 range, though tangible signs of intervention remain absent. Yet it's a wait-and-watch game to discern if Japan would act beyond the 145 mark. Nevertheless, technically, 61.8% projection of 129.62 to 145.06 from 137.22 at 146.76 doe present a resistance to overcome.
GBP/USD Steady Ahead of Jobs Data
- UK wages expected to accelerate by 7.9%
- US retail sales projected to rise 0.4%
The British pound is quiet at the start of the week. In the European session, GBP/USD is trading at 1.2701, up 0.05%.
UK wage growth expected to jump
The UK releases key employment numbers on Tuesday and the data is expected to show that the UK labour market remains tight. The economy is expected to have created 50,000 jobs in the three months to June. That number is down from 125,000 previously, but unemployment claims are expected to drop by 7,300, down from a gain of 25,700 previously. Most importantly, wage growth including bonuses is expected to jump to 7.3% in the three months to May, compared to 6.9% in the previous three months.
A jump in wage growth will not be welcome news for the Bank of England, which has had limited success in its battle to rein in inflation. Wage growth has been elevated due to high inflation and the tight labour market and an acceleration in wages will support a rate hike at the September meeting. The BoE has raised rates to 5.25%, but inflation has fallen more slowly than expected and is currently at 7.9%, the worst in the G-7.
Over in the US, the markets are widely expecting the Fed to pause at the September 20th meeting. That will allow the markets to focus on key releases and try to determine if the economy is too strong, which could mean further rate hikes late in the year. Retail sales, which will be released on Tuesday, will provide a snapshot of whether consumers are still spending despite inflation and rising interest rates. Both the headline and core rates are expected to rise by 0.4% in July after a 0.2% gain in June.
GBP/USD Technical
- GBP/USD is putting pressure on resistance at 1.2726. The next resistance line is 1.2787
- 1.2634 and 1.2573 are providing support
Busy Data Calendar But Will Yen Take Notice of Any Possible Upside Surprises?
Japanese data releases continue unabated by the summer lull as this week’s calendar includes the preliminary GDP print for the second quarter of 2023 and the July national inflation report. Barring a plethora of upside data surprises, only the resurfacing of the intervention rumours could provide a helping hand to the yen, especially against the euro.
BoJ is still on the sidelines
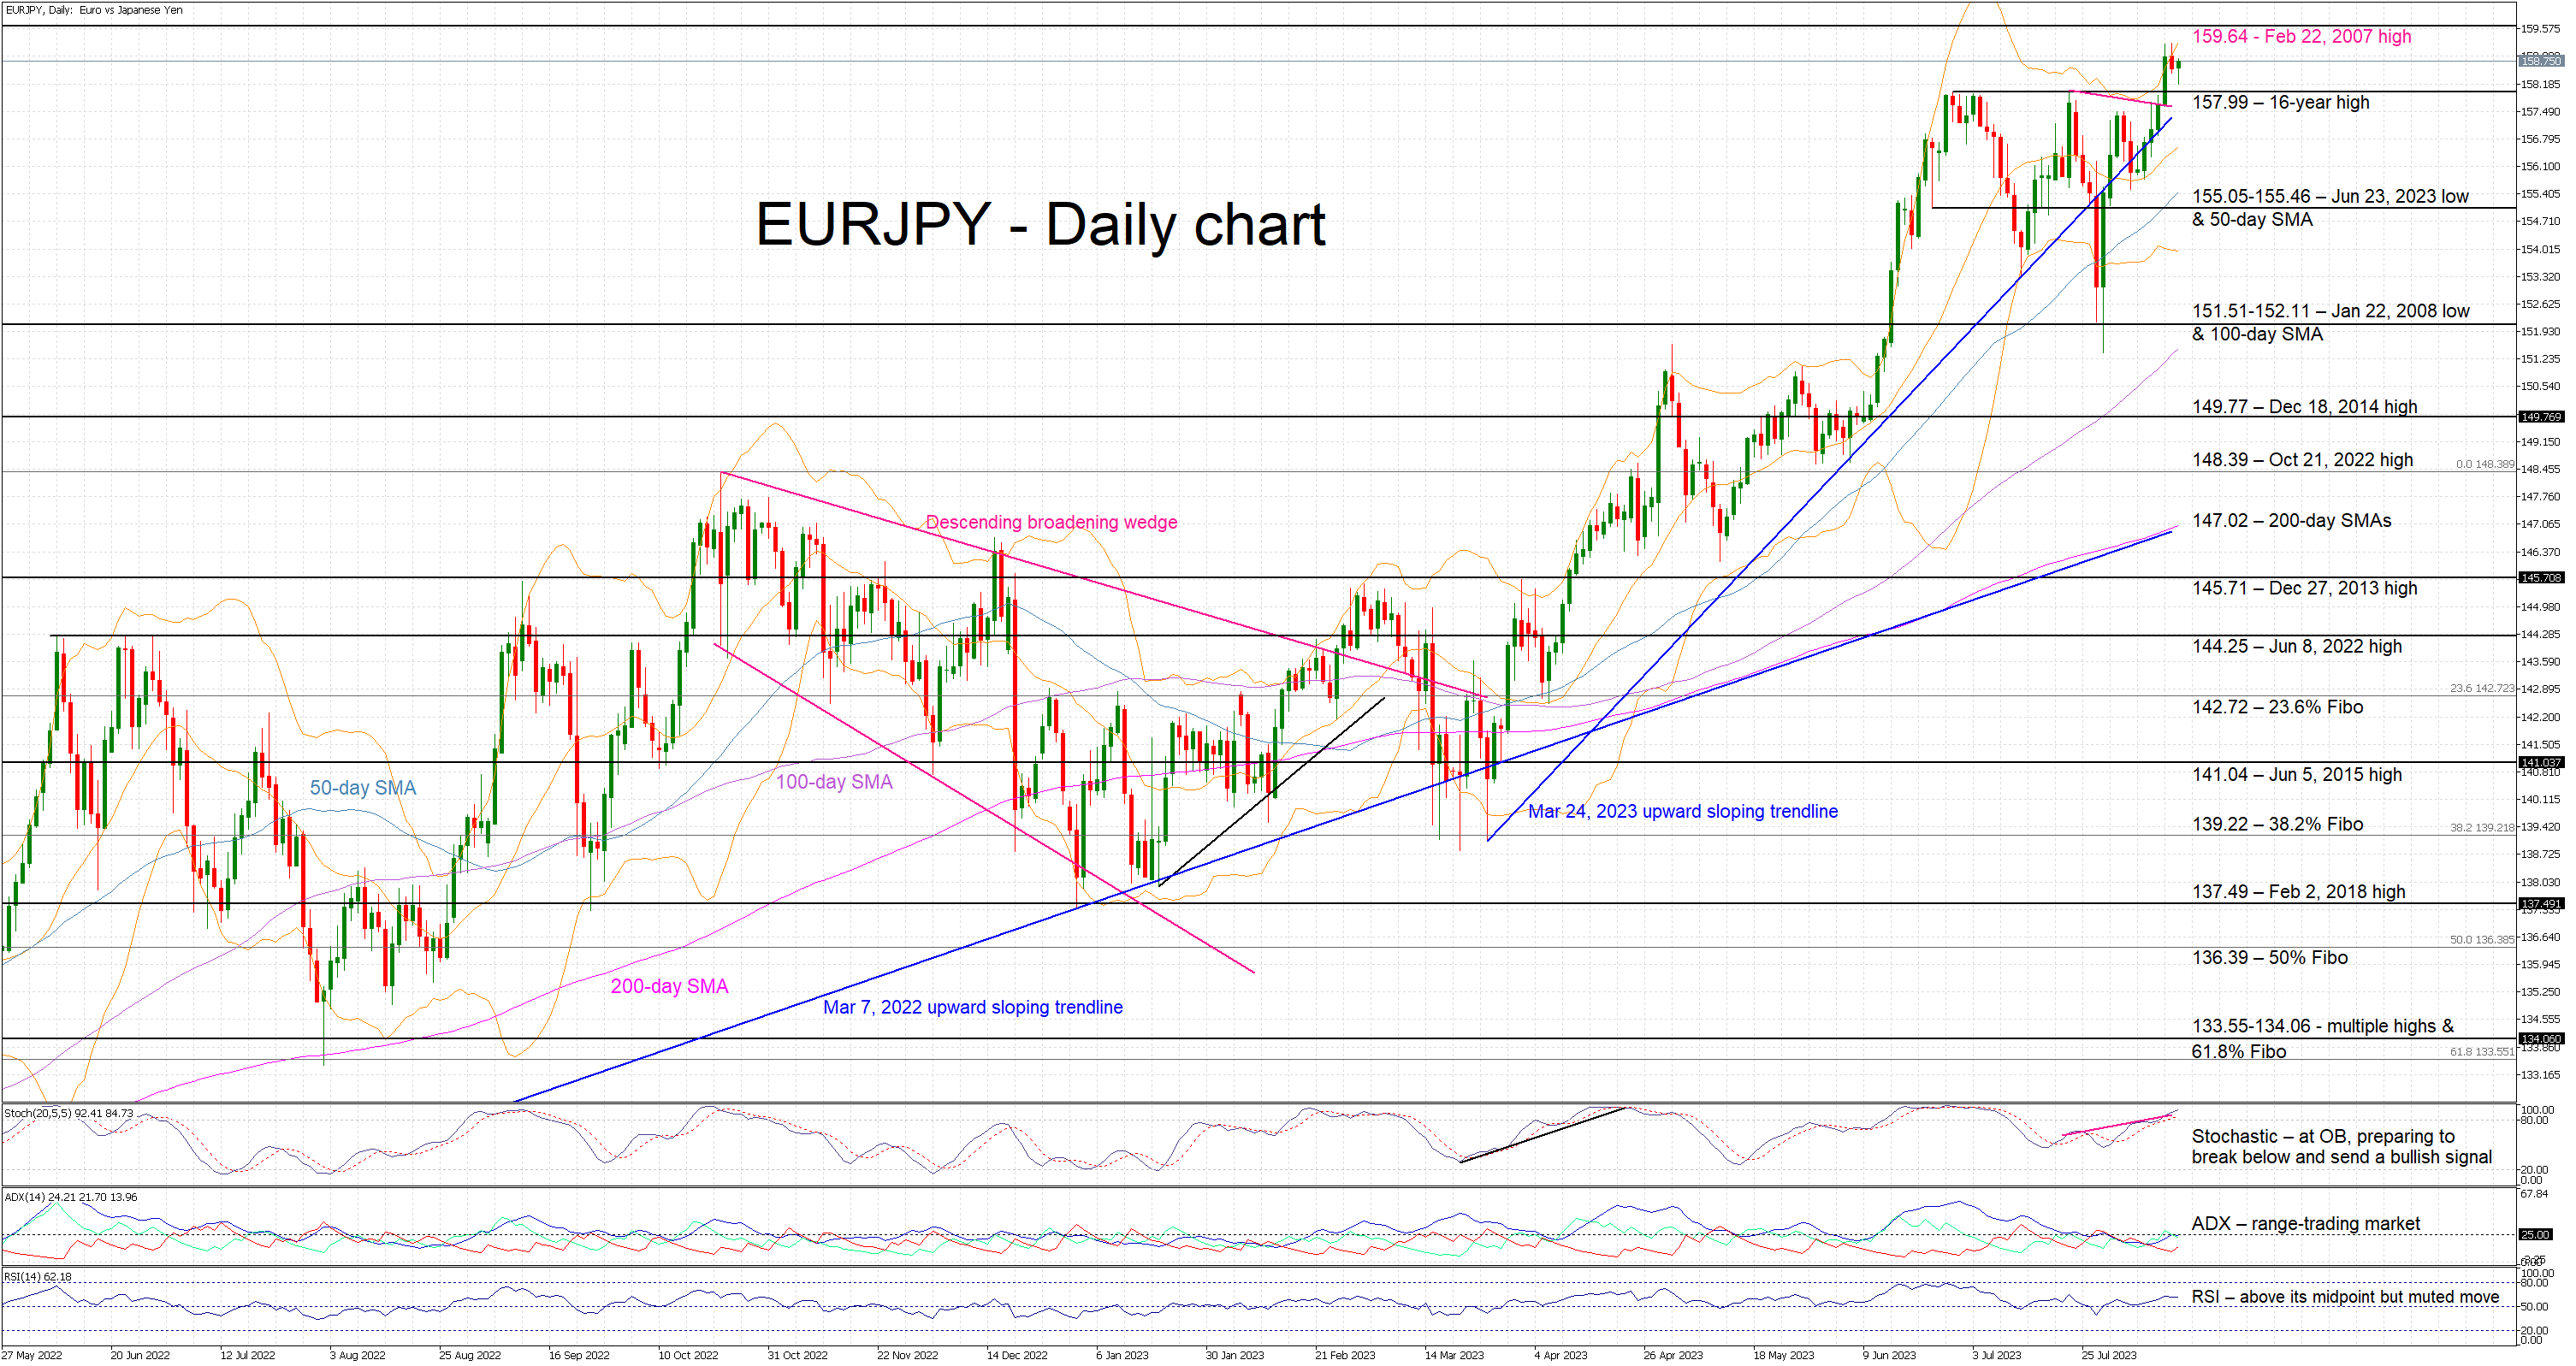
Following the disappointing July 28 meeting, the BoJ appears to observe a quiet period of analysing incoming data and preparing for the usually market-moving and thought-provoking Jackson Hole gathering held in late-August. With the yen suffering from the lack of significant BoJ announcements, but the 10-year Japanese bond behaving well lately, there is a growing possibility of intervention rumours taking over the market again. While the US dollar-yen pair is the key factor in the Ministry of Finance’s decision to order such an intervention, euro-yen is getting dangerously close to testing the February 22, 2007 high of 159.64 and thus raising a few eyebrows at the MoF halls.
Maybe data releases could offer some reprieve
Amidst this environment, the economic data calendar is rather full this week. On Tuesday, we will get the preliminary GDP result for the second quarter of 2023. The market is expecting another impressive report with the annualized figure seen at 3.1%, up from 2.7% in the previous quarter.
As a comparison, the preliminary US GDP print came at 2.4% YoY quarterly annualized growth and Germany recorded another negative quarter, with the euro area aggregate figures kept in positive territory due to the strong performance of France. Interestingly, these mixed GDP results raise questions on the likely global growth figures achieved if China manages to overcome its current domestic issues. Maybe this week’s Chinese data could finally offer some further valuable insight on the underlying economic developments there.
Returning to the Japanese data, and the BoJ hawks are probably smiling after last week’s decent labour cash earnings print. This is one of the few bright spots in the data calendar but clearly not enough to push the BoJ into announcing a much-discussed rate hike. Only the inflation report possesses this unique power and on Friday we will be updated on the national inflation figures for the month of July.
While the headline CPI did not reach levels seen in both the US and the euro area, it remains at a respectable rate and not that far from its recent peak of 4.3% YoY growth. Some early market forecasts point to a 2.5% YoY increase for July, but there is some positive momentum coming from the producer price index (PPI) recording strong yearly increases, despite its recent easing trend.
From the BoJ’s perspective, it is crucial for the headline figures to remain around 3%. An extended series of 3% inflation prints could gradually be engraved in the public’s mind, eventually allowing the BoJ to escape from its extra loose monetary policy stance.
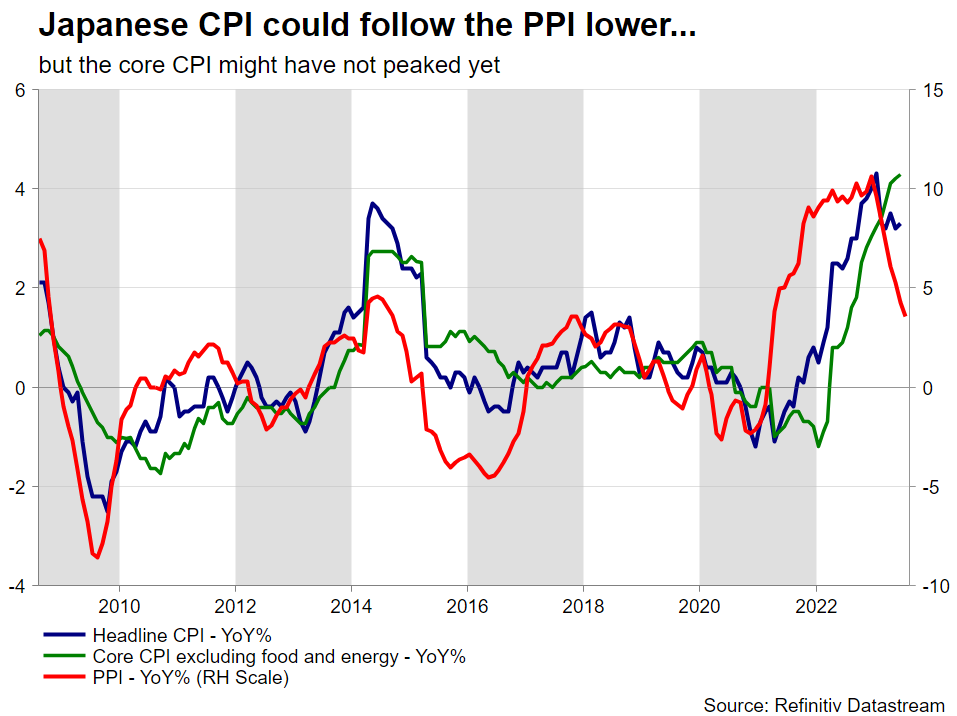
The market's eyes will also be on the two core indicators published with the national CPI component, excluding food, seen rising by 3.1% in July, a tad below its June 2023 high of 3.3%. Interestingly, when examining Chart 1 below, it is obvious that there is a considerable time lag, around 9–15 months to be more precise, between the headline PPI and the core CPI indicator (excluding food and energy). This probably means that this indicator might not have peaked yet and thus some sort of policy tightening could still be on the table.
Euro-yen at record high
The yen continues to suffer against most developed-market currencies. The euro-yen pair made a new 16-year high and looks ready to test the February 22, 2007 high at 159.64. This performance is clearly the product of the divergent monetary policy strategies and the BoJ’s unwillingness to keep the door open to a hawkish rate move down the road. A strong set of data releases this week could allow for a small pullback below the recent 157.99 high, but the yen needs a lot more to reverse the current strong bullish trend in euro-yen.
RBNZ Meets as Kiwi Records a New 2023 Low Against US Dollar
While the month of August is not usually associated with rate-setting meetings, the Reserve Bank of New Zealand holds its 5th gathering for 2023 on Wednesday. No fireworks are expected but there is a very small chance of the Committee adopting a slightly more hawkish tone to support the ailing kiwi, especially against the US dollar.
Events since the last RBNZ meeting
The July 12 meeting confirmed expectations with the RBNZ standing pat at 5.5%. The accompanying statement and minutes were seen as mostly dovish, especially when considering the committee members’ comments about global growth. China was explicitly mentioned as it remains the growth barometer in this region, and its continued economic underperformance, despite the recent measures to bolster consumption, is proving a strong headwind for global growth.
Crucially, the Committee’s comment that “monetary policy reached a more restrictive level earlier than in many other economies” appears to have firmly shut the door for another rate hike in the foreseeable future. The RBNZ’s own projections reflect this situation with May’s Monetary Policy Statement showing the official cash rate being unchanged until the second quarter of 2024, and a rate cut expected in the third quarter of 2024.
The market is not really disagreeing as it is assigning an impressive 1% probability for a 25bps rate hike at this week’s meeting. However, there are still some pockets of the hawkishness manifesting with a more sizeable 45% probability priced in for a rate hike by April 2024. However, this is too far out to support the kiwi at this stage.
On Wednesday we will get a new set of RBNZ projections and even small tweaks in the policy rate projections are clearly not on the agenda. Having said, economic data releases since the July meeting have been mostly positive. Headline inflation for the second quarter of 2023 came above expectations at 6%, but below the previous quarter’s print of 6.7% and RBNZ’s own forecast of 6.1%. It therefore remains at very elevated levels, but the RBNZ is projecting a drop to 2.5% by December 2024. Naturally, an upgrade to the inflation profile at Wednesday’s projections – mostly on the back of the recent oil performance - could infuse some life into the subdued rate hike expectations.
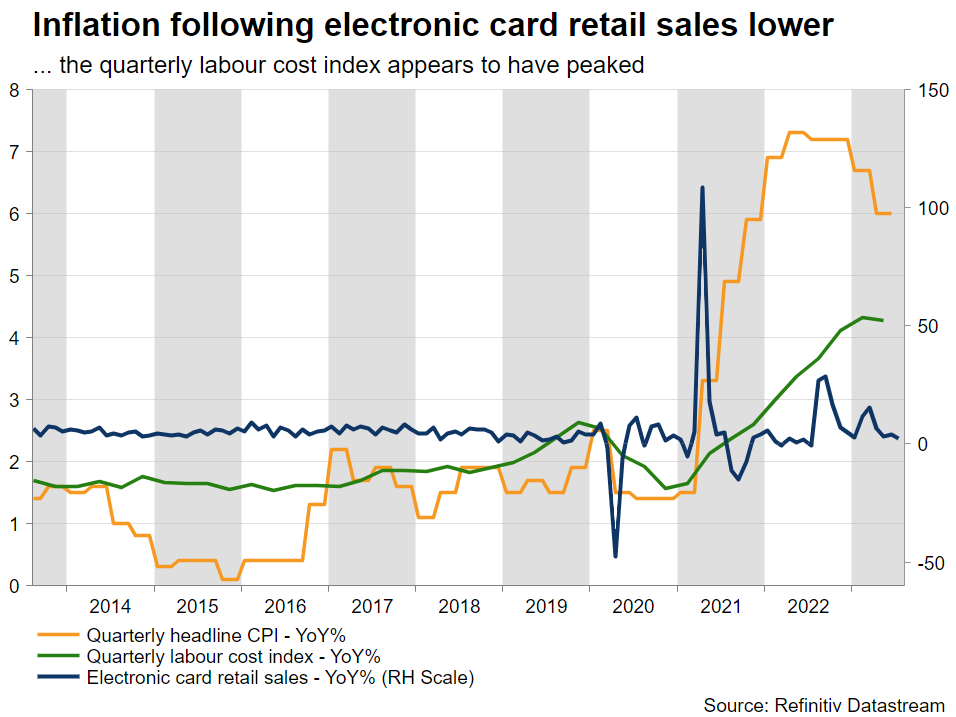
With the Fed and the ECB adopting a data-dependent strategy and certain parts of the market assuming that both have concluded their rate hiking cycles, the RBNZ is expected to keep rates unchanged at 5.5% on Wednesday. It makes sense for Orr et al to wait for the Jackson Hole gathering where Fed Chairman Powell could present his thoughts regarding the rest of 2023.
Additionally, any significant announcements could be delayed until the next RBNZ meeting that is scheduled for October 4. The Committee will have the luxury of evaluating the various central meetings taking place during September while also examining the second quarter GDP figures expected on September 21.
Kiwi is having a rough time lately
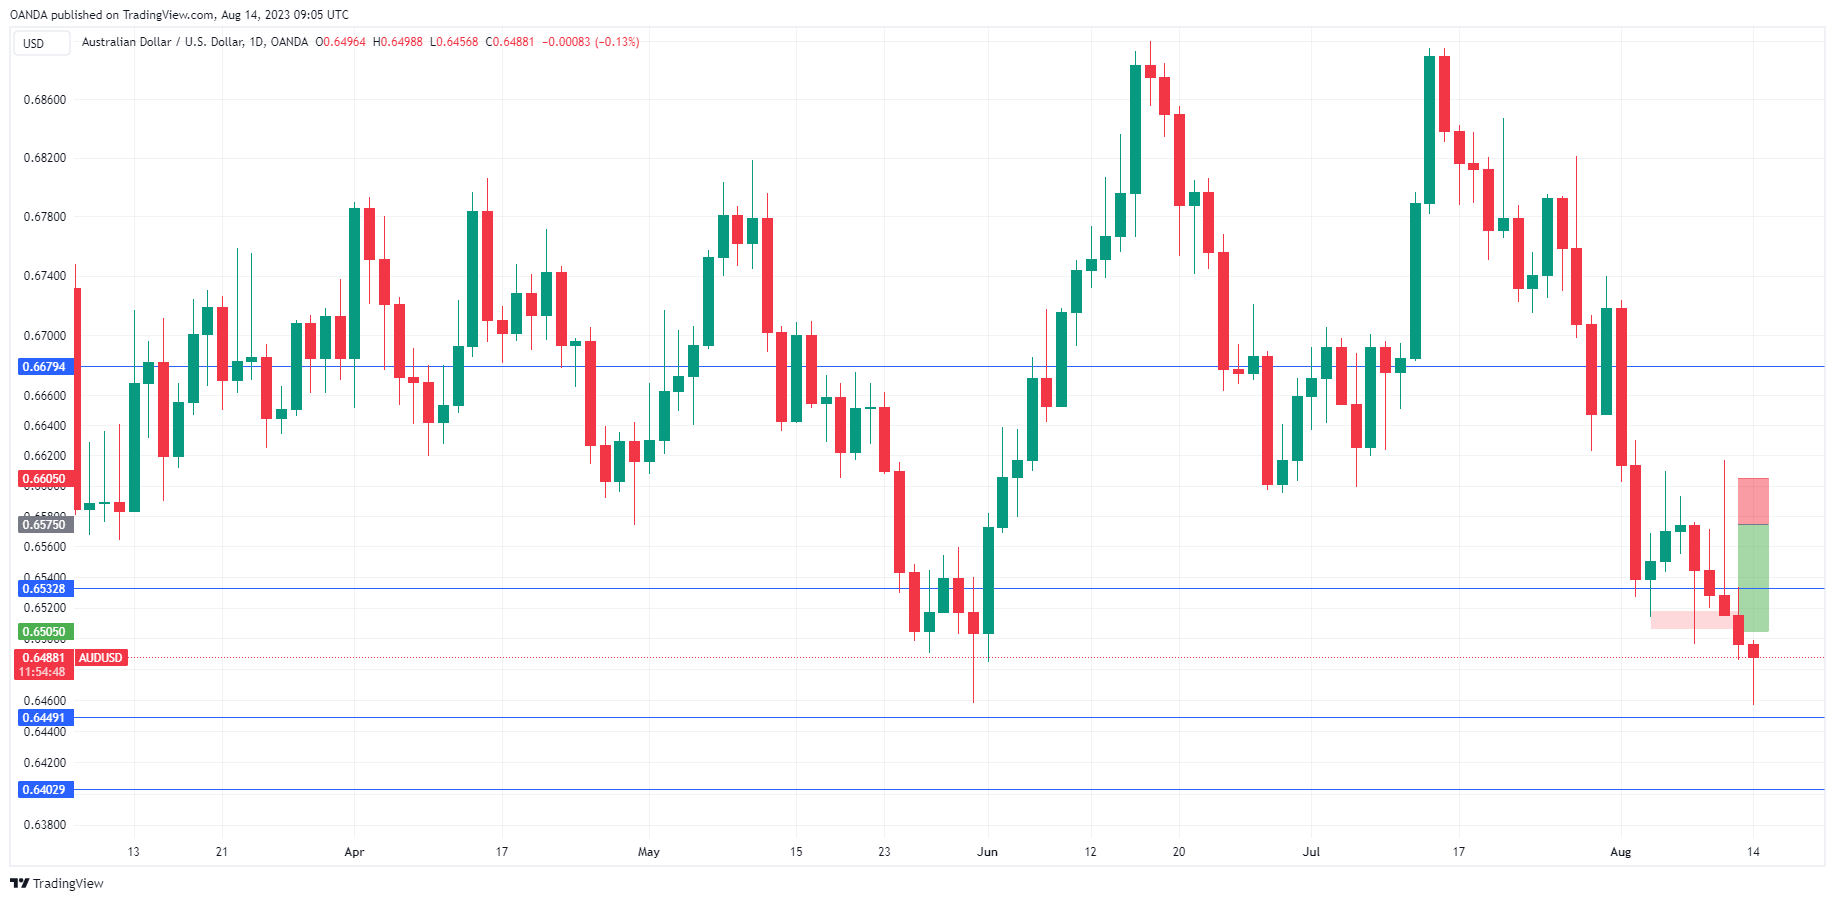
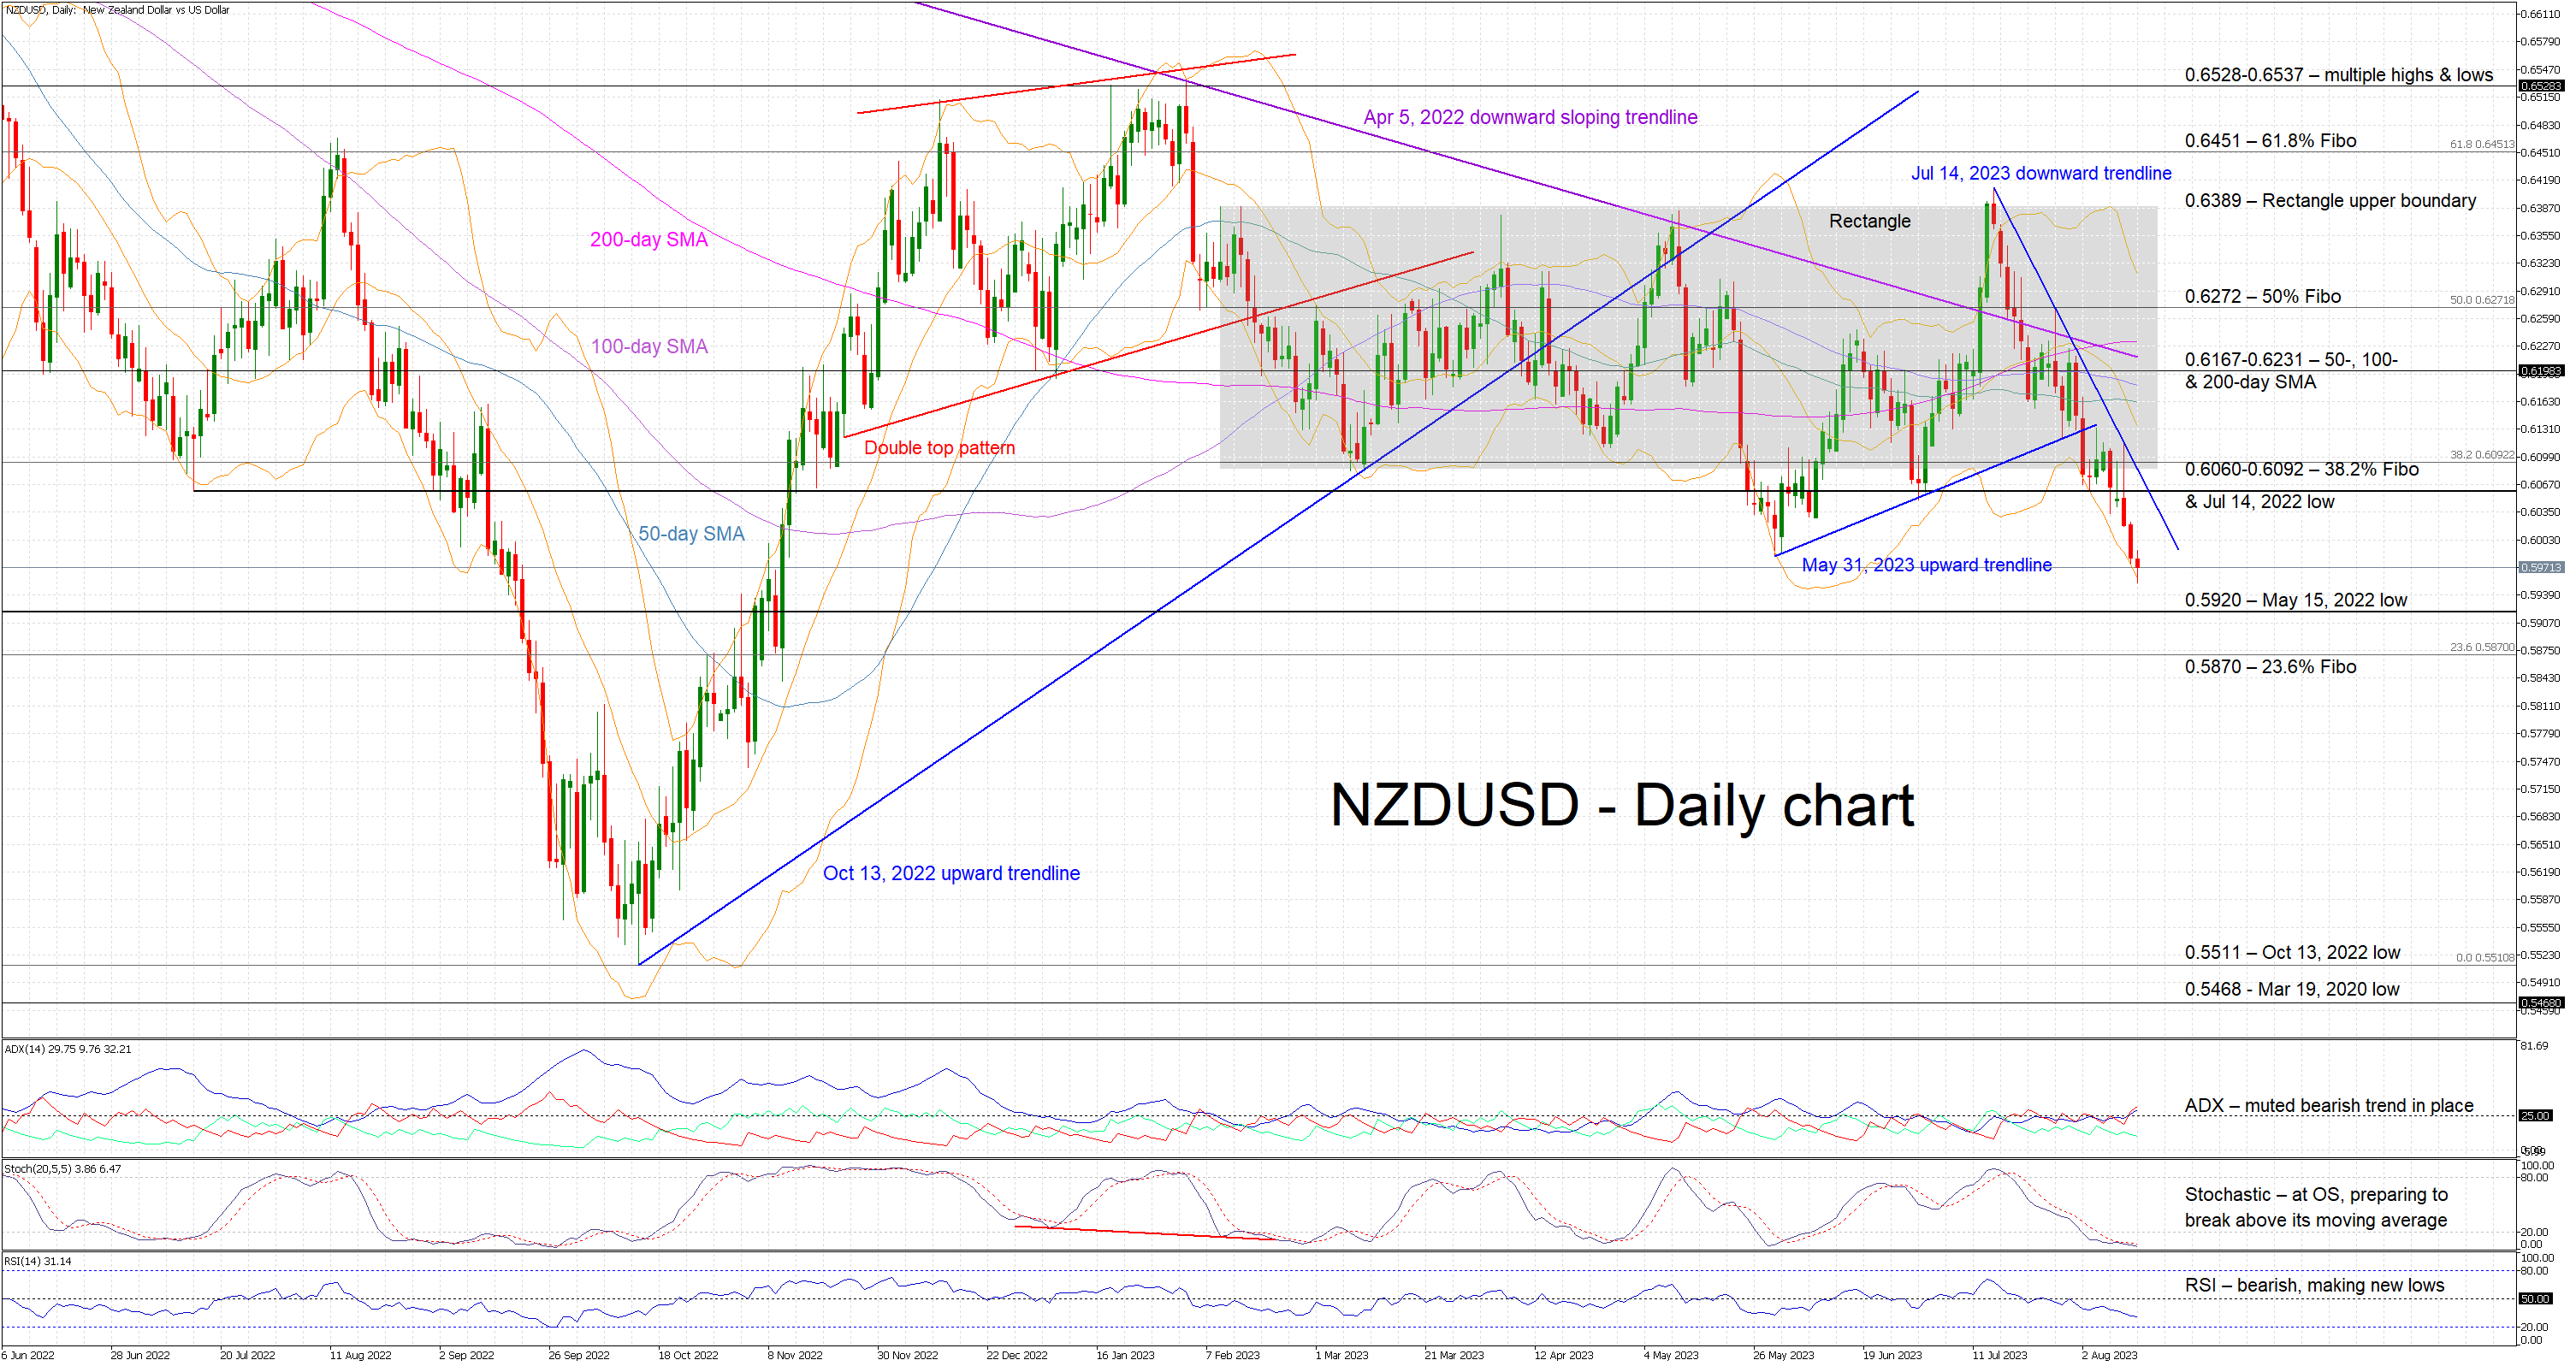
The kiwi-dollar pair has dropped to a new 2023 low after decisively breaking below the rectangle that has defined the price action for most of this year. It has been a one-way street since the July 13, 2023 peak with the pair dropping almost 7%, making the kiwi one the worst performing currencies for 2023. The path of least resistance remains for a lower kiwi-dollar pair, partly due to the muted expectation for the RBNZ meeting. However, if the RBNZ props up its hawkishness and/or increases its inflation outlook profile, we could see an attempt by the kiwi bulls to stage a return inside the aforementioned rectangle.
USDJPY Analysis: Rate Reaches Max of the Year
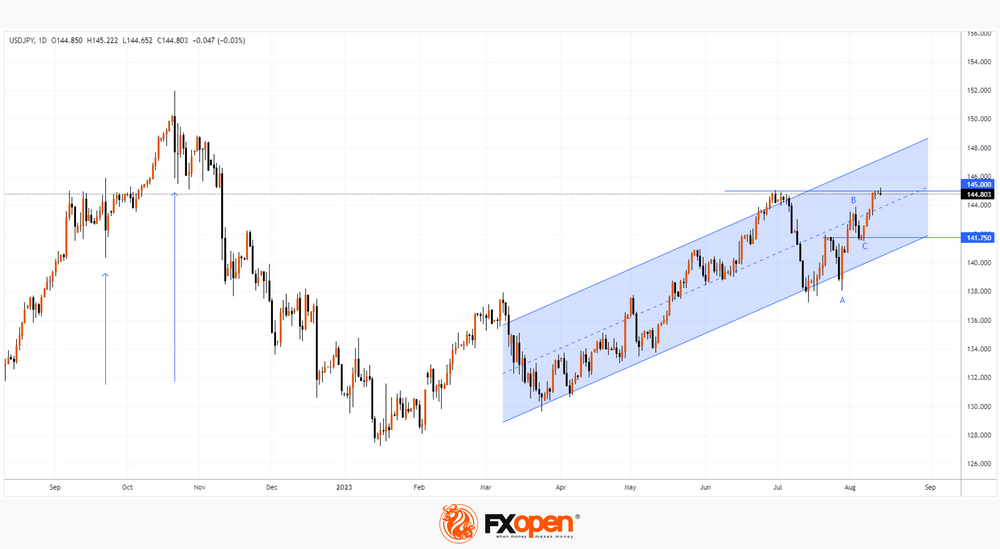
The uptrend in 2023 is due to the difference in the monetary policy of the Bank of Japan and the US Federal Reserve. As the chart shows, USD/JPY hit 145.22 yen per US dollar today. The last time such a rate was relevant was in November 2022 after foreign exchange interventions (marked with arrows).
Since the USD/JPY rate has again reached the level of 145 yen per US dollar, which is important for the Japanese authorities, traders expect official warnings regarding interventions, but there are none yet. Reuters reports the words of Joey Chu, head of Asian currency research at HSBC: "We believe that the Treasury will start moving in the 145-148 range."
Bullish arguments:
→ The ability of the exchange rate to recover from a sharp fall in early July indicates the strength of demand in the market.
→ The chart shows that the rate has not yet reached the upper limit of the ascending channel.
→ B→C retracement after A→B advance was less than 50%.
→ Central bank monetary policy differentials are unlikely to change any time soon.
Bearish arguments:
→ Presumably, traders may take profits from long positions, fearing currency interventions, which will slow down the current bullish trend.
→ This morning there was a false breakdown of June-July highs to force sellers to close positions and lure buyers in the wrong direction.
Important news calendar for USD/JPY (GMT+3):
→ data on inflation in Japan - on Friday, at 2:30;
→ US retail sales data - Tuesday at 15:30;
→ FOMC minutes - Wednesday at 21:30;
→ US labor market data - Thursday at 15:30.
Important levels:
→ support from the median line of the uplink;
→ psychological mark of 145 yen per US dollar;
→ support for 141.75.
This article represents the opinion of the Companies operating under the FXOpen brand only. It is not to be construed as an offer, solicitation, or recommendation with respect to products and services provided by the Companies operating under the FXOpen brand, nor is it to be considered financial advice.
GBP/USD Turns Red While USD/CAD Climbs Higher
GBP/USD is showing bearish signs below 1.2700. USD/CAD is rising and might gain pace above the 1.3500 resistance zone.
Important Takeaways for GBP/USD and USD/CAD Analysis Today
- The British Pound started a fresh decline from the 1.2800 resistance zone.
- There is a key bearish trend line forming with resistance near 1.2700 on the hourly chart of GBP/USD at FXOpen.
- USD/CAD is rising steadily from the 1.3400 support zone.
- There is a major bullish trend line forming with support near 1.3450 on the hourly chart at FXOpen.
GBP/USD Technical Analysis
On the hourly chart of GBP/USD at FXOpen, the pair started a fresh decline from the 1.2800 zone. The British Pound traded below the 1.2740 support to move into a bearish zone against the US Dollar.
The pair even traded below 1.2700 and the 50-hour simple moving average. Finally, the bulls appeared near the 1.2665 level. A low is formed near 1.2665 and the pair is now consolidating losses. There is also a key bearish trend line forming with resistance near 1.2700.
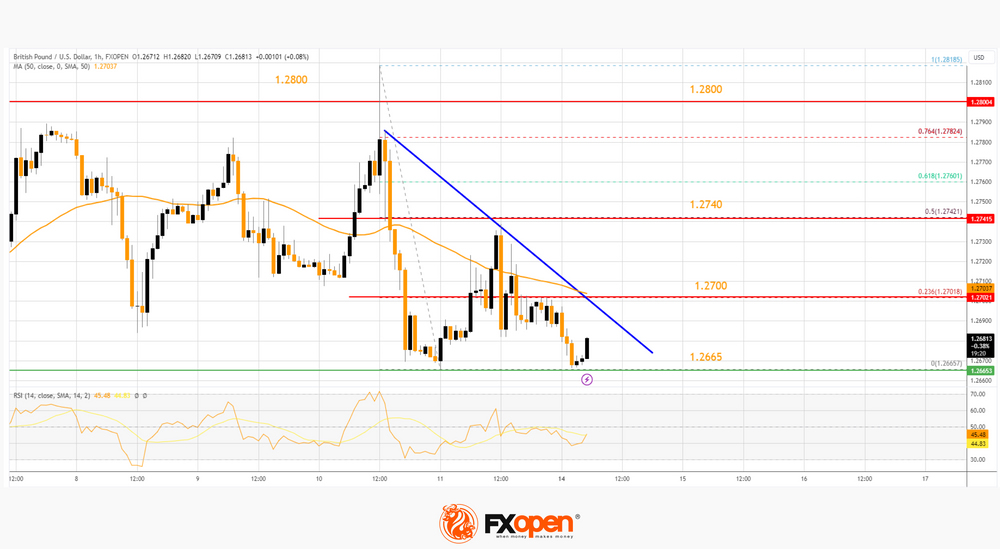
The trend line is near the 23.6% Fib retracement level of the downward move from the 1.2818 swing high to the 1.2665 low. The first major resistance on the GBP/USD chart is near 1.2740.
The 50% Fib retracement level of the downward move from the 1.2818 swing high to the 1.2665 low is also near 1.2740. The next major resistance is near the 1.2800 level. Any more gains could lead the pair toward the 1.2880 resistance in the near term.
Initial support sits near 1.2665. The next major support sits at 1.2650 or 1.2640, below which there is a risk of a sharp decline. In the stated case, the pair could drop toward 1.2550.
USD/CAD Technical Analysis
On the hourly chart of USD/CAD at FXOpen, the pair formed a strong support base above the 1.3370 level. The US Dollar started a decent increase above the 1.3400 resistance against the Canadian Dollar.
The pair cleared the 50-hour simple moving average to move into a positive zone. There was a close above the 50% Fib retracement level of the downward move from the 1.3501 swing high to the 1.3372 low.
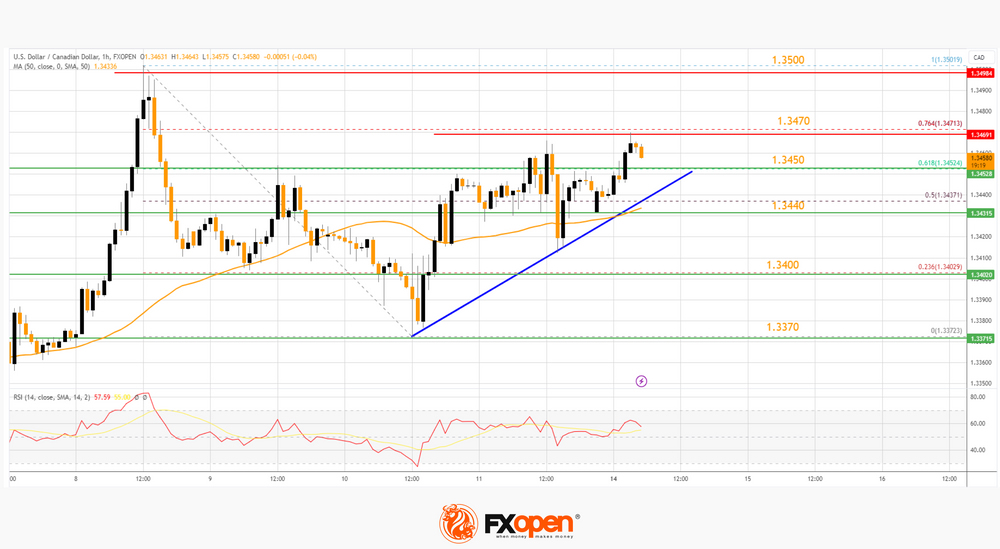
It is now facing resistance near the 76.4% Fib retracement level of the downward move from the 1.3501 swing high to the 1.3372 low at 1.3470. A clear upside break above 1.3470 could start another steady increase.
The next major resistance is the 1.3500 level. A close above the 1.3500 level might send the pair toward the 1.3550 level. Any more gains could open the doors for a test of the 1.3620 level.
Conversely, the pair could start a downside correction. Initial support is near the 1.3450 level and connecting bullish trend line on the same USD/CAD chart. The next major support is near the 50-hour simple moving average at 1.3440.
Any more losses might send the pair toward the 1.3400 pivot level. A downside break below the 1.3400 level could push the pair further lower. The next major support is near the 1.3370 support zone, below which the pair might visit 1.3320.
This article represents the opinion of the Companies operating under the FXOpen brand only. It is not to be construed as an offer, solicitation, or recommendation with respect to products and services provided by the Companies operating under the FXOpen brand, nor is it to be considered financial advice.
Nasdaq 100 Looks Set for Correction, But S&P 500 Holding On For Now
The Nasdaq 100 and S&P 500 indices, most closely followed by retail investors and traders, have faced some downward pressure since early August, but the latter still has a chance of maintaining an uptrend.
The Nasdaq ended last week with a 0.7% loss on Friday, a 1.9% loss for the whole week and a nearly 5% loss since the beginning of the month. Moreover, there was no significant rebound on Friday. This suggests that the tech behemoths are undergoing some profit-taking that began in early August after the impressive rally since the start of the year.
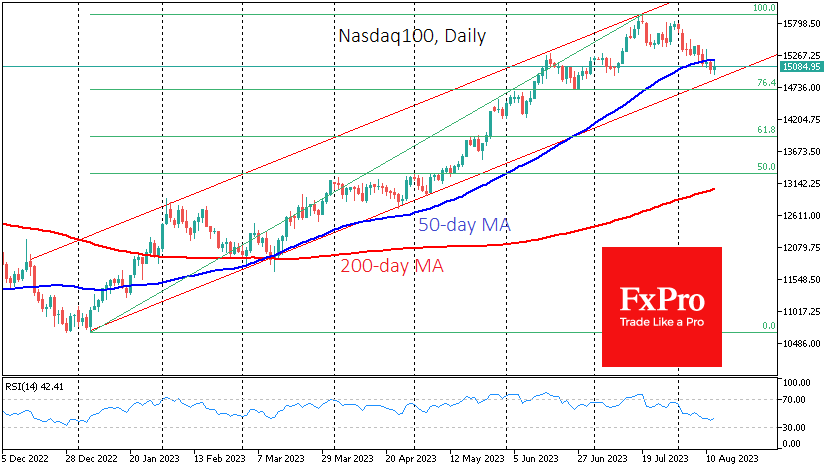
Another important factor for the medium-term trend is that the Nasdaq100 broke below its 50-day moving average (MA) after several days of trying to bounce back from that line. By contrast, in March, along with the 200-day, the same line acted as strong support, followed by a rally of more than a third of the entire Nasdaq100.
Considering this point as the rally’s start, a full correction could take the index back to 14400 before buyers regain market control.
However, it might be more reasonable to start from the lows at the beginning of the year near 10700, which was the third failed attempt by the sellers to break below the July high of 15798. In this case, the Nasdaq100 could decline to 13900, retracing 61.8% of the initial rally. A deeper sell-off target and reliable support could be the 200-day MA, now below 13000 but rising, which would be near 13300 by the end of the month, giving up 50% of the initial rally.
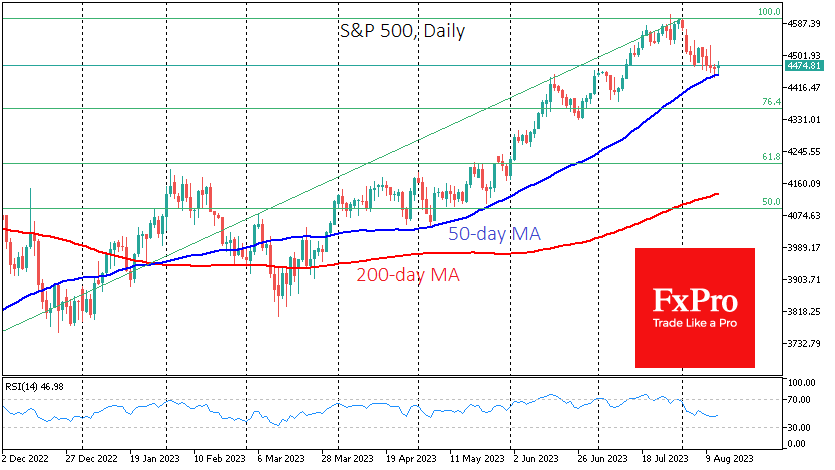
Meanwhile, the broader market represented by the S&P 500 Index remains above its 50-day MA, finding support on Friday on the drop to that line. The ability to stay above 4450 in the coming days could boost buyers and halt the profit-taking that has started in the US stock markets. A break below opens a technical target for a correction all the way to 4210, 6% below the current level.
Gold on Track to Test Ascending 200-day SMA
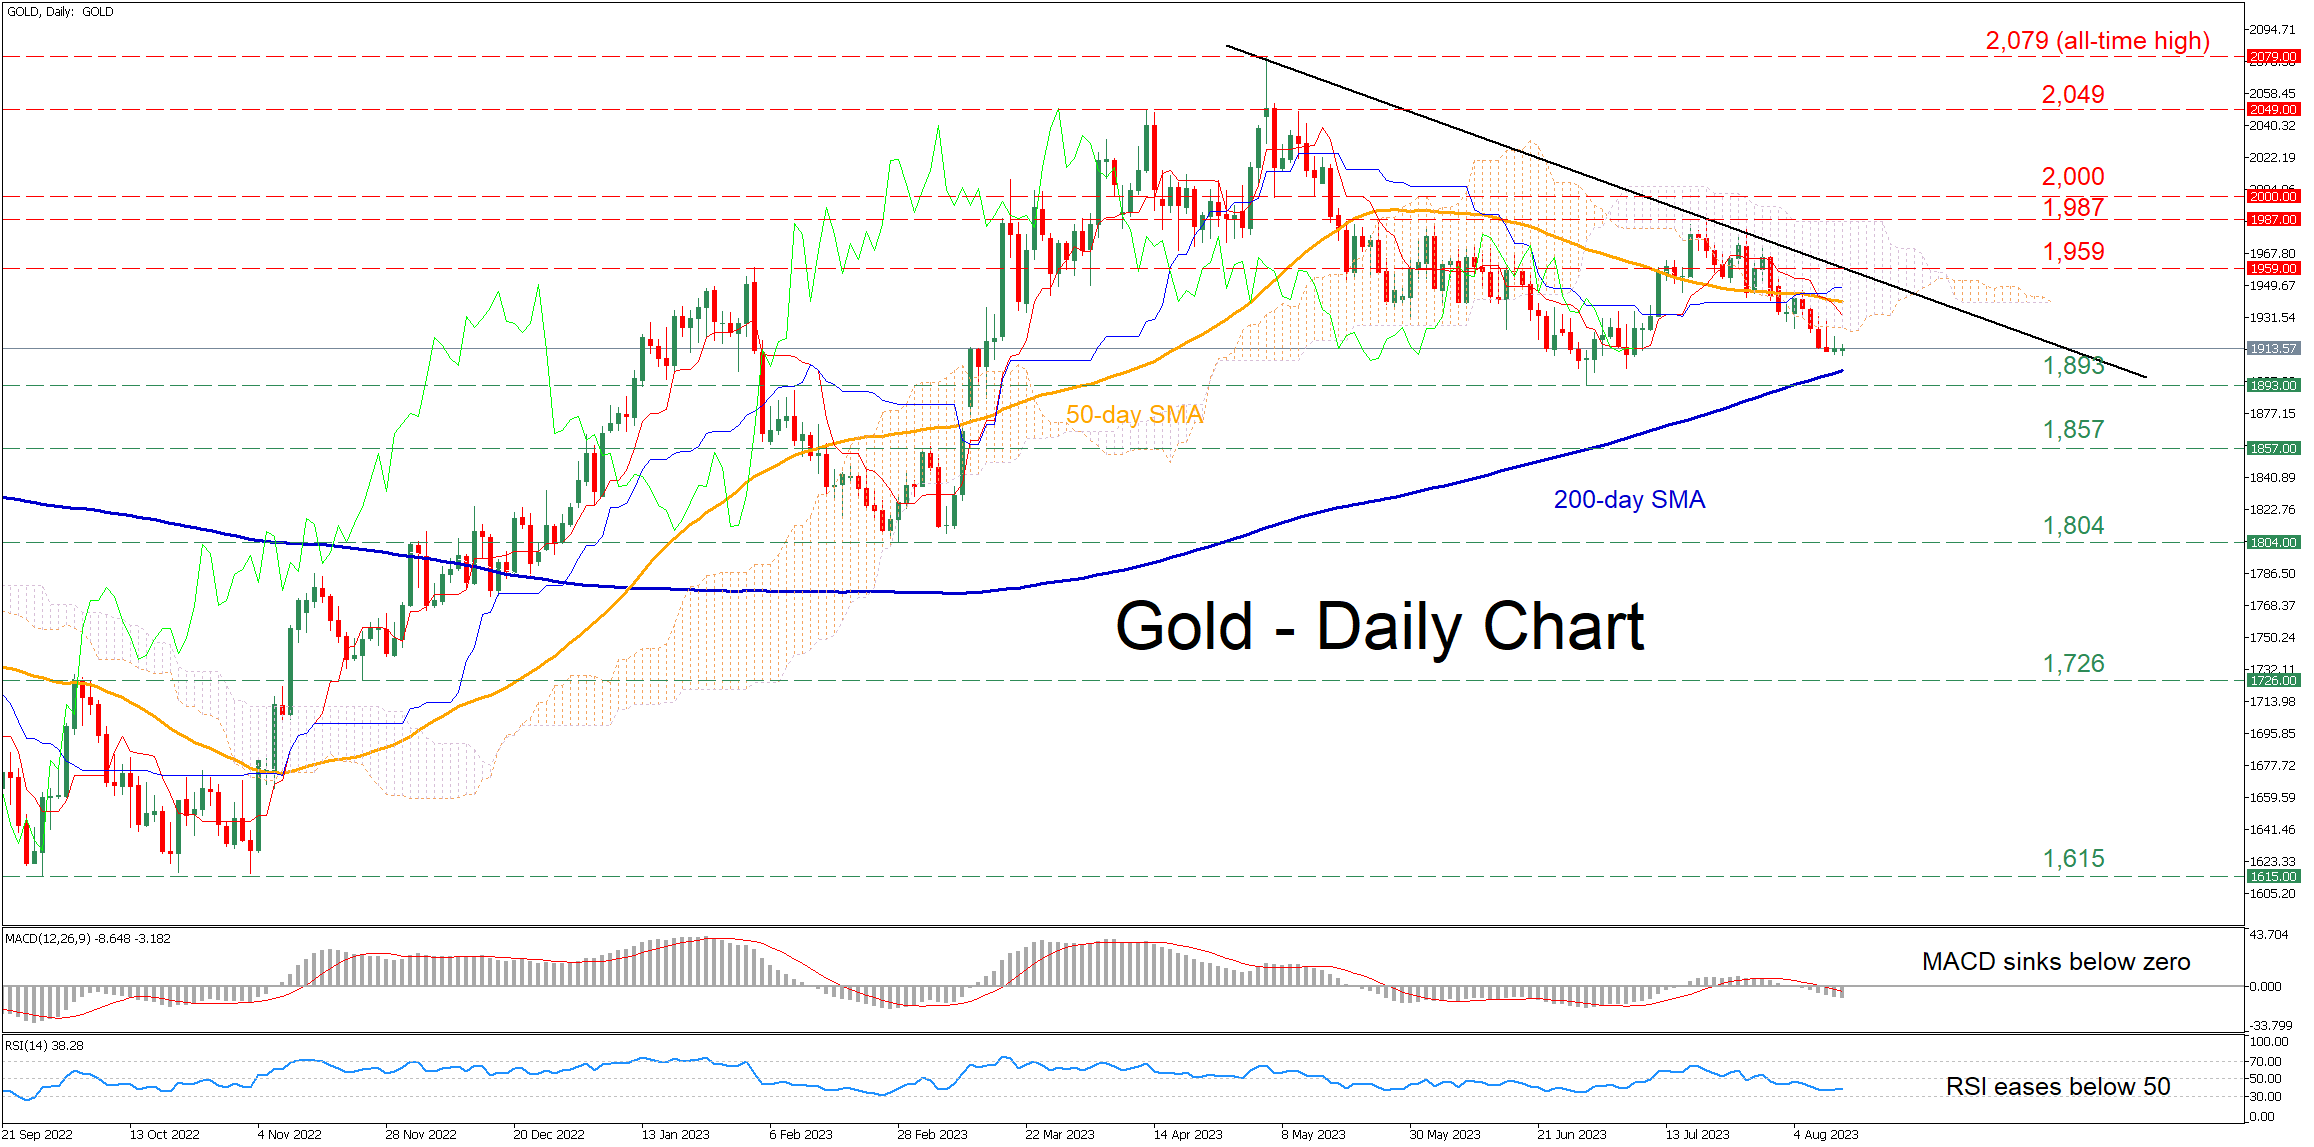
Gold had been experiencing a pullback following its recent peak at 1,987, with the price slicing through both its 50-day simple moving average (SMA) and the Ichimoku cloud. What’s more interesting though is that the price is closing the gap with the upward sloping 200-day SMA, which is a crucial technical zone for bullion.
The short-term oscillators are indicating that the recent decline is likely to accelerate. Specifically, the MACD is weakening further below zero and its red trigger line, while the RSI is flat below its 50-neutral threshold.
If the slide extends, the bears are likely to give a tough fight around the 200-day SMA before the four-month low of 1,893 comes under scrutiny. Further declines may then cease at the March resistance of 1,857, which could serve as support in the future. A violation of that zone could pave the way for the 2023 bottom of 1,804.
Alternatively, should the price bounce off its 200-day SMA and reverse back higher, initial resistance could be met at the February high of 1,959. Conquering this barricade, the bulls may attack the recent rejection region of 1,987. Jumping above that territory, gold could challenge the crucial 2,000 psychological mark.
In brief, gold has been undergoing a downside correction, eyeing the ascending 200-day SMA around the 1,900 territory. Hence, the future of bullion lies on whether this important threshold will hold as a break below it could trigger a massive decline.