

Sample Category Title
Technical Outlook and Review
DXY:
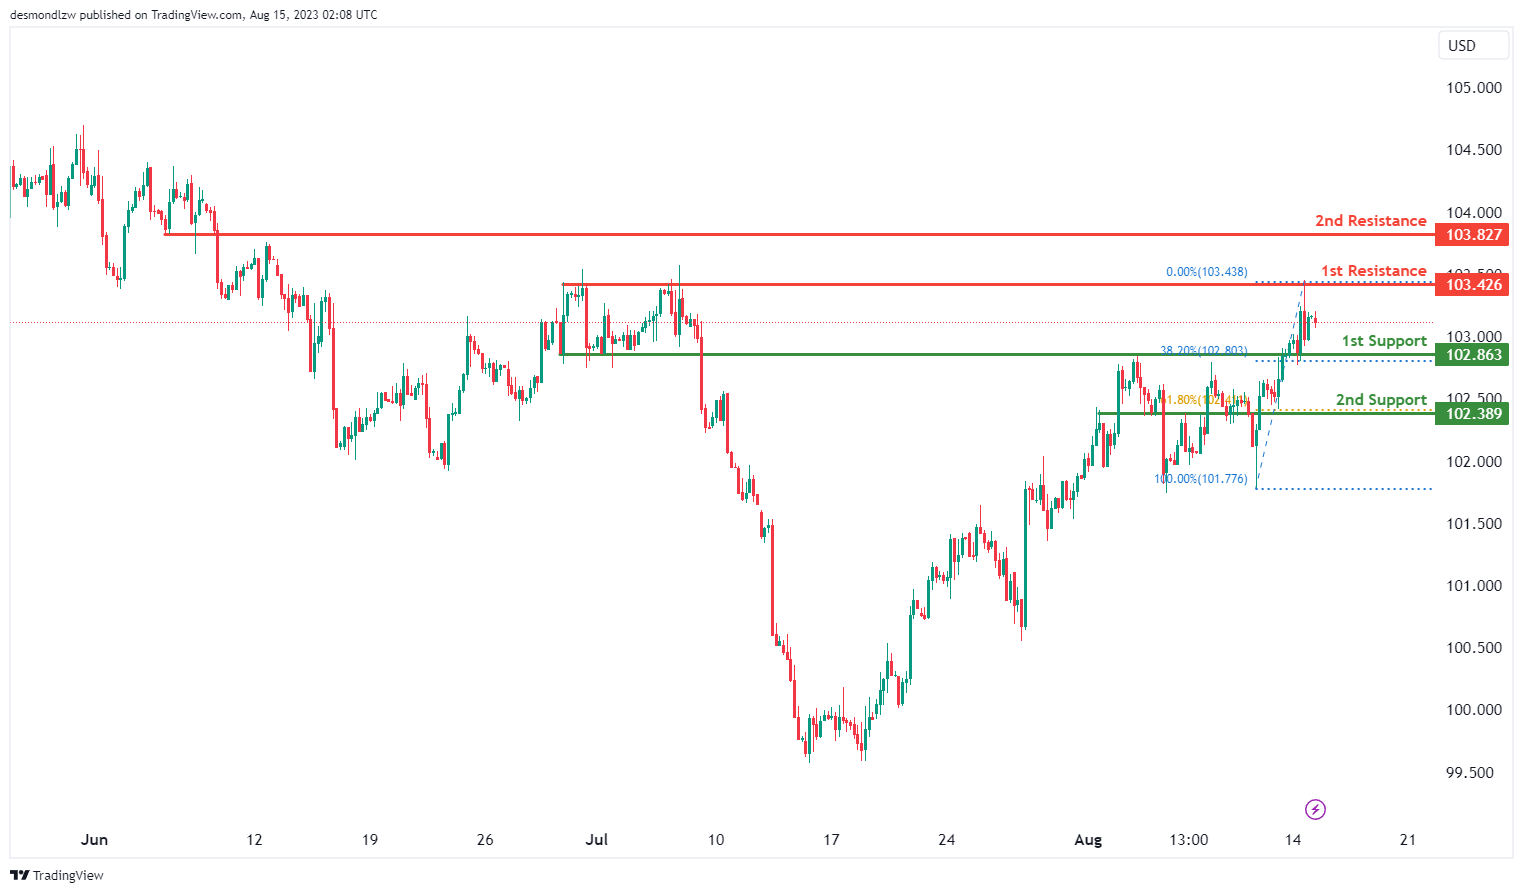
The DXY chart is currently showing a neutral momentum, suggesting a lack of clear direction. The price is expected to fluctuate between the 1st support and 1st resistance levels.
The 1st support level at 102.86 is important as it is an overlap support and also aligns with a 38.20% Fibonacci Retracement. Similarly, the 2nd support at 102.38 is significant as it is an overlap support and is also associated with a 61.80% Fibonacci Retracement.
On the upside, the 1st resistance at 103.42 is identified as a multi-swing high resistance. There is also a 2nd resistance level at 103.82, which is categorized as a pullback resistance.
EUR/USD:
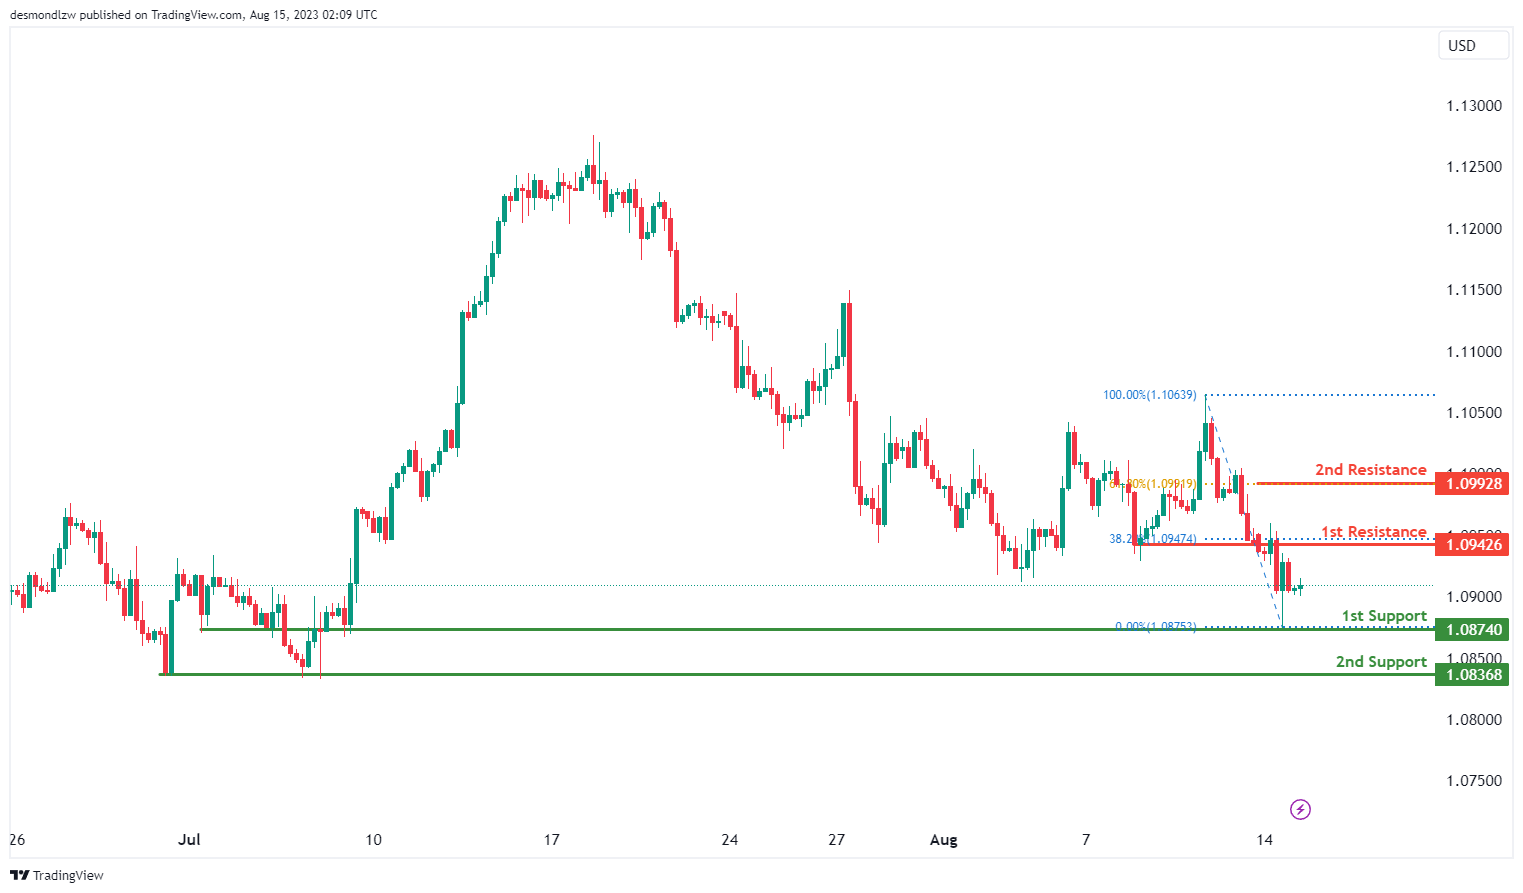
The EUR/USD chart is currently displaying a bullish momentum, indicating a prevalent upward trend. Within this context, there is potential for the price to continue its bullish movement towards the 1st resistance level.
The 1st support at 1.0874 is significant due to its alignment with a 38.20% Fibonacci retracement, reinforcing its role as a potential support level. Additionally, a 2nd support at 1.0836 is identified as a multi-swing low support.
On the other hand, the 1st resistance level at 1.0942 gains importance as it is an overlap resistance, while the 2nd resistance at 1.0992 aligns with a 61.80% Fibonacci retracement, further emphasizing its potential significance in controlling any upward movement.
EUR/JPY:
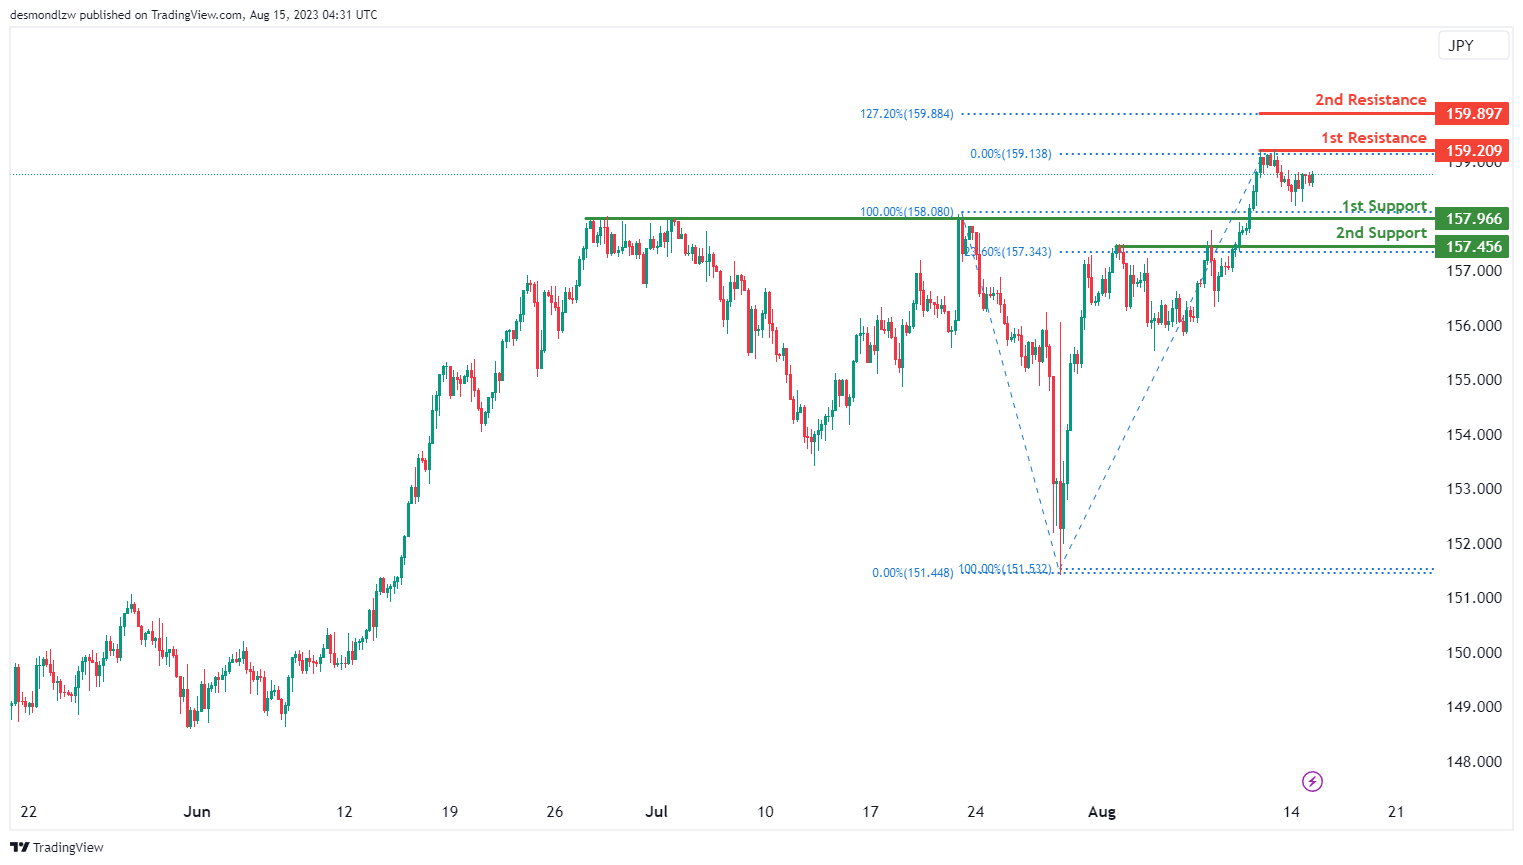
The current analysis of the EUR/JPY chart indicates a bullish momentum, suggesting a prevailing upward trend. Given this momentum, there is a possibility for the price to continue its bullish movement towards the 1st resistance level at 159.20.
The 1st support at 157.96 is significant as it serves as a pullback support. Another level of support is found at 157.32, which is further strengthened by the presence of a 23.60% Fibonacci Retracement.
Conversely, the 1st resistance level at 159.20 is considered a significant level due to its status as a swing high resistance. There is also a 2nd resistance at 159.89, which is noteworthy as it aligns with the 127.20% Fibonacci Extension level.
EUR/GBP:
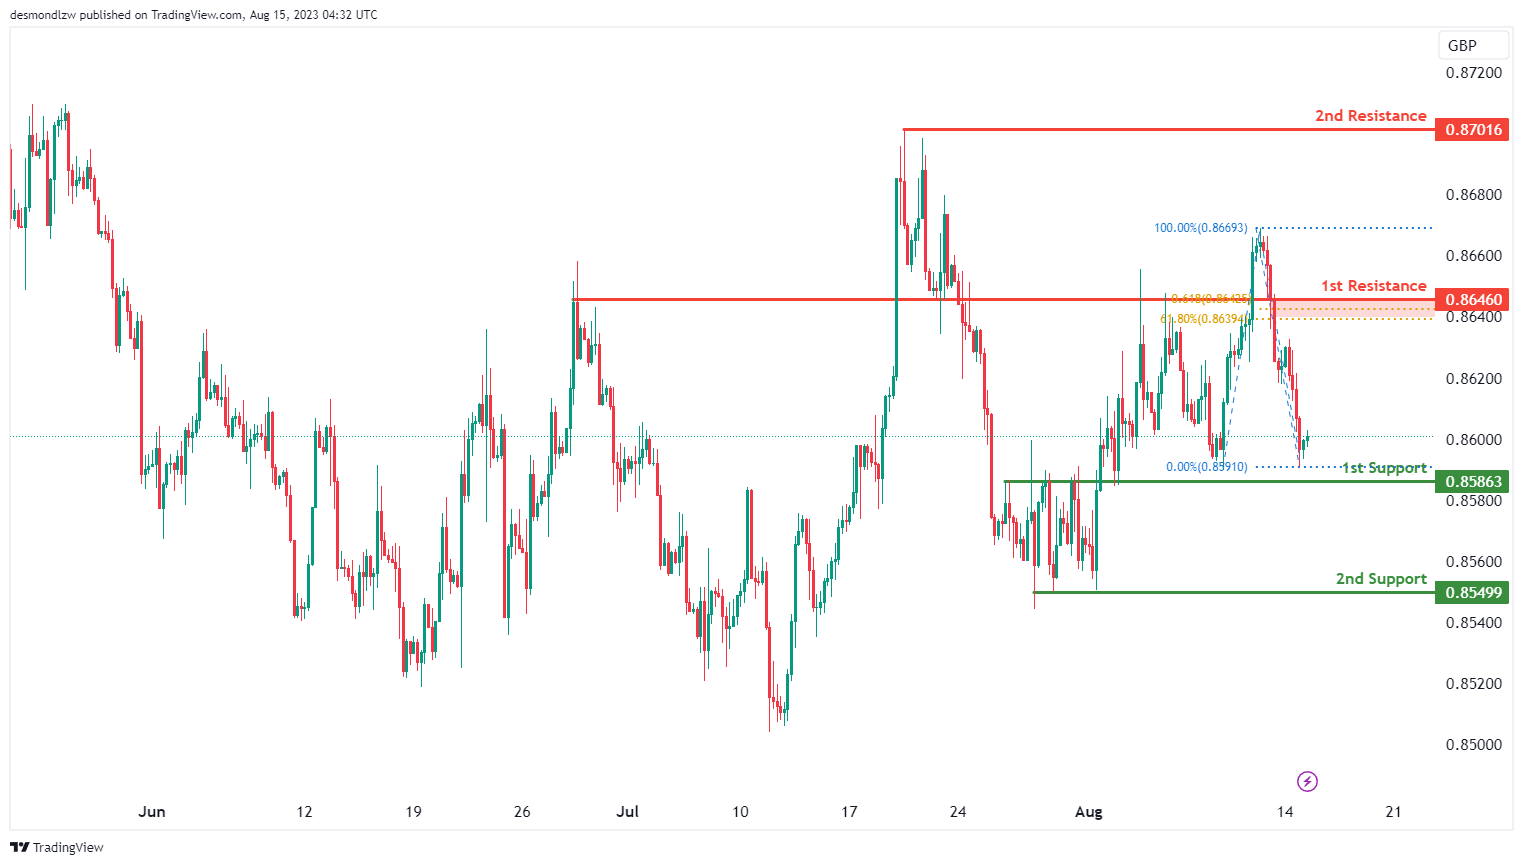
The current analysis of the EUR/GBP chart suggests a bearish momentum, indicating a downward trend. In light of this momentum, there is a potential for the price to bounce off the 1st support and move towards the 1st resistance level.
The 1st support at 0.8586 is considered a strong support level as it also acts as a pullback support. Additionally, the 2nd support at 0.8549 provides further reinforcement due to its identification as a multi-swing low support.
On the other hand, the 1st resistance level at 0.8662 holds significance as an overlap resistance, and its importance is further accentuated by the presence of a 61.80% Fibonacci Retracement and a 61.80% Fibonacci Projection, indicating a confluence of technical factors.
There is also a 2nd resistance at 0.8701, which is noted as a swing high resistance.
GBP/USD:
The GBP/USD chart currently indicates a neutral momentum, suggesting a lack of clear direction in the market.
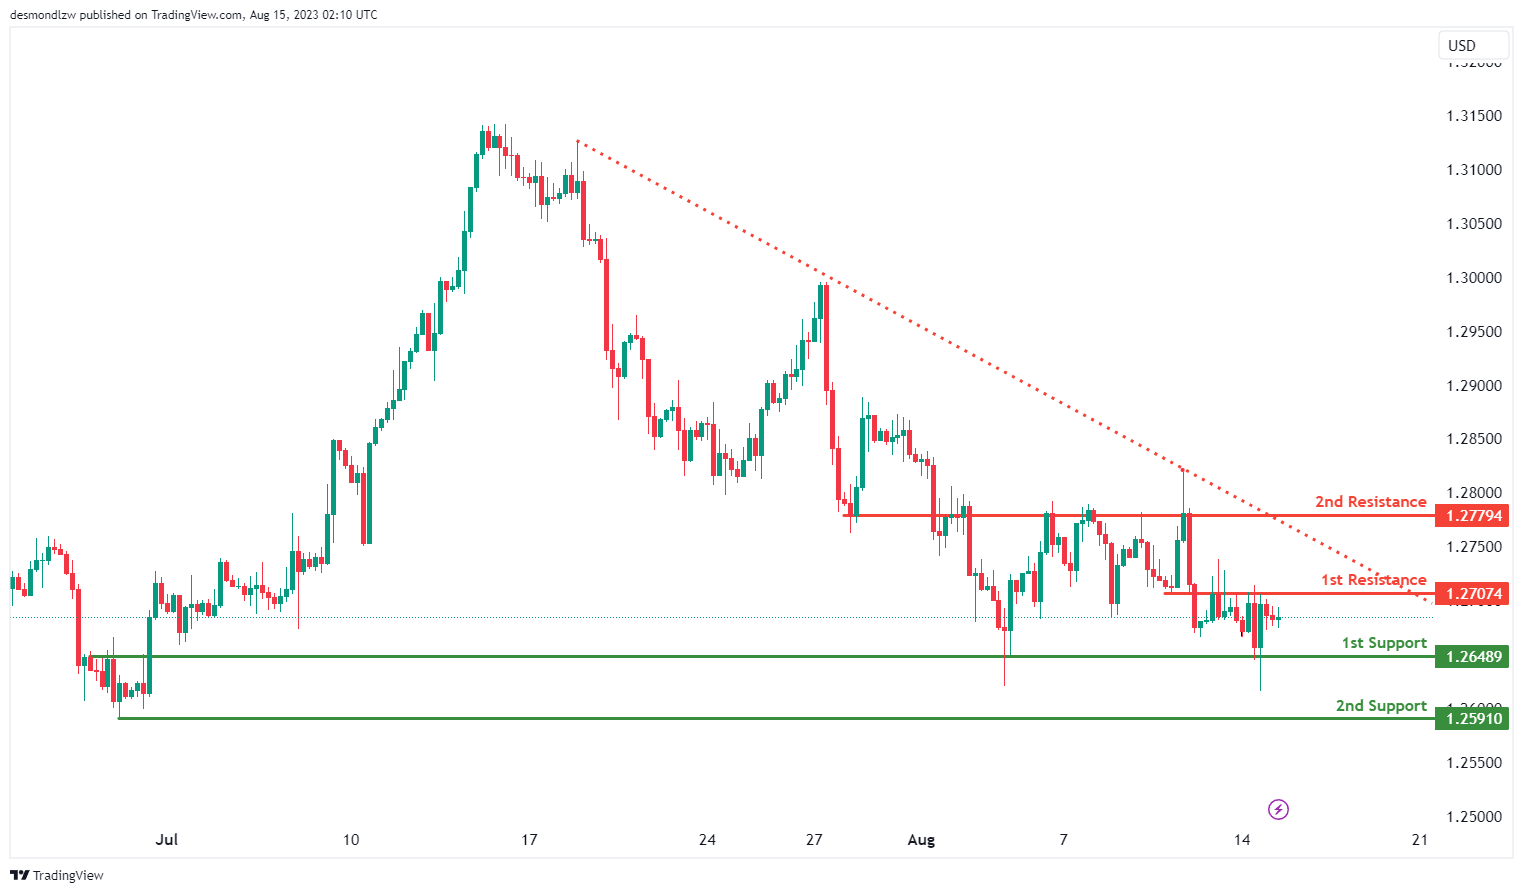
In this scenario, the price may potentially move within a range between the 1st support level at 1.2648 and the 1st resistance level at 1.2707.
The significance of the 1st support at 1.2648 lies in its classification as an overlap support, while the 2nd support at 1.2591 is identified as a swing low support.
On the other hand, the 1st resistance level at 1.2707 is important as an overlap resistance, and a potential upward movement might be hindered by the 2nd resistance at 1.2779.
GBP/JPY:
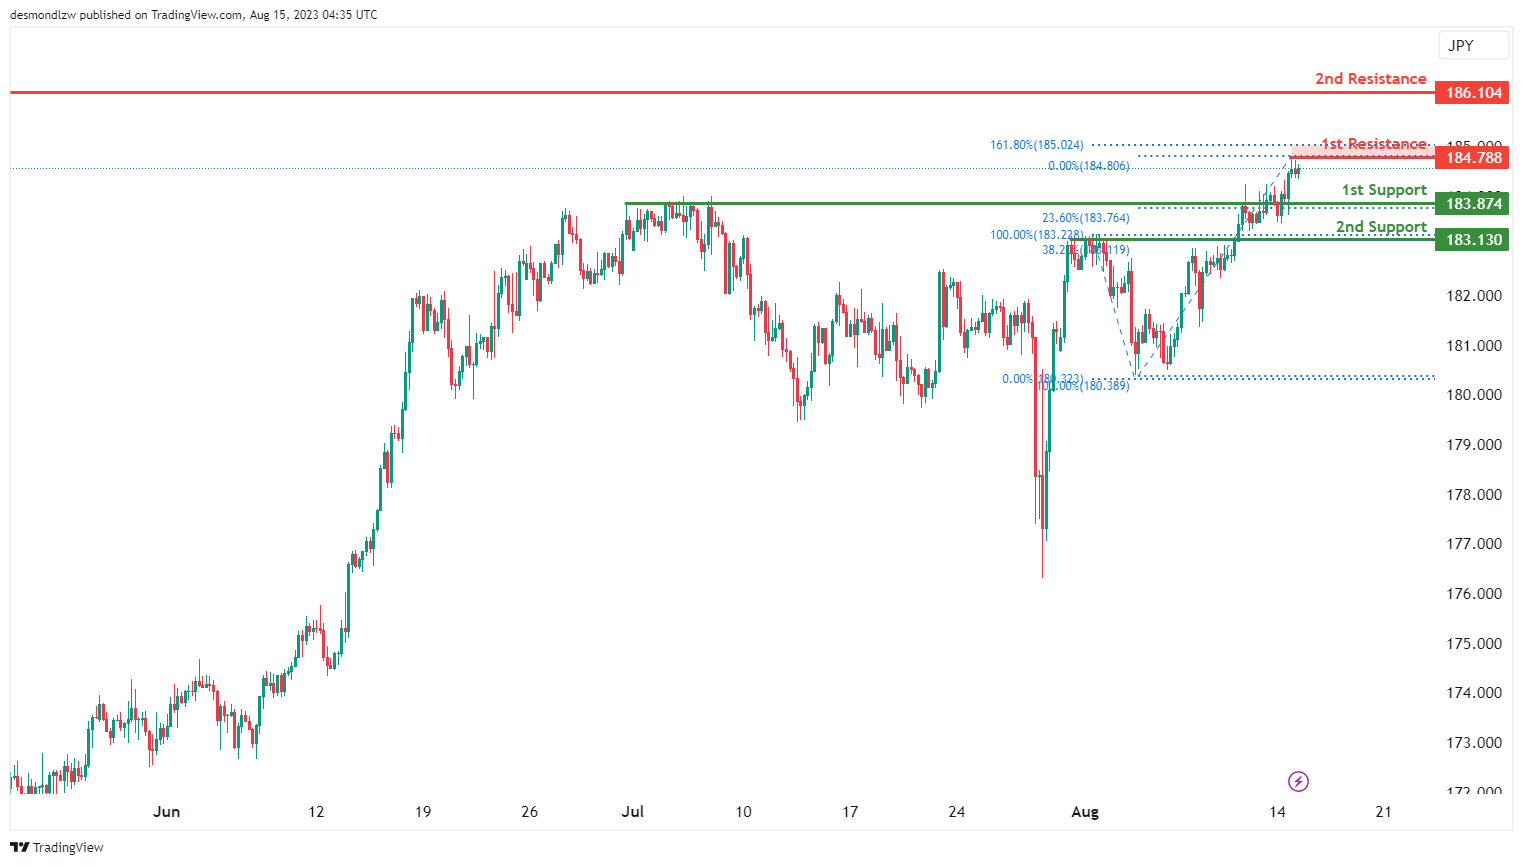
The GBP/JPY chart is currently showing a bullish momentum, indicating a potential upward trend. Given this positive momentum, there is a chance that the price will continue to rise towards the 1st resistance level.
The 1st support level at 183.87 is significant as it is an overlap support and is also aligned with a 23.60% Fibonacci Retracement. Additionally, the 2nd support at 183.13 is reinforced by a 38.20% Fibonacci Retracement.
On the other hand, the 1st resistance at 184.78 is noteworthy due to its association with a swing high resistance. The 2nd resistance at 186.10 also acts as a swing high resistance, which further strengthens its potential to impede upward movement.
USD/CHF:
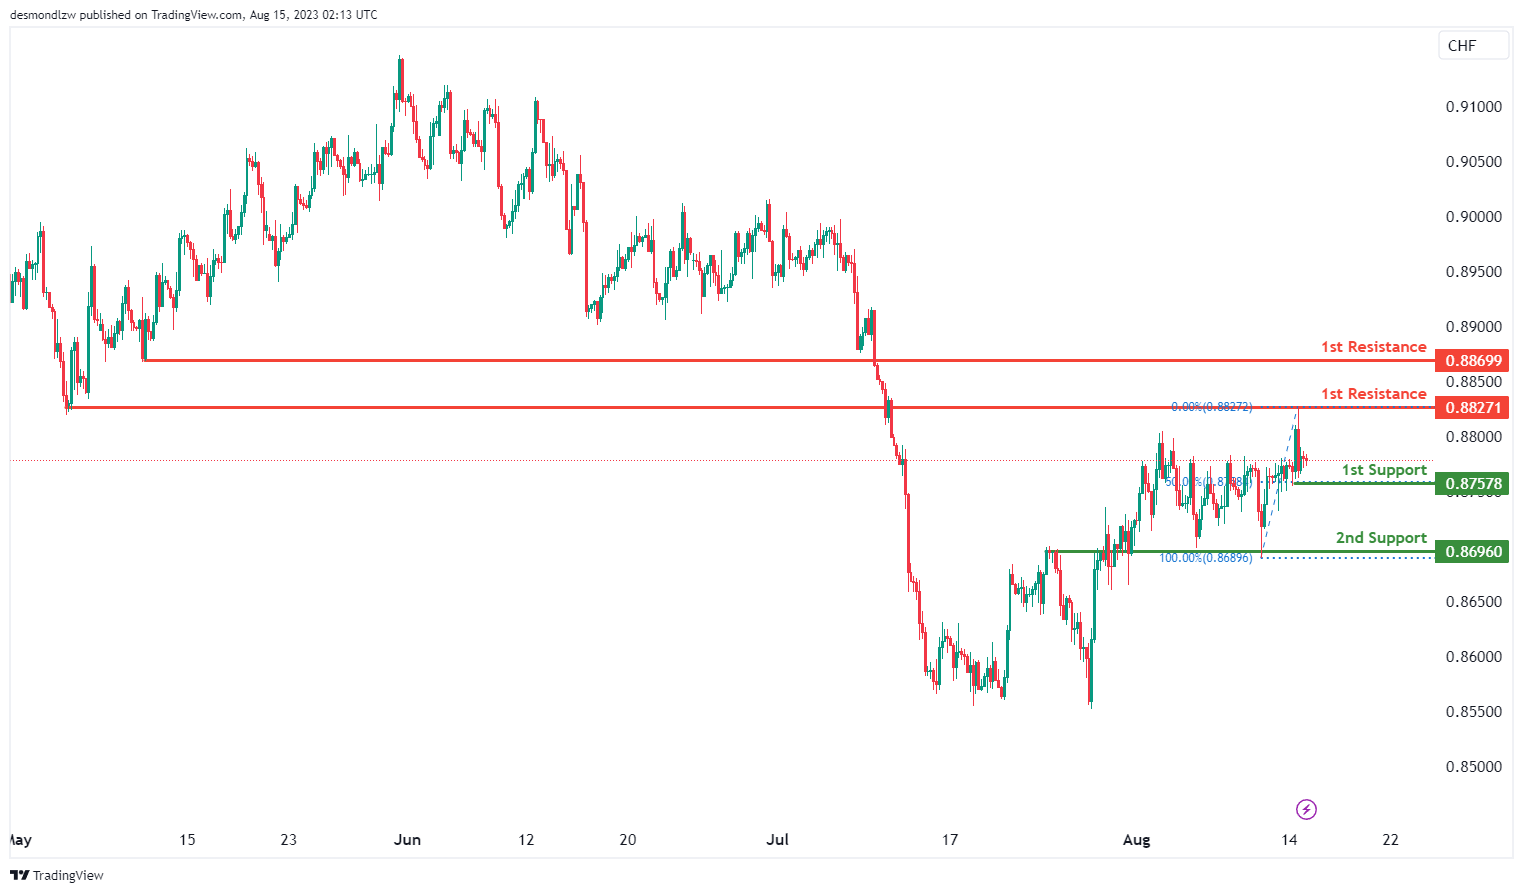
The USD/CHF chart currently shows a bearish momentum, indicating a prevailing downward trend.
Given this bearish momentum, there is a possibility that the price may continue to move lower towards the 1st support level.
The 1st support at 0.8757 is notable as it aligns with a 50% Fibonacci Retracement level. Additionally, the 2nd support at 0.8696 is identified as an overlap support.
On the flip side, the 1st resistance level at 0.8827 holds significance as an overlap resistance. Another resistance level at 0.8869 is identified as a pullback resistance, adding to its potential to prevent upward movement.
USD/JPY:
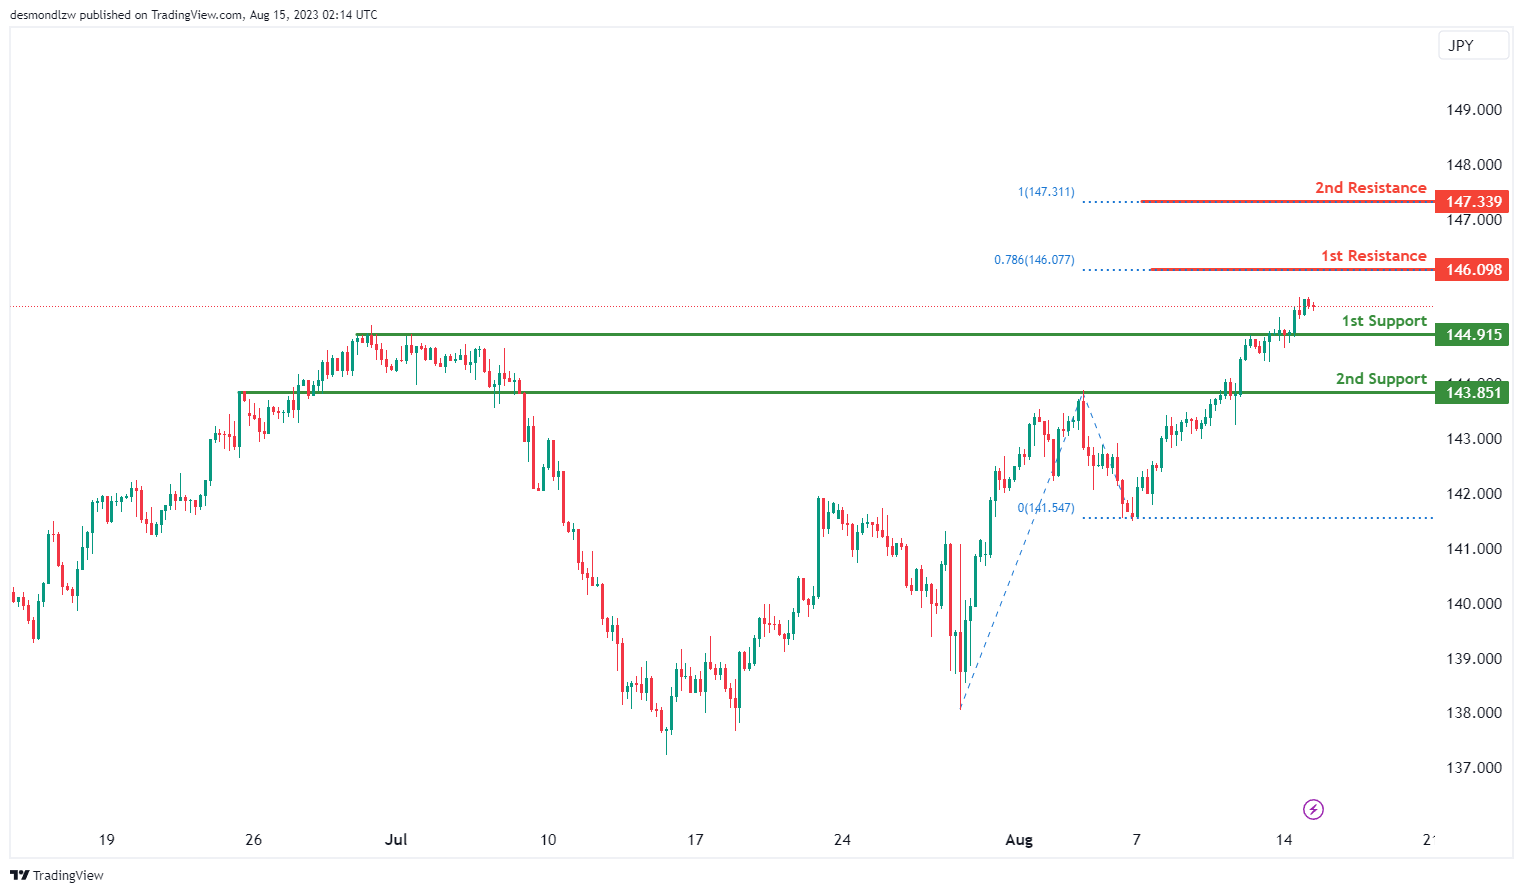
The USD/JPY chart indicates a bullish momentum, suggesting a potential upward trend.
Given this momentum, there is a possibility for the price to continue rising towards the 1st resistance level.
The 1st support at 144.91 is significant as it acts as a pullback support. Similarly, the 2nd support at 143.85 is also a pullback support.
On the other hand, the 1st resistance level at 146.09 is noteworthy as it aligns with a 78.60% Fibonacci Projection. Additionally, there is a 2nd resistance at 147.33, which is associated with a 100% Fibonacci Projection, enhancing its potential to resist upward movement.
USD/CAD:
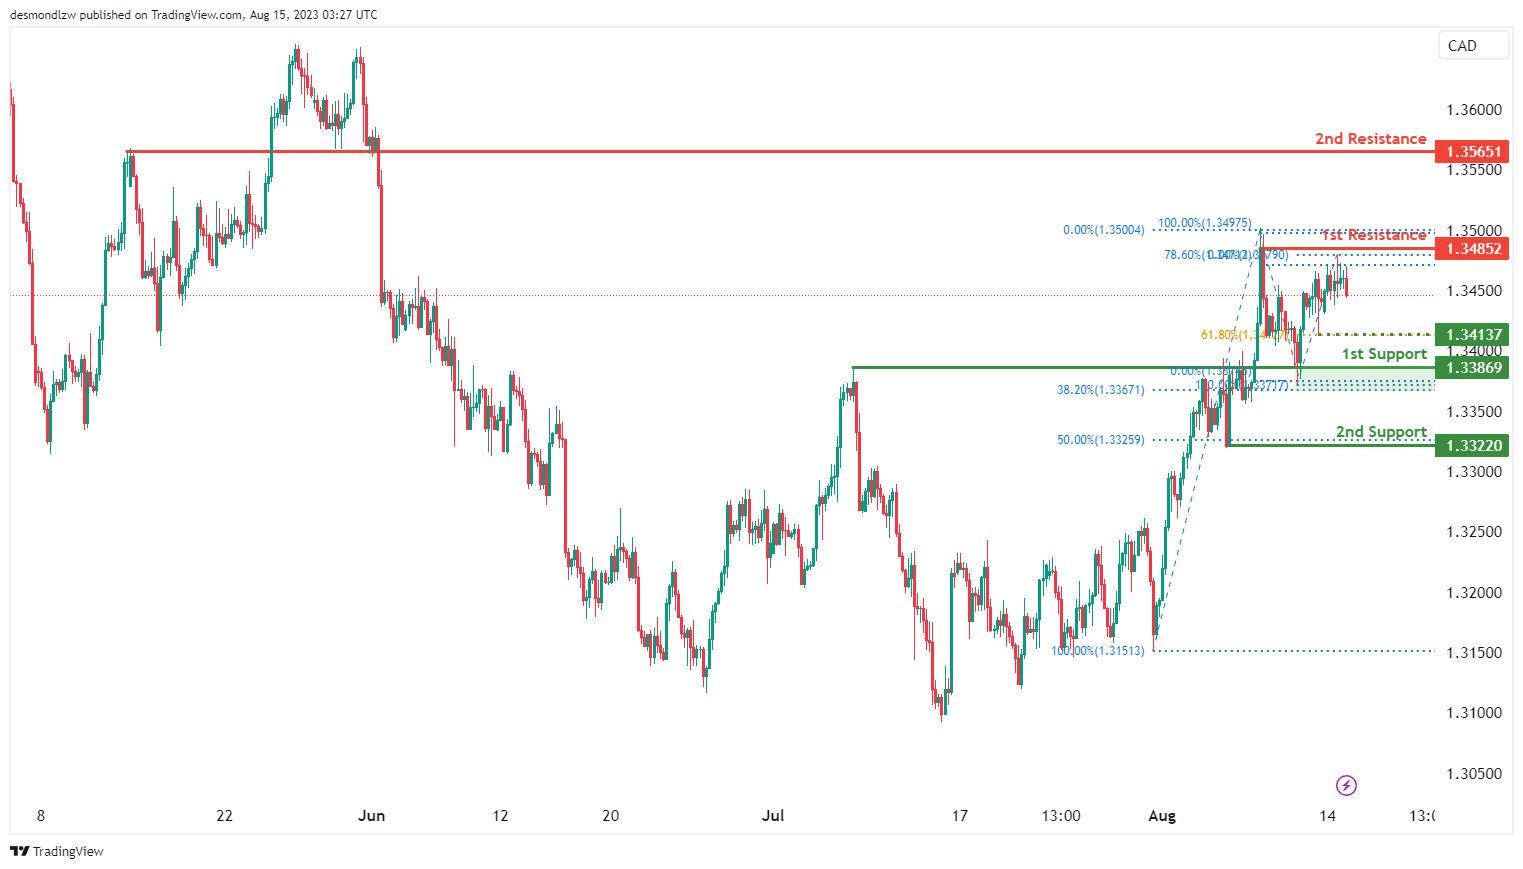
The current chart analysis of USD/CAD suggests a bearish momentum, indicating a downward trend. This trend may lead to a potential continuation towards the 1st support level should the intermediate support at 1.3414, which corresponds to the 61.80% Fibonacci retracement level, be broken.
The 1st support level at 1.3387 is supported by an overlap support that aligns close to the 38.20% Fibonacci retracement level. Additionally, the 2nd support at 1.3322 holds significance as a pullback support that is aligned with the 50.00% Fibonacci retracement level.
To the upside, the 1st resistance at 1.3485 is an important level as it coincides with a swing high resistance and the 78.60% Fibonacci retracement level. Furthermore, there is a 2nd resistance at 1.3565, which acts as an overlap resistance, that adds to the potential resistance zone.
AUD/USD:
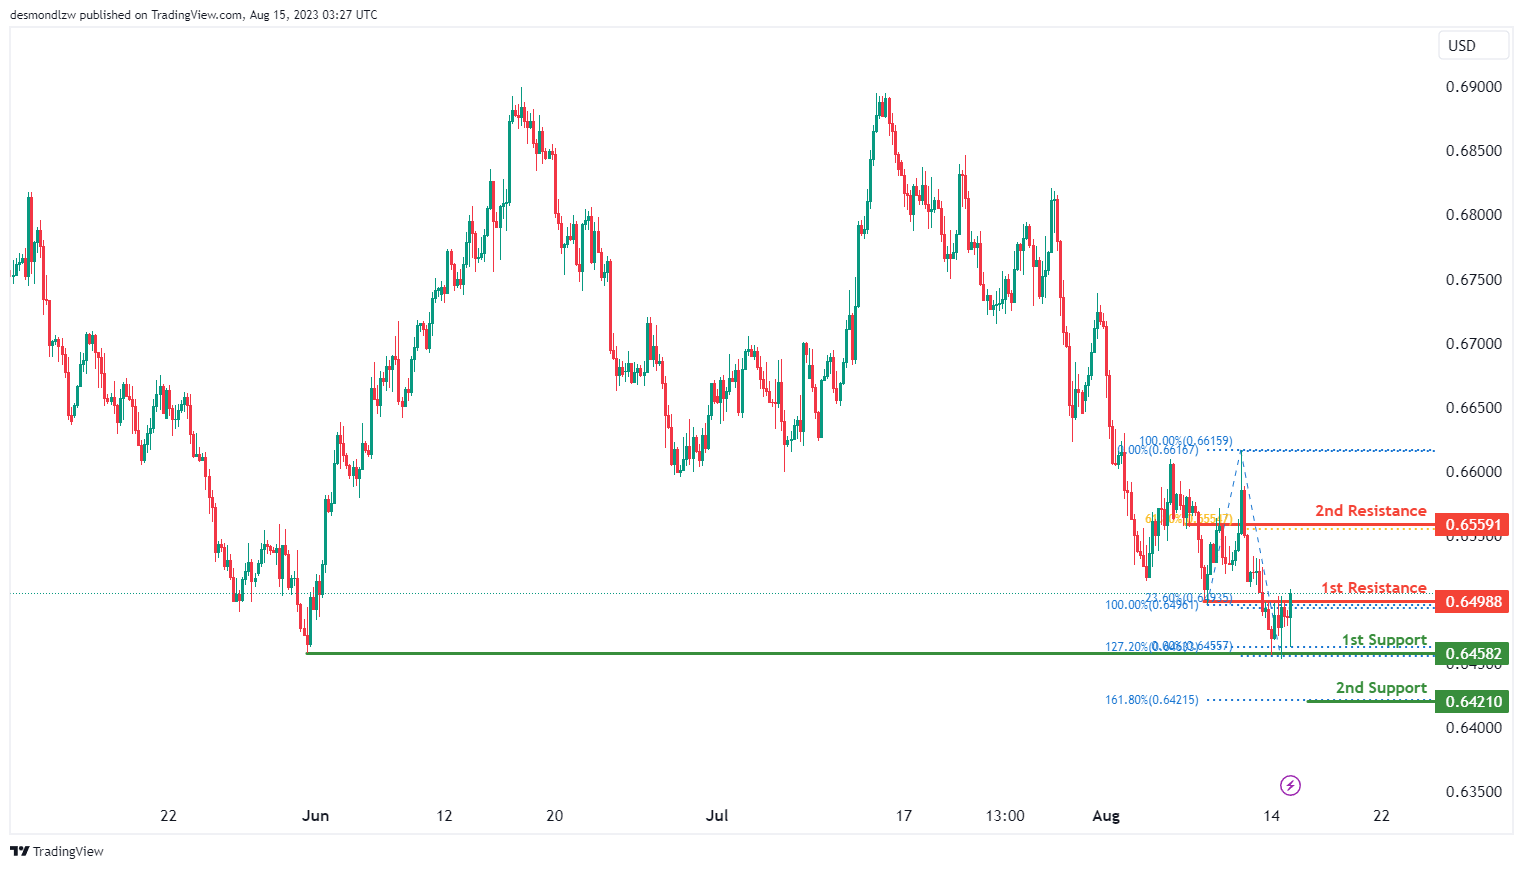
The current analysis of the AUD/USD chart indicates a bullish momentum, suggesting a potential upward trend. This momentum could lead to a bullish breakout above the 1st resistance level at 0.6499 and a potential move towards the 2nd resistance at 0.6559.
The 1st resistance at 0.6499 is significant due to its alignment with an overlap resistance and the 23.60% Fibonacci retracement level. Additionally, the 2nd resistance at 0.6559 holds importance as an overlap resistance that aligns with the 61.80% Fibonacci retracement level.
To the downside, the 1st support at 0.6458 is supported by an overlap support that aligns with the 127.20% Fibonacci extension level, while the 2nd support at 0.6421 is reinforced by a support level that aligns with the 161.80% Fibonacci extension level.
NZD/USD
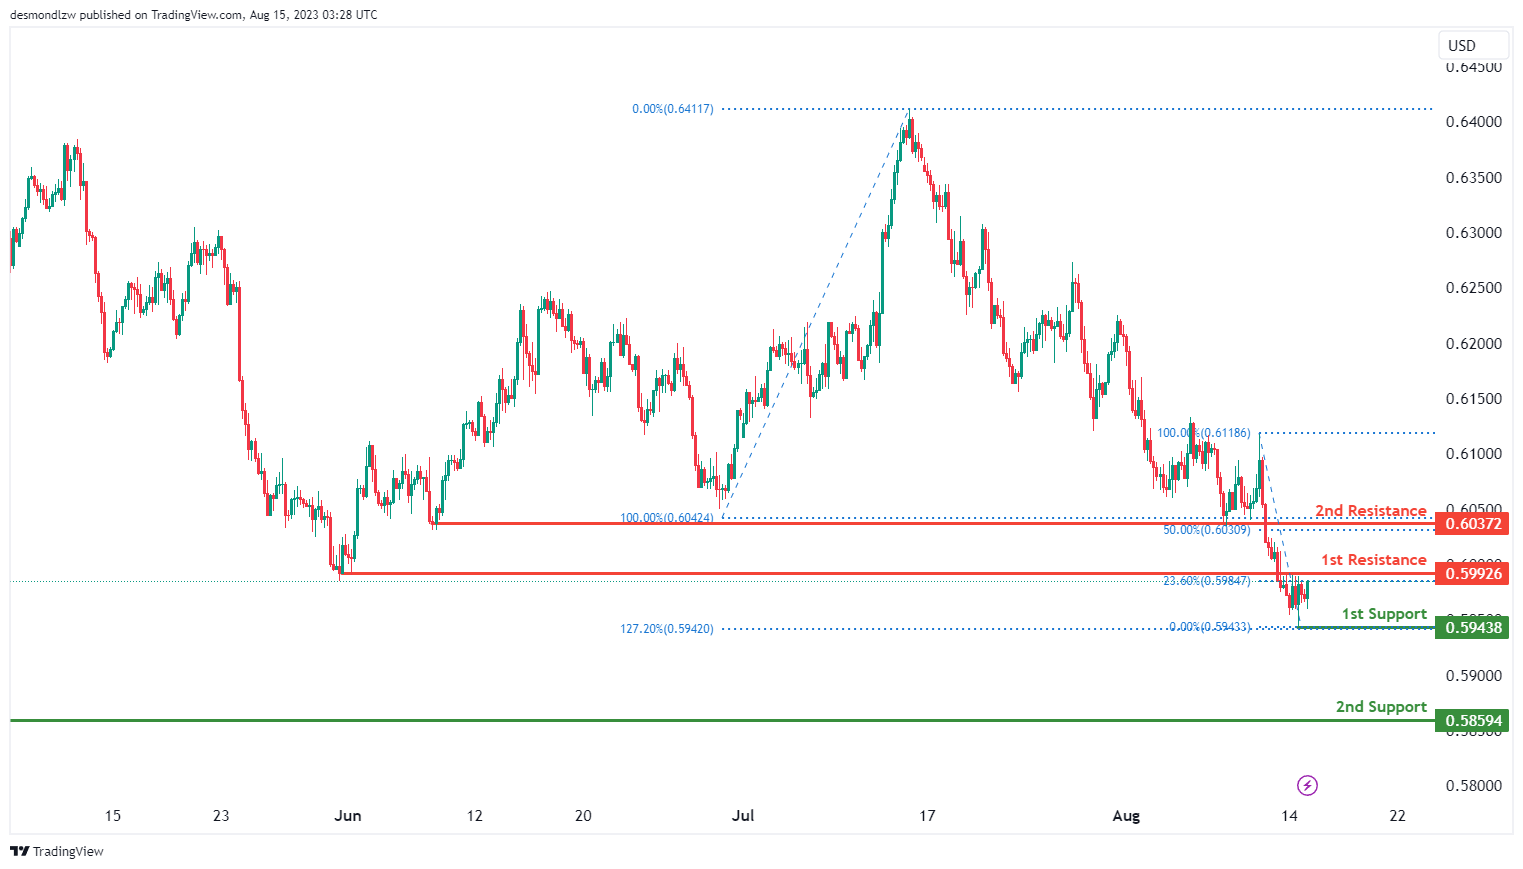
The current trend on the NZD/USD chart is exhibiting a bullish momentum, suggesting the possibility of further upward movement towards the 1st resistance.
The 1st resistance level at 0.5993.is identified as an overlap resistance that aligns with the 23.60% Fibonacci retracement level. The 2nd resistance at 0.6037 is also identified as an overlap resistance that aligns with the 50.00% Fibonacci retracement level.
To the downside, the 1st support at 0.5944 is a swing-low support that aligns with the 127.20% Fibonacci extension level while the 2nd support at 0.5859 is also identified as a swing-low support.
DJ30:
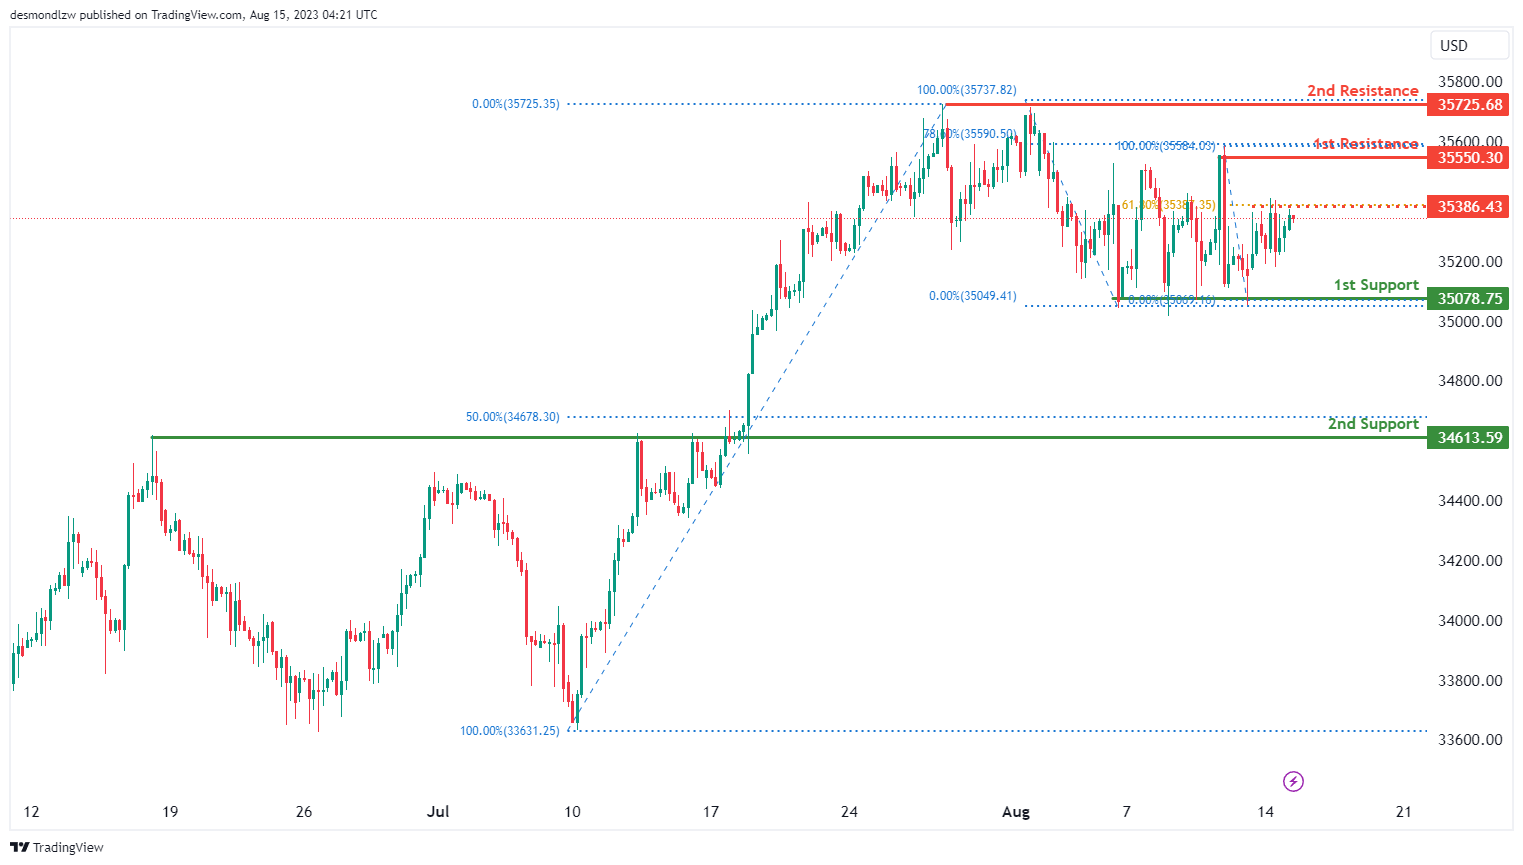
The current analysis of the DJ30 chart indicates a bullish momentum, reflecting an ongoing upward trend. Given this bullish outlook, there is a possibility for the price to continue its upward movement towards the 1st resistance level at 35550.30.
The 1st support level at 35078.75 is significant as it represents a multi-swing low support. Additionally, the 2nd support at 34613.59 reinforces the supportive structure.
On the contrary, the 1st resistance at 35550.30 holds significance as a swing high resistance, which could impede further upward movement.
Furthermore, the existence of a 2nd resistance at 35725.68, characterized as a multi-swing high resistance, further supports the potential for resistance against upward price movement. An intermediate resistance at 35386.43, coupled with a 61.80% Fibonacci retracement, further enhances the potential for resistance at this level.
GER30:
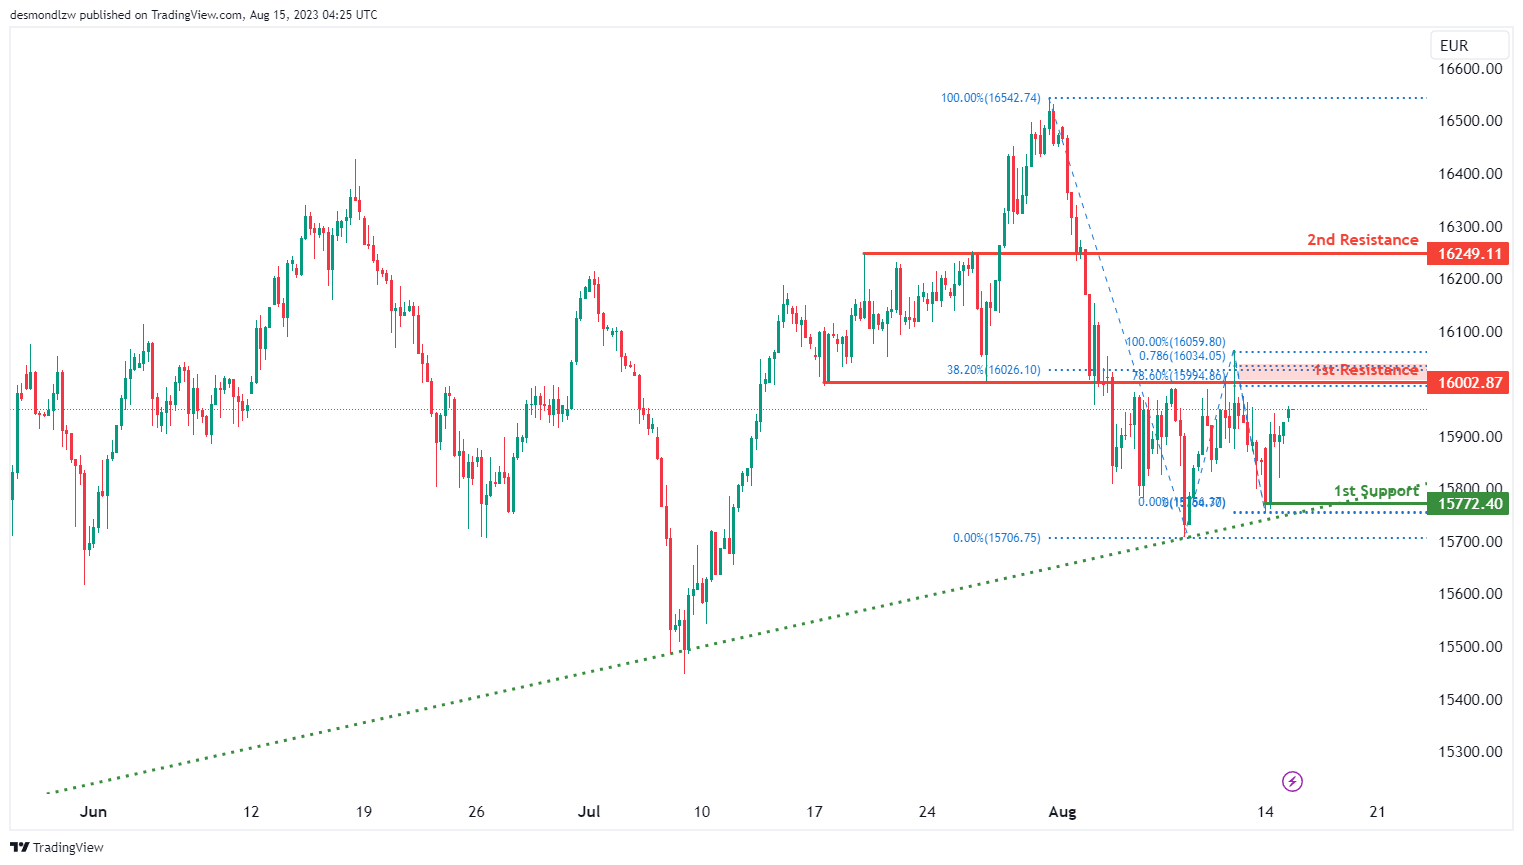
The current chart analysis for GER30 indicates a bullish momentum, suggesting a prevailing upward trend. With this positive momentum, there is a potential for the price to continue its bullish movement towards the 1st resistance level at 16002.87.
The 1st support level at 15772.40 is significant as it is a swing low support. Additionally, the 2nd support at 15643.90 serves as a reinforcement for the support structure.
On the other hand, the 1st resistance level at 16002.87 is important as it acts as a pullback resistance and aligns with both the 38.20% and 78.60% Fibonacci retracement levels, indicating potential resistance.
Moreover, there is a 2nd resistance at 16249.11 which also serves as an overlap resistance, further emphasizing its potential impact on price movement.
US500
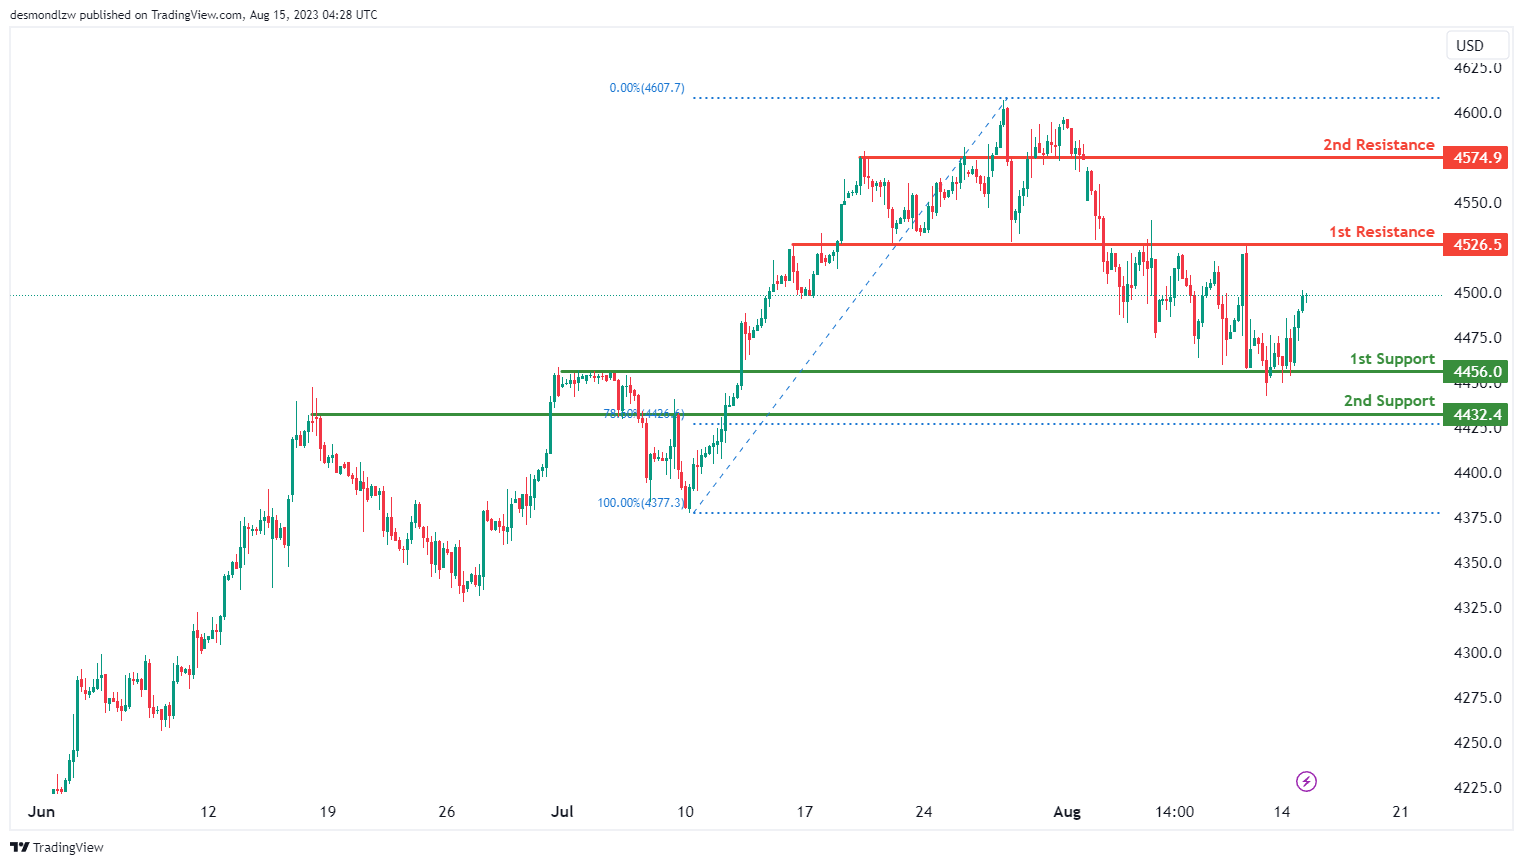
The current analysis of the US500 chart suggests a bullish momentum, indicating a prevailing upward trend. With this momentum, there is a potential for the price to continue moving upwards towards the 1st resistance level at 4526.5.
The 1st support level at 4456.0 is considered strong due to its alignment with a pullback support and a 78.60% Fibonacci retracement. Additionally, the 2nd support at 4432.4 provides further reinforcement to the support structure.
On the flip side, the 1st resistance level at 4526.5 is important as it acts as an overlap resistance. Moreover, there is a 2nd resistance at 4574.9, which is also identified as an overlap resistance, adding to its potential to resist further upward movement.
BTC/USD:
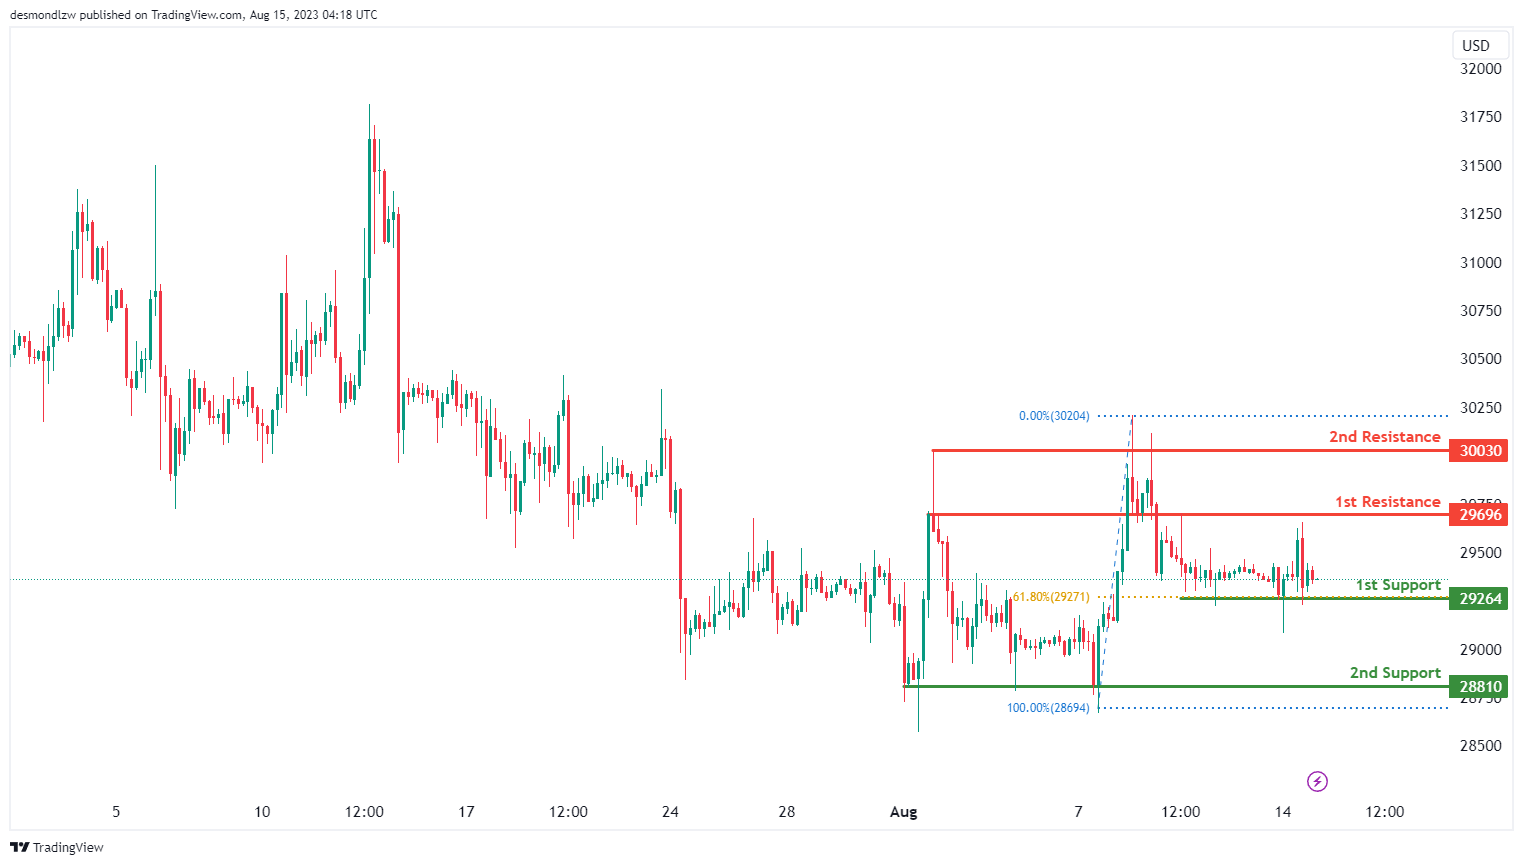
The current chart analysis of BTC/USD suggests a bullish trend, indicating an upward movement.
Given this bullish sentiment, there’s a possibility for the price to rebound from the 1st support level and continue its upward trajectory towards the 1st resistance at 29696.
The 1st support at 29264 gains significance due to its role as a pullback support, supported by a 61.80% Fibonacci Retracement. Additionally, a secondary support at 28810 enhances the support structure, identified as a multi-swing low support.
Conversely, the 1st resistance level at 29696 becomes notable as it is an overlap resistance. Furthermore, a 2nd resistance at 30030 is characterized as a multi-swing high resistance, contributing to its potential impact on the price movement.
ETH/USD:
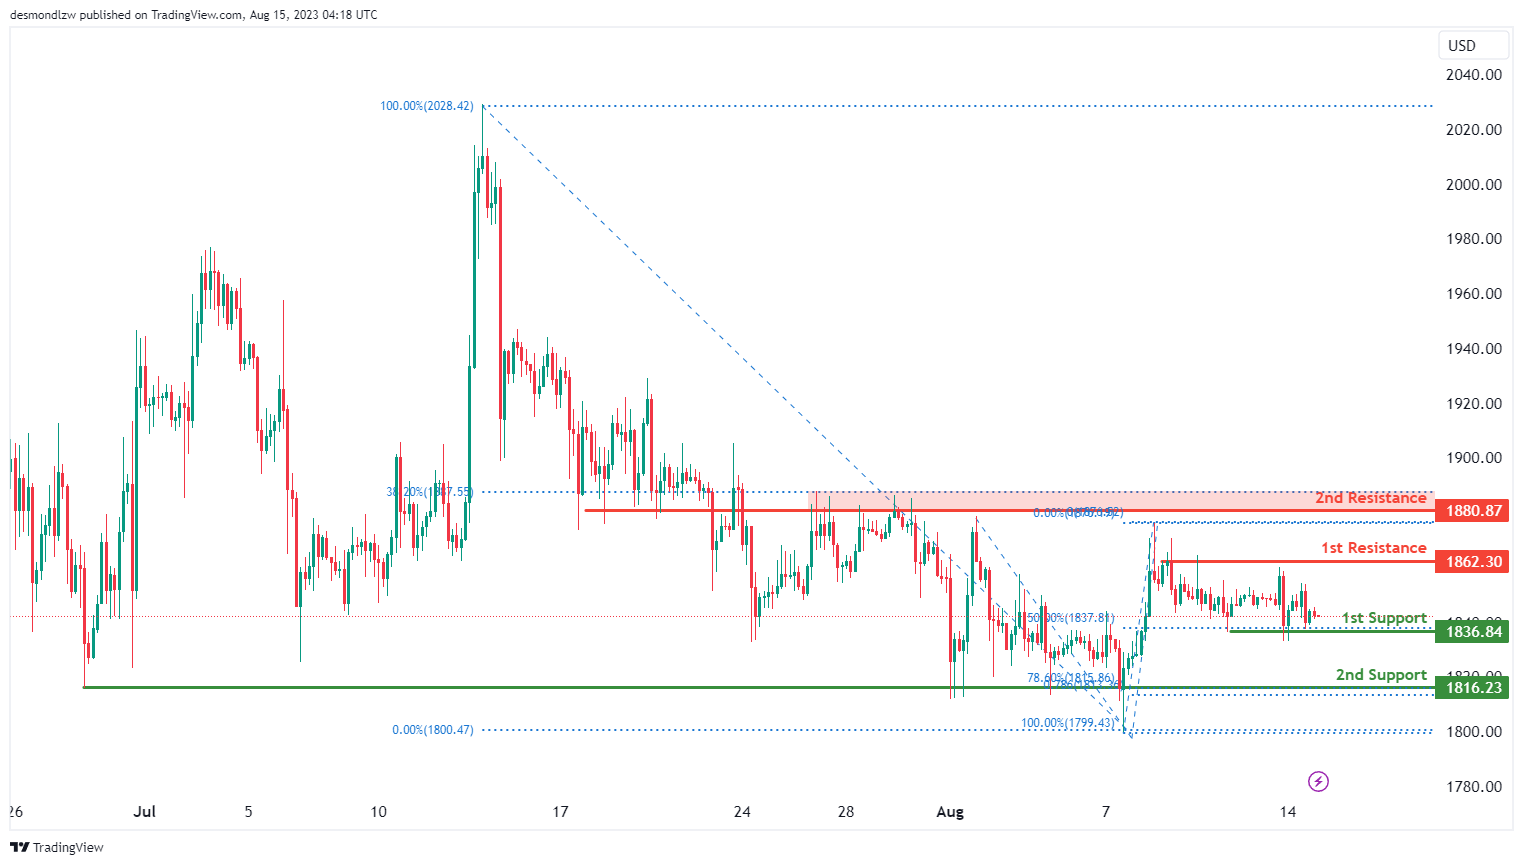
The current analysis of the ETH/USD chart shows a bullish momentum, indicating a prevailing upward trend.
Given this momentum, there is a potential scenario where the price could rebound from the 1st support level and move towards the 1st resistance at 1862.30.
The 1st support at 1836.84 gains importance as it serves as a pullback support, in addition to aligning with a 50% Fibonacci Retracement. Another layer of support is observed at 1816.23, identified as an overlap support.
On the flip side, the 1st resistance level at 1862.30 is significant due to its role as a multi-swing high resistance. Furthermore, a 2nd resistance at 1880.87 is identified as an overlap resistance, strengthening its potential to influence price movement.
WTI/USD:
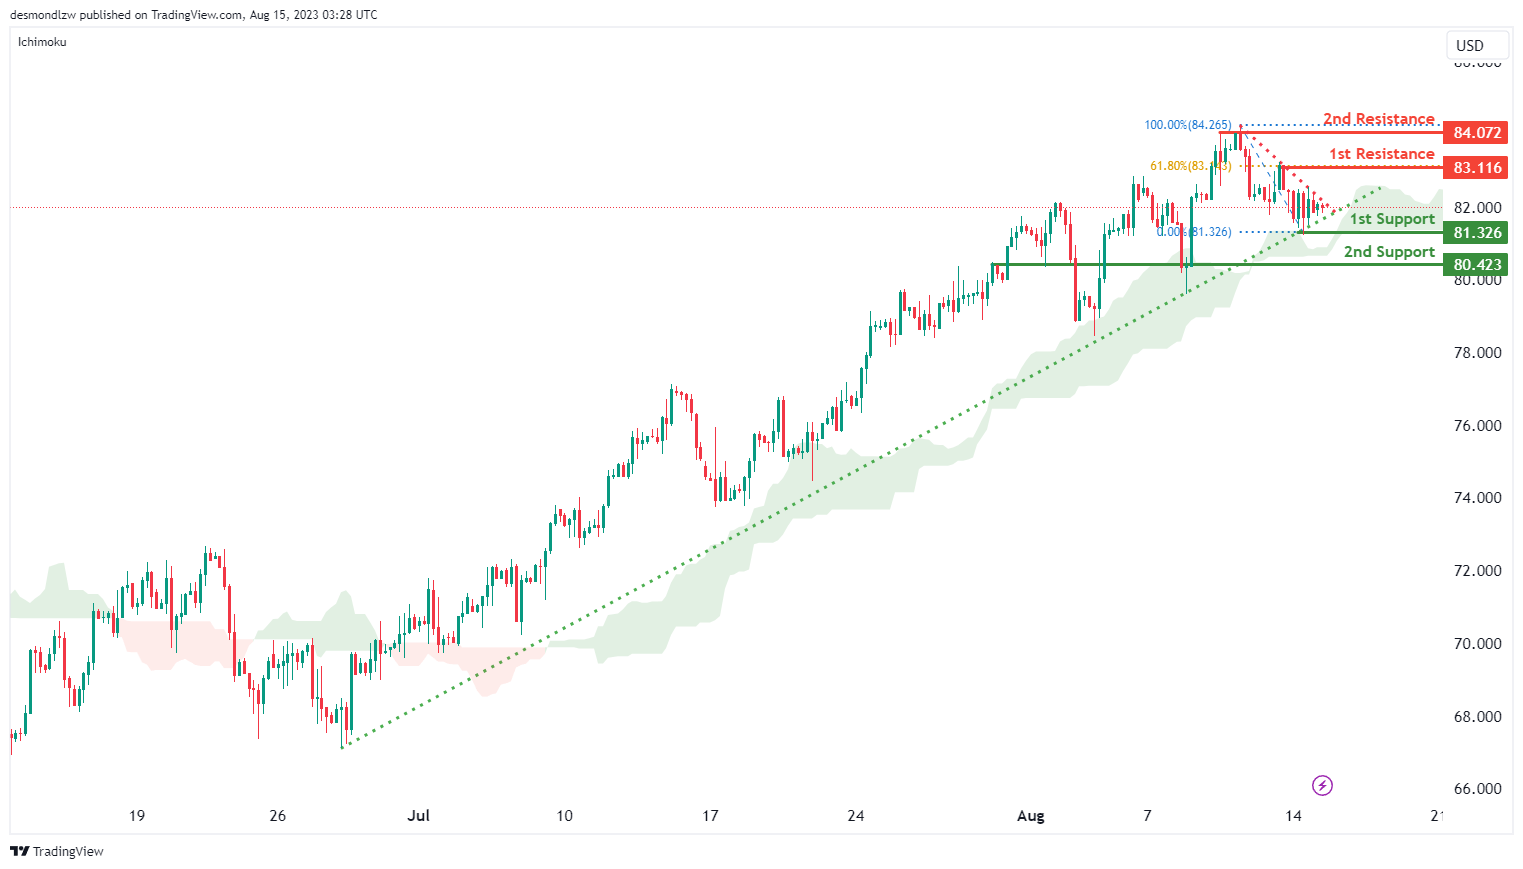
The current momentum of the WTI/USD chart is showing a weak bullish trend with low confidence. This suggests that the price is likely to continue moving higher, supported by the presence of a major ascending trend line and being above the bullish Ichimoku cloud.
There is a potential for the price to continue its bullish movement towards the 1st resistance level at 83.12 that is identified as a pullback resistance that aligns with the 61.80% Fibonacci retracement level. In addition, the 2nd resistance at 84.07 is identified as a swing-high resistance.
To the downside, the 1st support level at 81.33 is identified as a swing-low that intersects with the ascending trendline. Additionally, the 2nd support at 80.42 is identified as an overlap support level.
XAU/USD (GOLD):
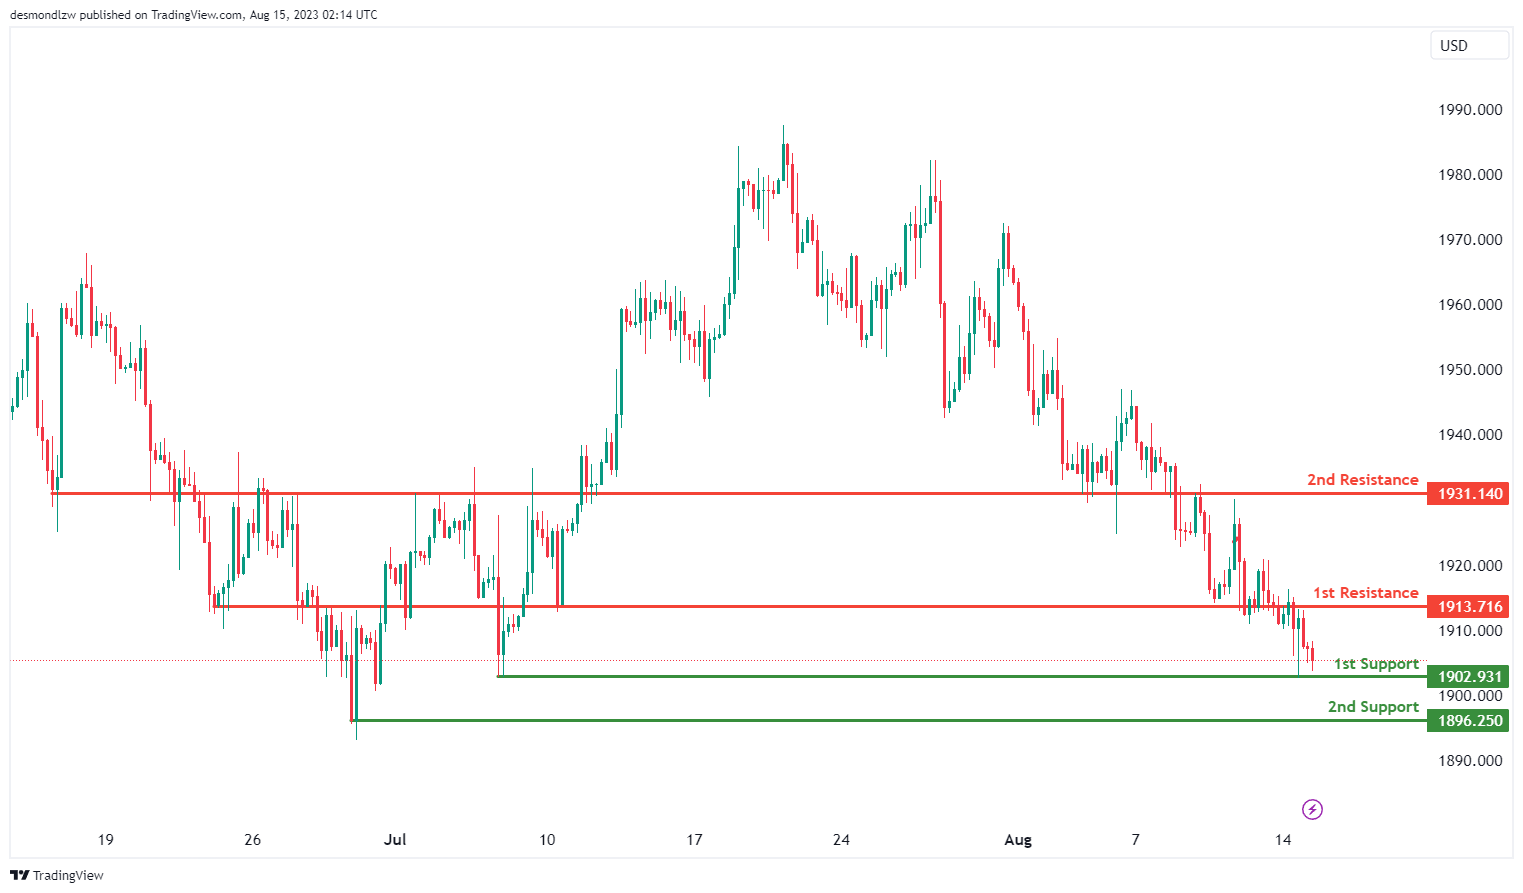
The XAU/USD chart currently exhibits a bullish momentum, indicating a potential upward trend. Given this momentum, the price may continue to rise towards the 1st resistance level at 1913.71. The 1st support at 1902.93 is significant as it is a multi-swing low support, while the 2nd support at 1896.25 serves as a pullback support. On the other hand, the 1st resistance level at 1913.71 is considered an overlap resistance, and there is a 2nd resistance at 1931.14, which further supports potential upward movement.
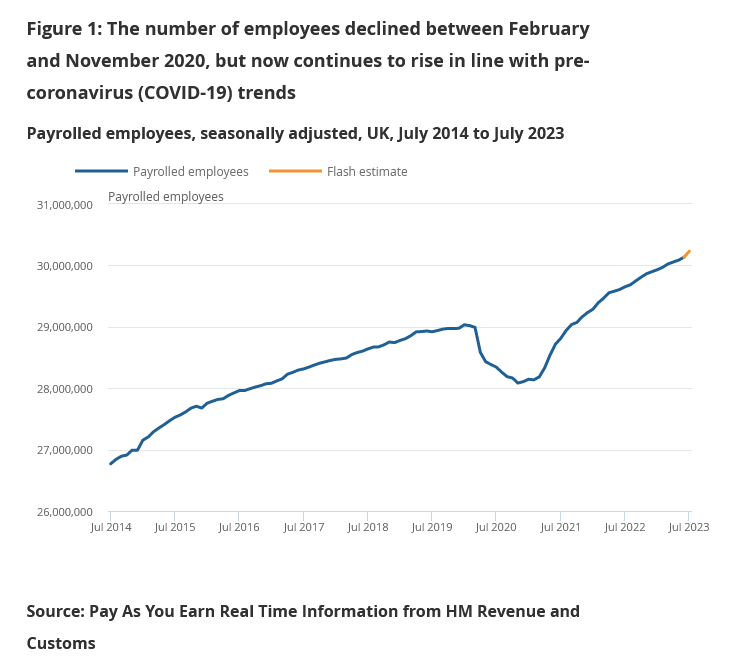
UK payrolled employment rose 97k in Jul, unemployment rate at 4.2% in Jun
UK payrolled employment grew 97k, or 0.3% mom in July. June's figure was revised from -9k decrease to 47k increase. Median monthly pay rose 7.8% yoy compare with July 2022, down from prior month's 9.7% yoy. Claimant count rose 29.0k, above expectation of 19.6k.
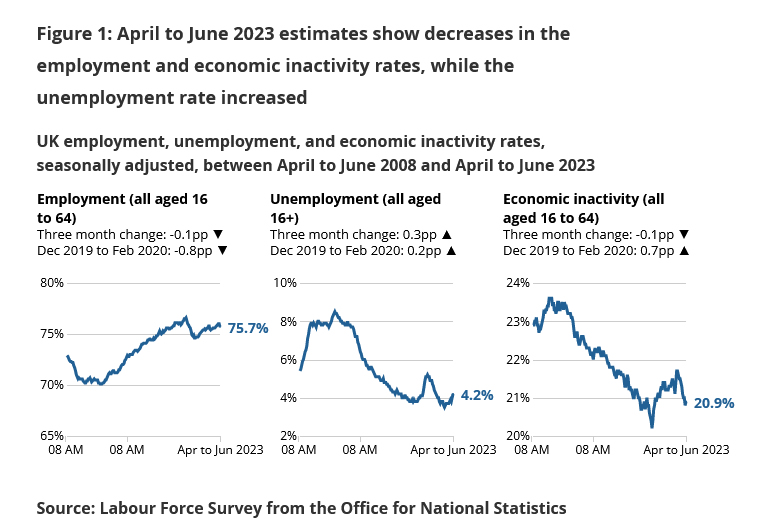
In the three months to June, unemployment rate rose to 4.2%, above expectation of 4.0%. That's 0.3% higher than previous quarter. Employment rate rose 0.1% to 75.7%. Inactivity rate fell -0.1% to 20.9%. Average earnings including bonus rose 8.2% 3moy, above expectation of 7.3%. Average earnings excluding bonus rose 7.8% 3moy, above expectation of 7.4%.
AUD/USD Daily Report
Daily Pivots: (S1) 0.6460; (P) 0.6482; (R1) 0.6509; More...
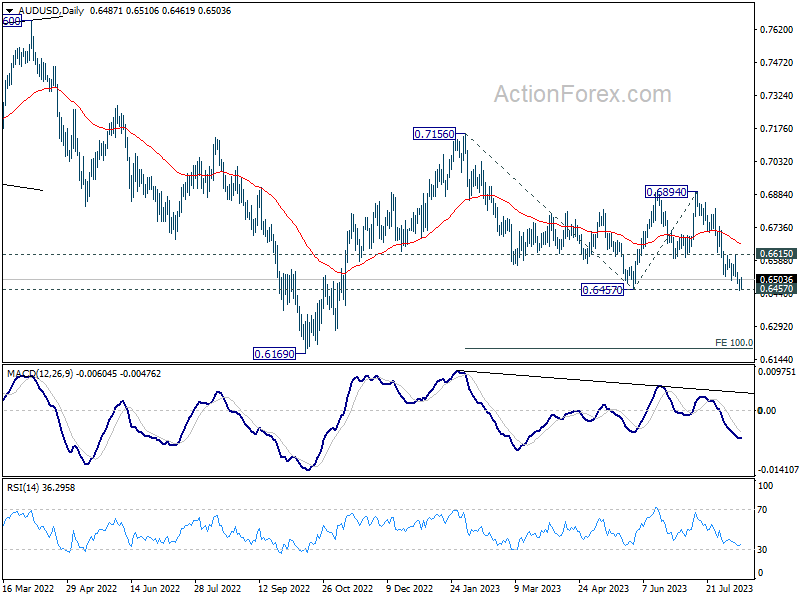
AUD/USD recovered quickly after breaching 0.6457 support briefly. Intraday bias is turned neutral first with 4H MACD crossed above signal line. on the downside, decisive break of 0.6457 support will confirm resumption of whole fall from 0.7156. Next target is 100% projection of 0.7156 to 0.6457 from 0.6894 at 0.6195. Nevertheless, firm break of 0.6615 minor resistance will indicate short term bottoming, and turn bias back to the upside for stronger rebound.
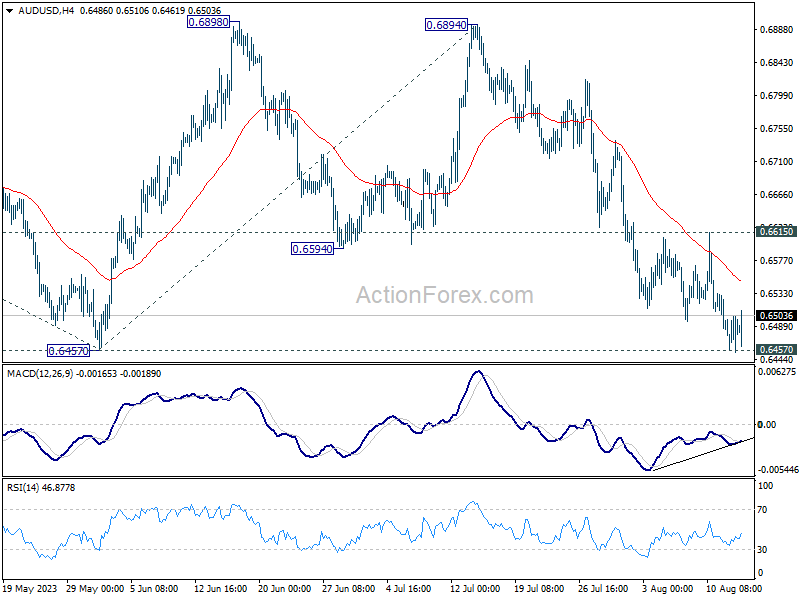
In the bigger picture, the down trend from 0.8006 (2021 high) could still be in progress. Break of 0.6457 will affirm this bearish case. Further break of 0.6169 will target 61.8% projection of 0.8006 to 0.6169 to 0.7156 at 0.6021. This will now remain the favored case as long as 0.6894, in case of strong rebound.
Dollar Rally Wavers, Sentiment Steady as China Rate Cut Offsets Discouraging Data
Dollar's spirited rally attempt faced a swift halt as major US stock indices recorded gains, positively influencing broader market sentiment. Following that, Asian markets are poised, with China's unexpected rate cut effectively counterbalancing the dampening effects of discouraging economic data. As a result, commodity currencies, including Australian Dollar, saw a resurgence.
Notably, the Aussie weathered the potentially negative implications of the recent RBA minutes. Contrarily, both Yen and Euro trended on the softer side, with the former overlooking promising GDP numbers, and the latter appearing susceptible, especially when pitted against other Europeans and commodity currencies.
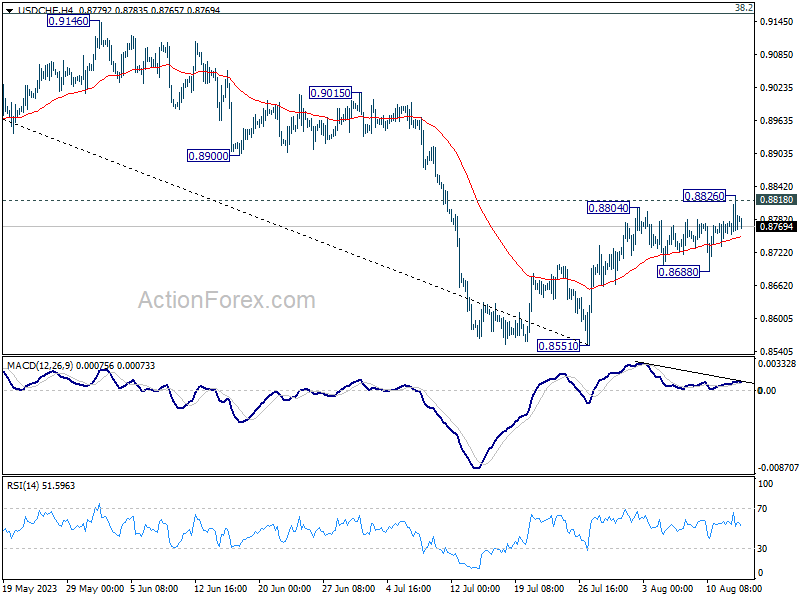
Technically, USD/CHF was quickly knocked down after a brief breach of a key structural resistance at 0.8818. The overall bullish momentum for the greenback is not confirmed yet. Indeed, deeper decline in USD/CHF and break of 0.8688 support will confirm rejection by 0.8818. That would maintain bearishness in the pair and argues that larger down trend from 1.0146 is ready to resume through 0.8551 low.
Should this scenario unfold, it could be an indicator of the return of dominance of Dollar bears, hinting at a widespread selloff. On the flip side, sustained break of 0.8818 mark in USD/CHF could be indicative of a more prolonged Dollar buying spree.
In Asia, at the time of writing, Nikkei is up 0.90%. Hong Kong HSI is down -0.80%. China Shanghai SSE is down -0.29%. Singapore Strait Times is up 0.10%. Japan 10-year JGB yield is up 0.0070 at 0.626. Overnight, DOW rose 0.07%. S&P 500 rose 0.58%. NASDAQ rose 1.05%. 10-year yield rose 0.016 to 4.184.
China: Unexpected rate cut by PBOC aligns with disheartening July economic data
In an unexpected decision that took markets by surprise, PBoC announced a cut in key policy rates for the second time in a span of three months, just an hour before the release of July economic data that broadly fell short of market expectations.
PBOC lowered the rate on its one-year medium-term lending facility loans – valued at CNY 401B – to financial institutions by 15bps to 2.50% from the previous 2.65%. This significant move indicates the possibility of a reduction in China's benchmark loan prime rate in the upcoming week.
A closer look at the economic metrics for July reveals concerns. Industrial production grew at 3.7% yoy, underperforming against the anticipated 4.3% yoy and marking a slowdown from the 4.4% yoy of the previous month. Similarly, retail sales saw increase of just 2.5% yoy, lagging behind projected 4.2% yoy and decelerating from 3.1% yoy. This rate marks the slowest growth pace in sales since the decline observed in December 2022. Furthermore, fixed asset investment growth, year-to-date year-on-year, was recorded at 3.4%, falling short of 3.8% expectation.
Urban unemployment rate witnessed a slight increase, moving from 5.2% to 5.3%. Notably, NBS did not provide the usual age breakdown of unemployment figures. The spokesperson mentioned the suspension of youth unemployment data attributing it to societal and economic changes, and highlighted an ongoing reassessment of its data collection methodology. It's worth noting that in June, the youth unemployment rate (for ages 16-24) reached a record high of 21.3%
NBS also said in a statement, "We must intensify the role of macro policies in regulating the economy and make solid efforts to expand domestic demand, shore up confidence and prevent risks."
Japan's Q2 GDP grew 6% annualized, external demand drives growth
Japan witnessed a stellar performance in its Q2 GDP, registering a growth of 1.5% Qoq, a figure that comfortably surpassed the anticipated 0.8% qoq rise. In annualized terms, growth clocked in at 6.0%, notably higher than expected 3.1%. This rapid expansion marked the quickest pace since the October-December period of 2020 and signifies the third consecutive quarterly growth.
A significant driver of this growth was a 3.2% surge in exports during the quarter. The rejuvenation in external demand, particularly net exports, added a substantial 1.8% to the quarter's growth. The auto exports sector reaped benefits from the alleviation of supply disruptions, while a consistent uptick in international tourists bolstered the economy. On the flip side, imports dipped by -4.3% as energy and COVID vaccine imports declined.
A closer look at the domestic sector unveils a few challenges. Private consumption, a sector that constitutes over half of the economy, contracted by -0.5% on a quarterly basis. This resulted in domestic demand cutting -0.3% from growth. The mounting prices of regular commodities affected consumer spending negatively. Furthermore, sales of durable goods took a hit, which overshadowed the robust demand for services.
In terms of capital investment, the growth remained tepid, registering just a 0.03% increase. However, it's noteworthy that this was buoyed by spending related to software, marking its second successive quarter of rise.
RBA sees credible path back to inflation target with interest rate at present level
In the minutes from RBA's August 1 meeting, board members weighed the decision between raising cash rate by 25bps or maintaining its unchanged.
The board's inclination to hold the rate steady was rooted in their belief that prior tightening measures were "working as intended." Despite the full effects not yet being evident in the data, there were important signs, as "consumption had already slowed significantly", "labour market might be at a turning point", and "inflation was heading in the right direction".
The board observed a "credible path back to the inflation target with the cash rate staying at its present level." This assessment seemed to be "broadly in line with the staff's central forecasts." Solidifying their position, members collectively agreed that the reasons to "leave the cash rate unchanged at this meeting was the stronger one."
Meanwhile, they also acknowledged that "further tightening of monetary policy might be required" to consistently meet inflation goals. Such decisions will be driven by data trends and ongoing risk assessments.
Looking ahead
UK employment, Swiss PPI and Germany ZEW economic sentiment are the main focuses in European session. Later in the day, Canada CPI and US retail sales will take center stage.
AUD/USD Daily Report
Daily Pivots: (S1) 0.6460; (P) 0.6482; (R1) 0.6509; More...
AUD/USD recovered quickly after breaching 0.6457 support briefly. Intraday bias is turned neutral first with 4H MACD crossed above signal line. on the downside, decisive break of 0.6457 support will confirm resumption of whole fall from 0.7156. Next target is 100% projection of 0.7156 to 0.6457 from 0.6894 at 0.6195. Nevertheless, firm break of 0.6615 minor resistance will indicate short term bottoming, and turn bias back to the upside for stronger rebound.
In the bigger picture, the down trend from 0.8006 (2021 high) could still be in progress. Break of 0.6457 will affirm this bearish case. Further break of 0.6169 will target 61.8% projection of 0.8006 to 0.6169 to 0.7156 at 0.6021. This will now remain the favored case as long as 0.6894, in case of strong rebound.
Economic Indicators Update
| GMT | Ccy | Events | Actual | Forecast | Previous | Revised |
|---|---|---|---|---|---|---|
| 23:50 | JPY | GDP Q/Q Q2 P | 1.50% | 0.80% | 0.70% | |
| 23:50 | JPY | GDP Deflator Y/Y Q2 P | 3.40% | 3.80% | 2.00% | |
| 01:30 | AUD | RBA Meeting Minutes | ||||
| 01:30 | AUD | Wage Price Index Q/Q Q2 | 0.80% | 1.00% | 0.80% | |
| 02:00 | CNY | Industrial Production Y/Y Jul | 3.70% | 4.30% | 4.40% | |
| 02:00 | CNY | Retail Sales Y/Y Jul | 2.50% | 4.20% | 3.10% | |
| 02:00 | CNY | Fixed Asset Investment YTD Y/Y Jul | 3.40% | 3.80% | 3.80% | |
| 04:30 | JPY | Industrial Production M/M Jun F | 2.4% | 2.00% | 2.00% | |
| 06:00 | GBP | Claimant Count Change Jul | 25.7K | |||
| 06:00 | GBP | ILO Unemployment Rate (3M) Jun | 4.00% | 4.00% | ||
| 06:00 | GBP | Average Earnings Including Bonus 3M/Y Jun | 6.90% | |||
| 06:00 | GBP | Average Earnings Excluding Bonus 3M/Y Jun | 7.40% | 7.30% | ||
| 06:30 | CHF | Producer and Import Prices M/M Jul | 0.20% | 0.00% | ||
| 06:30 | CHF | Producer and Import Prices Y/Y Jul | -0.50% | -0.60% | ||
| 09:00 | EUR | Germany ZEW Economic Sentiment Aug | -15 | -14.7 | ||
| 09:00 | EUR | Germany ZEW Current Situation Aug | -63 | -59.5 | ||
| 09:00 | EUR | Eurozone ZEW Economic Sentiment Aug | -12 | -12.2 | ||
| 09:00 | EUR | EU Economic Forecasts | ||||
| 12:30 | CAD | Manufacturing Sales M/M Jun | -2.10% | 1.20% | ||
| 12:30 | CAD | CPI M/M Jul | 0.30% | 0.10% | ||
| 12:30 | CAD | CPI Y/Y Jul | 3.00% | 2.80% | ||
| 12:30 | CAD | CPI Media Y/Y Jul | 3.70% | 3.90% | ||
| 12:30 | CAD | CPI Trimmed Y/Y Jul | 3.50% | 3.70% | ||
| 12:30 | CAD | CPI Common Y/Y Jul | 5.00% | 5.10% | ||
| 12:30 | USD | Empire State Manufacturing Index Aug | -0.3 | 1.1 | ||
| 12:30 | USD | Retail Sales M/M Jul | 0.40% | 0.20% | ||
| 12:30 | USD | Retail Sales ex Autos M/M Jul | 0.40% | 0.20% | ||
| 12:30 | USD | Import Price Index M/M Jul | 0.20% | -0.20% | ||
| 14:00 | USD | Business Inventories Jun | 0.20% | 0.20% | ||
| 14:00 | USD | NAHB Housing Market Index Aug | 56 | 56 |
RBA sees credible path back to inflation target with interest rate at present level
In the minutes from RBA's August 1 meeting, board members weighed the decision between raising cash rate by 25bps or maintaining its unchanged.
The board's inclination to hold the rate steady was rooted in their belief that prior tightening measures were "working as intended." Despite the full effects not yet being evident in the data, there were important signs, as "consumption had already slowed significantly", "labour market might be at a turning point", and "inflation was heading in the right direction".
The board observed a "credible path back to the inflation target with the cash rate staying at its present level." This assessment seemed to be "broadly in line with the staff's central forecasts." Solidifying their position, members collectively agreed that the reasons to "leave the cash rate unchanged at this meeting was the stronger one."
Meanwhile, they also acknowledged that "further tightening of monetary policy might be required" to consistently meet inflation goals. Such decisions will be driven by data trends and ongoing risk assessments.
GBP/USD Could Resume Downtrend Below This Support
Key Highlights
- GBP/USD traded below the 1.2750 support zone.
- A major bearish trend line is forming with resistance near 1.2770 on the 4-hour chart.
- EUR/USD spiked below the 1.0920 support zone.
- Gold prices are showing bearish signs below $1,920.
GBP/USD Technical Analysis
The British Pound started a fresh decline from well above 1.2920 against the US Dollar. GBP/USD traded below the 1.2850 support to move into a bearish zone.
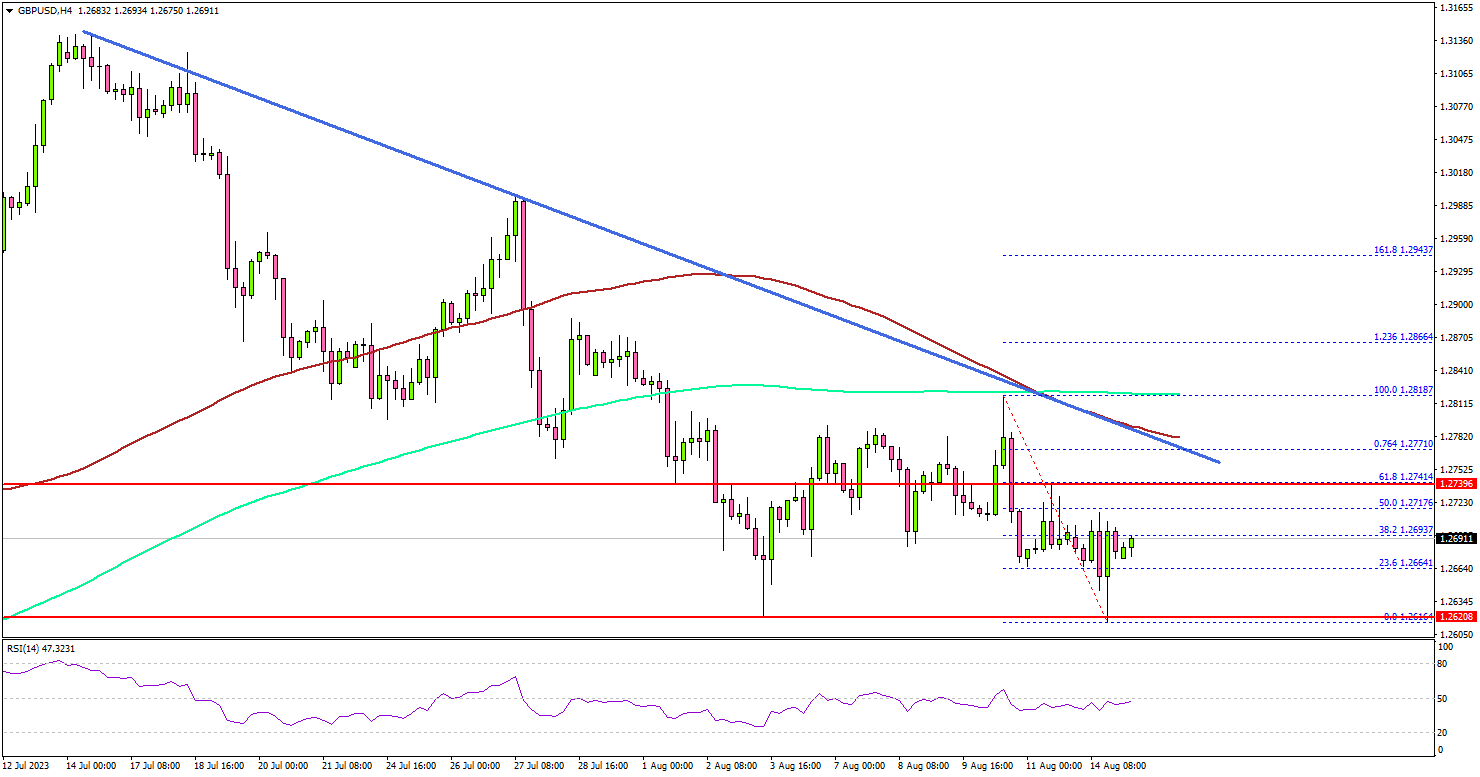
Looking at the 4-hour chart, the pair settled below the 1.2800 level, the 100 simple moving average (red, 4 hours), and the 200 simple moving average (green, 4 hours).
The pair also traded 1.2750 support zone and tested 1.2620. The pair is now consolidating losses and facing many hurdles on the upside, starting with 1.2715. The next major resistance is near the 1.2740 level.
There is also a major bearish trend line forming with resistance near 1.2770 on the same chart. A close above the 1.2770 resistance could push the pair toward 1.2850. Any more gains could start a fresh increase toward the 1.2920 level.
Initial support is near the 1.2620 level. The next major support is near 1.2550, below which GBP/USD could gain bearish momentum. In the stated case, the pair could test the 1.2465 support.
Looking at EUR/USD, the pair is trading in a bearish zone and there could be a move toward the 1.0850 level in the near term.
Economic Releases
- UK Claimant Count Change March 2023 – Forecast 13.0K, versus 25.7K previous.
- UK ILO Unemployment Rate Feb 2023 (3M) – Forecast 4.0%, versus 4.0% previous.
- Canadian Consumer Price Index for July 2023 (MoM) – Forecast +0.3%, versus +0.1% previous.
- Canadian Consumer Price Index for July 2023 (YoY) – Forecast +3.0%, versus +2.8% previous.
(RBA) Minutes of the Monetary Policy Meeting of the Reserve Bank Board
Hybrid – 1 August 2023
Members participating
Philip Lowe (Governor and Chair), Michele Bullock (Deputy Governor), Mark Barnaba AM, Ian Harper AO, Carolyn Hewson AO, Steven Kennedy PSM, Iain Ross AO, Carol Schwartz AO, Alison Watkins AM
Others participating
Marion Kohler (Acting Assistant Governor, Economic), Christopher Kent (Assistant Governor, Financial Markets), Tom Rosewall (Acting Head, Economic Analysis Department)
Anthony Dickman (Secretary), David Norman (Acting Deputy Secretary)
David Jacobs (Head, RBA Future Hub), Penelope Smith (Head, International Department), Carl Schwartz (Acting Head, Domestic Markets Department)
International economic developments
Members commenced their discussion of the global economy by noting that headline inflation had declined further in most advanced economies, by a little more than expected in some cases, and that this had largely been led by energy prices over the prior year. However, core inflation remained well above the rates consistent with central banks' targets and was proving to be persistent. While labour market conditions were gradually easing, conditions remained tight and unemployment rates were still at very low levels. Furthermore, members noted that wages growth remained above levels that would be consistent with many central banks' inflation targets. While some portion of this may reflect a one-time correction to wage levels, and high wages growth could be partially offset by a contraction in profit margins or faster productivity growth, members noted that slower growth in wages was likely to be required for inflation to return to target. Many central banks in advanced economies still expected inflation to be at or close to their targets by the end of 2025.
Growth in advanced economies had slowed in response to tighter monetary policy and cost-of-living pressures, but not by as much as expected in some cases. While growth in the manufacturing sector had slowed in preceding months, services sector activity had been relatively resilient. The post-pandemic recovery in consumption had been notably stronger in the United States and Canada. More recently, consumption growth had slowed in many advanced economies. Members noted that there were some indications that households' real disposable incomes and wealth were starting to increase, as inflation declined and housing prices stabilised or began to rise in a number of countries.
In China, the economic recovery had been weaker than expected after the lifting of COVID-19 restrictions at the end of 2022. In the June quarter, weak external demand had weighed on export growth and there was a further deterioration in conditions in the property market, placing additional pressure on financially stressed developers. By contrast, household consumption had continued to recover in the quarter, though it remained below its pre-pandemic trend. Inflation remained very low by global standards and relative to the authorities' target.
Members noted that the outlook for the Chinese economy had been revised lower and was subject to a high degree of uncertainty. The outlook depended on how the recovery in household consumption evolved, and the scale and effectiveness of policy support, particularly in the property sector. Authorities had recently signalled a more positive stance on support for the property sector, but the extent of the shift was uncertain, and authorities continued to emphasise the containment of risks. Iron ore prices had increased in response to an expectation of further targeted stimulus for the property sector. By contrast, thermal coal prices had declined, partly because of weak industrial demand in China.
Members observed that growth in Australia's major trading partners was expected to be lower than forecast in May, at around 3¼ per cent in 2023 and 3 per cent in 2024 – well below the pre-pandemic longer run average. The downgrade partly reflected the revision to the outlook for China. Members considered the key uncertainties around the outlook. These included that advanced economies might need to tighten policy further if inflation pressures persist, and that there could be spillover effects if the Chinese economy were to be weaker than forecast. On the other hand, the recent run of data on activity – especially for North America – had surprised on the upside, and policy support could lift the outlook for the Chinese economy.
Domestic economic conditions
Turning to the domestic economy, members observed that consumer price inflation had eased by more than expected in the June quarter and had continued to decline from its peak at the end of 2022. Nonetheless, members acknowledged that inflation remained high and broadly based. Headline inflation was 0.9 per cent in the June quarter in seasonally adjusted terms and 6 per cent in year-ended terms. Goods price inflation had eased further in the quarter, and by more than expected, particularly for consumer durables. This was consistent with easing global cost pressures, alongside slowing growth in domestic demand. However, progress in reducing inflation had been uneven across goods categories, with grocery prices inflation (excluding fruit and vegetables) remaining high in the quarter. Services price inflation – especially for market services – had also remained high. And rent inflation had picked up further, to an annualised rate of around 10 per cent in the June quarter.
Trimmed mean inflation in the June quarter was 6 per cent in year-ended terms – well above the inflation target but down from its peak at the end of 2022. The monthly inflation indicator also pointed to a continued decline in inflationary pressures through the quarter. The share of CPI items whose prices had increased faster than 3 per cent on an annualised basis had declined but remained above its pre-pandemic average.
Members observed that the updated staff inflation forecasts were little changed from those presented to the Board in May, and the forecast period had been extended to the end of 2025. Headline inflation was forecast to be around 3¼ per cent at the end of 2024 and back within the 2–3 per cent target range in late 2025. This forecast was based on a higher profile for the cash rate over the forecast period than three months prior, reflecting, among other things, increases in the cash rate in both May and June.
The easing in goods price inflation was expected to drive the decline in inflation over the year ahead. By contrast, domestic cost pressures arising from still-high levels of demand combined with ongoing tightness in the labour market and energy costs were expected to see inflationary pressures persist for some time. This would be particularly evident in services price inflation. The forecast for rent inflation had been revised up a little for the year ahead as higher-than-expected population growth had added demand to an already tight rental market.
Turning to wages, members noted that timely indicators of wages growth were steady at around 3½ to 4 per cent in the June quarter. Wages growth – as measured by the Wage Price Index – was expected to increase in the second half of 2023 because of ongoing tightness in the labour market, increases in award and minimum wages, and developments in public sector wages. Importantly, however, the forecasts were predicated on labour productivity growth returning to its pre-pandemic trend over coming years, which would be needed for the expected growth in labour costs to be consistent with the inflation target.
Labour market conditions remained tight, but a little less so than in late 2022. The unemployment rate had remained at 3½ per cent in June and had been around that level for a year. Employment had increased in line with the strong rate of population growth, keeping the employment-to-population ratio at its record high. Members noted that the population level was still a little below its pre-pandemic trend but that it had grown by more than anticipated, partly due to unexpectedly high numbers of international students. Meanwhile, hiring intentions of firms in the Bank's liaison program had eased and firms had reported an improvement in labour availability in some sectors, partly supported by the arrival of foreign workers. The staff forecast was for the unemployment rate to increase to reach 4½ per cent by late 2024.
Members observed that the economy was expected to grow well below its trend pace over 2023 as cost-of-living pressures and higher interest rates weigh on demand. Growth in output was forecast to increase, albeit only gradually, over the remainder of the forecast period, supported by an easing of these headwinds and a pick-up in household wealth following the turnaround in the housing market. Year-ended GDP growth was expected to trough at 1 per cent at the end of 2023, before gradually picking up to around 2¼ per cent by the end of 2025. The near-term outlook was more subdued than it had been in May, with GDP per capita having declined in the March quarter.
Timely indicators suggested that household consumption growth remained subdued in the June quarter. Members discussed the decline in retail sales in the month of June, noting that this had followed a comparable increase in sales in May, with the timing of promotional activity contributing to the monthly variability. More broadly, the value of monthly retail sales had been essentially unchanged since September 2022. Growth in household consumption had slowed considerably over the prior year, consistent with developments in aggregate household real income and wealth. Members noted, however, that behind the aggregate picture was a diversity of experience among individual households as high inflation and higher interest rates worked their way through the economy. That said, disaggregated data on spending growth pointed to a common driver – that high inflation is eroding real incomes – and that this is playing an important role in the slowdown in aggregate consumption growth. Nonetheless, consumption outcomes for some mortgagors and renters were judged likely to be considerably weaker than the aggregate, since some of these households face acute financial challenges.
National housing prices had increased over prior months because of the combined effects of stronger demand and limited supply. Members noted that strong population growth had lifted demand for rental properties, as had a decline in the number of residents per dwelling since the start of the pandemic. Adding to this, households were able to pay more for housing because of strong nominal income growth. Rental vacancy rates had remained low across all capital cities, supporting strong growth in rents.
Construction activity continued to be limited by capacity constraints and a tightening in financial conditions. Cash flow constraints and an increase in insolvencies could create further delays in completions for some projects. Demand for new residential construction had been relatively weak but the staff forecasts were for this to pick up over coming years. Non-mining business investment in machinery and equipment had grown strongly in the March quarter and was expected to remain at a high level for some time. Export volumes were expected to grow modestly over the forecast period, driven by international student numbers growing at robust pre-pandemic rates and the ongoing recovery in international tourism.
International financial markets
Members noted that market participants' expectations for central banks' policy rates were little changed over July, having increased over May and June. The stabilisation of policy rate expectations mainly reflected lower-than-expected inflation data in several advanced economies, even as labour markets remained very tight. The US Federal Reserve, the European Central Bank and the Bank of Canada raised policy rates further in July, as expected, and market participants had not fully priced in further policy rate increases. In the United Kingdom, markets were pricing in at least one more rate increase.
Government bond yields had declined in some countries over July but generally remained higher than a few months prior, reflecting an expectation that central banks would hold policy rates at higher levels for longer. Meanwhile, market-implied measures of longer term inflation expectations for advanced economies generally remained consistent with central banks' inflation targets. In Japan, yields on 10-year government bonds had increased following the Bank of Japan's decision to amend the parameters of its yield curve control policy. Market-implied measures of longer term inflation expectations had increased for Japan but were still below the 2 per cent inflation target.
Over the month, equity prices had increased further and corporate bond spreads had narrowed. However, corporate bond issuance had declined over the prior year and intermediated credit growth had slowed in response to the substantial tightening of monetary policies. In China, equity prices and bond yields had risen a little from recent lows, in response to the prospect of further policy stimulus.
The Australian dollar had been little changed over the month on a trade-weighted basis. The exchange rate had appreciated earlier in the month, although concerns around the outlook for the Chinese economy and domestic economic data – including lower-than-expected inflation – had weighed on the exchange rate later in July.
Domestic financial markets
Members noted that market expectations for the path of the cash rate implied by money market rates had declined since the July meeting, as had market economists' expectations. The decision to leave the cash rate unchanged in July had come as a surprise to some market participants. Expectations for increases in the cash rate had also declined following lower-than-expected June quarter CPI data and, to a lesser extent, weaker-than-expected June retail sales data.
Scheduled mortgage payments as a share of household disposable income increased to 9.4 per cent in the June quarter, around its historical peak. Members noted that banks had continued passing increases in the cash rate through to their customers, and that outstanding mortgage rates and scheduled mortgage payments were set to increase further as a high share of fixed-rate loans roll onto higher rates through the rest of 2023. Voluntary principal payments into borrowers' offset and redraw accounts declined in the June quarter. Net flows into these accounts had declined to be noticeably lower than the pre-pandemic average, consistent with pressures on disposable incomes.
Credit growth had declined over the year to June, as expected given the tightening of monetary policy, although it had stabilised more recently. Housing credit growth had been supported by an increase in housing loan commitments since February, alongside the increase in housing prices.
Business credit growth had also stabilised, having slowed over the prior year, but lending to small businesses had been little changed for several years. Members discussed insights from the Bank's annual small business finance panel, which had convened in July. While some panellists had sought finance to meet operating costs, others were hesitant to take on new debt given the economic uncertainties and higher cost of finance. Longstanding challenges for small businesses in accessing finance from banks remained, including rigid collateral requirements and onerous application processes. Several panellists had turned to non-traditional sources of finance, such as private equity and non-bank finance, although the aggregate value of these types of funding remained modest compared with bank lending.
Members noted that market pricing implied a one-in-three chance of a 25 basis point increase in the cash rate at the August meeting, with a 25 basis point increase fully priced in by the end of 2023. Around one in two market economists expected a rate increase at this meeting but the median view was also for only one further rate rise this year. The expectation from both market pricing and the median of market economists' forecasts was that a 25 basis point increase would bring rates to their peak for the current tightening phase.
Considerations for monetary policy
In turning to the policy decision, members noted that the data released over the prior month signalled the economy was still on the narrow path in which inflation returns to target while employment and the economy continue to grow. The staff's revised central forecasts also had the economy continuing on that path. However, risks remained on both sides of the forecasts, including plausible scenarios in which inflation takes longer to return to target than members considered acceptable.
Members noted that the information received on inflation over the prior month had been reassuring. Inflation had fallen further and been a little lower than expected in the June quarter. However, members observed that there had not yet been any material slowing in services price inflation, and the experience globally had been that services price inflation was more persistent than expected. Members also noted that inflation for some services (including rent and insurance) may rise further, given those items' historical patterns of persistence and the current conditions in these markets.
Members observed that the labour market had continued to show considerable resilience. The unemployment rate was very low and had remained around 3½ per cent for a full year. However, there were some signs that the labour market was at a turning point, including a small rise in the underemployment rate. More generally, members noted signs that the substantial rise in interest rates over the prior year was constraining demand, including in the retail sector, where the value of sales had not grown for some time.
Members considered the implications of the staff's forecasts. These forecasts were little changed from three months earlier and remained consistent with the economy staying on the narrow path that the Board is seeking to navigate. Members noted the conditioning assumption for the cash rate underlying these forecasts was higher than it had previously been, given the increases in May and June.
Members then turned to a consideration of the risks surrounding these forecasts. They noted that these were broadly balanced, but that the costs associated with these risks might be asymmetric – in particular, it would be costly if a sustained period of high inflation led to higher inflation expectations.
Members discussed a range of scenarios for inflation, including the possibility that inflation does not return to the target band by around mid-2025. This could occur if services price inflation declines more slowly than forecast, the recovery in productivity growth incorporated into the forecasts does not eventuate or if wages growth is more responsive to the tight labour market than assumed. On the other hand, inflation could fall faster than anticipated if the decline in real household disposable income over the prior year weighs more heavily on consumption. More broadly, members noted the lags in the operation of monetary policy meant that the full effects of the 400 basis points of monetary policy tightening over the prior year were yet to be felt. Accordingly, members acknowledged the significant uncertainty about the economic outlook.
In light of these observations, members considered two options for monetary policy at this meeting: raising the cash rate by a further 25 basis points; or holding the cash rate steady.
The case to raise the cash rate centred on the risk that inflation might prove to be more persistent than currently forecast. Members observed that, were this to occur, it would require the Board to raise the cash rate by more than otherwise to get inflation back to target, making it very difficult to preserve the gains made in employment over prior years. Raising the cash rate at this meeting would help to mitigate the risk of that undesirable scenario eventuating. In addition, members noted that the staff's forecasts were already conditioned on a further increase in the cash rate and that the cash rate was notably lower than policy rates in other countries, despite inflation in Australia being at least as high. Finally, members observed that the resumption of growth in housing prices could be a signal that financial conditions were not as tight as they had assessed.
On the other hand, the arguments for keeping the cash rate unchanged at this meeting centred on the observation that the Board had already tightened monetary policy significantly, there were signs that this was working as intended and the Board had time to wait and see how the economy evolves. Members noted that the full effects of the earlier tightening were yet to be recorded in the data. Even so, consumption had already slowed significantly, there were early signs that the labour market might be at a turning point and inflation was heading in the right direction. Considering this and the forecasts, members observed that there was a credible path back to the inflation target with the cash rate staying at its present level. This path was broadly in line with the staff's central forecasts.
Members agreed that the argument to leave the cash rate unchanged at this meeting was the stronger one. They noted that the recent information on inflation had been encouraging, the economy was expected to grow only slowly over the period ahead and this would help with the further moderation of inflation. At the same time, members agreed that it was possible that some further tightening of monetary policy might be required to ensure that inflation returns to target in a reasonable timeframe. Whether or not a further increase in interest rates is required would depend on the data and the evolving assessment of risks. In making its decisions over the months ahead, the Board will continue to pay close attention to developments in the global economy, trends in household spending, and the outlook for inflation and the labour market. Members reaffirmed their determination to return inflation to target within a reasonable timeframe and their willingness to do what is necessary to achieve that outcome.
The decision
The Board decided to leave the cash rate unchanged at 4.1 per cent, and the interest rate on Exchange Settlement balances at 4 per cent.
China: Unexpected rate cut by PBOC aligns with disheartening July economic data
In an unexpected decision that took markets by surprise, PBoC announced a cut in key policy rates for the second time in a span of three months, just an hour before the release of July economic data that broadly fell short of market expectations.
PBOC lowered the rate on its one-year medium-term lending facility loans – valued at CNY 401B – to financial institutions by 15bps to 2.50% from the previous 2.65%. This significant move indicates the possibility of a reduction in China's benchmark loan prime rate in the upcoming week.
A closer look at the economic metrics for July reveals concerns. Industrial production grew at 3.7% yoy, underperforming against the anticipated 4.3% yoy and marking a slowdown from the 4.4% yoy of the previous month. Similarly, retail sales saw increase of just 2.5% yoy, lagging behind projected 4.2% yoy and decelerating from 3.1% yoy. This rate marks the slowest growth pace in sales since the decline observed in December 2022. Furthermore, fixed asset investment growth, year-to-date year-on-year, was recorded at 3.4%, falling short of 3.8% expectation.
Urban unemployment rate witnessed a slight increase, moving from 5.2% to 5.3%. Notably, NBS did not provide the usual age breakdown of unemployment figures. The spokesperson mentioned the suspension of youth unemployment data attributing it to societal and economic changes, and highlighted an ongoing reassessment of its data collection methodology. It's worth noting that in June, the youth unemployment rate (for ages 16-24) reached a record high of 21.3%
NBS also said in a statement, "We must intensify the role of macro policies in regulating the economy and make solid efforts to expand domestic demand, shore up confidence and prevent risks."
Japan’s Q2 GDP grew 6% annualized, external demand drives growth
Japan witnessed a stellar performance in its Q2 GDP, registering a growth of 1.5% Qoq, a figure that comfortably surpassed the anticipated 0.8% qoq rise. In annualized terms, growth clocked in at 6.0%, notably higher than expected 3.1%. This rapid expansion marked the quickest pace since the October-December period of 2020 and signifies the third consecutive quarterly growth.
A significant driver of this growth was a 3.2% surge in exports during the quarter. The rejuvenation in external demand, particularly net exports, added a substantial 1.8% to the quarter's growth. The auto exports sector reaped benefits from the alleviation of supply disruptions, while a consistent uptick in international tourists bolstered the economy. On the flip side, imports dipped by -4.3% as energy and COVID vaccine imports declined.
A closer look at the domestic sector unveils a few challenges. Private consumption, a sector that constitutes over half of the economy, contracted by -0.5% on a quarterly basis. This resulted in domestic demand cutting -0.3% from growth. The mounting prices of regular commodities affected consumer spending negatively. Furthermore, sales of durable goods took a hit, which overshadowed the robust demand for services.
In terms of capital investment, the growth remained tepid, registering just a 0.03% increase. However, it's noteworthy that this was buoyed by spending related to software, marking its second successive quarter of rise.
Will UK Inflation Data Confirm BoE’s Choice to Slow Down?
With investors significantly lowering their implied Bank of England rate path following the slowdown in June’s inflation numbers and the 25bps hike at the Bank’s latest meeting, the spotlight will now turn to the UK inflation data for July, due out on Wednesday at 06:00 GMT. Traders will be eager to find out whether their massive adjustment in their bets seems correct or not, leaving the pound vulnerable to volatile swings.
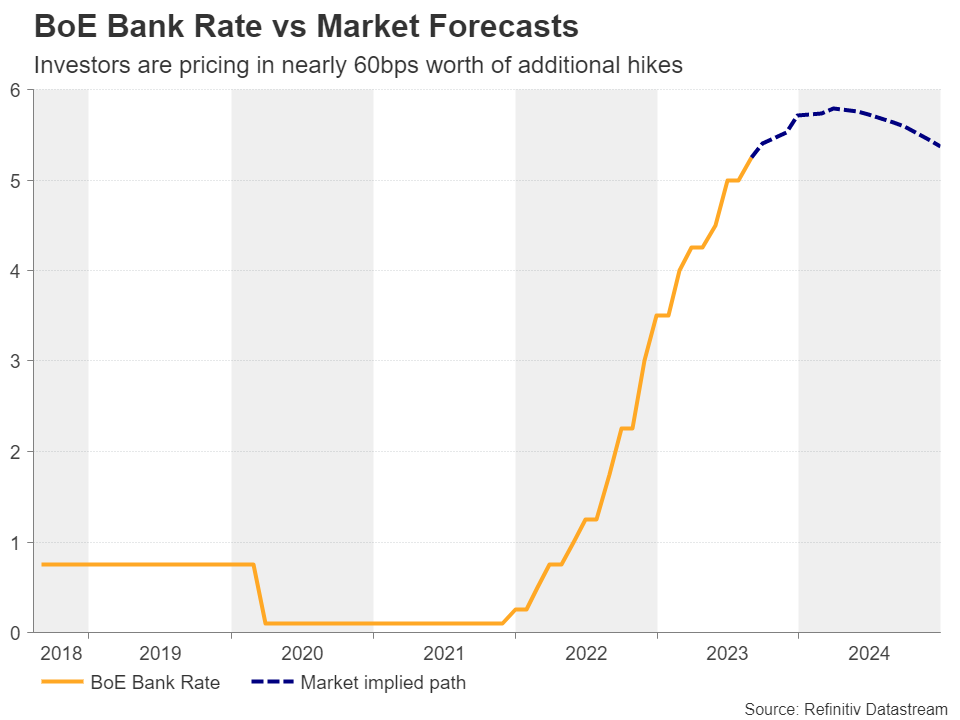
Investors see only two more 25bps hikes by the BoE
With inflation slowing more than expected in June, BoE policymakers decided to slow their tightening campaign at their latest gathering, raising interest rates by 25bps, a smaller increase than the half-point increment of the previous month. They also appeared less hawkish than expected, with Governor Bailey noting that he didn’t think there was a case for another 50bps hike.
Following the decision, investors massively slashed their rate-hike bets, and although they somewhat lifted again their implied path following Friday’s better-than-expected GDP data for Q2, they are still seeing a 20% probability for policymakers to stand pat at the next gathering, with the remaining 80% pointing to another quarter-point hike. As for thereafter, market participants are pricing in around 35 basis points worth of additional increases before the Bank ends its own tightening crusade.
Inflation is expected to continue cooling
With all that in mind, this week, pound traders may pay close attention to the UK CPI numbers for July on Wednesday. The headline rate is expected to have dropped by more than a full percentage point to 6.8% year-on-year from 7.9%, while the core one is expected to have ticked down to 6.8% y/y from 6.9%.
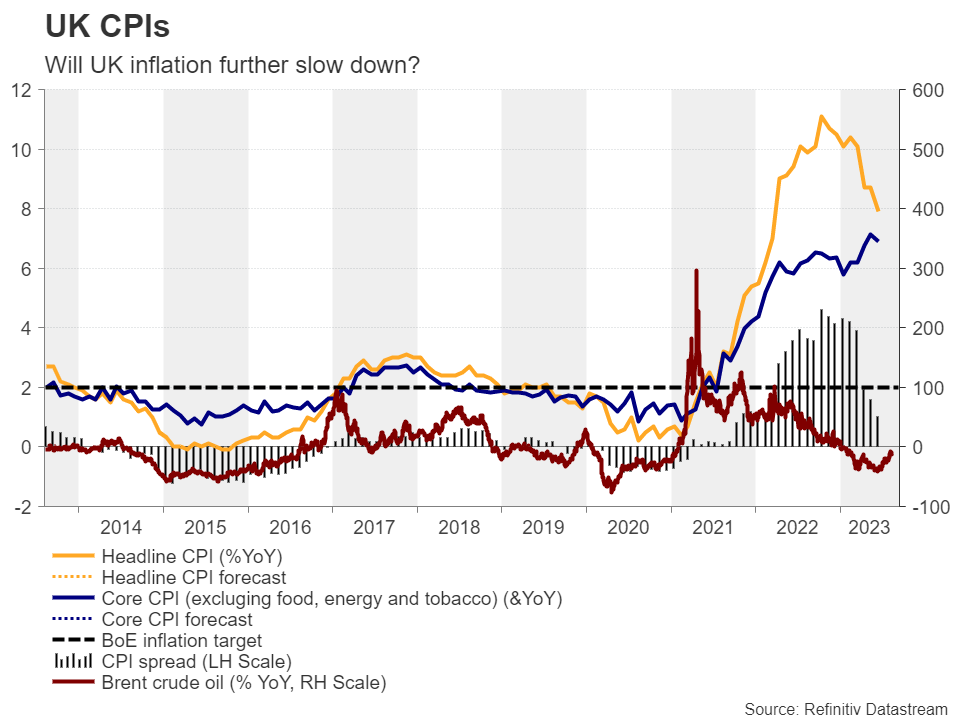
A further slowdown in consumer prices is also supported by the S&P Global PMIs for the month, which suggested further cooling of inflationary pressures. However, considering the upside risk posed by the rebound in the year-on-year change of oil prices, should the headline rate fall as the forecast suggests, the core rate may fall more than anticipated.
Pound may slide, but upside risks remain
This could add credence to investors’ choice to lower their BoE implied rate path and may further hurt the pound. However, with inflation still running more than triple the Bank’s 2% objective, it will be hard to imagine that the BoE’s job will be done with only two more quarter-point hikes. After all, Tuesday’s employment report is forecast to reveal accelerating earnings growth during the month of June, and strong wage growth is something that can translate into stickier consumer prices in the months to come.
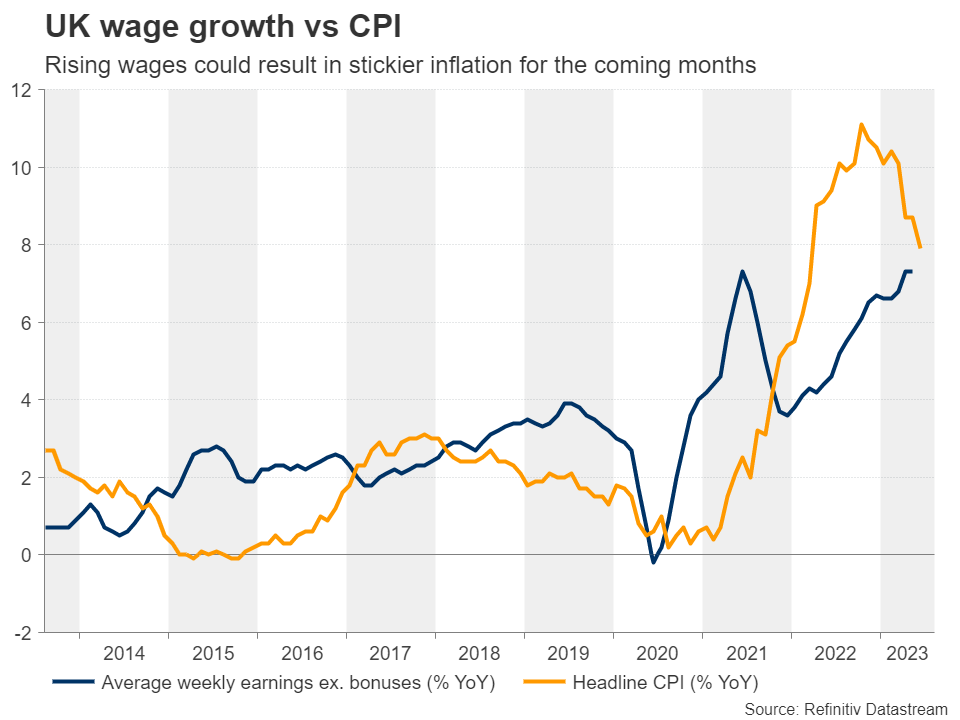
Therefore, although the pound may suffer for a while longer due to a further slowdown in inflation, but also due to a potential slump in Friday’s retail sales for July, there may be some upside risks in the medium term. At a time when other central banks are signaling the end of their own tightening crusades, investors may realize that the BoE still has work to do and thus, they could start adding back some more basis points worth of rate increments to their implied rate path.
Pound/kiwi uptrend poised to continue
This could help the pound rebound and continue its prevailing uptrend, especially against currencies whose central banks have already signaled that they are done raising rates, like the kiwi. The RBNZ announced the end of its own tightening cycle back in May, it held rates steady in June, and it is widely expected to stand pat this week as well.
As both the pound and the kiwi have risk-linked characteristics, those risk-related forces are offset by one another in pound/kiwi, with the main driver of the pair being the divergence in monetary policy expectations between the BoE and the RBNZ.
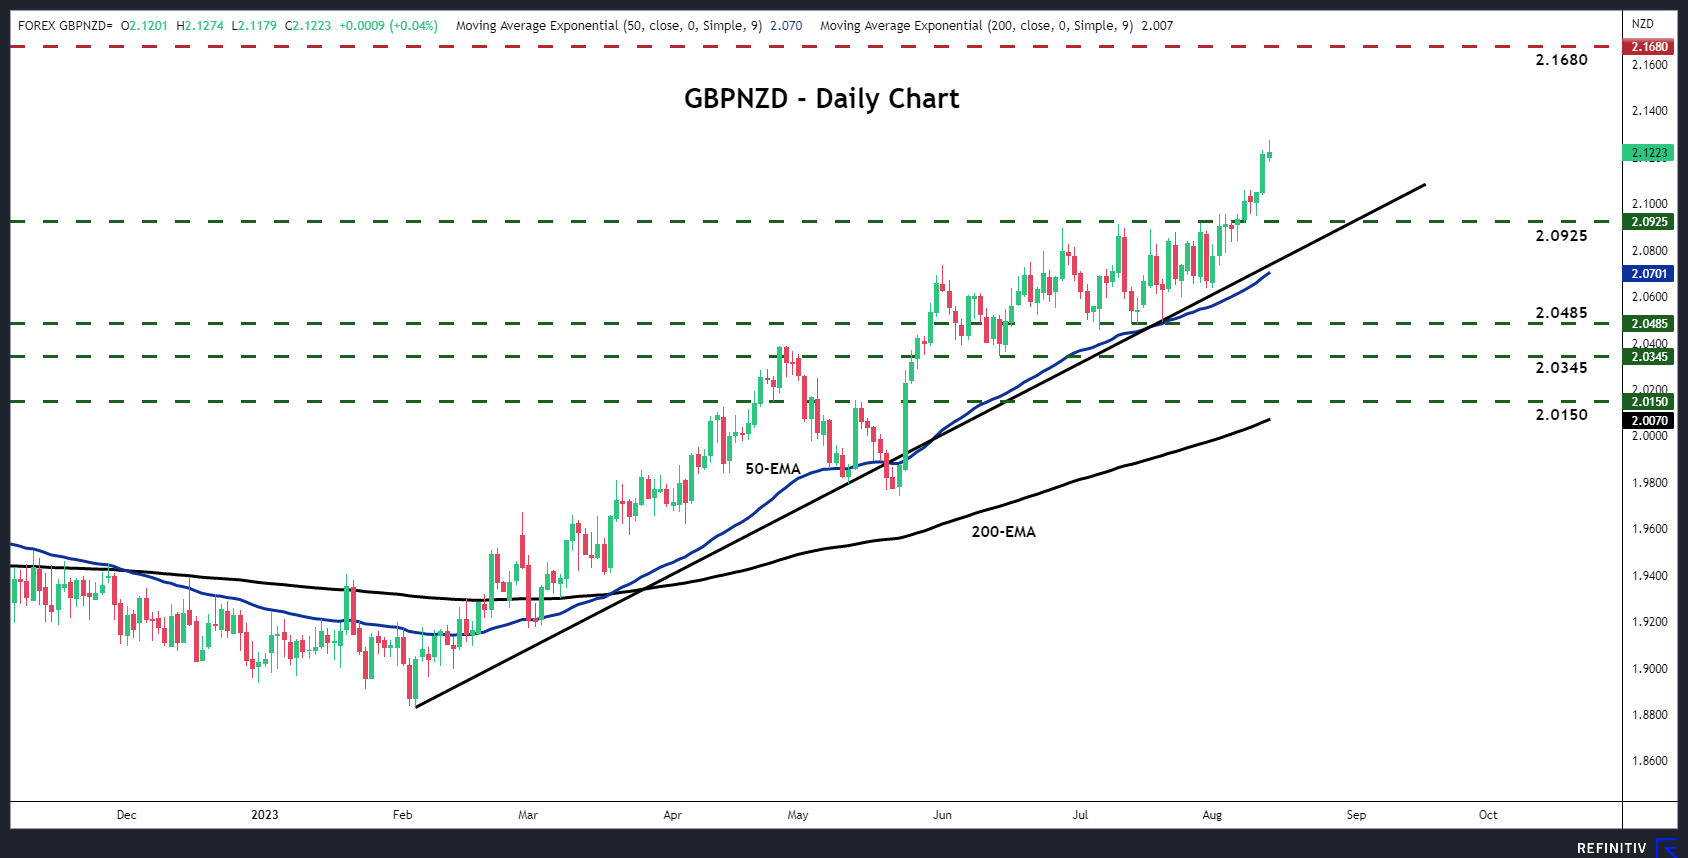
Just last week, pound/kiwi emerged above the key resistance (now turned into support) zone of 2.0925, signaling the continuation of the prevailing uptrend that’s been in place since the beginning of February. Even if the pair pulls back due to a miss in the UK inflation data, the bulls could recharge from near the 2.0925 zone and slowly take the action all the way up to the 2.1680 zone, marked by the high of March 9, 2020.
For the outlook to turn bearish, the pair may need to fall, not only below the uptrend line drawn from the low of February 3, but also below the key support zone of 2.0485. Such a move would confirm a lower low on the daily chart, perhaps setting the stage for declines towards the 2.0345 and 2.0150 territories.