Sample Category Title
USD/CNH: Time to Start Paying Attention to Yuan Again
- CNH (offshore yuan) eyes 2023 lows as property sector concerns drive contagion fears
- China’s top Wealth Manager misses payment
- Country Garden suspends trading on onshore bonds
The offshore yuan is becoming a trade that more people are starting to pay attention to on Wall Street. The outlook for China is turning rather bleak and that has made the yuan short an easy trade for some traders. China was expected to hit 5% growth this year and that still could happen even with the property sector weighing on sentiment as the base effects will help the data. The concern for many traders is that it seems like China might not be able to grow above that 5% level in the next year and that could have severe ramifications for global growth expectations.
Over the weekend, the spotlight fell on China’s real estate market. Country Garden, one of China’s top property developers, suspended trading in 11 of its onshore bonds. Everyone is expecting restructuring as they are too important for China to allow them to default. The other big story was that Zhongzhi Enterprise Group, one of China’s largest private wealth managers missed payments on multiple high-yield investment products. This financial entity manages 1 trillion yuan ($138 billion), which makes it a big player in the commercial and investment banking, and also private equity and wealth management.
It seems fears for the property sector and shadow banking are taking centerstage and this should put contagion fears back on the table for China’s broader economy.
USD/CNH Chart
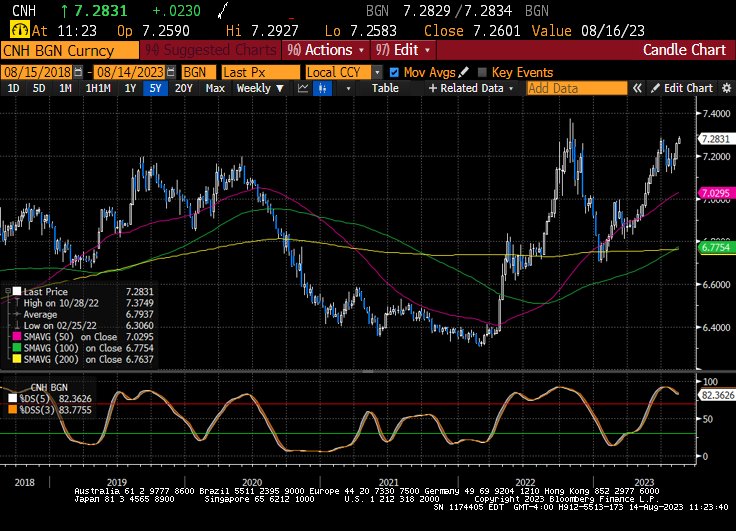
The USD/CNH (offshore yuan) may extend to 7.40 by end of year as it continues its bullish trend. The pressure is building for the Chinese government to deliver more stimulus and that could be the big risk on betting against the yuan. If this bullishness continues, initial resistance may come from the 7.30 level. To the downside, we could see this bullish move higher stall if Chinese slowdown fears ease. If optimism returns that the mainland economy will hold up, the yuan could rally towards the 7.10 region.
GBPCHF Wave Analysis
- GBPCHF reversed from support level 1.1100
- Likely to rise to resistance level 1.1175
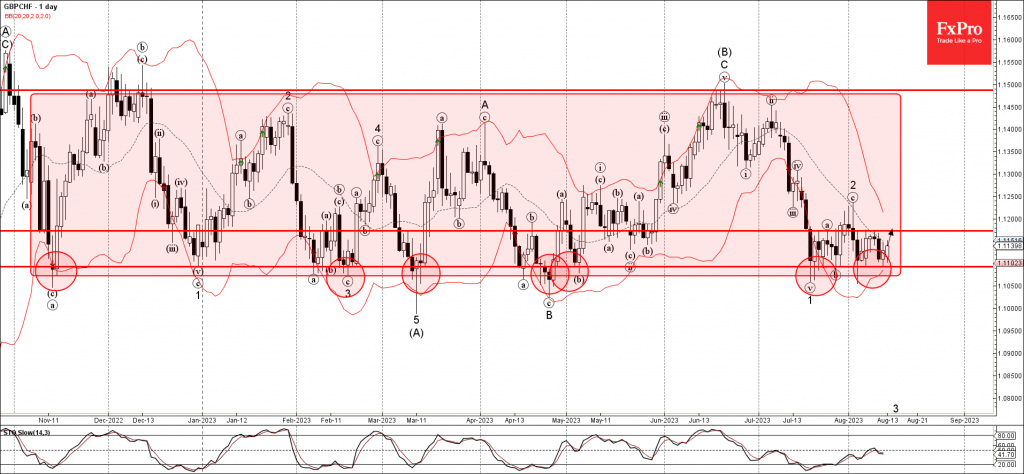
GBPCHF currency pair recently reversed up from the key support level 1.1100 (which is the lower boundary of the wide sideways price range from November).
The support level 1.1100, which has been repeatedly reversing the pair for the last few months ( having stopped the earlier waves 1 and b) was strengthened by the lower daily Bollinger Band.
Given the strength of the support level 1.1100, GBPCHF can be expected to rise further toward the next resistance level 1.1175, which has been reversing the price from July.
USDJPY Wave Analysis
- USDJPY broke resistance level 144.85
- Likely to rise to resistance level 148.00
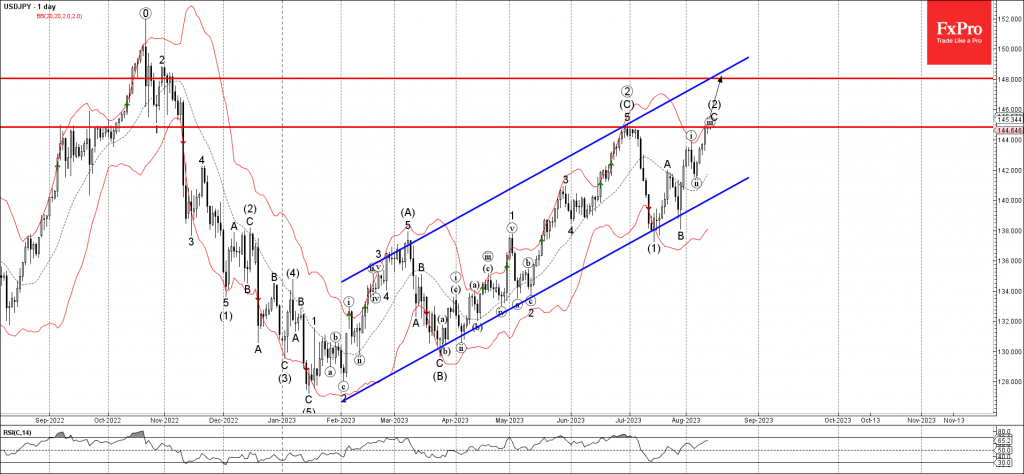
USDJPY currency pair recently broke the resistance level 144.85 (previous multi-month high from July, which stopped the previous wave C).
The breakout of the resistance level 144.85 accelerated the C-wave of the active ABC correction (2) from the start of July.
Given the clear daily uptrend, USDJPY can be expected to rise further toward the next resistance level 148.00 (target price for the completion of the active impulse wave C).
Japanese Yen Hits 9-month Low
-
- Japanese yen dips below 145 line
- Japan’s GDP expected to expand by 3.2%
- US retail sales projected to rise by 0.4%
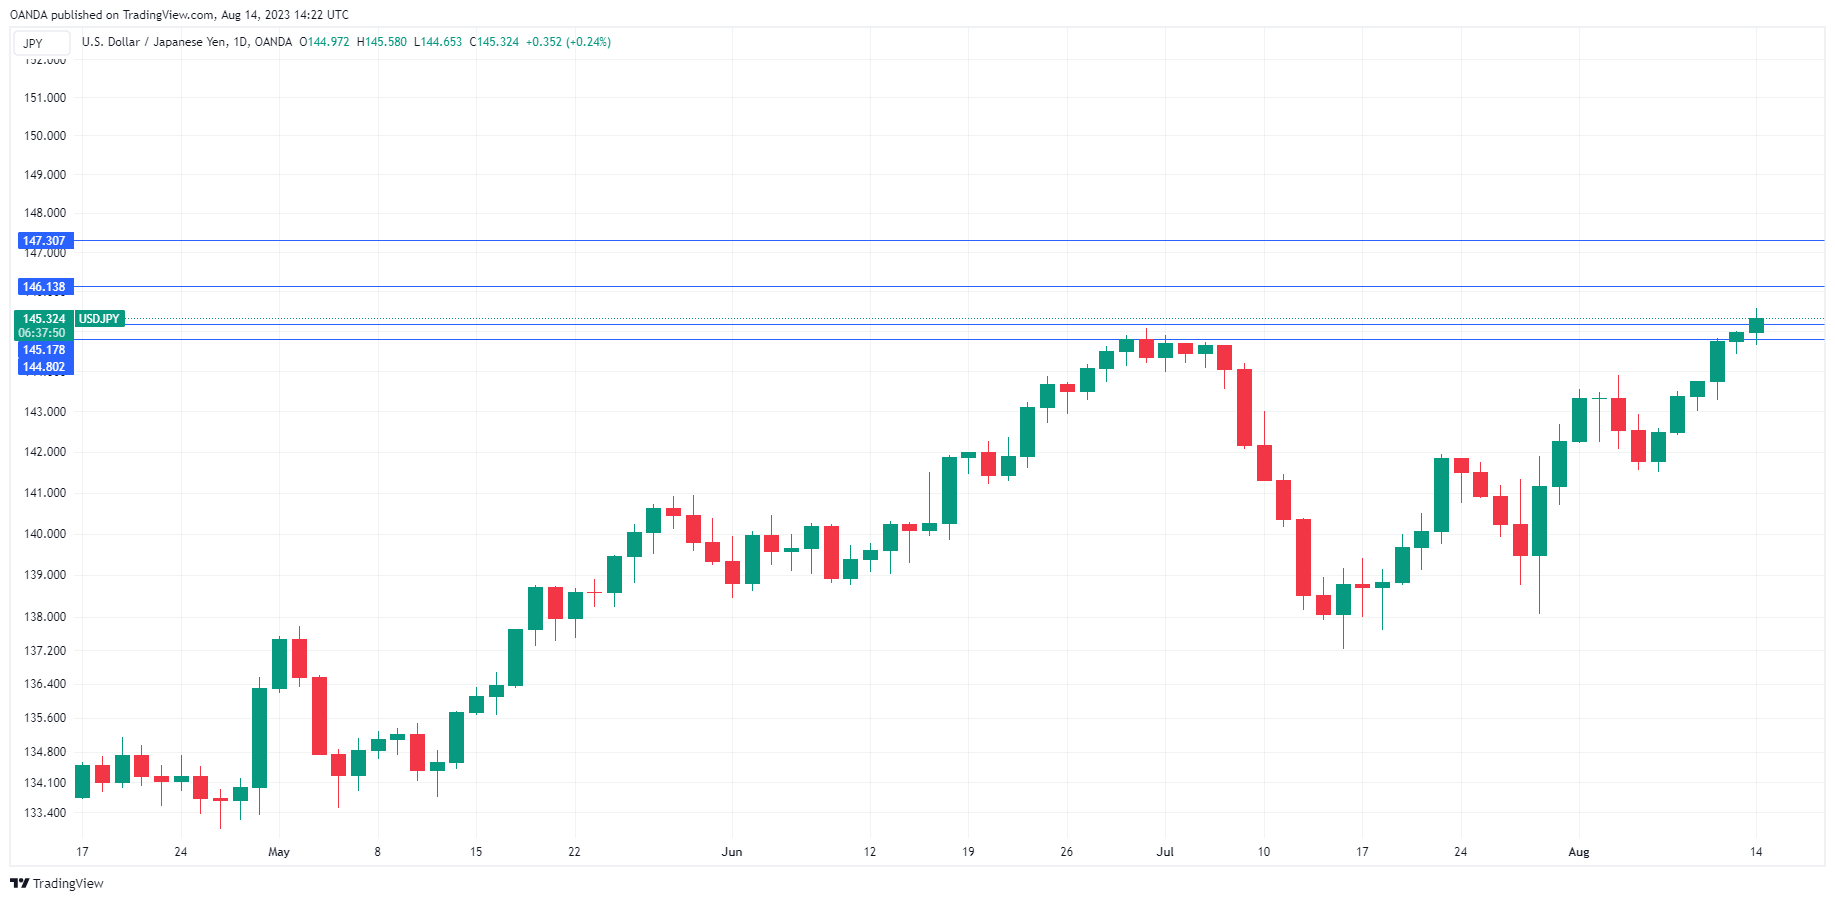
The Japanese yen continues to slide. USD/JPY touched the symbolic 145 line on Friday and has moved higher on Monday. In the North American session, USD/JPY is trading at 145.37, up 0.27%.
The yen had its worst week of the year, falling 2.26%, and dropped on Monday as low as 145.58, its lowest level since November 2022. Investors haven’t forgotten the currency interventions late in 2022 that shocked the markets and sent the yen higher, albeit only briefly. At the time, the yen had fallen below 150, which proved to be a line in the sand for the Ministry of Finance (MOF).
The yen may not be currently at 150, but there’s no doubt that the yen’s sharp deterioration in just a few weeks is making policy makers nervous – just one month ago, USD/JPY was trading around 138. The MOF and the Bank of Japan have said in the past that they are most concerned with sharp swings in the exchange rate and not so much with a particular value for the yen. If the sharp deterioration in the yen continues, we could see another dramatic currency intervention by the MOF.
Japan starts off the week with Preliminary GDP for Q2 on Tuesday. The economy is expected to have expanded by 3.2% y/y, up from 2.7% in the first quarter. There has been some improvement in domestic demand and if that trend continues, there will be more pressure on the Bank of Japan to shift away from its ultra-loose monetary policy.
The US economy remains in solid shape despite the Fed’s aggressive rate-hike cycle. Retail sales for July will be released on Tuesday. Headline retail sales and the core rate are both expected to accelerate to 0.4% m/m in July, up from 0.2% in June. This would signal resilient consumer spending as inflation continues to fall.
USD/JPY Technical
- There is resistance at 146.13 and 147.31
- 145.17 is providing support, followed closely by 144.79
EURUSD Stuck Awaiting FED’s Actions
This Monday, 14 August, the major currency pair is hovering near 1.0940.
The market is focused on the future actions of the Federal Reserve System. Last weekend, major US investment houses made their forecasts on the prospects of the interest rate. The Federal Reserve is expected to start bringing the rate down by June 2024, making quarterly decreases from then on. It means that inflation is forecast to reach the target mark of 2% by that moment.
It is a curious position that coincides with the actual state of affairs.
This week, the Fed will publish the minutes of its latest meeting. In them, as usual, market participants will be looking for hints and indications of the reasons and facts on which the regulator will base its September interest rate decisions.
Technical analysis of EUR/USD currency pair:
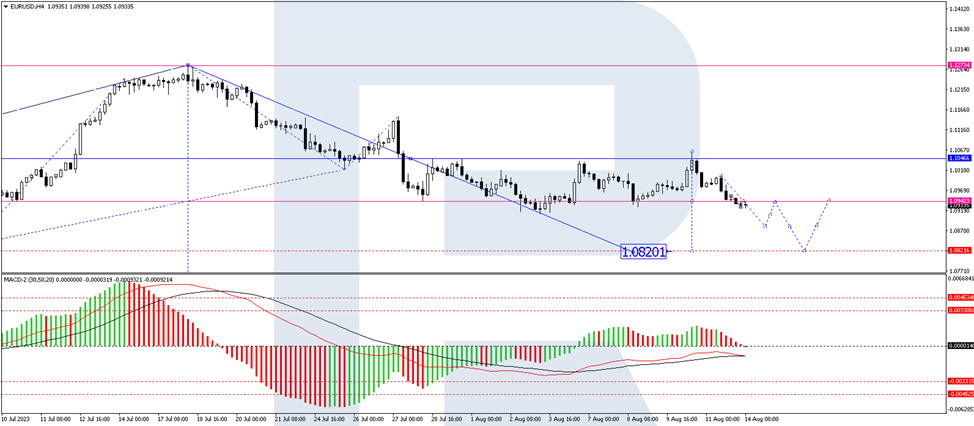
On the H4 chart, EURUSD performed a corrective wave to the 1.1064 level, where a new decline started. Today, the market reached 1.0940. At the moment, a consolidation range is forming around this mark. The price is expected to break downwards, heading for 1.0880, after which it might rise to 1.0940 (testing this level from below). Next, a decline to 1.0820 could follow. It is the first target. Technically, the MACD, whose signal line is below zero, could confirm such a scenario. The indicator is expected to go on declining to new lows.
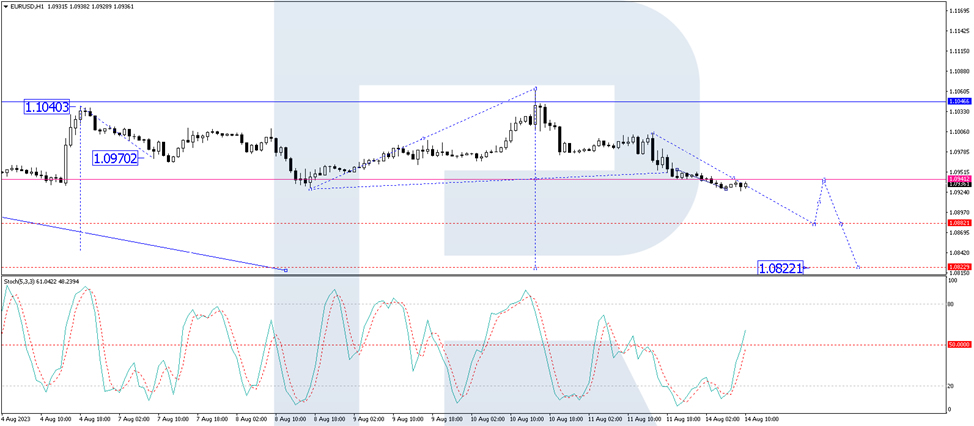
On the H1 chart, EURUSD is forming a consolidation range around 1.0940. Escaping it upwards, the price could start a correction link to 1.0966 and drop to 1.0880 later. It is a local target. Technically, this scenario is confirmed by the Stochastic oscillator, whose signal line has broken the 20 mark upwards and continues growing to 50. The line is expected to rebound from this mark and fall to 20.
GBP/USD Mid-Day Outlook
Daily Pivots: (S1) 1.2660; (P) 1.2700; (R1) 1.2733; More...
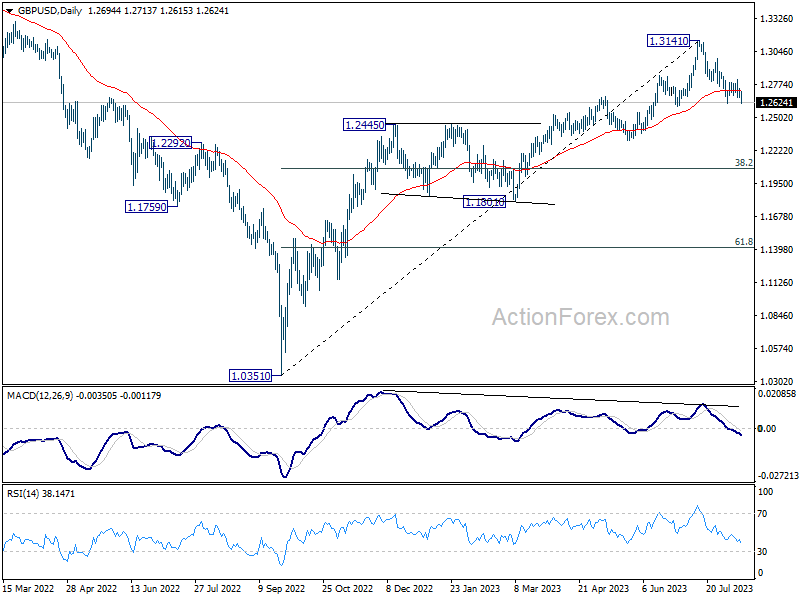
Immediate focus is now on 1.2618 support in GBP/USD with today's fall. Firm break of 1.2618, and sustained trading below 1.2678 resistance turned support will argue that it's already in a larger correction. Deeper decline would then be seen to 1.2306 support next. Nevertheless, break of 1.2817 minor resistance will indicate that the pull back has completed, and turn bias back to the upside for stronger rebound.
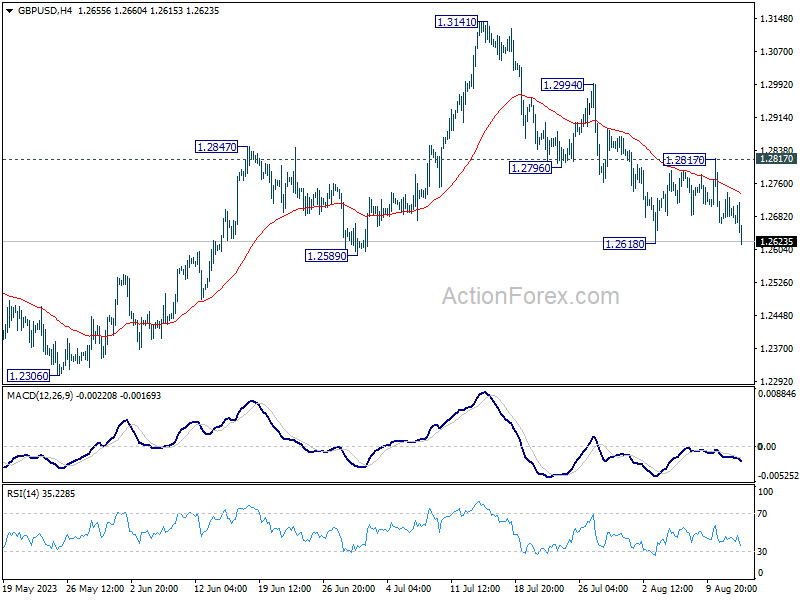
In the bigger picture, a medium term top could be in place at 1.3141 already, on bearish divergence condition in D MACD. Sustained trading below 55 D EMA (now at 1.2725) should confirm this case, and bring deeper fall to 38.2% retracement of 1.0351 to 1.3141 at 1.2075, as a correction to up trend from 1.0351 (2022 low). For now, rise will stay mildly on the downside as long as 1.3141 resistance holds, in case of strong rebound.
USD/CHF Mid-Day Outlook
Daily Pivots: (S1) 0.8740; (P) 0.8760; (R1) 0.8785; More....
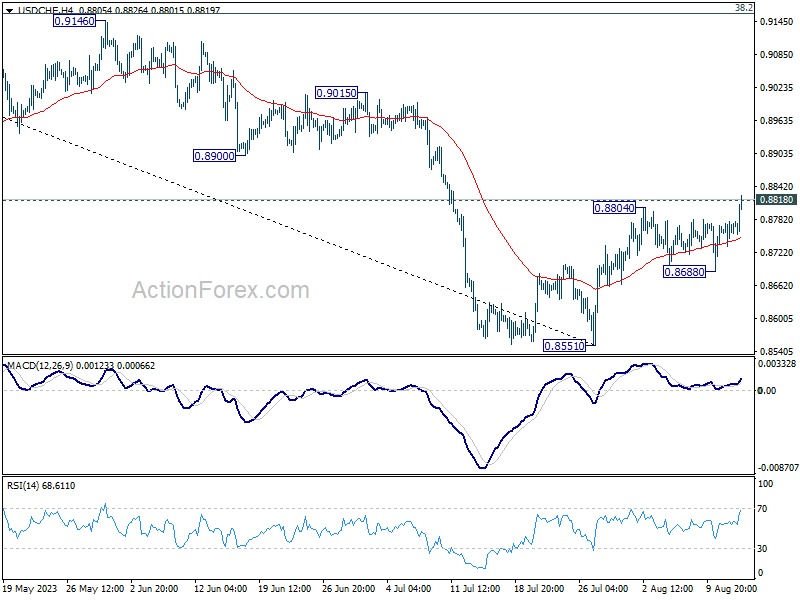
USD/CHF's rebound from 0.8851 resume today and intraday bias is back on the upside. Sustained trading above 0.8818 support turned resistance will carry larger bullish implication. Further rally should then be seen to 0.9146 cluster resistance next. For now, outlook will stay cautiously bullish as long as 0.8688 support holds, in case of retreat.
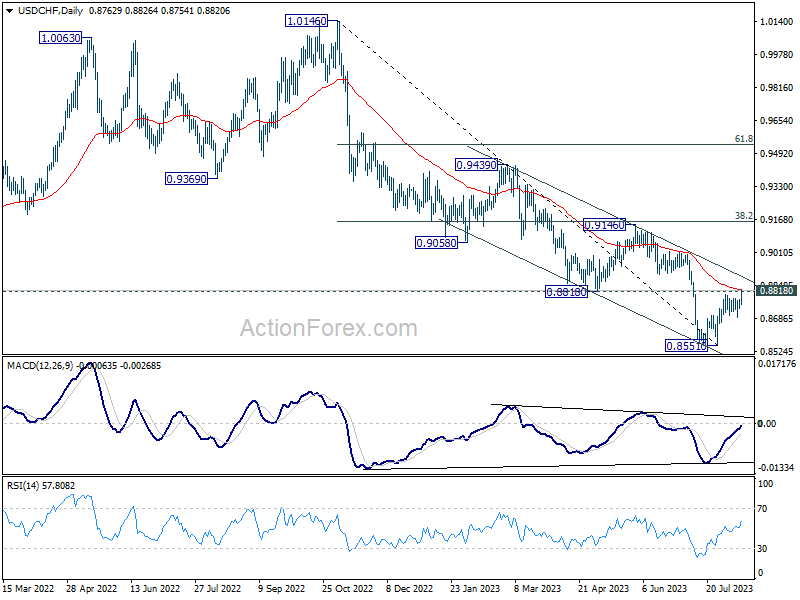
In the bigger picture, A medium term bottom could be in place at 0.8551 already, on bullish convergence condition in D MACD. Sustained trading above 0.8818 will bring further rise to 0.9146 cluster resistance (38.2% retracement of 1.0146 to 0.8551 at 0.9160), even as a correction. Nevertheless, break of 0.8851 will resume the down trend from 1.0146 instead.
USD/JPY Mid-Day Outlook
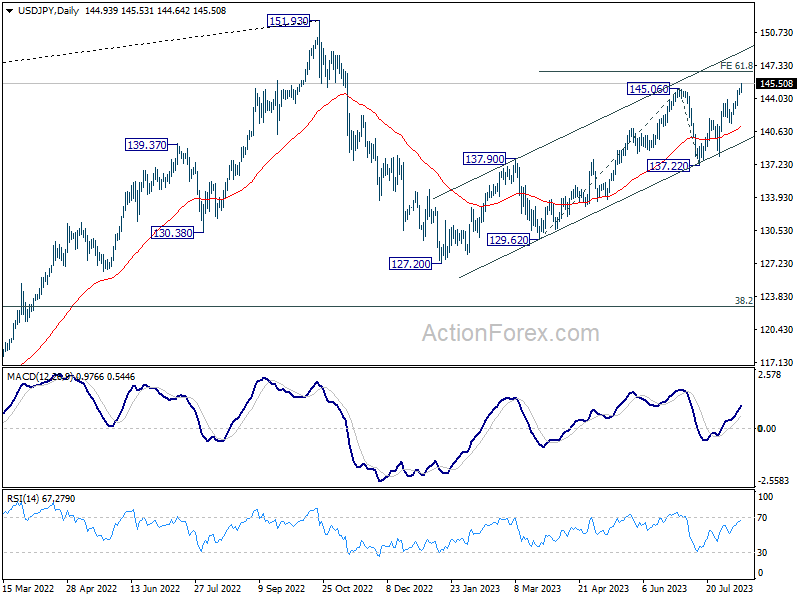
Daily Pivots: (S1) 144.59; (P) 144.79; (R1) 145.17; More...
Intraday bias in USD/JPY remains on the upside as rise from 127.20 is extending. Next target is 61.8% projection of 129.62 to 145.06 from 137.22 at 146.76. On the downside, below 144.40 minor support will turn intraday bias neutral and bring consolidations first, before staging another rally.
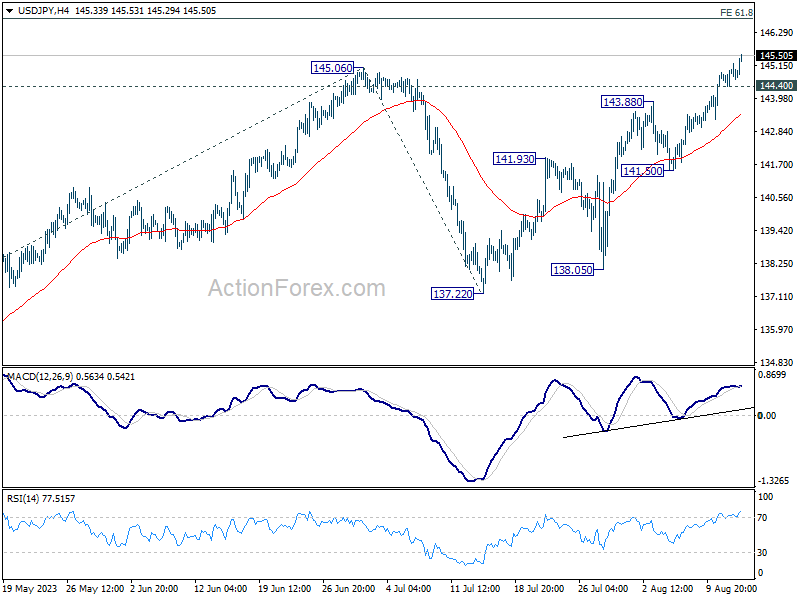
In the bigger picture, overall price actions from 151.93 (2022 high) are views as a corrective pattern. Rise from 127.20 is seen as the second leg of the pattern and could still be in progress. But even in case of extended rise, strong resistance should be seen from 151.93 to limit upside. Meanwhile, break of 137.22 support should confirm the start of the third leg to 127.20 (2023 low) and below.
EUR/USD Mid-Day Outlook
Daily Pivots: (S1) 1.0926; (P) 1.0965; (R1) 1.0988; More...
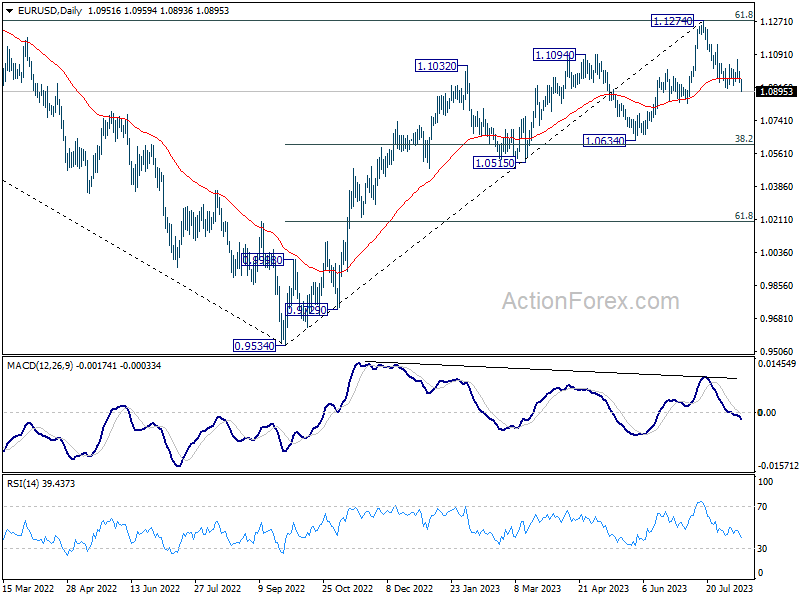
Break of 1.0911 support indicates resumptions of fall from 1.1274. Intraday bias in EUR/USD is back on the downside for 1.0832 support. Sustained trading below there will target 1.0609/34 cluster support. On the upside, break of 1.1064 resistance is needed to indicate completion of the fall. Otherwise, outlook will stay cautiously bearish in case of recovery.
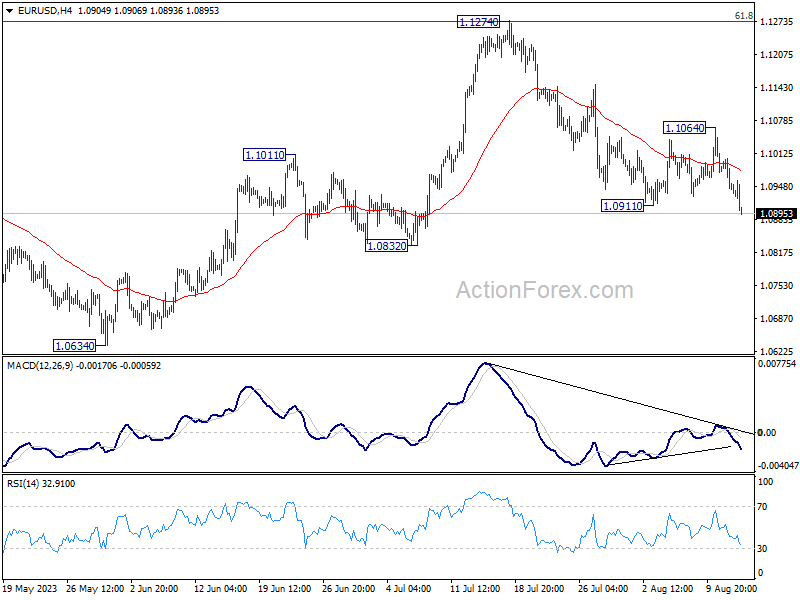
In the bigger picture, a medium term top could be formed at 1.1274, after failing to break through 61.8% retracement of 1.2348 (2021 high) to 0.9534 at 1.1273 decisively, on bearish divergence condition in D MACD. Sustained trading below 55 D EMA (now at 1.0966) will bring deeper correction to 1.0634 cluster support (38.2% retracement of 0.9534 to 1.1274 at 1.0609). Strong support could be seen there, at least on first attempt, to set the range for consolidation.