Sample Category Title
Crude Oil Price Surges To $80, Fed Decision Next
Key Highlights
- Crude oil price started a fresh increase above the $75 resistance.
- A key bullish trend line is forming with support near $77.70 on the 4-hour chart.
- EUR/USD is consolidating near the 1.1050 pivot level.
- The Fed interest rate decision is scheduled today (forecast 5.5%, versus 5.25% previous).
Crude Oil Price Technical Analysis
Crude oil price formed a base above the $72 level against the US Dollar. The price started a fresh increase and was able to clear a major hurdle at $73.50.
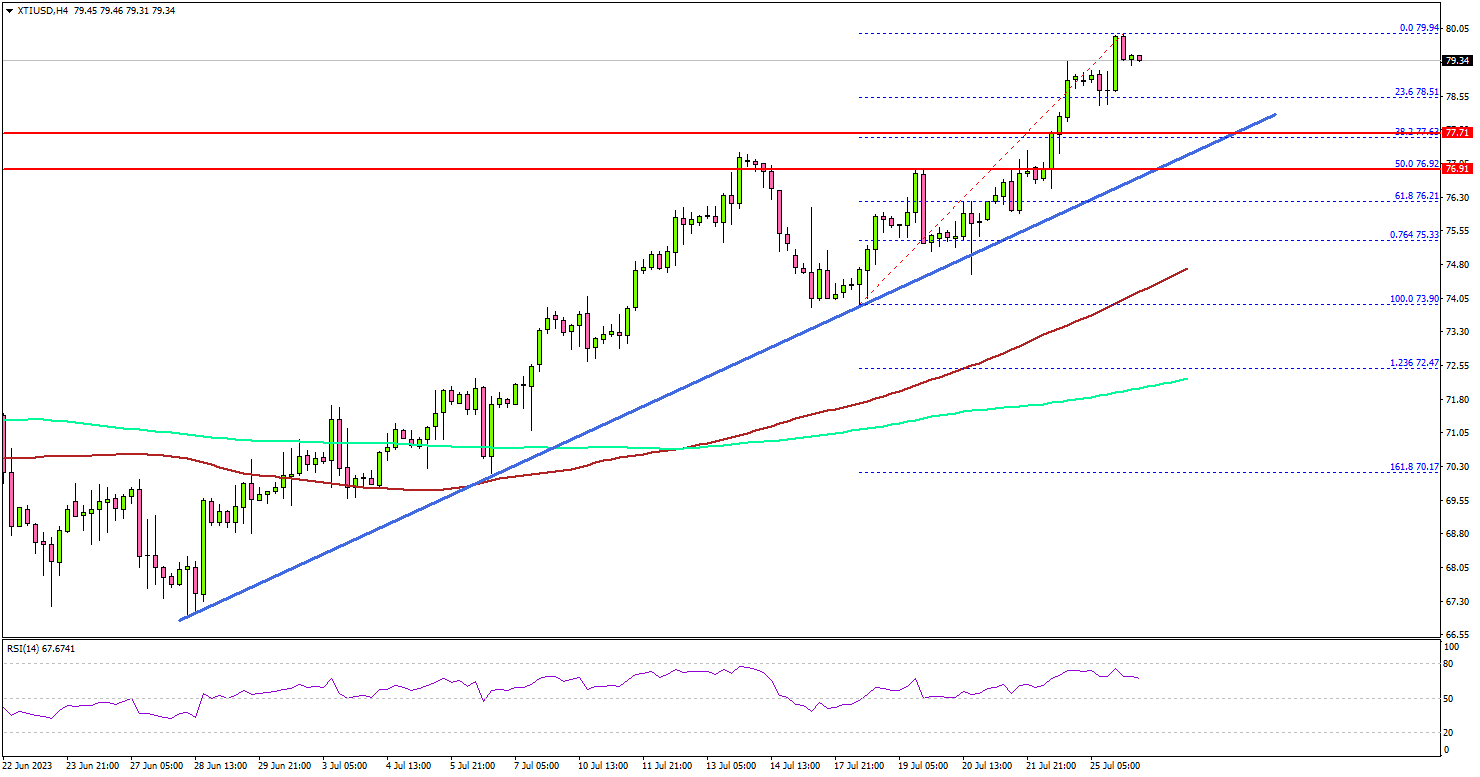
Looking at the 4-hour chart of XTI/USD, the price settled above the $75 level, the 100 simple moving average (red, 4-hour), and the 200 simple moving average (green, 4-hour).
The bulls even pushed the price toward the $80 resistance. A high is formed near $79.94 and the price is still showing bullish signs. On the downside, initial support is near the $78.50 level. The next major support sits near the $77.70 level.
There is also a key bullish trend line forming with support near $77.70 on the same chart. Any more losses might call for a test of the $75 support zone in the coming days.
On the upside, the first major resistance is near the $80 level. The next major resistance is near the $81.20 level, above which the price may perhaps accelerate higher. In the stated case, it could even revisit the $82.50 resistance.
Looking at EUR/USD, the pair started a downside correction below the 1.1150 level and is now consolidating near 1.1050.
Economic Releases to Watch Today
- US New Home Sales for June 2023 (MoM) – Forecast 4.2% versus 12.2% previous.
- Fed Interest Rate Decision - Forecast 5.5%, versus 5.25% previous.
IMF urges Japan to start preparing for rate hikes
IMF Chief Economist Pierre-Olivier Gourinchas shared his views on Japan's economy highlighting that the risks related to inflationary pressures likely lean towards the upside. He urged BoJ to start preparing for increasing interest rates.
Addressing Japan's monetary stance, Gourinchas stated, "Our advice for Japanese authorities there is that right now, monetary policy can remain accommodative, but it needs to prepare itself for the need to maybe start hiking." Furthermore, he suggested that Japan should consider flexibility in its monetary policy, "maybe move away from the yield-curve control that it has now."
In its updated World Economic Outlook report, IMF projected a 1.4% expansion for Japan's economy in 2023, up from a 1.0% rise last year, primarily driven by boost in consumption as pandemic restrictions are lifted. However, growth is anticipated to slow to 1.0% in 2024 as the impact of past stimulus measures wanes.
Australian Q2 CPI records slowest quarterly rate since Q3 2021, annual inflation eases again
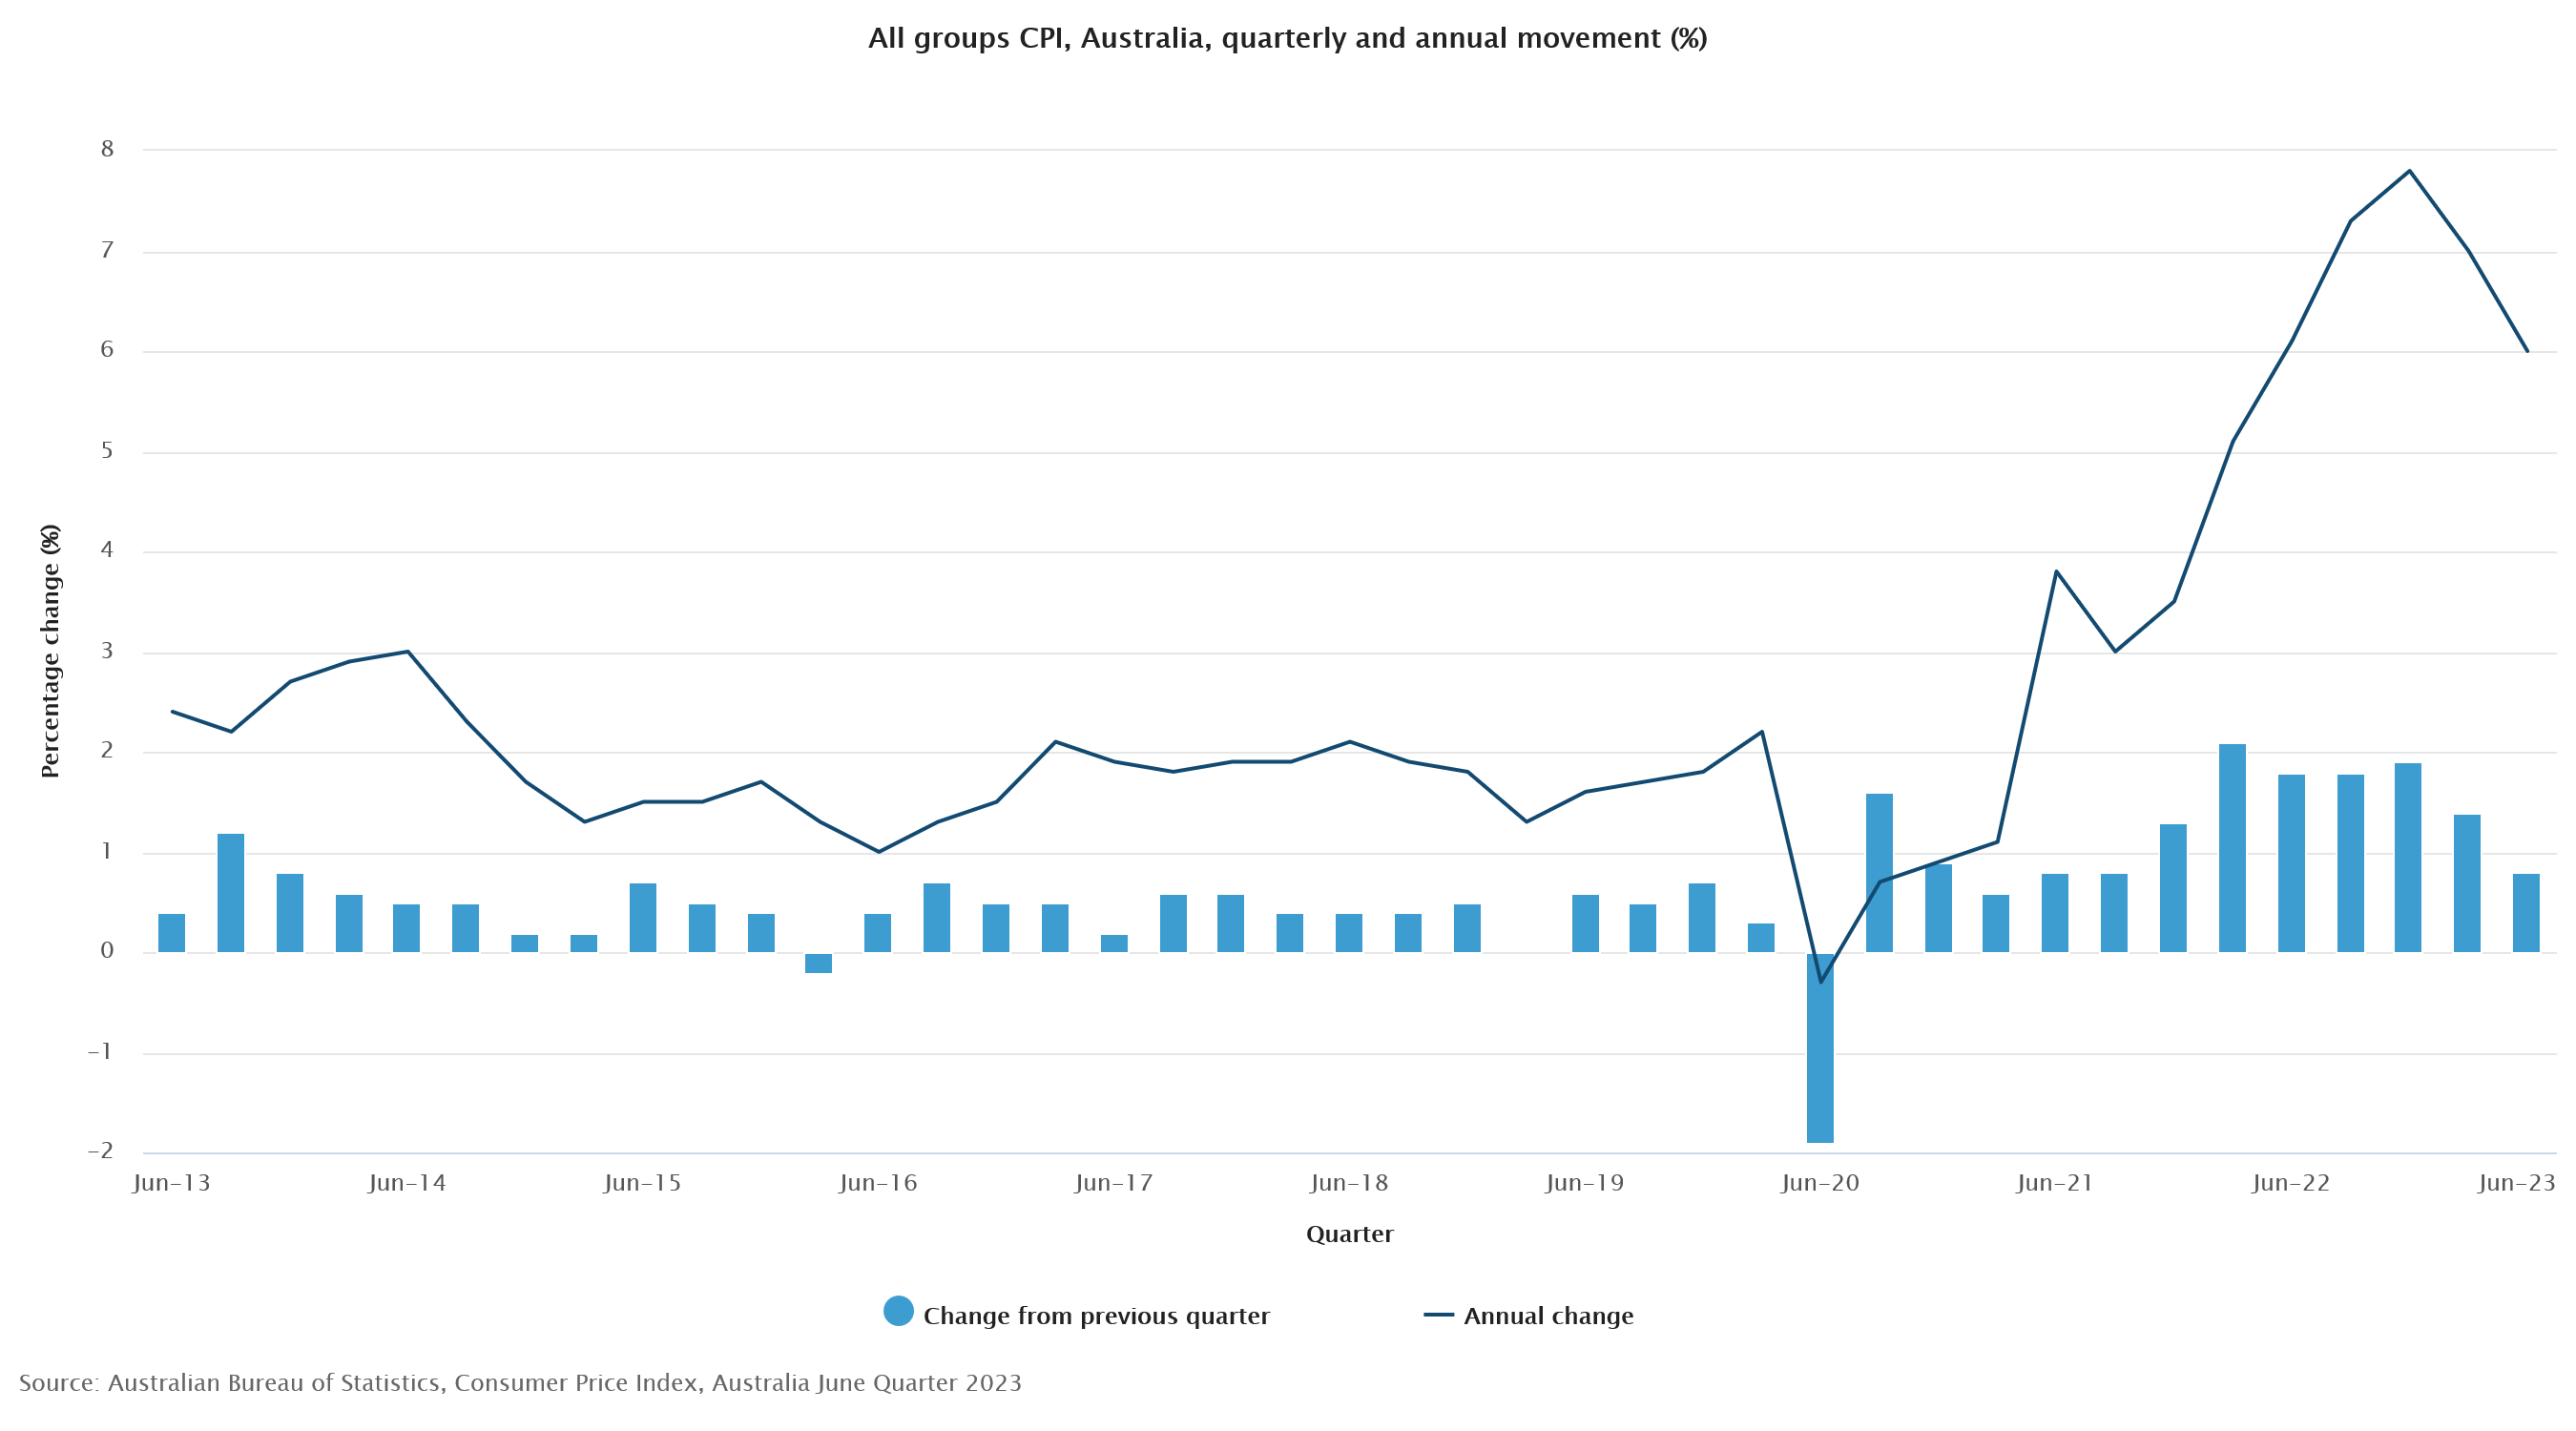
In Q2, Australia's CPI decelerated from 1.4% qoq to 0.8% qoq, coming in below the expected 1.0% qoq. This marked the lowest quarterly rate since Q3 2021. Year-on-year, CPI eased from 7.0% to 6.0%, falling short of anticipated 6.2% yoy. Annual inflation rate has been on a downtrend for two consecutive quarters since peaking at 7.8% in Q4 2022.
RBA's trimmed mean CPI registered at 0.9% qoq and 5.9% yoy, which were below forecast of 1.1% qoq and 6.0% yoy respectively. While CPI for goods slowed from 7.6% yoy to 5.8% yoy, CPI for services rose from 6.1% yoy to 6.3% yoy, hitting its highest level since 2001.
Michelle Marquardt, ABS head of prices statistics, noted the shift in inflationary drivers, stating, "This is the first time since September 2021 that services inflation has been higher than goods, highlighting the change from 12 months ago when goods like new dwellings and automotive fuel were driving inflation. Now price increases for a range of services like rents, restaurant meals, child-care and insurance are keeping inflation high."
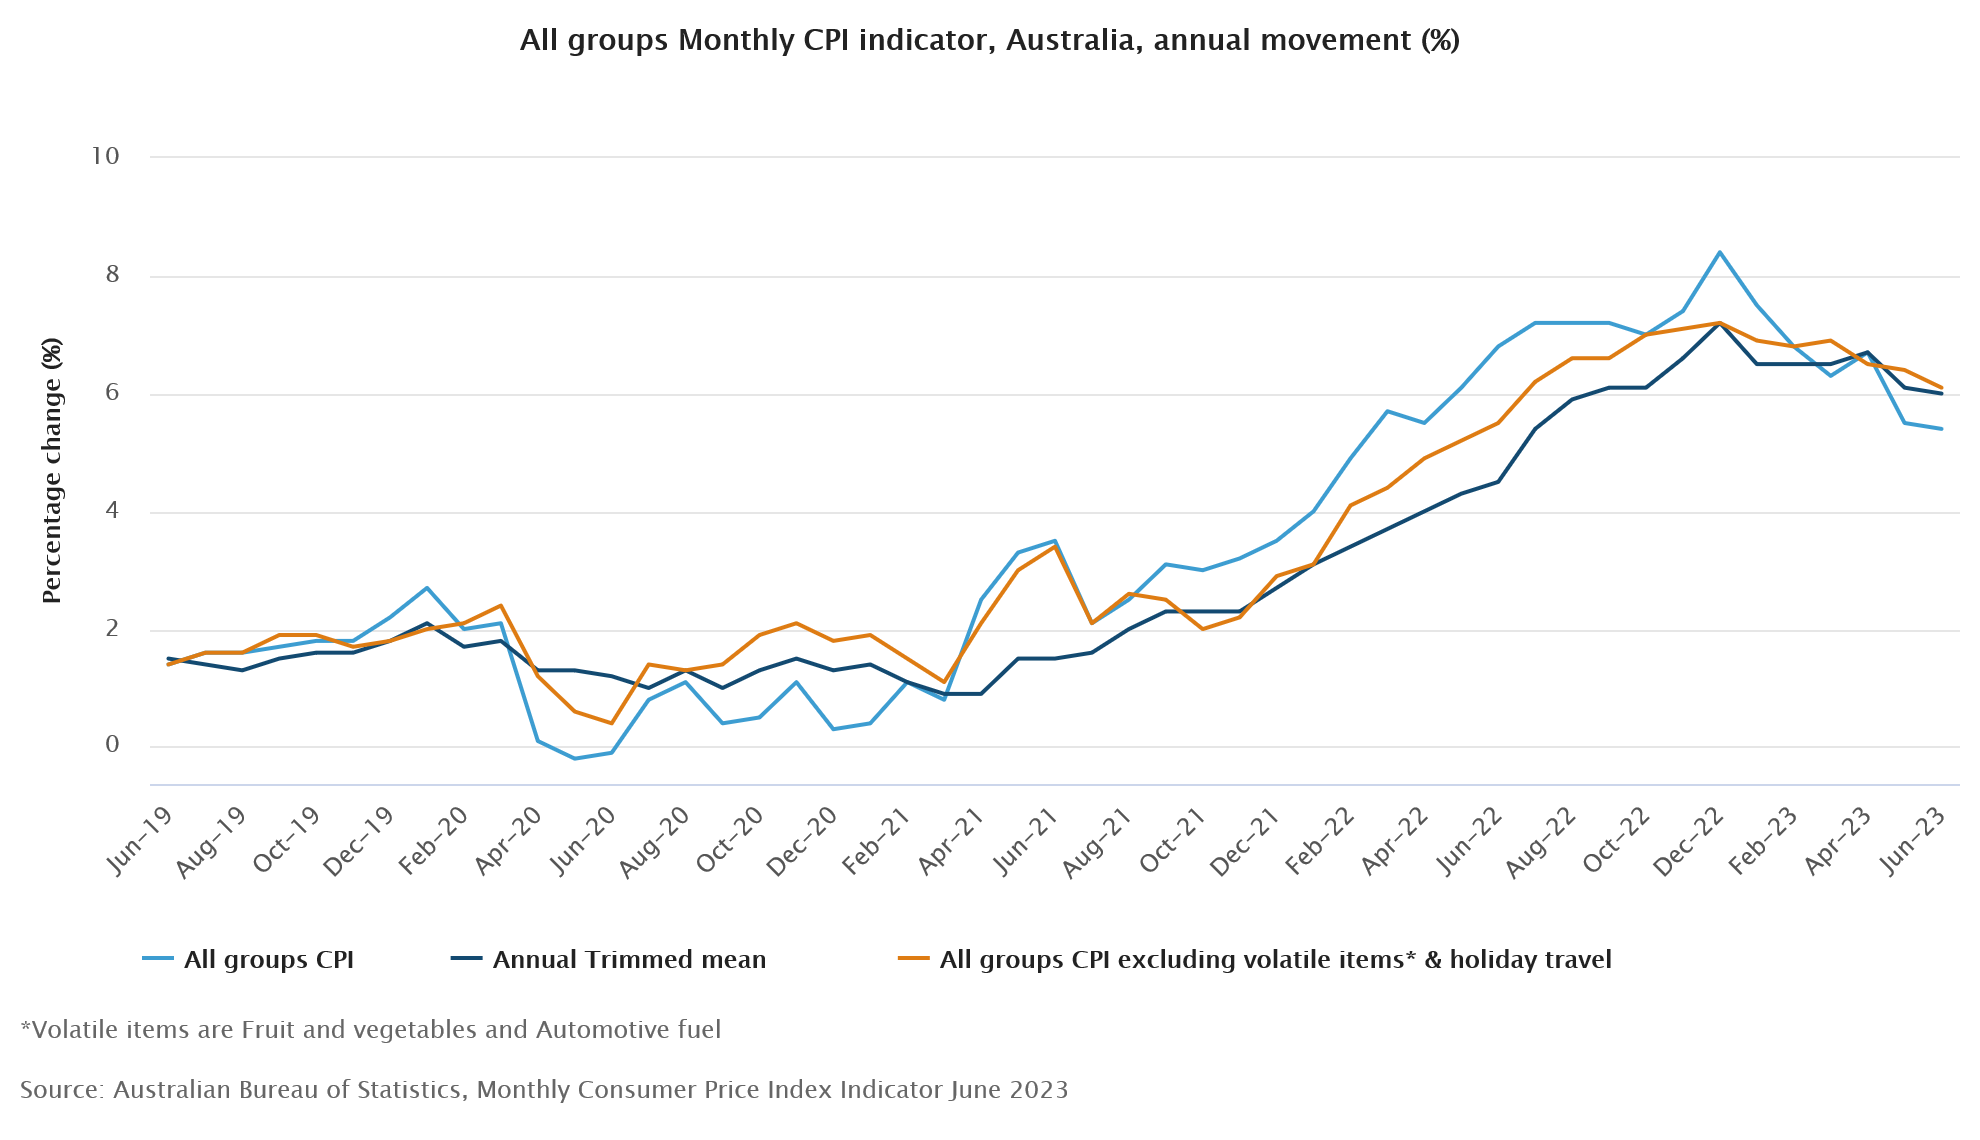
In June, monthly CPI slipped from 5.5% yoy to 5.4% yoy, in line with expectations. CPI excluding volatile items and holiday travel eased from 6.4% yoy to 6.1% yoy, and trimmed mean CPI fell from 6.1% yoy to 6.0% yoy.
Hedge funds Sell USD ahead of the FOMC meeting
Recently, gold prices settled by -0.41% at 59309 as the dollar and bond yields rose. However, hopes for a pause in US rate hikes limited the decline after the July meeting of the Federal Reserve. The unexpected drop in new claims for unemployment benefits in the US also contributed to the market sentiment.
Physical gold demand in India stalled due to monsoon rains and higher domestic prices, while in China, bullion was sold at high premiums. Indian dealers offered discounts of up to $6 an ounce over official domestic prices, and in China, gold changed hands at premiums of $9 to $17 an ounce. Swiss gold exports fell 23% in June due to lower shipments to China and India. Let’s take a look at the technical analysis.
US Dollar - D1 Timeframe
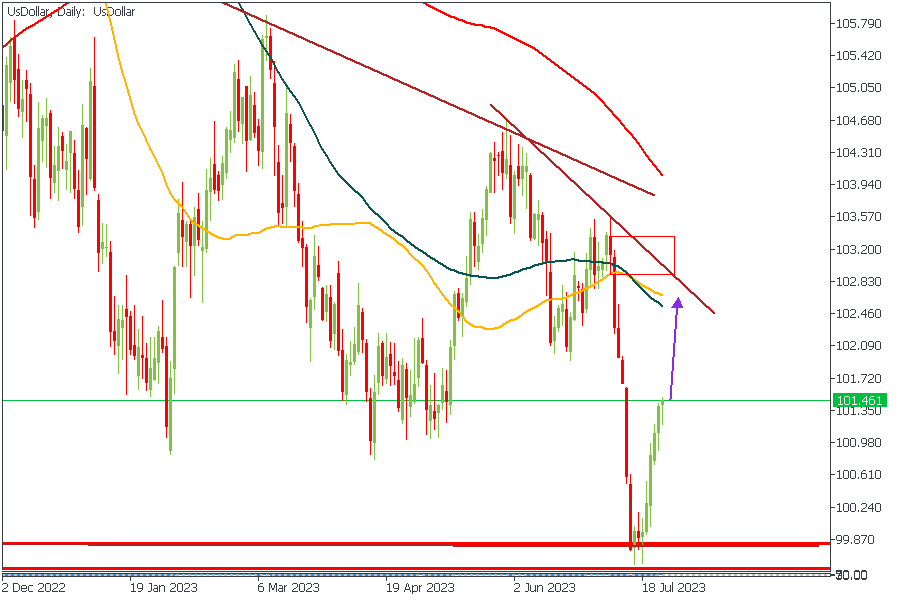
The US Dollar ended the last week with a bullish run all through the week, in a move that seems to be set to continue even further. We see the price sharply pull away from the demand zone on the charts as it heads toward the 50 and 100-period moving averages. The implication is that we are bound to see the bullish move continue until it finds a credible resistance from the moving averages and resistance trendline.
Analyst’s Expectations:
- Direction: Bullish
- Target: 102.381
- Invalidation: 101.174
EURUSD - D1 Timeframe
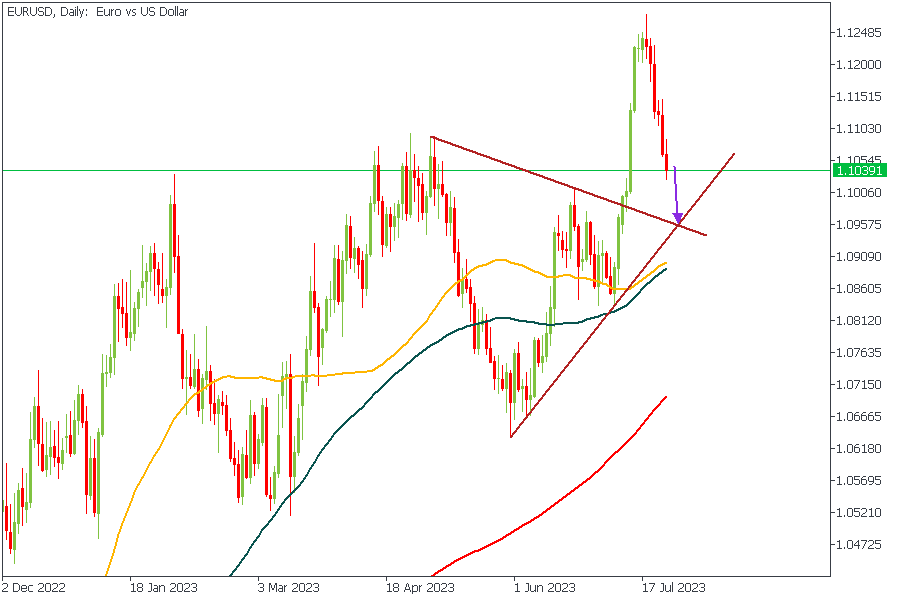
The price action on EURUSD has recently broken out of the wedge and seems to be heading toward the trendline and moving averages in search of support. It is important to note the bullish array of the moving averages to indicate what is most likely to occur once the price reaches the support area. In the meantime, we remain bearish.
Analyst’s Expectations:
- Direction: Bearish
- Target: 1.09637
- Invalidation: 1.10901
GBPUSD - D1 Timeframe
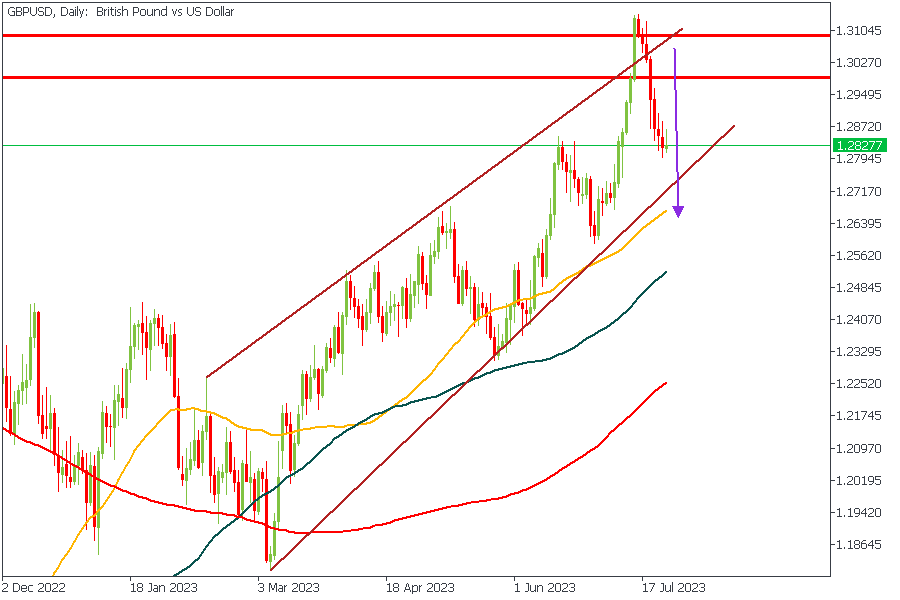
GBPUSD made a huge dump from the pivot supply zone on the daily timeframe. However, the current state of the price action suggests that the price may be heading for the support trendline with a confluence from the 50-period moving average. The trend remains bullish, though, so it would be smart to exercise a sizable degree of risk management on this idea.
Analyst’s Expectations:
- Direction: Bearish
- Target: 1.27373
- Invalidation: 1.28905
CONCLUSION
The trading of CFDs comes at a risk. Thus, to succeed, you have to manage risks properly. To avoid costly mistakes while you look to trade these opportunities, be sure to do your due diligence and manage your risk appropriately.
EURCHF Wave Analysis
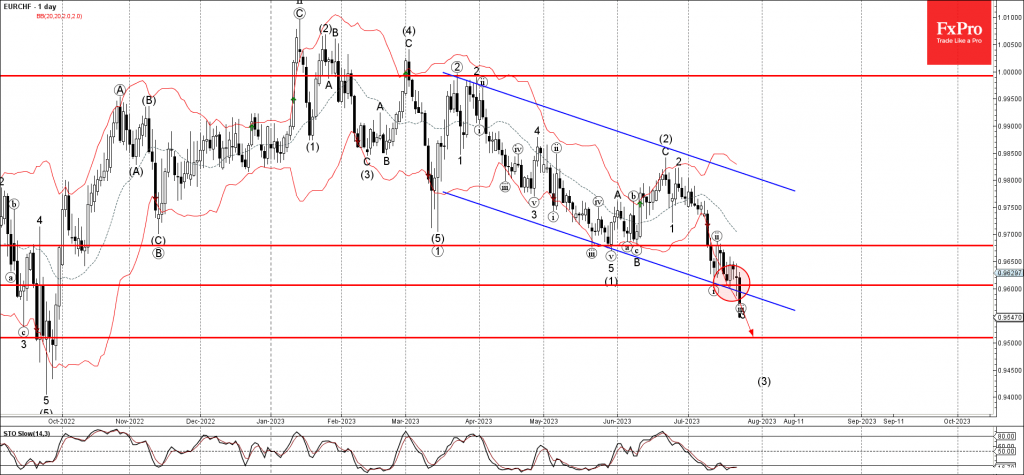
- EURCHF broke support zone
- Likely to fall to support level 0.9500
EURCHF currency pair earlier broke the support zone lying between the key support level 0.9600 (which reversed the pair earlier this month) and the support trendline of the the daily down channel from March.
The breakout of this support zone accelerated the active impulse waves iii and (3).
Given the clear multi-month downtrend, EURCHF can be expected to fall further toward the next major support level 0.9500 (which reversed the price multiple times in last September).
EURGBP Wave Analysis
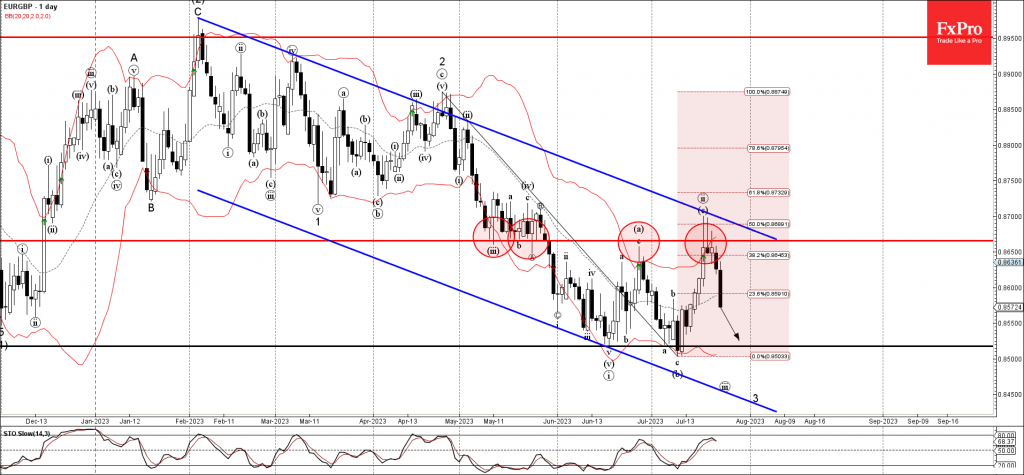
- EURGBP reversed from resistance level 0.8665
- Likely to fall to support level 0.8520
EURGBP currency pair recently reversed down from the key resistance level 0.8665, former support from May, strengthened by the daily down channel from February and the 50% Fibonacci correction of the downward impulse from April.
The downward reversal from the resistance level 0.8665 stopped the previous short-term correction ii.
Given the clear daily downtrend and the strongly bearish euro sentiment, EURGBP can be expected to fall further toward the next support level 0.8520 (which has been reversing the price from June).
AUD/USD Jumps Ahead of Australian Inflation
- Australian inflation expected to slow in Q2
- US consumer confidence jumps
- AUD/USD rises sharply
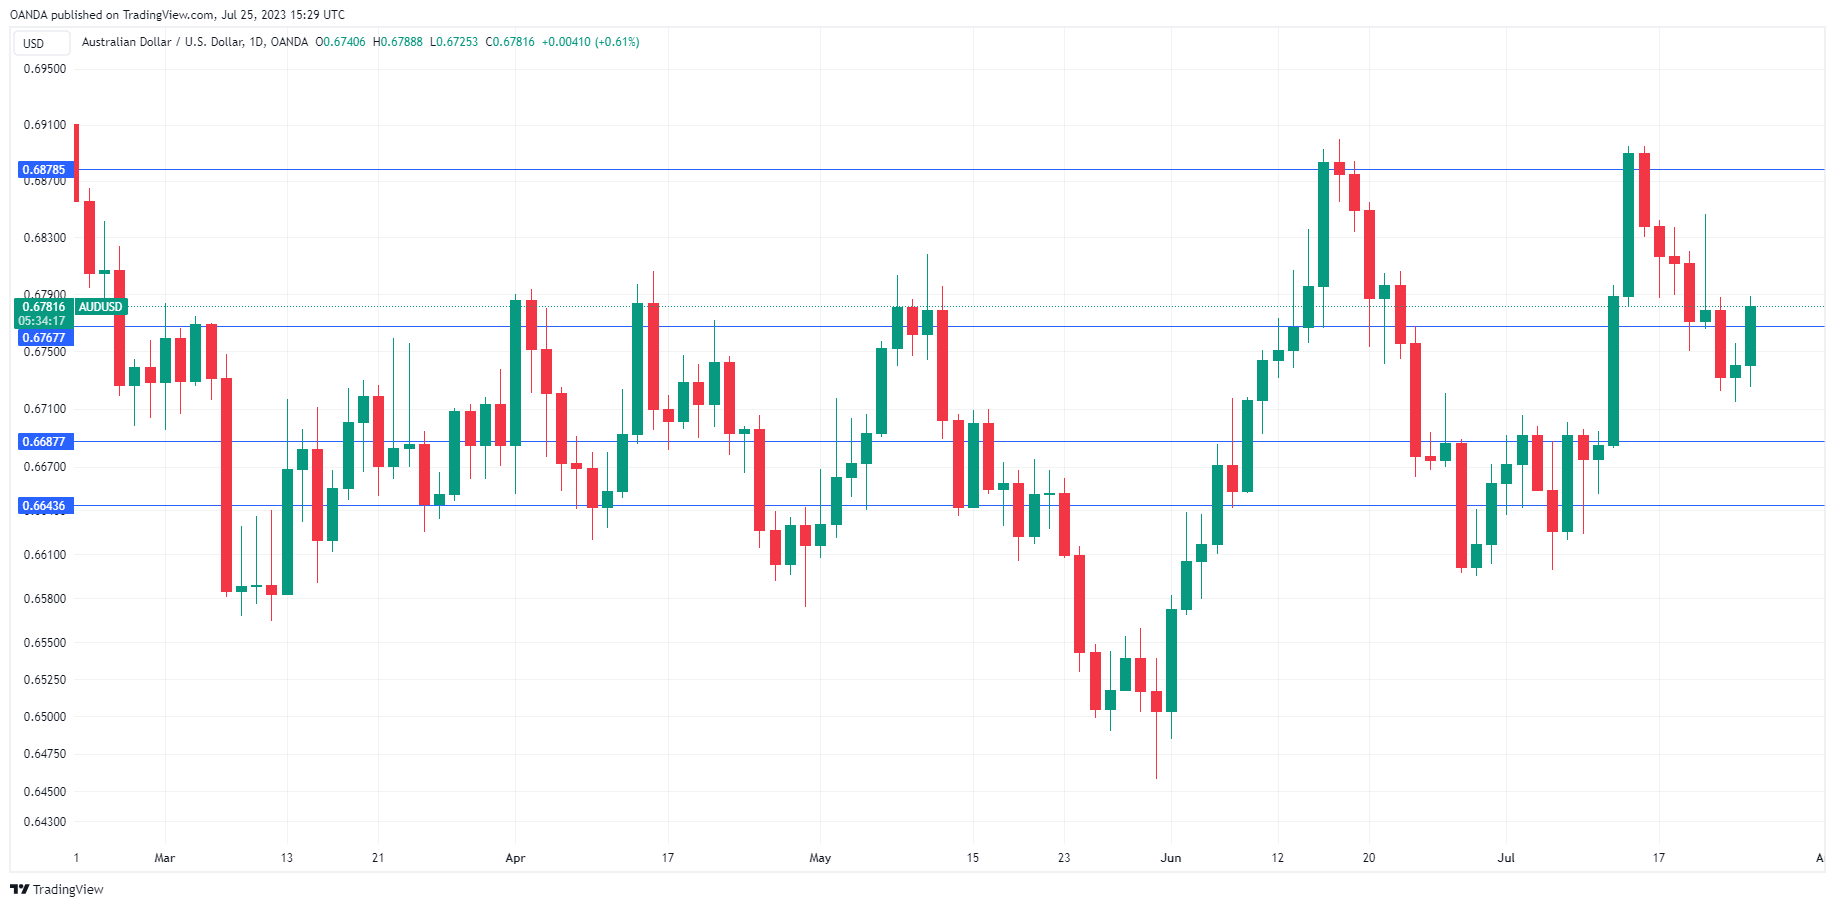
The Australian dollar has gained ground on Tuesday. In the North American session, AUD/USD is trading at 0.6783, up 0.65%.
Australian inflation expected to decelerate
Australia releases the second-quarter inflation report on Wednesday. The consensus is expecting inflation to slow down to 6.2% y/y after a 7.0% print in the first quarter. The core trimmed mean measure of CPI, a key gauge of underlying inflation, is expected to fall from 6.6% to 6.0%.
The RBA will be keeping a close eye on the inflation data, which is the final key release ahead of the RBA decision on August 1st. Recent RBA decisions have been close calls and that could well be the case with the August decision. The money markets have priced in a 41% probability of a 0.25% rate hike, which would bring the cash rate to 4.35%. If inflation falls significantly as expected, the money markets will likely lower the probability of a rate hike in August.
Last week’s employment report reiterated that the labour market remains tight. The economy added 32,500 jobs in June, beating expectations, and unemployment remained at 3.5%. The strong labour market is driving inflation and complicating the RBA’s attempts to bring inflation back down to the 2% target.
US consumers more optimistic
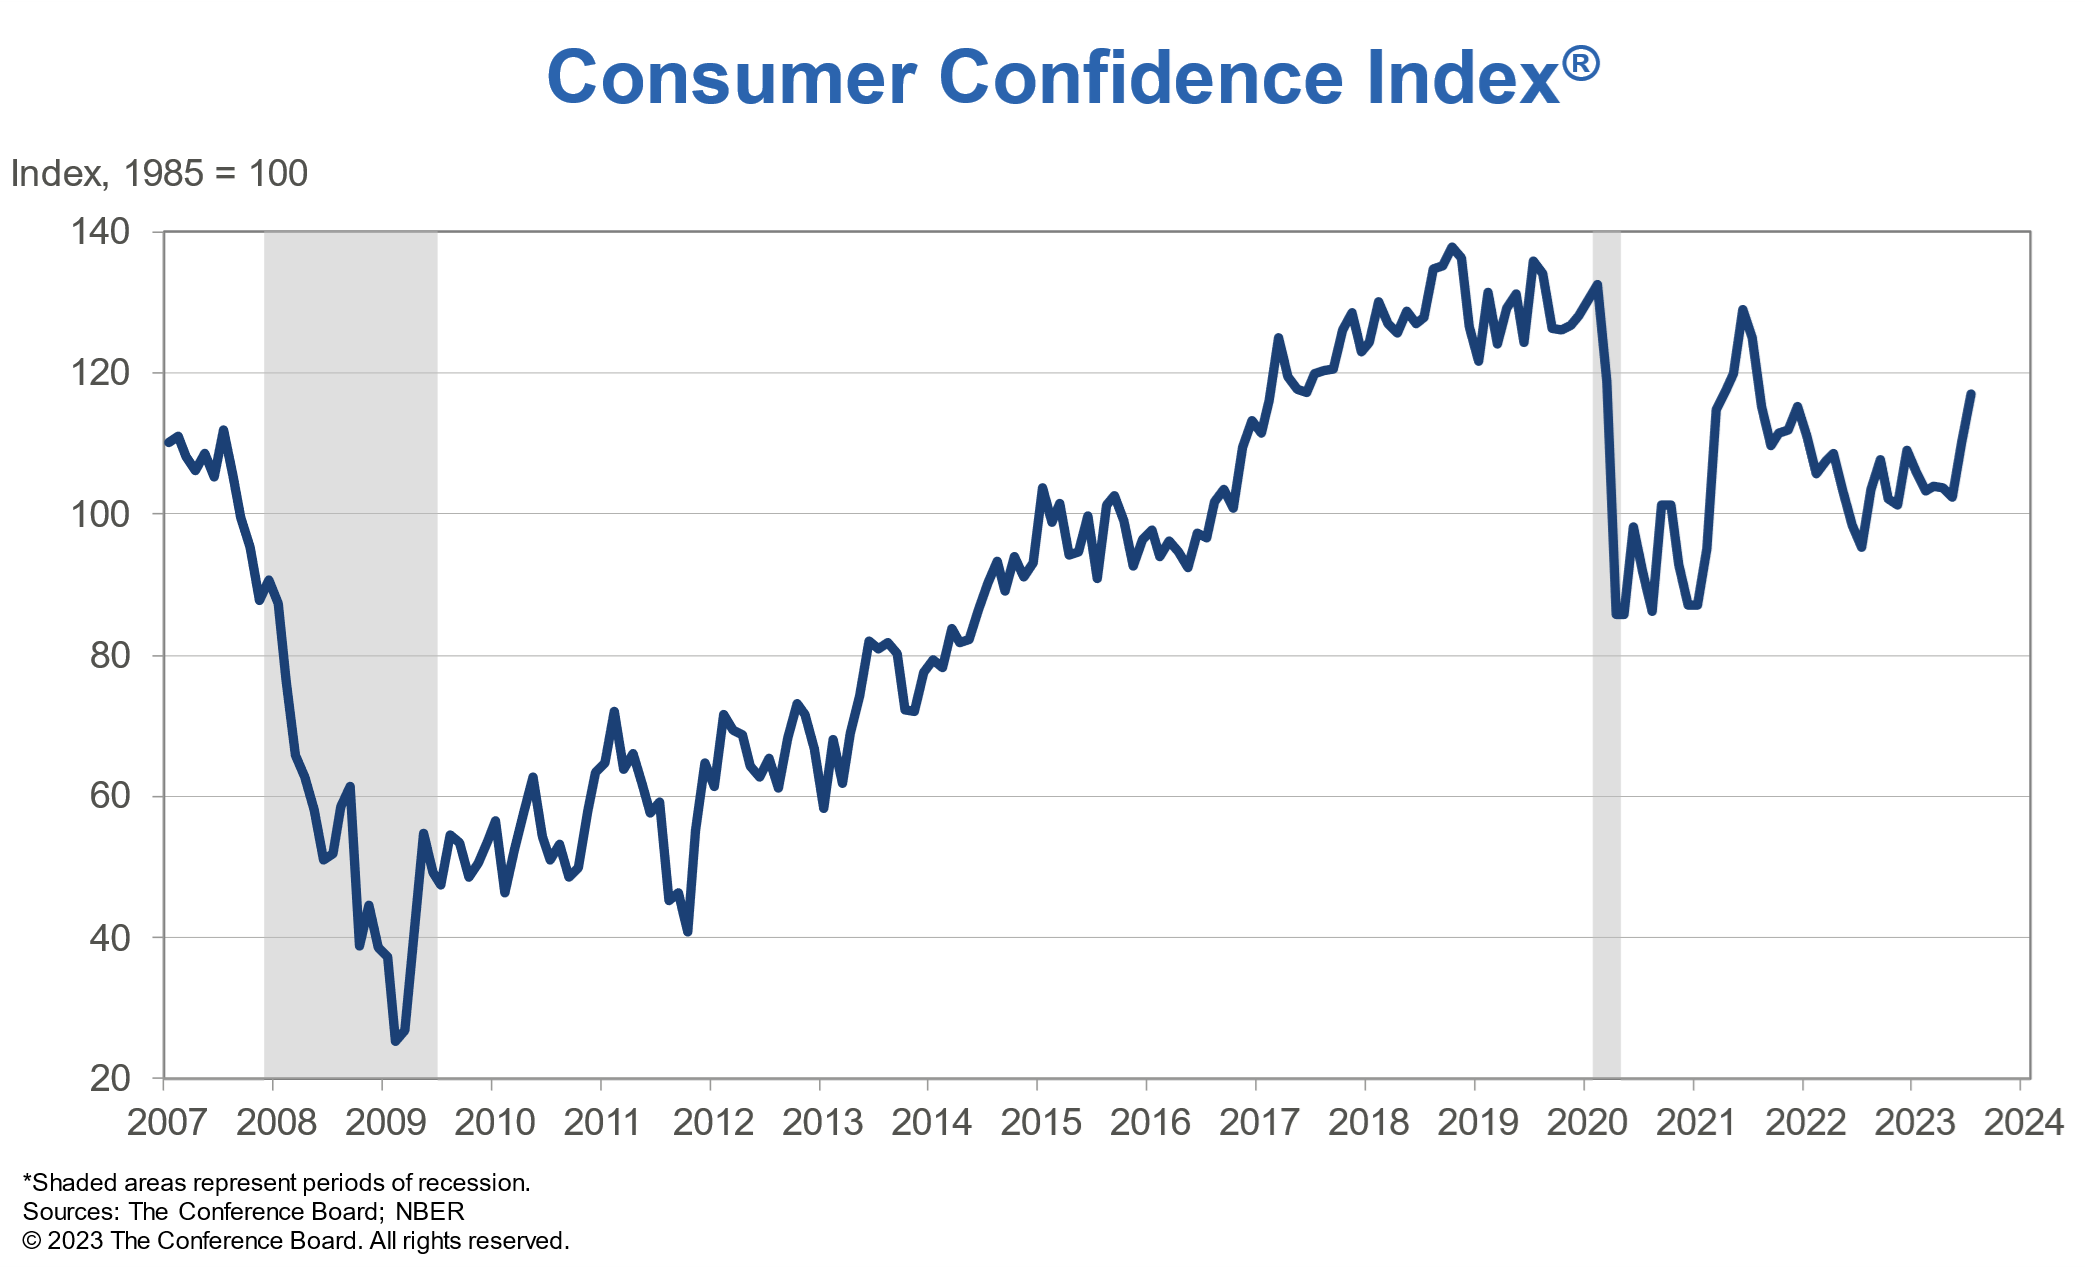
The US Conference Board (CB) consumer confidence index rose in July to 117, up from 110.1 in June. This beat the consensus estimate of 110.5 and was the highest level since July 2021. Consumer expectations also rose significantly. The CB report attributed the boost in consumer confidence to falling inflation and the tight labour market. The CB noted that consumer expectations of a recession have eased compared to earlier in the year, but the CB still considers a recession as “likely” before the end of the year.
AUD/USD Technical
- AUD/USD is testing resistance at 0.6767. Above, there is resistance at 0.6878
- 0.6687 and 0.6643 are providing support
Gold is Correcting, Not Reversing. Here’s Why
The US dollar has risen for the 6th consecutive session, weighing on gold. However, this corrective pullback now highlights gold’s internal strength.
Over the last week, gold fell 1.2% to $1953, erasing the rally of the 18th. However, longer declines than gains point to buyers on the downside. It’s also worth noting that the dollar index is up 1.7% over the same period, although gold tends to move with greater amplitude.
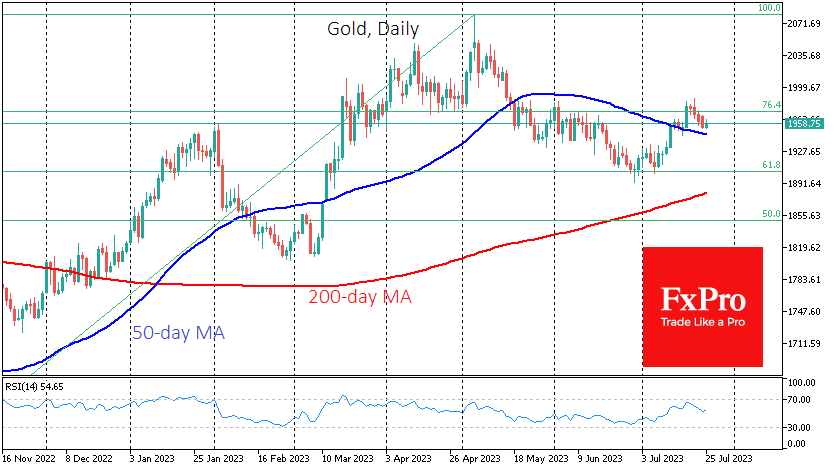
Earlier this month, gold reversed to the upside following a pullback to the 61.8% Fibonacci line from the rally from the November lows to the early May peak. When fully completed, this classic pattern offers an upside potential of $2370 (161.8% of the initial move).
Exactly a week ago, the market confirmed this bullish sentiment by climbing steadily higher and breaking above the 50-day moving average. Despite this week’s decline, gold remains above this important curve and is still formally in a bullish trend.
Given the prospects for further declines, a dynamic near $1947 and $1910 will be necessary. A break below the former would take gold back below its 50-day moving average, and a break above it could be seen as a false break.
A break below $1910 will take the price below the previous local lows. Combined with the lower local highs from mid-July, this would form a downtrend, trashing the current bullish scenario.
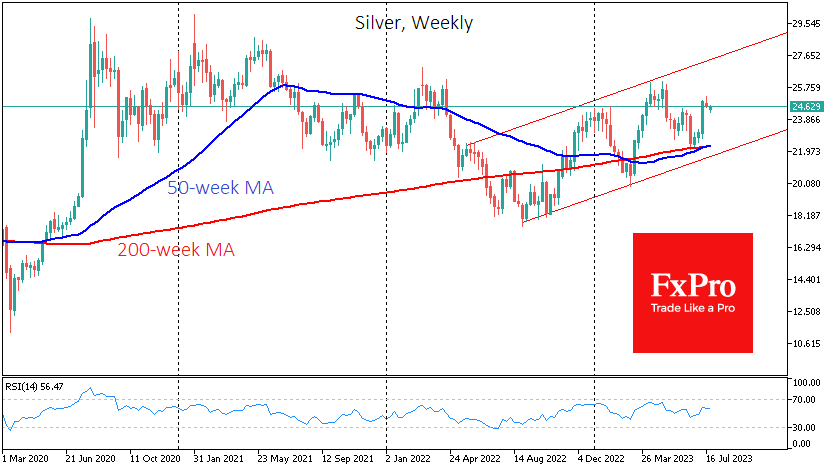
The bullish case for gold is also supported by the performance of silver, which rallied 12% from its late June lows before correcting 3%. A “golden cross” has formed on the weekly chart: The 50-week average rose above the 200-week average. For reference, gold has been in this mode since 2017.
The current situation allows traders to expect more decisive bullish momentum from Silver but also serves as an additional bullish indicator for Gold.
US consumer confidence rose to 117, highest in two years
US Conference Board Consumer Confidence rose from 110.1 to 117.0 in July, above expectation of 112.1. Present Situation Index rose from 115.3 to 160.0. Expectations Index also rose from 80.0 to 88.3.
"Consumer confidence rose in July 2023 to its highest level since July 2021, reflecting pops in both current conditions and expectations," said Dana Peterson, Chief Economist at The Conference Board.
"Headline confidence appears to have broken out of the sideways trend that prevailed for much of the last year....
"Assessments of the present situation rose in July on brighter views of employment conditions, where the spread between consumers saying jobs are 'plentiful' versus 'hard to get' widened further...
"Expectations for the next six months improved materially, reflecting greater confidence about future business conditions and job availability.