Sample Category Title
AUD/USD Daily Report
Daily Pivots: (S1) 0.6746; (P) 0.6770; (R1) 0.6816; More...
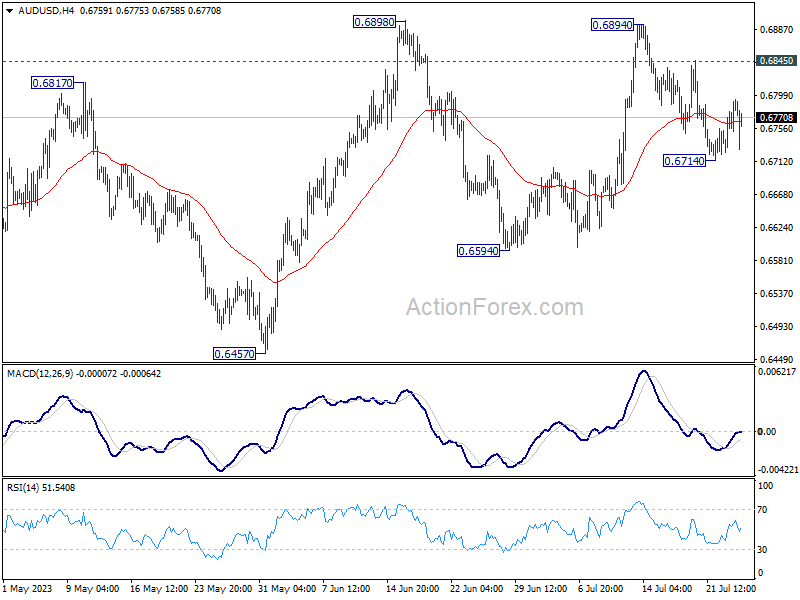
Intraday bias in AUD/USD remains neutral at this point. On the downside below 0.6714 will resume the fall from 0.6894, as the third leg of the corrective pattern from 0.6898. But downside should be contained above 0.6594 support to bring rebound. On the upside, above 0.6845 will bring retest of 0.6898 resistance. Decisive break there will resume rise from 0.6457.
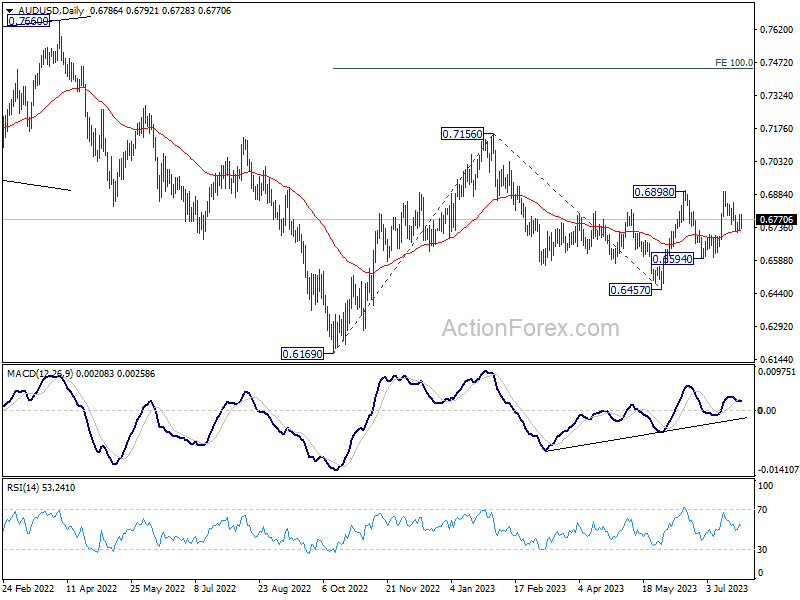
In the bigger picture, price actions from 0.7156 are seen as a correction to the rebound from 0.6169 (2022 low). Break of 0.6898 resistance will argue that rise from 0.6169 is ready to resume through 0.7156. Next target will be 100% projection of 0.6169 to 0.7156 from 0.6457 at 0.7444. For now, this will be the favored case as long as 55 D EMA (now at 0.6715) holds.
USD/JPY Daily Outlook
Daily Pivots: (S1) 140.60; (P) 141.17; (R1) 141.47; More...
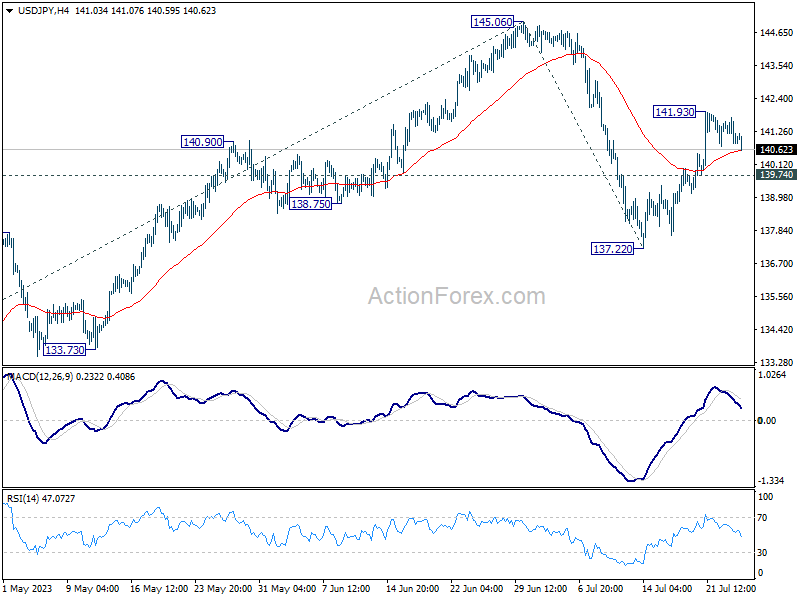
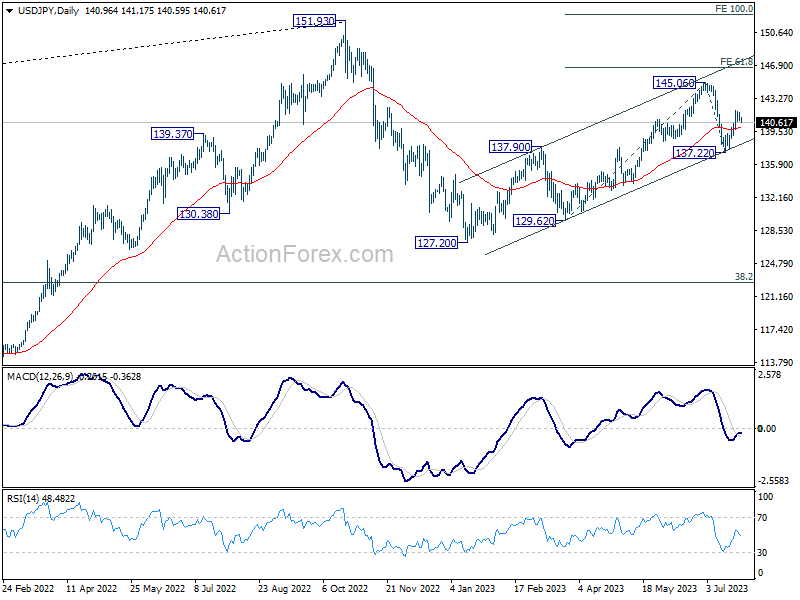
Intraday bias in USD/JPY remains neutral at this point, and further rise is mildly in favor with 139.74 minor support intact. On the upside, above 141.93 will resume the rebound from 137.22 to 145.06 first. Firm break there will target 61.8% projection of 129.62 to 127.22 from 145.06 at 146.76 next. On the downside, below 139.74 minor support will bring retest of 137.22 instead.
In the bigger picture, overall price actions from 151.93 (2022 high) are views as a corrective pattern. Current development suggests that the second leg (the rise from 127.20) might not be over yet. But even in case of extended rise, strong resistance should be seen from 151.93 to limit upside. Meanwhile, break of 137.22 support should confirm the start of the third leg to 127.20 (2023 low) and below.
USD/CHF Daily Outlook
Daily Pivots: (S1) 0.8616; (P) 0.8659; (R1) 0.8681; More...
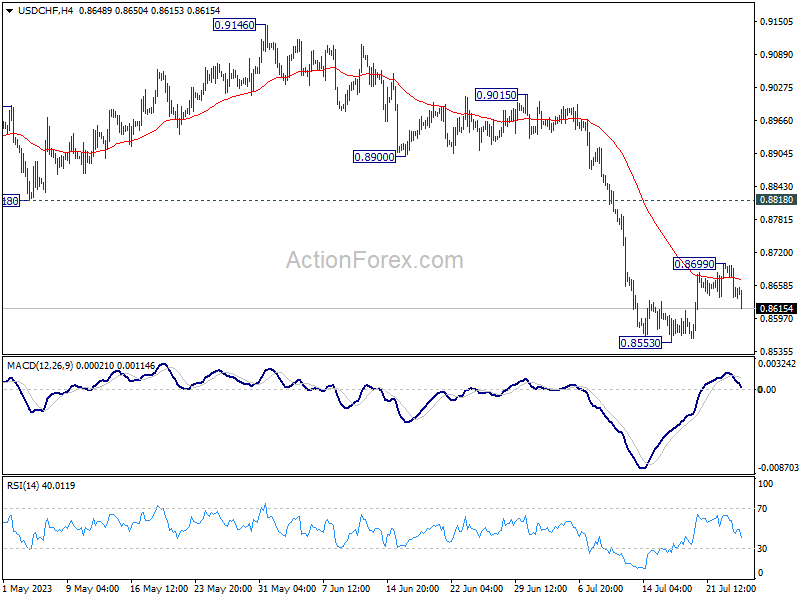
Intraday bias in USD/CHF is turned neutral, as it failed to sustain above 55 4H EMA and retreated. Outlook also stays bearish with 0.8818 support turned resistance intact. Break of 0.8553 will resume larger down trend from 1.0146. On the upside, above 0.8599 will resume the rebound towards 0.8818 instead.
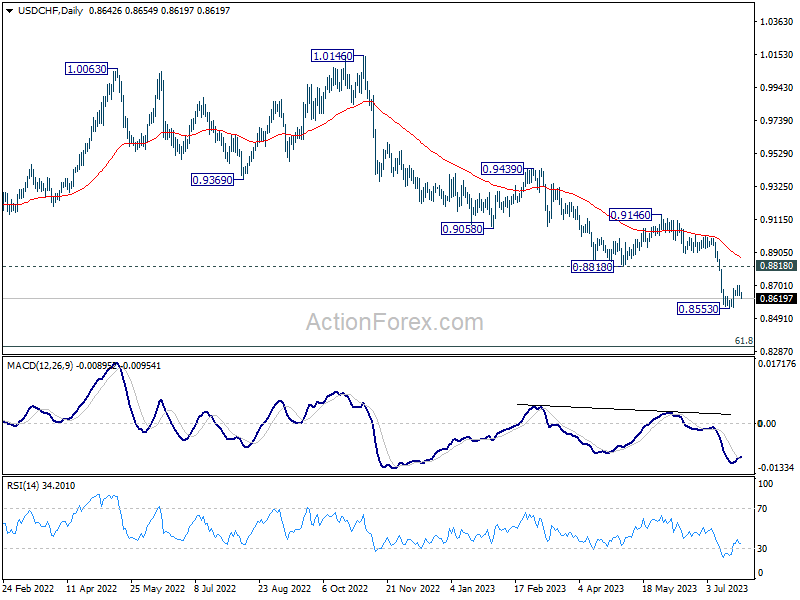
In the bigger picture, the break of 0.8756 (2021 low) indicates break out from the long term range pattern. For now, medium term outlook will stay bearish as long as 0.9146 resistance holds. Further fall would be seen to 61.8% retracement of 0.7065 (2011 low) to 1.0342 (2016 high) at 0.8317 next.
GBP/USD Daily Outlook
Daily Pivots: (S1) 1.2840; (P) 1.2872; (R1) 1.2935; More...
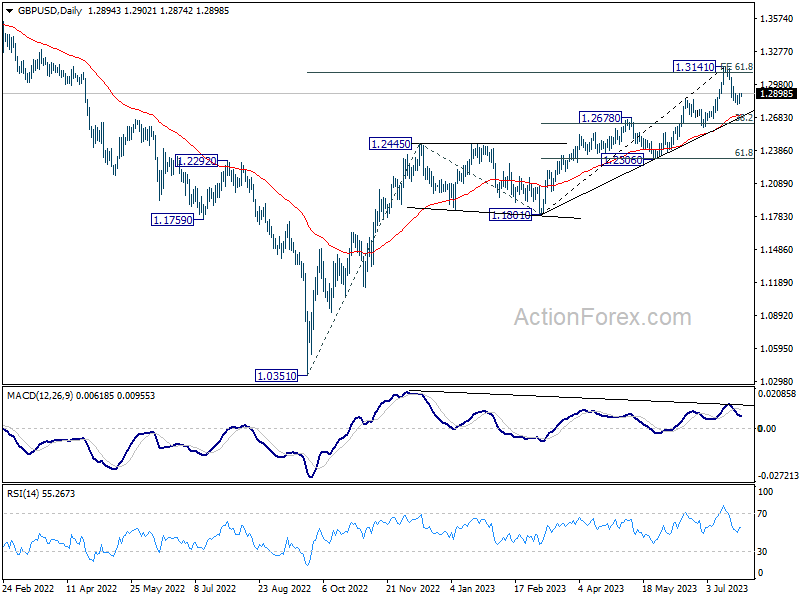
Intraday bias in GBP/USD stays neutral at this point. On the downside, below 1.2796 will resume the fall from 1.3141 to 55 D EMA (now at 1.2703) next. On the upside, break of 1.2963 minor resistance will turn bias back to the upside retest 1.3141 high instead.
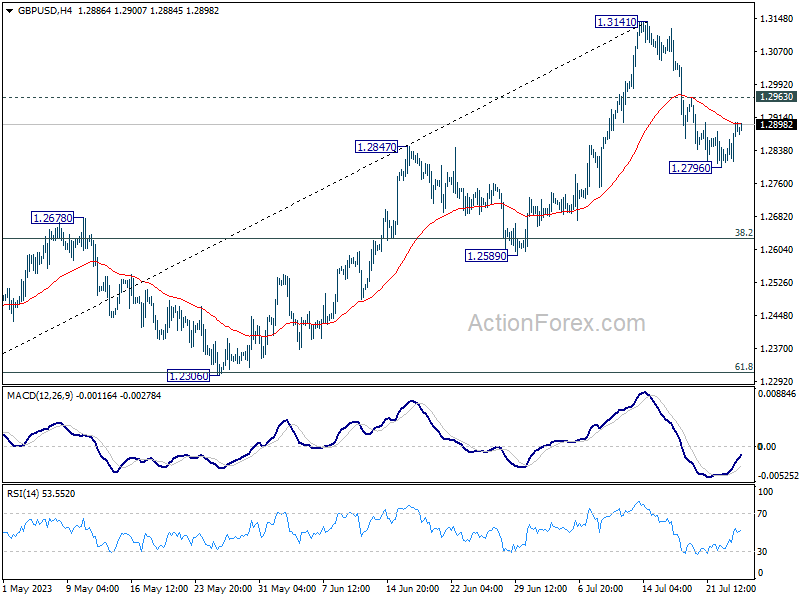
In the bigger picture, as long as 1.2678 resistance turned support holds, rise form 1.0351 (2022 low) is expected to continue. Next target is 100% projection of 1.0351 to 1.2445 from 1.1801 at 1.3895. However, sustained break of 1.2678 will argue that it's at least correcting this rally, with risk of bearish reversal.
Elliott Wave View: USDCAD Rally Expected to Fail
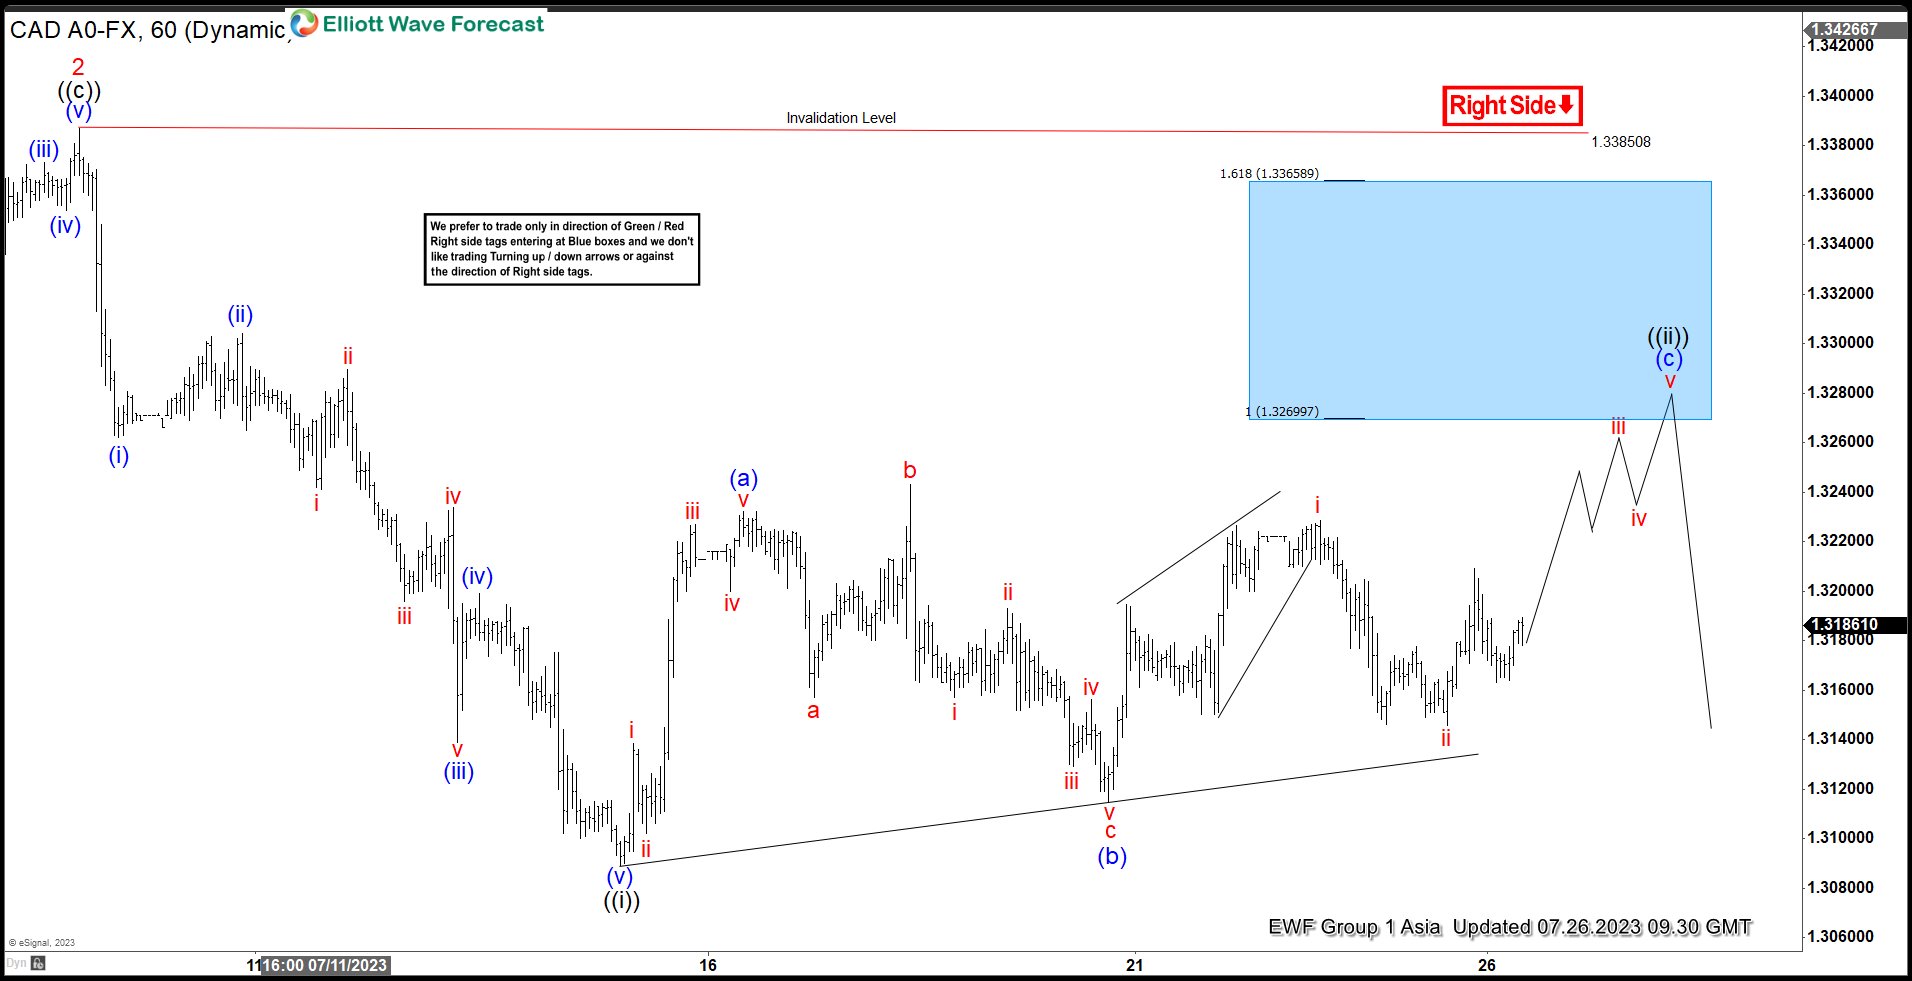
Short Term Elliott Wave view in USDCAD suggests wave 2 ended at 1.338. The pair has extended lower within wave 3 with internal subdivision as a 5 waves impulse structure. Down from wave 2, wave (i) ended at 1.326 and rally in wave (ii) ended at 1.33. Pair then extended lower in wave (iii) towards 1.3139 and rally in wave (iv) ended at 1.3199. Pair made a final leg lower in wave (v) towards 1.3089. This completed wave ((i)) in higher degree.
Wave ((ii)) rally is in progress with internal subdivision as a zigzag Elliott Wave structure. Up from wave ((i)), wave (a) ended at 1.3232 and wave (b) pullback ended at 1.311 as an expanded flat. Down from wave (a), wave a ended at 1.3157, wave b ended at 1.324, and wave c lower ended at 1.311 which completed wave (b). Wave (c) is now in progress as a 5 waves. Up from wave (b), wave i ended at 1.322 and wave ii ended at 1.3145. Expect pair to extend higher in wave iii of (c), followed by wave iv pullback, and final wave v higher. Potential target higher is the blue box area of 1.3269 – 1.336 before it resumes lower. As far as pivot at 1.3385 high stays intact, expect the rally to fail at the blue box for further downside.
USDCAD 60 Minutes Elliott Wave Chart
USDCAD Elliott Wave Video
https://www.youtube.com/watch?v=FROZewmd2Z8
Microsoft Falls, Google Jumps, Fed Decides
Surprise, surprise: Microsoft failed to meet investor expectations when it announced its Q2 results yesterday. Both revenue and earnings beat expectations, but the company reported a decelerating demand for its cloud computing services to 26%, and projected Azure to grow between 25%-26% for the current quarter. We are far from the 35% growth that we got used to in the good old days. Microsoft stock plunged up to 4% in the afterhours trading. Alphabet on the other hand a strong quarter for its search business advertisement, hinting that Google search withstood so far with the AI competition and its cloud business posted a 28% growth, more than Microsoft’s. Google shares jumped 6% after the bell. Elsewhere, Snap tanked almost 20% as the overall sales declined and the forecasts remained short of analyst expectations, while GM lost 3.50% yesterday after raising its earnings forecast. But there is a catch: the forecast holds only if the workers don’t go on a strike, and according to Evercore ISI, the chances of a strike is about 50-50. Today, Meta, Coca-Cola and Boeing will be among the big names that will report their earnings. The S&P500 advanced to the highest levels since April 2022, while Nasdaq 100 was up by 0.73% yesterday.
IMF raises global growth outlook
Zooming out, the IMF raised its outlook for the world economy this year and it now expects the global GDP to expand 3% in 2023. But it also warned that Germany will probably be the only G7 economy to suffer an economic contraction this year. Of course, the IMF also warned that there are some risks to their optimistic forecast, including the higher interest rates, the Chinese recovery that doesn’t come, the debt distress and shocks from war and climate related disasters. But all in all, the US economy will likely end this year as the champion of soft landing – if all goes well.
I insist - if all goes well - because PacWest has been the latest US regional bank to succumb to this year’s bank stress and its shares plunged 27% after Banc of California agreed to buy it.
Decision time
Anyway, positiveness around the US economy is obviously giving some hawkish ideas to the Federal Reserve (Fed), which will likely announce another 25bp hike today, and warn that there could be more in the store. The US 2-year yield is in a wait-and-see more near the 4.90% level, either it will go back above the 5% with a hawkish Fed statement or it will retreat toward the 50-DMA, near the 4.65%, with a reasonably hawkish Fed statement, if the Fed opts for another ‘skip’ for example. The US dollar index pushes higher as expectations for other central banks soften due to the softer-than-expected economic data suggesting softer action from the likes of European Central Bank (ECB) and the Bank of England (BoE) in the coming months. The EURUSD continued its nosedive yesterday on IMF’s less than ideal Germany outlook and the news that corporate loan demand plunged by the most on record in Q2, as higher rates started to bite European businesses.
Unfortunately, however, inflation expectations are getting stronger globally as the rising energy and crop prices hint that the upcoming inflation figures won’t be a piece of cake. The barrel of US crude flirted with the $80pb level on Chinese stimulus hopes and the pricing of a soft landing, while wheat futures continue rising along with the escalating tensions in the Black Sea and Danube. Corn and soybean futures rise as well as hot weather in the US belt is adding to the positive pressure for corn.
EUR/USD Daily Outlook
Daily Pivots: (S1) 1.1022; (P) 1.1054; (R1) 1.1088; More...
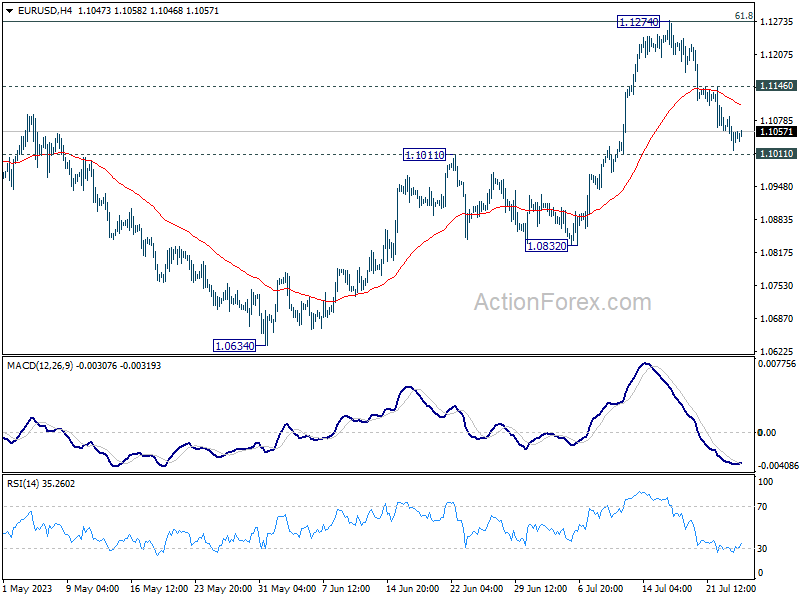
Intraday bias in EUR/USD is turned neutral with 4H MACD crossed above signal line. Near term outlook will stay bullish as long as 1.1011 resistance turned support holds. Above 1.1146 minor resistance will turn bias back to the upside for retesting 1.1274 high first. However, firm break of 1.1011 will argue that larger correction is underway. Deeper fall would then be seen to 1.0832 support next.
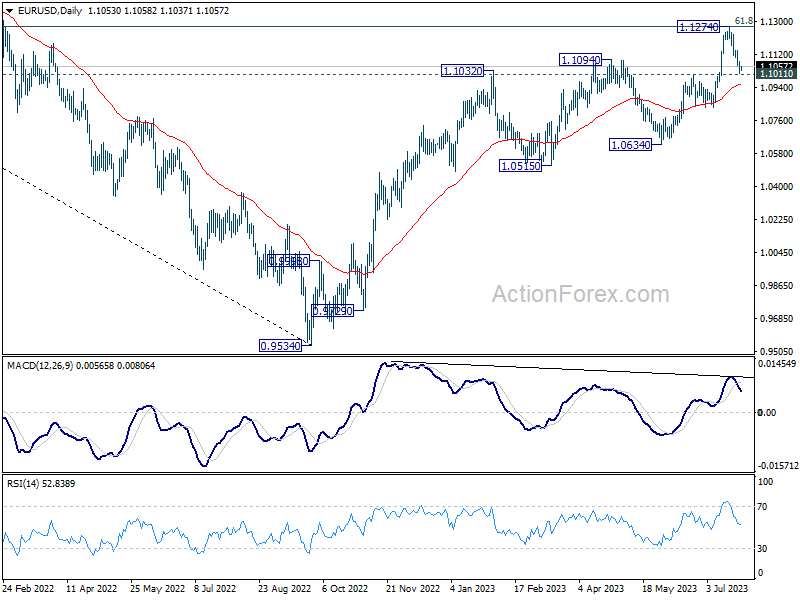
In the bigger picture, rise from 0.9534 is still expected to continue as long as 1.1011 resistance turned support holds. Decisive break of 61.8% retracement of 1.2348 (2021 high) to 0.9534 at 1.1273 will solidify the case of bullish trend reversal and target 1.2348 resistance next. However, firm break of 1.1011 will indicate rejection by 1.1273 and raise the chance of reversal.
Aussie Recovers after Brief CPI Triggered; Traders Await FOMC Hike
In today's Asian trading, Australian Dollar took a brief dip following release of consumer inflation data that indicated more rapid deceleration than predicted. This dampened expectations for an additional rate hike by RBA in early August. Nonetheless, Aussie managed to regain stability promptly, reversing some of the selloff. As Fed's rate decision looms, market participants remain hesitant to adjust their current positions significantly.
Currently, Dollar finds itself in a somewhat precarious position, ranking as the second weakest performer of the week, only outdone by Euro. The latter experienced a steep drop due to a string of disappointing economic data released this week. There's a perceivable tilt in risk towards the downside for the greenback. Despite expectations for a hawkish stance from Fed today, markets might easily dismiss such a posture. On the other hand, any dovish leaning could potentially incite a significant reaction. Yet, the more likely outcome is that FOMC rate decision and press conference would be a non-event.
Staying in the currency markets, Swiss Franc is currently the week's third weakest performer, trailing behind Euro and Dollar, with British Sterling tailing closely behind. New Zealand Dollar leads the pack as the strongest performer, followed by Japanese Yen, and then Aussie, while Canadian Dollar is mixed in the middle.
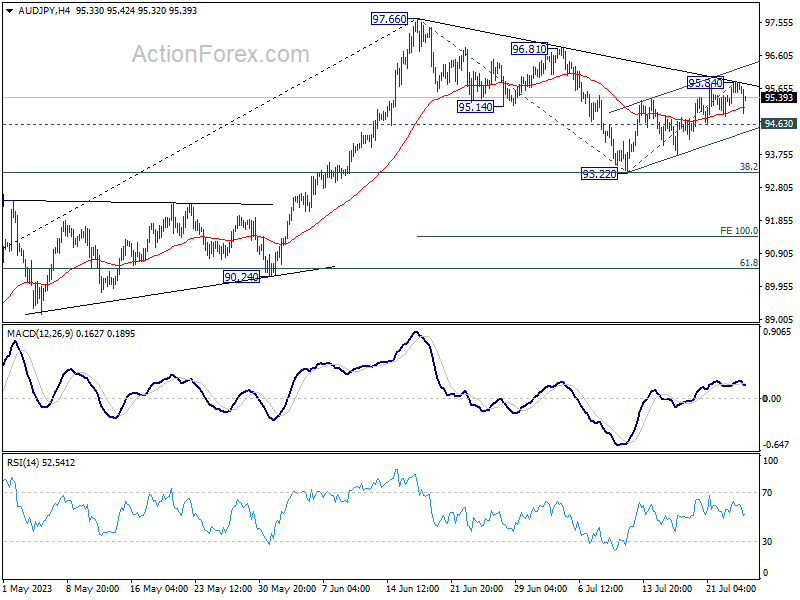
On a technical note, AUD/JPY deserves some attention, given the potential strong response to upcoming risk market developments. The cross's corrective recovery from 93.22 has been losing steam, evident from 4H MACD. It has also struggled to break through near term falling trend line resistance. Firm break of 94.63 support will argue that larger fall from 97.66 is ready to resume. Deeper decline should then be seen to retest 93.22 support first in this case.
In Asia, at the time of writing, Nikkei is down -0.07%. Hong Kong HSI is down -0.88%. China Shanghai SSE is down -0.54%. Singapore Strait Times is up 0.76%. Japan 10-year JGB yield is down -0.013 at 0.454, moving further away from BoJ's 0.5% yield cap. Overnight, DOW rose 0.08%. S&P 500 rose 0.28%. NASDAQ rose 0.61%. 10-year yield jumped 0.055 to 3.912.
Australian Q2 CPI records slowest quarterly rate since Q3 2021, annual inflation eases again
In Q2, Australia's CPI decelerated from 1.4% qoq to 0.8% qoq, coming in below the expected 1.0% qoq. This marked the lowest quarterly rate since Q3 2021. Year-on-year, CPI eased from 7.0% to 6.0%, falling short of anticipated 6.2% yoy. Annual inflation rate has been on a downtrend for two consecutive quarters since peaking at 7.8% in Q4 2022.
RBA's trimmed mean CPI registered at 0.9% qoq and 5.9% yoy, which were below forecast of 1.1% qoq and 6.0% yoy respectively. While CPI for goods slowed from 7.6% yoy to 5.8% yoy, CPI for services rose from 6.1% yoy to 6.3% yoy, hitting its highest level since 2001.
Michelle Marquardt, ABS head of prices statistics, noted the shift in inflationary drivers, stating, "This is the first time since September 2021 that services inflation has been higher than goods, highlighting the change from 12 months ago when goods like new dwellings and automotive fuel were driving inflation. Now price increases for a range of services like rents, restaurant meals, child-care and insurance are keeping inflation high."
In June, monthly CPI slipped from 5.5% yoy to 5.4% yoy, in line with expectations. CPI excluding volatile items and holiday travel eased from 6.4% yoy to 6.1% yoy, and trimmed mean CPI fell from 6.1% yoy to 6.0% yoy.
IMF urges Japan to start preparing for rate hikes
IMF Chief Economist Pierre-Olivier Gourinchas shared his views on Japan's economy highlighting that the risks related to inflationary pressures likely lean towards the upside. He urged BoJ to start preparing for increasing interest rates.
Addressing Japan's monetary stance, Gourinchas stated, "Our advice for Japanese authorities there is that right now, monetary policy can remain accommodative, but it needs to prepare itself for the need to maybe start hiking." Furthermore, he suggested that Japan should consider flexibility in its monetary policy, "maybe move away from the yield-curve control that it has now."
In its updated World Economic Outlook report, IMF projected a 1.4% expansion for Japan's economy in 2023, up from a 1.0% rise last year, primarily driven by boost in consumption as pandemic restrictions are lifted. However, growth is anticipated to slow to 1.0% in 2024 as the impact of past stimulus measures wanes.
Fed to hike 25bps, too soon to confirm it's last
FOMC is widely anticipated to increase interest rates by 25bps to between 5.25-5.50% today, following a brief pause in June. Recent chatter among financial circles suggests that this could mark the last hike in Fed's current tightening cycle, as inflation has shown promising signs of deceleration.
However, it's worth noting that the next FOMC meeting is not scheduled until September 20-21, a significant interval that will witness multiple key data releases. These encompass two sets of PCE inflation, CPI, and non-farm payroll figures. Furthermore, the September meeting will bring updated economic projections from Fed.
Given this context, it is highly improbable that today's accompanying statement will slacken the tightening bias. Fed Chair Jerome Powell is expected to maintain a cautious approach, underscoring the commitment to curb inflation and even reiterating that Fed policymakers had projected at least one more rate hike this year, in their last projections. However, any departure from these expected messages could precipitate a bearish turn for Dollar and a bullish surge for stocks.
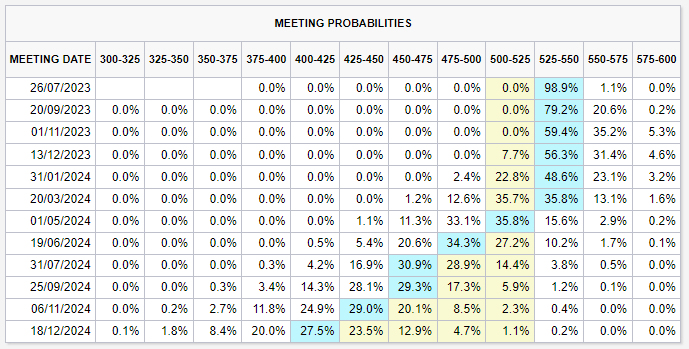
Presently, market expectations for another rate hike stand at only around 20% for September, 40% for November, and 36% for December. Meanwhile, market pricing suggests the first cut could be on the horizon as early as May next year, with an estimated probability of about 81%.
Here are some suggested readings on Fed:
- Will July Rate Hike Be One and Done for Fed?
- Fed Preview: July Marks the End of the Hiking Cycle
- July Flashlight for the FOMC Blackout Period
Looking ahead
Swiss Credit Suisse economic expectations and Eurozone M3 money supply will be featured in European session. US will release new home sales. BoC will also publish summary of deliberations.
EUR/USD Daily Outlook
Daily Pivots: (S1) 1.1022; (P) 1.1054; (R1) 1.1088; More...
Intraday bias in EUR/USD is turned neutral with 4H MACD crossed above signal line. Near term outlook will stay bullish as long as 1.1011 resistance turned support holds. Above 1.1146 minor resistance will turn bias back to the upside for retesting 1.1274 high first. However, firm break of 1.1011 will argue that larger correction is underway. Deeper fall would then be seen to 1.0832 support next.
In the bigger picture, rise from 0.9534 is still expected to continue as long as 1.1011 resistance turned support holds. Decisive break of 61.8% retracement of 1.2348 (2021 high) to 0.9534 at 1.1273 will solidify the case of bullish trend reversal and target 1.2348 resistance next. However, firm break of 1.1011 will indicate rejection by 1.1273 and raise the chance of reversal.
Economic Indicators Update
| GMT | Ccy | Events | Actual | Forecast | Previous | Revised |
|---|---|---|---|---|---|---|
| 23:50 | JPY | Corporate Service Price Index Y/Y Jun | 1.20% | 1.50% | 1.60% | 1.70% |
| 01:30 | AUD | Monthly CPI Y/Y Jun | 5.40% | 5.40% | 5.60% | 5.50% |
| 01:30 | AUD | CPI Q/Q Q2 | 0.80% | 1.00% | 1.40% | |
| 01:30 | AUD | CPI Y/Y Q2 | 6.00% | 6.20% | 7.00% | |
| 01:30 | AUD | RBA Trimmed Mean CPI Q/Q Q2 | 0.90% | 1.10% | 1.20% | |
| 01:30 | AUD | RBA Trimmed Mean CPI Y/Y Q2 | 5.90% | 6.00% | 6.60% | |
| 08:00 | CHF | Credit Suisse Economic Expectations Jul | -30.8 | |||
| 08:00 | EUR | Eurozone M3 Money Supply Y/Y Jun | 1.00% | 1.40% | ||
| 14:00 | USD | New Home Sales Jun | 720K | 763K | ||
| 14:30 | USD | Crude Oil Inventories | -2.2M | -0.7M | ||
| 17:30 | CAD | BOC Summary of Deliberations | 6.70% | 7.10% | ||
| 18:00 | USD | Fed Interest Rate Decision | 5.50% | 5.25% | ||
| 18:30 | USD | FOMC Press Conference |
Fed to hike 25bps, too soon to confirm it’s last
FOMC is widely anticipated to increase interest rates by 25bps to between 5.25-5.50% today, following a brief pause in June. Recent chatter among financial circles suggests that this could mark the last hike in Fed's current tightening cycle, as inflation has shown promising signs of deceleration.
However, it's worth noting that the next FOMC meeting is not scheduled until September 20-21, a significant interval that will witness multiple key data releases. These encompass two sets of PCE inflation, CPI, and non-farm payroll figures. Furthermore, the September meeting will bring updated economic projections from Fed.
Given this context, it is highly improbable that today's accompanying statement will slacken the tightening bias. Fed Chair Jerome Powell is expected to maintain a cautious approach, underscoring the commitment to curb inflation and even reiterating that Fed policymakers had projected at least one more rate hike this year, in their last projections. However, any departure from these expected messages could precipitate a bearish turn for Dollar and a bullish surge for stocks.
Presently, market expectations for another rate hike stand at only around 20% for September, 40% for November, and 36% for December. Meanwhile, market pricing suggests the first cut could be on the horizon as early as May next year, with an estimated probability of about 81%.
Here are some suggested readings on Fed:
Technical Outlook and Review
DXY:
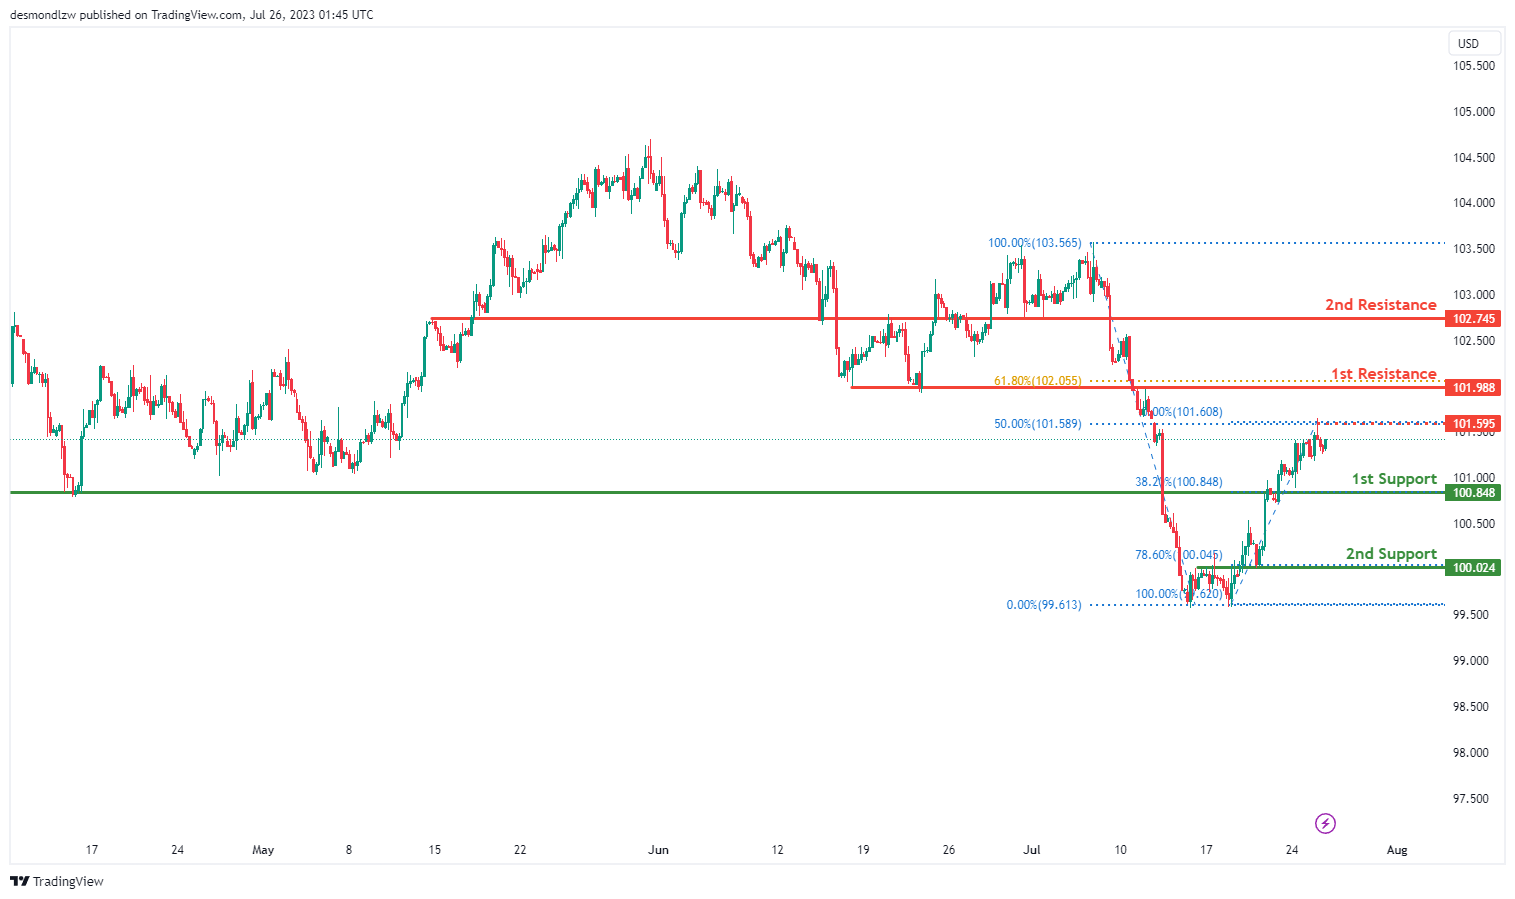
The DXY chart displays a bullish momentum, suggesting a potential upward continuation towards the 1st resistance.
The 1st support is at 100.84, identified as an overlap support. The 2nd support at 100.02 aligns with the 78.60% Fibonacci retracement level, further enhancing its significance.
Looking at resistance levels, the 1st resistance is at 101.98, acting as a pullback resistance and aligns with the 61.80% Fibonacci retracement. The 2nd resistance is at 102.74, also a pullback resistance. An intermediate resistance level is present at 101.98, which is significant due to its positioning at a previous swing high.
EUR/USD:
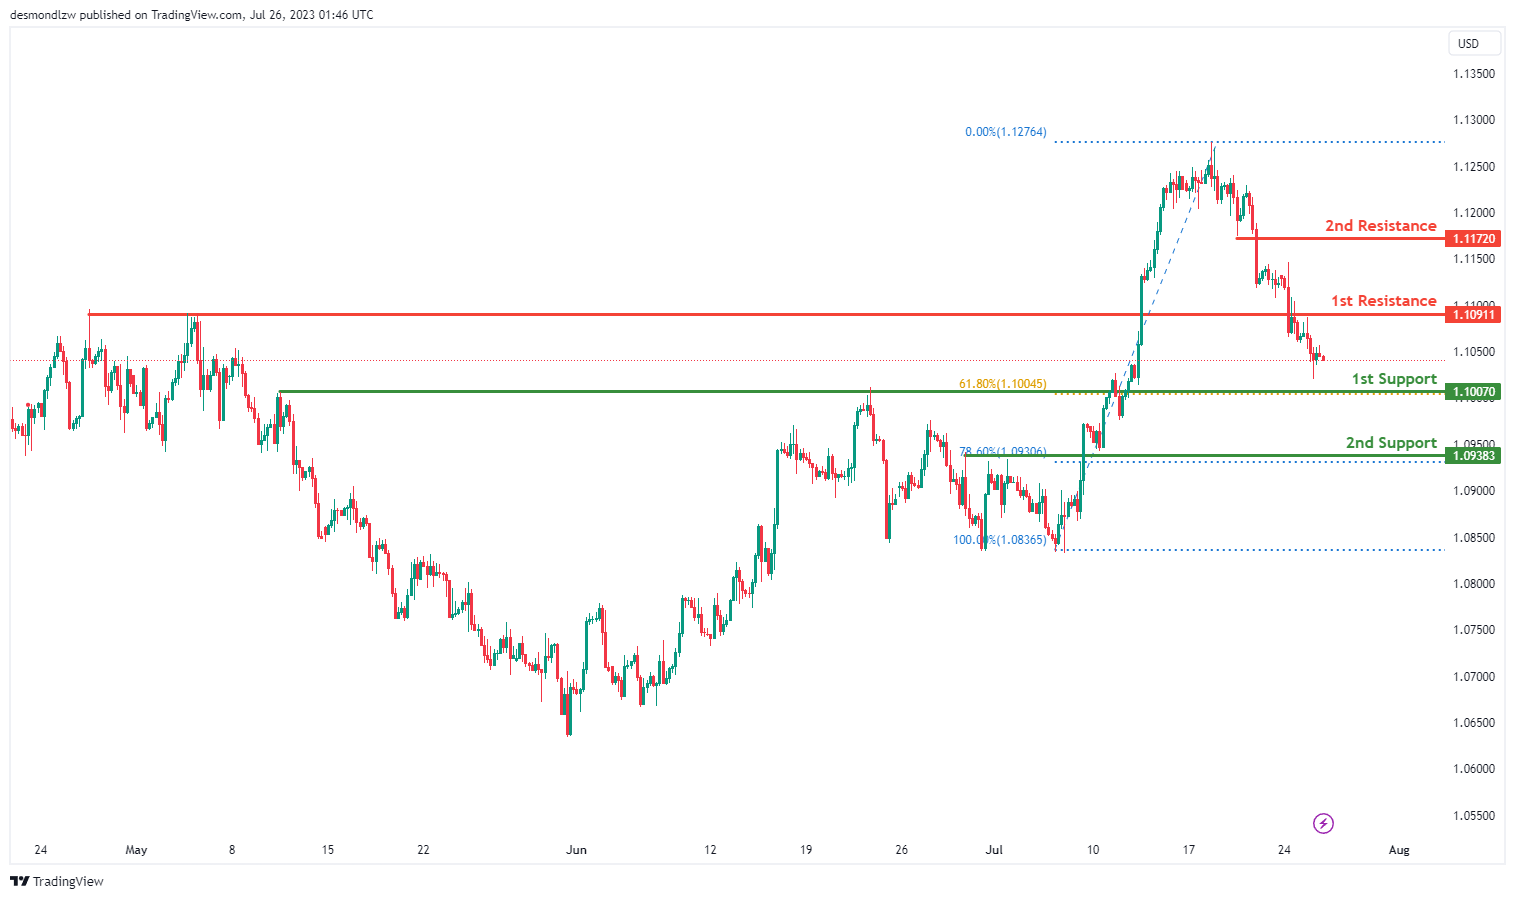
The EUR/USD chart is currently showing a bearish momentum, indicating a possible downward continuation towards the 1st support.
The 1st support level is at 1.1007, serving as a pullback support and coinciding with the 61.80% Fibonacci retracement level, which could potentially halt the bearish momentum. The 2nd support level is at 1.0938 and is an overlap support, coinciding with the 78.60% Fibonacci retracement level, suggesting a strong potential rebound area.
The 1st resistance level is at 1.1091, and it is defined as an overlap resistance, suggesting a potential area of selling pressure. The 2nd resistance level is at 1.1172, which serves as a pullback resistance, indicating another potential area of selling pressure if the price rises.
EUR/JPY:
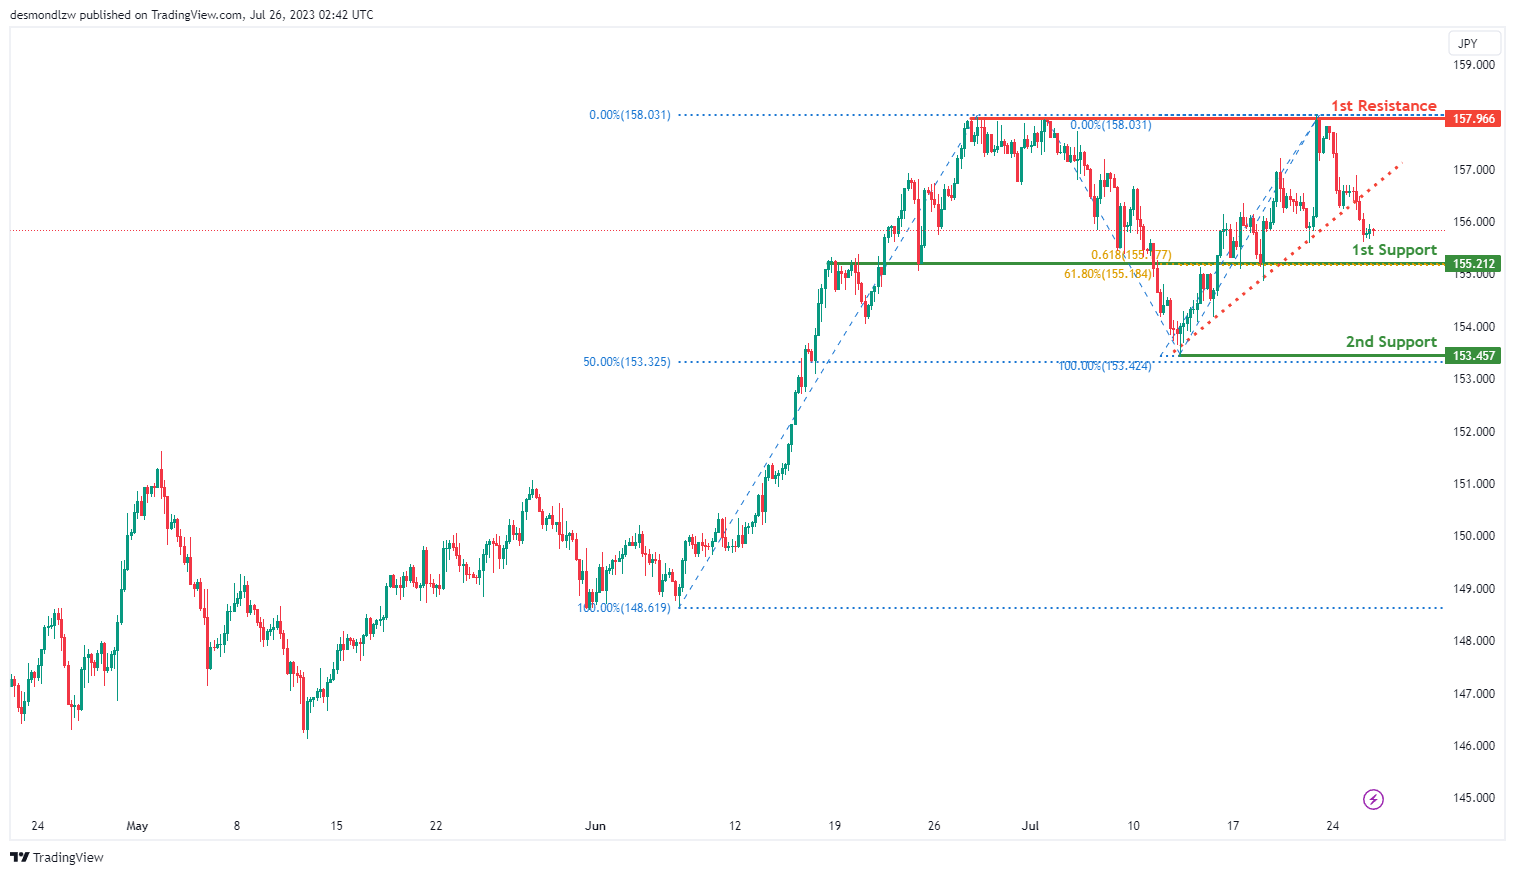
The EUR/JPY chart is currently in a bearish trend, and if the price breaks below the ascending trendline, it could continue to fall towards the 1st support level. This is indicative of a potential bearish continuation.
The 1st support level is situated at 155.21, corresponding with an overlap support, the 61.80% Fibonacci retracement level and 61.80% Fibonacci projection level, showing Fibonacci confluence. This could potentially mark a significant point of buying interest, which could stimulate upward price movements.
Meanwhile, the 2nd support level stands at 153.45, and it coincides with a swing low support and the 50% Fibonacci retracement level. This might serve as another area of potential buying interest.
On the other hand, the 1st resistance level is positioned at 157.96, indicating a multi-swing high resistance. This could possibly apply significant selling pressure, potentially halting or reversing the upward price trajectory.
EUR/GBP:
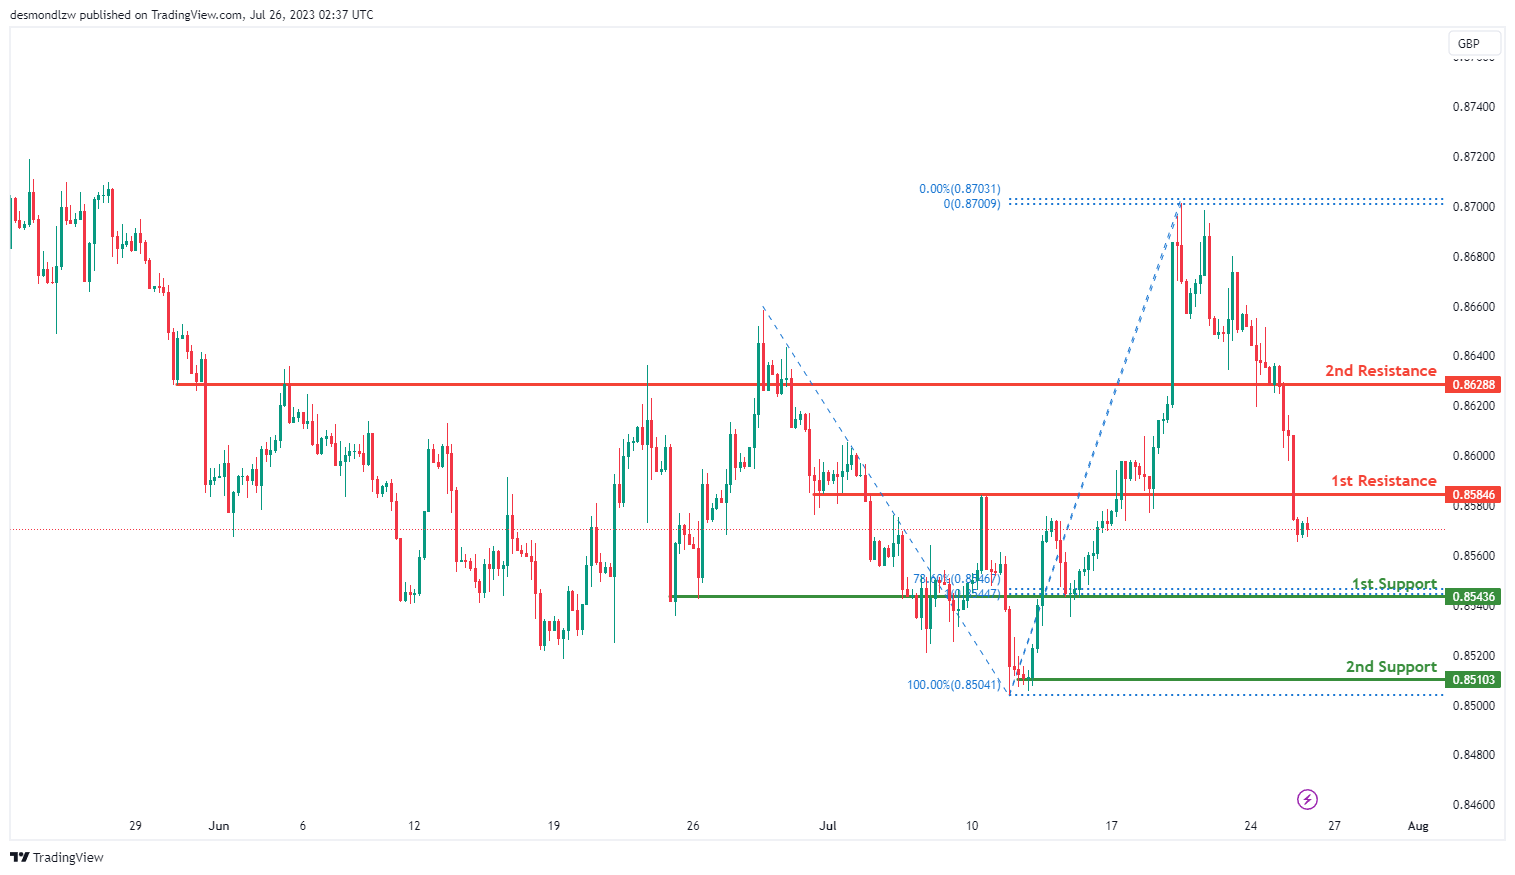
The EUR/GBP chart shows a bearish momentum, indicating a potential continuation towards the 1st support at 0.8543. This support level is significant as it coincides with an overlap support, the 78.60% Fibonacci retracement, and the 100% Fibonacci projection, indicating a Fibonacci confluence.
Furthermore, the 2nd support at 0.8510 acts as another important level, representing multi-swing low support.
On the other hand, the 1st resistance at 0.8584 is considered an overlap resistance, while the 2nd resistance at 0.8628 also serves as another overlap resistance. These resistance levels may play crucial roles in determining the potential price movement of EUR/GBP.
GBP/USD:
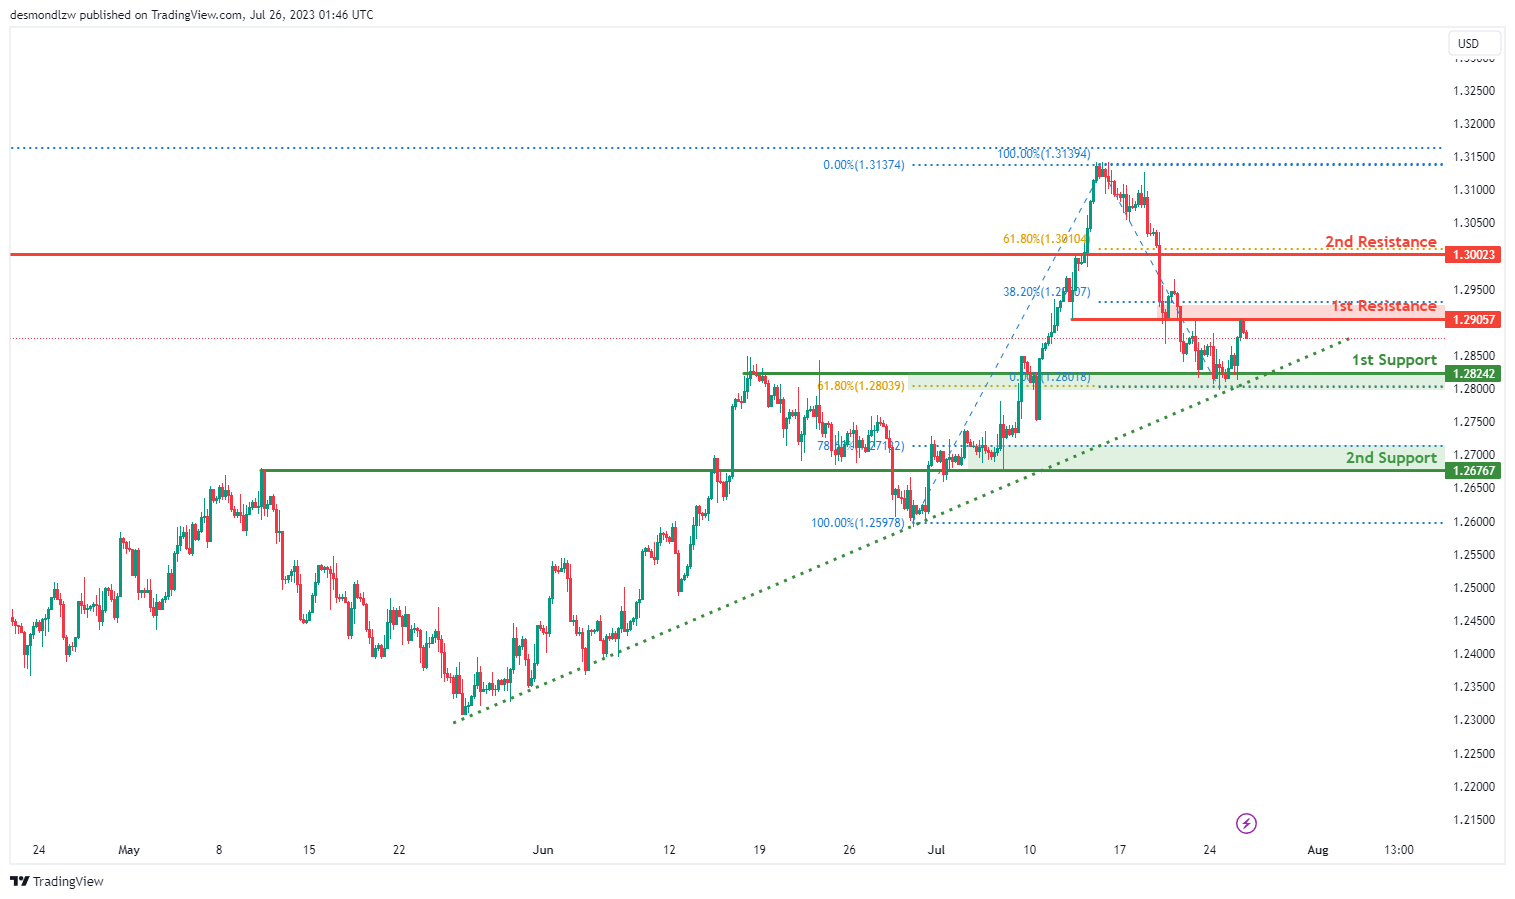
The GBP/USD chart is currently showing a bullish momentum, with the price being above a major ascending trend line, suggesting more bullish activity is expected. However, there may be a short-term drop to the 1st support before a bounce back towards the 1st resistance.
The 1st support level is at 1.2824, serving as an overlap support and coinciding with the 61.80% Fibonacci retracement level. This could potentially halt any short-term bearish momentum. The 2nd support level is at 1.2676, an overlap support coinciding with the 78.60% Fibonacci retracement level, further strengthening its potential rebound capability.
The 1st resistance level is at 1.2905, defined as an overlap resistance and also aligns with the 38.20% Fibonacci retracement, indicating a potential selling pressure area. The 2nd resistance level is at 1.3002, serving as a pullback resistance and corresponding to the 61.80% Fibonacci retracement level, adding to its significance as a potential turnaround area in a bullish scenario.
GBP/JPY:
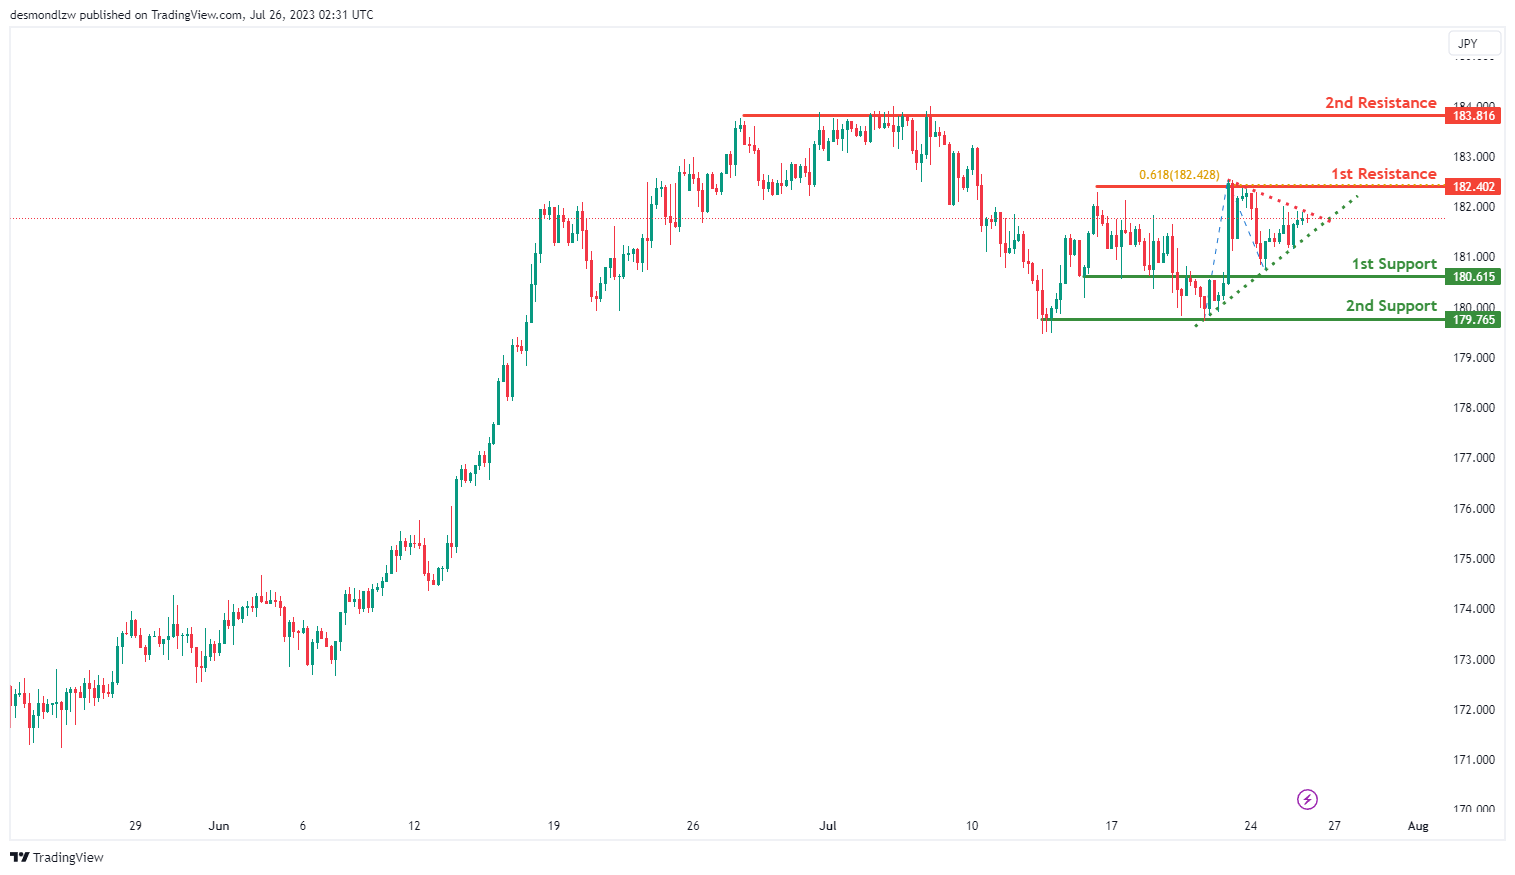
The GBP/JPY chart is currently exhibiting a neutral momentum, suggesting potential fluctuation between the 1st resistance and 1st support level. This could be attributed to the presence of a symmetrical triangle chart pattern, which often represents a period of consolidation before the price breaks out or breaks down.
The 1st support level, located at 179.92, represents a multi-swing low support. This could serve as a significant point of buying interest, halting downward movement.
The intermediate support level is at 180.63 and serves as an overlap support, offering additional potential buying interest.
On the other hand, the 1st resistance level, at 182.40, is a multi-swing high resistance that also coincides with the 61.80% Fibonacci projection level. This could potentially signify a point of selling pressure, potentially reversing the price trend.
The 2nd resistance level is at 183.81, representing another multi-swing high resistance. This level could serve as an additional selling pressure point, likely limiting further price ascents.
Should the price break above the upper trendline of the symmetrical triangle pattern, it could signal a bullish breakout, possibly indicating a continuation of the uptrend. Conversely, a break below the lower trendline might suggest a bearish breakdown, possibly leading to a continuation of the downtrend.
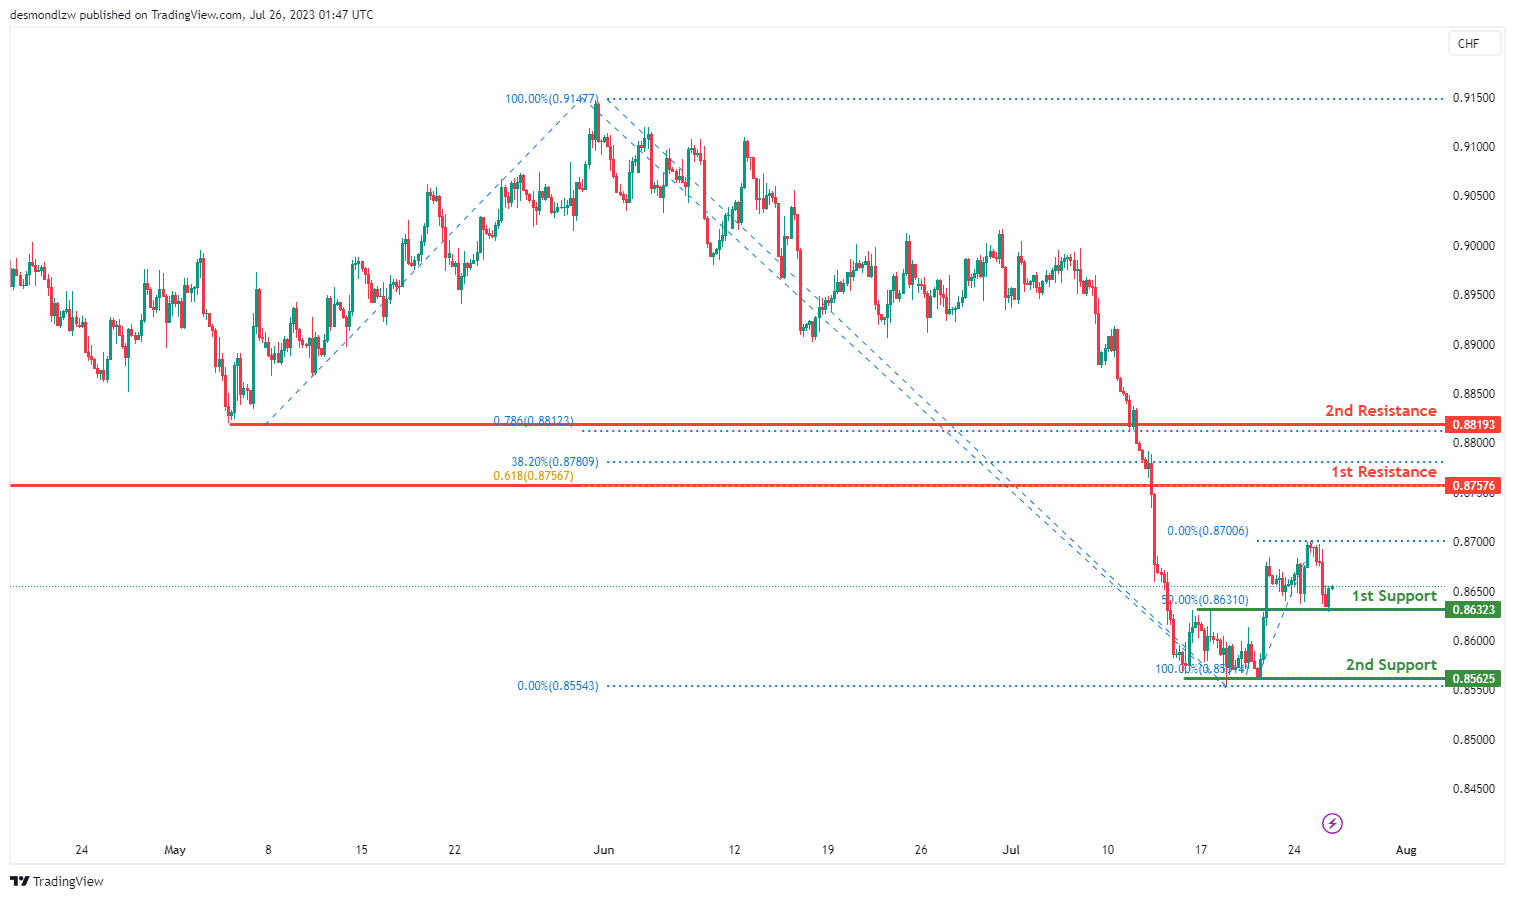
USD/CHF:
The USD/CHF chart is currently showing bullish momentum, suggesting potential for a bullish bounce off the 1st support and a move towards the 1st resistance.
The 1st support level stands at 0.8632. This level is significant due to its overlap support and 50% Fibonacci retracement position, which could potentially stop a downward trend. The 2nd support level is at 0.8562 and serves as a multi-swing low support, adding to its potential to halt further price declines.
On the upside, the 1st resistance level is at 0.8757 and acts as a pullback resistance, aligned with the 61.80% Fibonacci projection, implying potential selling pressure. The 2nd resistance is at 0.8819, serving as a pullback resistance and is further strengthened by its alignment with the 78.60% Fibonacci retracement level, indicating a potential turnaround area in a bullish scenario.
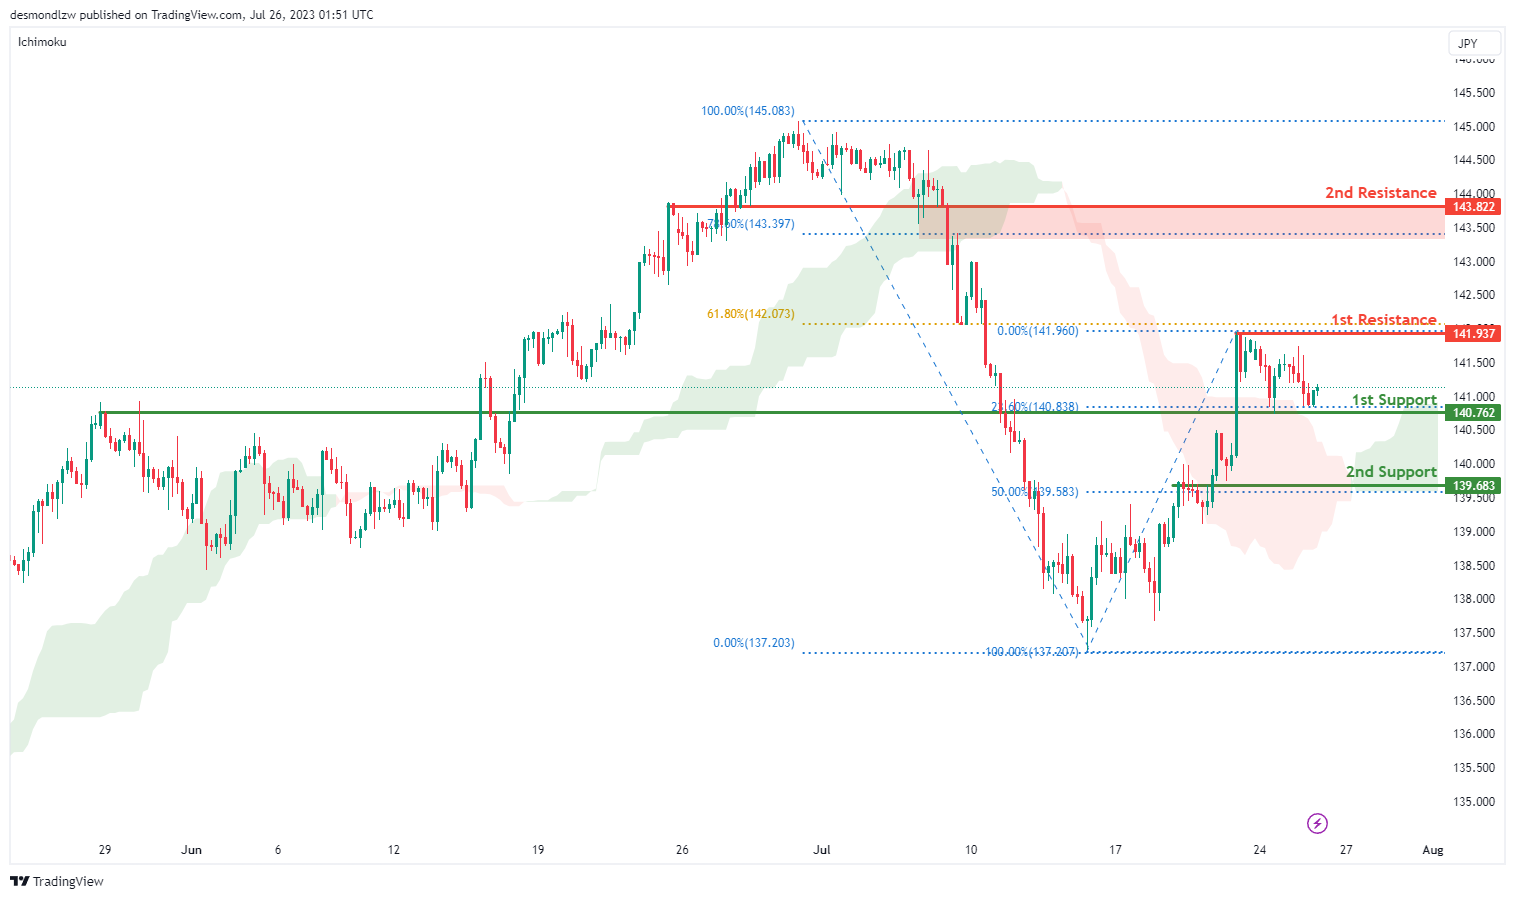
USD/JPY:
The USD/JPY chart currently shows a bullish momentum, with the price above a significant ascending trend line, suggesting possible further bullish movement.
The 1st support level is at 140.76. This level is considered an overlap support and aligns with the 23.60% Fibonacci retracement level, indicating potential buying pressure. The 2nd support is at 139.68, aligning with an overlap support and the 50% Fibonacci retracement level, further enhancing its significance.
The 1st resistance level is at 141.93, which serves as a swing high resistance and aligns with the 61.80% Fibonacci projection. This suggests the price could face selling pressure at this level. The 2nd resistance level is at 143.82, which acts as a pullback resistance and aligns with the 78.60% Fibonacci retracement level, marking a potential turnaround point in a bullish scenario.
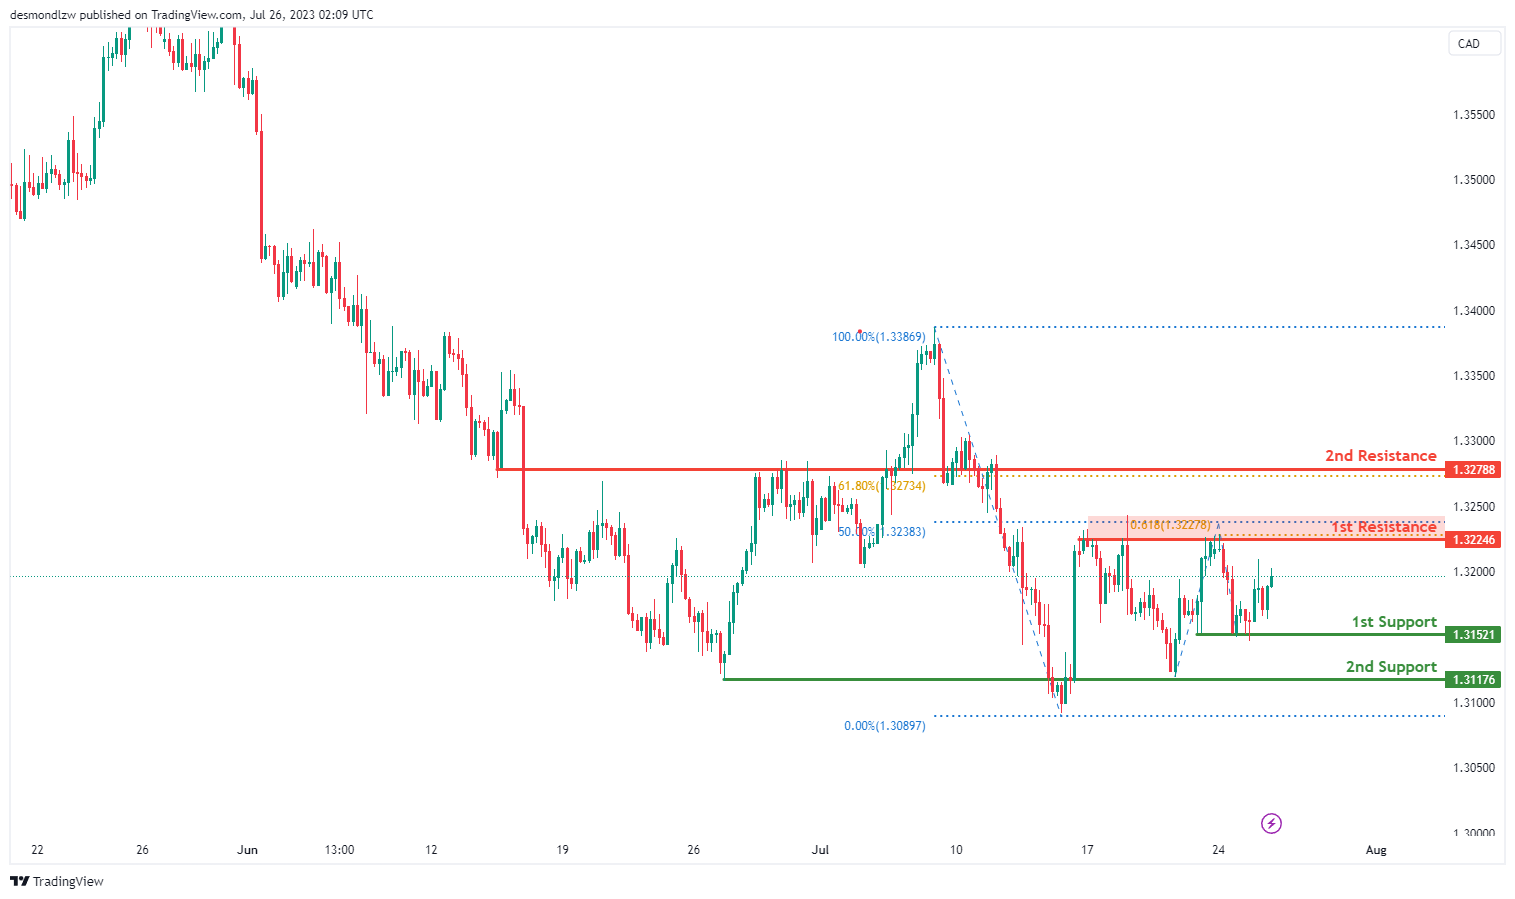
USD/CAD:
The USD/CAD chart demonstrates a bullish momentum, suggesting the potential for further upward movement.
There is a possibility of a bullish continuation towards the 1st resistance level at 1.3225. This resistance level holds significance as it represents an overlap resistance that coincides with both the 50% Fibonacci retracement and the 61.80% Fibonacci projection levels. This confluence of Fibonacci levels further reinforces its importance as a key resistance level to watch.
In addition, the 2nd resistance level at 1.3279 is characterized as an overlap resistance that coincides with the 61.80% Fibonacci retracement level.
On the downside, the 1st support at 1.3152 is identified as a pullback support, providing a potential area where the price might find temporary stability if it declines. Additionally, the 2nd support at 1.3118 is also recognized as an overlap support, adding to its significance as a potential level of price reaction.
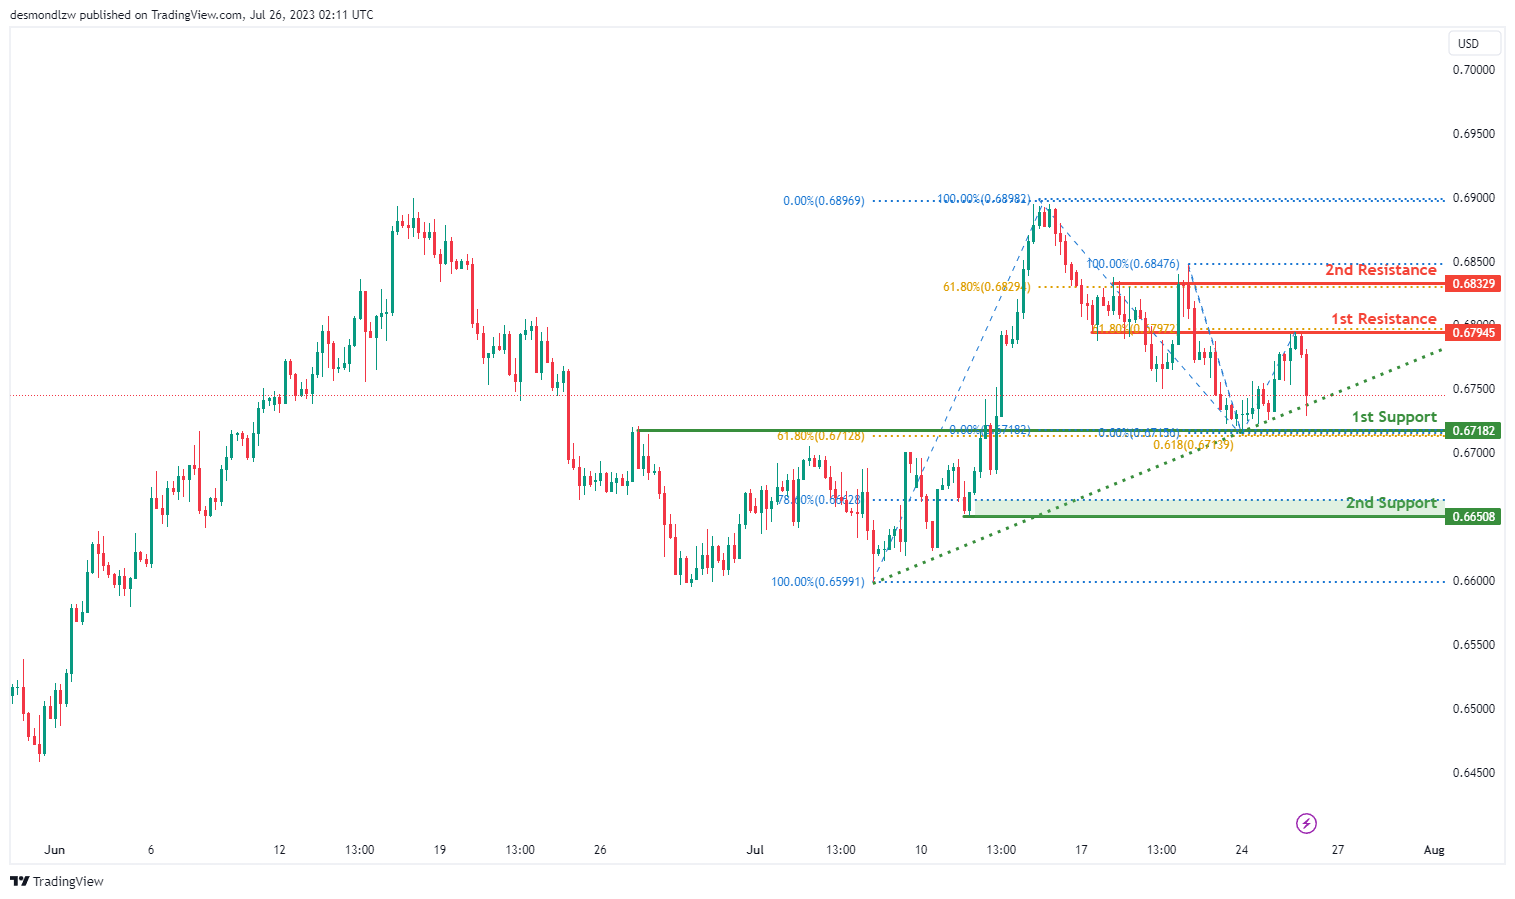
AUD/USD:
The AUD/USD chart exhibits strong bearish momentum with high confidence, indicating a potential continuation of the downtrend.
There is a likelihood of a bearish continuation towards the 1st support level at 0.6718, which is an overlap support that coincides with both the 61.80% Fibonacci retracement and the 61.80% Fibonacci projection levels. This alignment of Fibonacci levels strengthens the support’s significance as a potential area where the price might find stability amid the bearish movement. In addition, the 2nd support at 0.6651 is considered a pullback support and corresponds to the 78.60% Fibonacci retracement level.
On the upside, the 1st resistance at 0.6795 is recognized as an overlap resistance and aligns with the 61.80% Fibonacci retracement level.
Further upward movement may encounter another barrier at the 2nd resistance level of 0.6833. This resistance is identified as both an overlap resistance and coincides with the 61.80% Fibonacci retracement level, making it a significant area to watch for potential price resistance.
NZD/USD
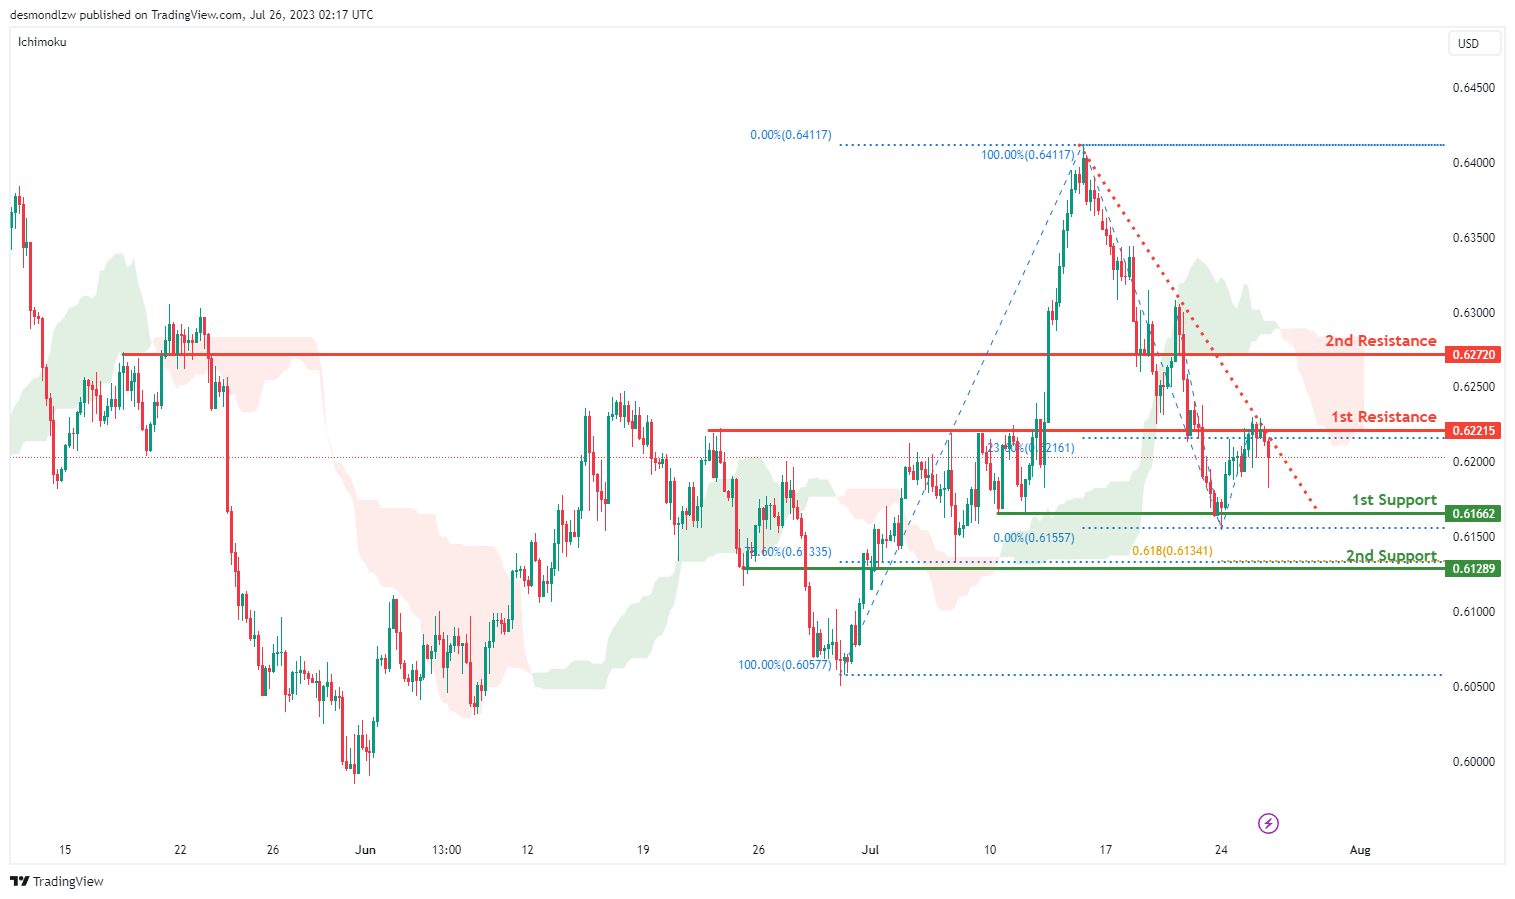
The NZD/USD chart is currently demonstrating a bearish momentum. This trend is influenced by the price being within the bearish Ichimoku cloud and below a significant descending trend line, suggesting that further bearish movement is expected.
In this scenario, the price could potentially continue its bearish run towards the 1st support level. The 1st support level is at 0.6166 and is considered a multi-swing low support, a potential level where buyers could enter the market. If the price falls further, the 2nd support level is at 0.6128, aligning with an overlap support and the 78.60% Fibonacci retracement level, another potential buying zone.
The 1st resistance level is at 0.6221, defined as an overlap resistance and the 23.60% Fibonacci retracement level. This could be a potential selling zone. The 2nd resistance level is at 0.6272, which acts as a pullback resistance, another potential level for sellers to enter the market.
DJ30:
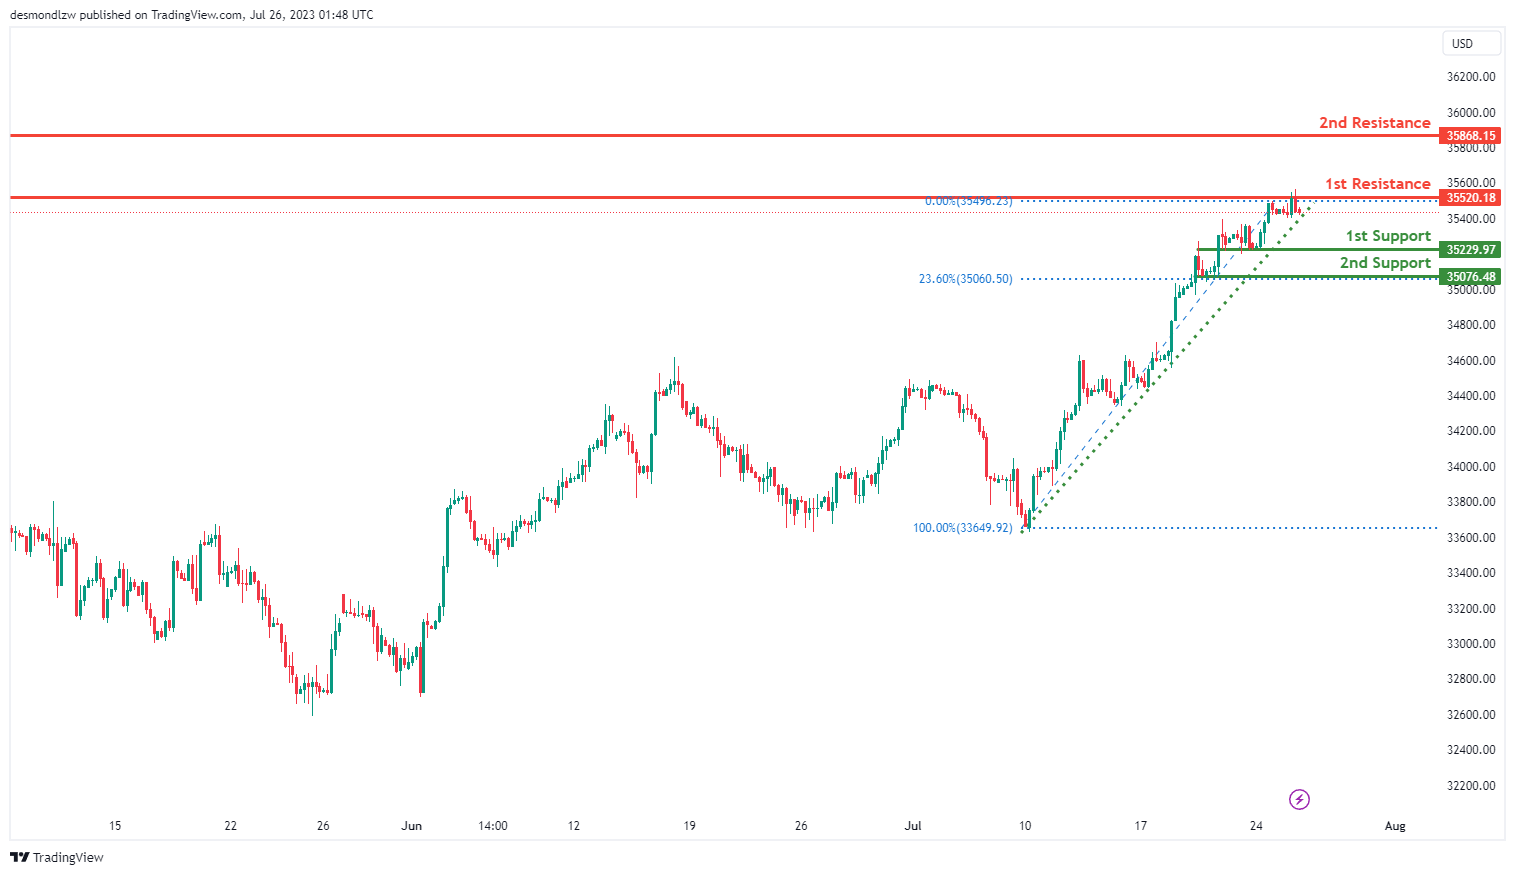
The DJ30 (Dow Jones Industrial Average) chart exhibits a bullish momentum, underlined by the fact that the price is above a major ascending trend line, thereby suggesting a potential continuation of this bullish trend towards the 1st resistance level.
The 1st support level is situated at 35229.97 and acts as a pullback support, which could indicate an area where the price may find buying interest.
The 2nd support level, standing at 35076.48, also functions as a pullback support and coincides with the 23.60% Fibonacci retracement level. This level could offer additional buying interest, fortifying the lower boundaries of the price movement.
On the upside, the 1st resistance level is pegged at 35508.02 and represents a multi-swing high resistance, indicating potential selling pressure which might cause a price pullback.
The 2nd resistance level, marked at 35868.15, corresponds to a swing high resistance level, suggesting another potential area of selling interest which might lead to a further price downturn upon reaching this level.
GER30:
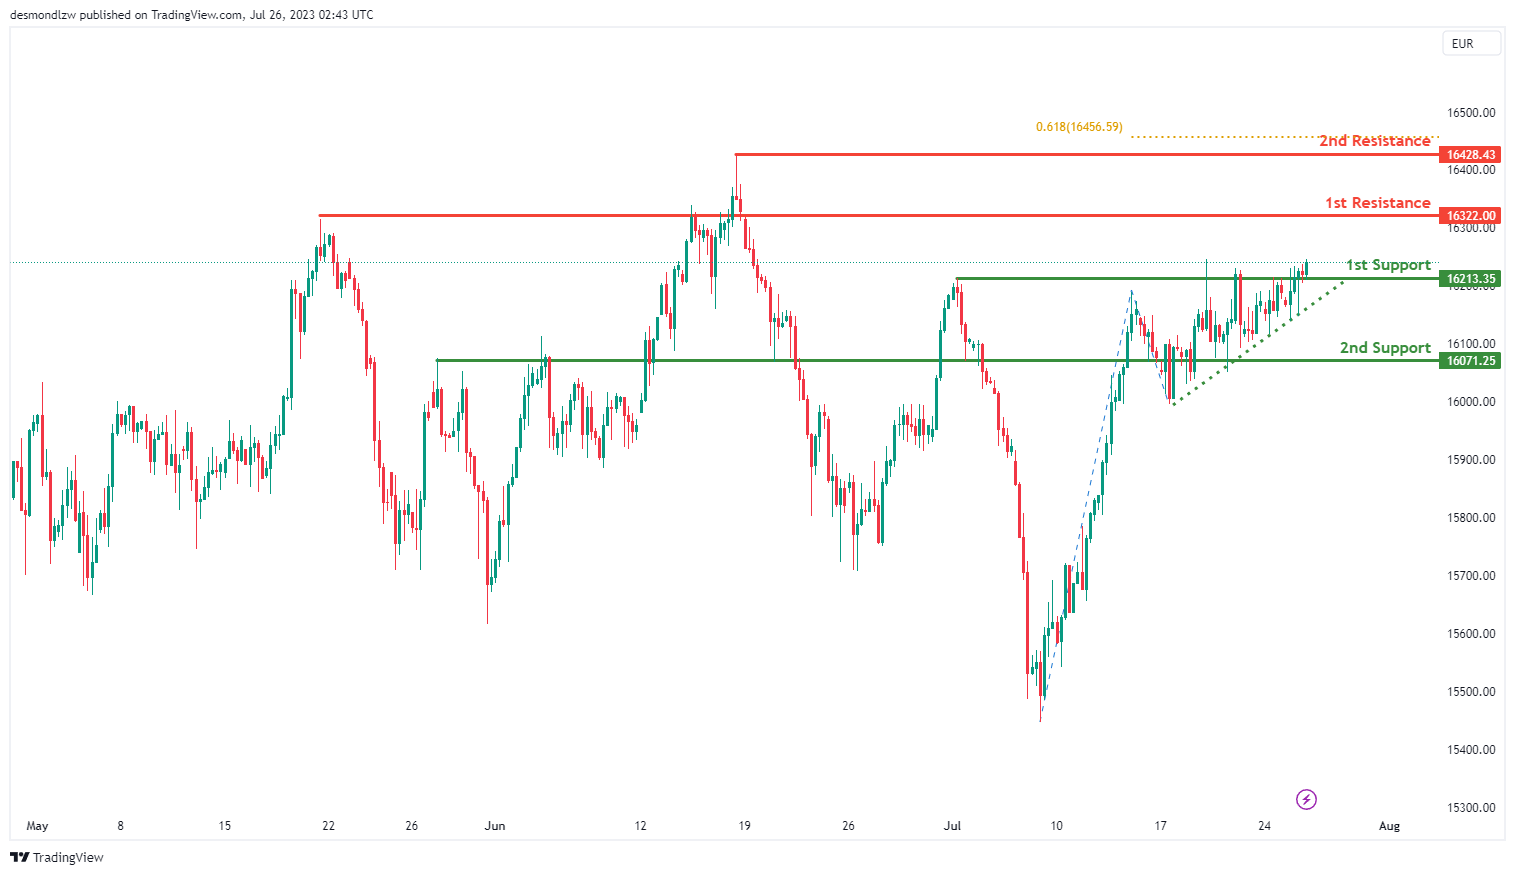
The GER30 (DAX) chart is currently demonstrating bullish momentum, with price above a major ascending trend line, indicating potential further bullish activity.
The 1st support level is situated at 16213.35, acting as an overlap support. This level could signify a notable area of buyer interest, possibly prompting a price bounce. The 2nd support level is at 16079.56, another overlap support, further buttressing the lower price boundary.
Moving upwards, the 1st resistance level at 16322.00 is characterized as an overlap resistance. This level could suggest a point of selling pressure, potentially triggering a price reversal. The 2nd resistance level is at 16428.43, marking a swing high resistance, and aligns with the 61.80% Fibonacci projection. This level could serve as an additional hurdle for further price ascents.
US500
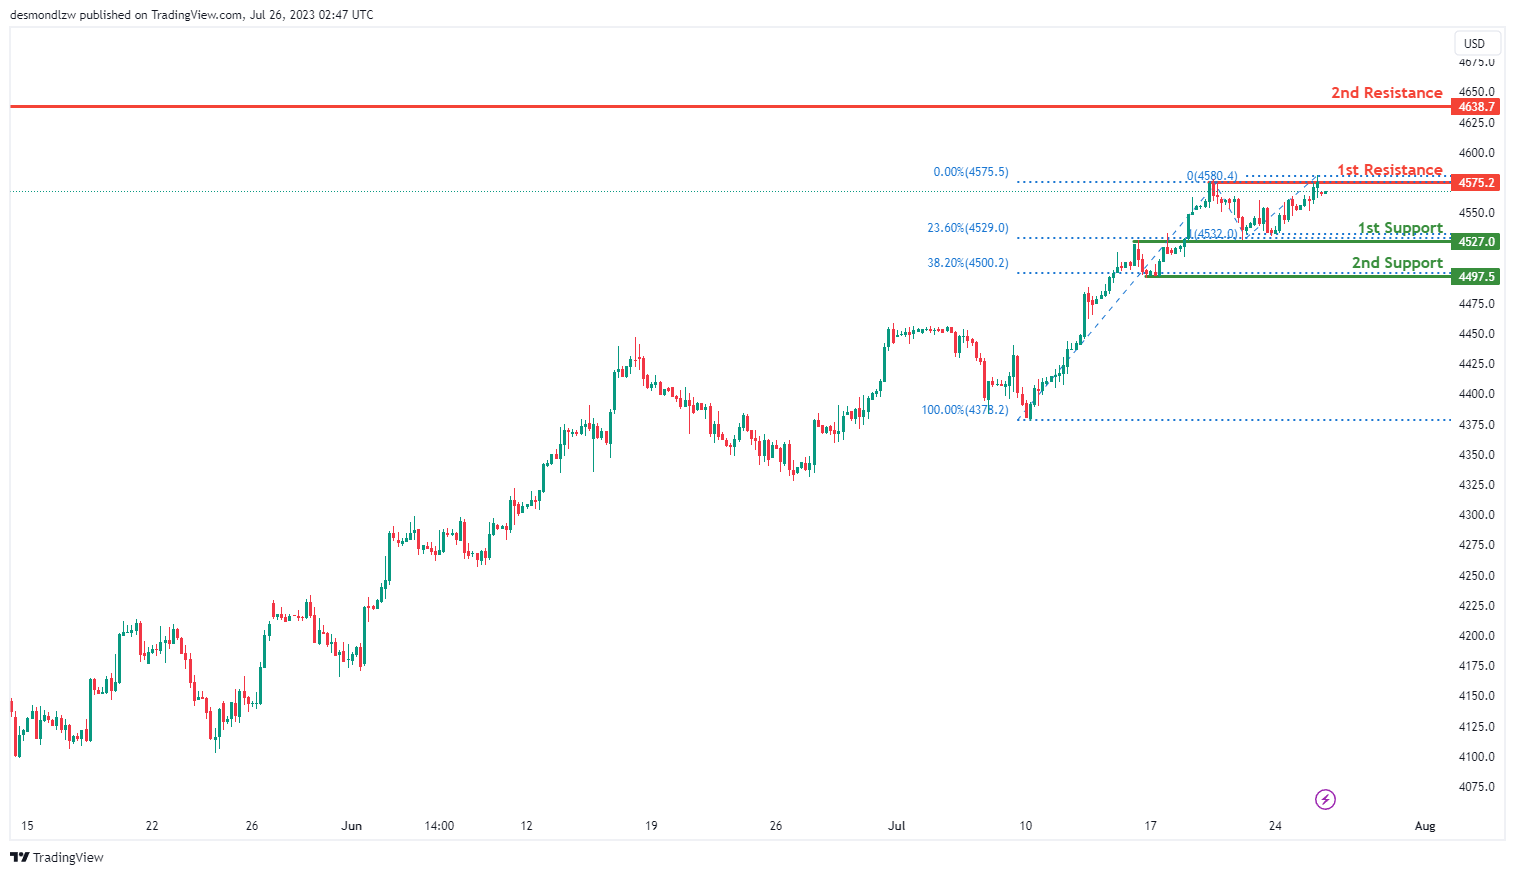
The US500 (S&P 500) chart is currently in a bearish trend, suggesting the possibility of a downward price movement.
The 1st support level is pinpointed at 4527.0 and is identified as a pullback support. This level is further reinforced by the 23.60% Fibonacci retracement and the 100% Fibonacci projection, indicating a Fibonacci confluence that could potentially stimulate buying interest.
The 2nd support level stands at 4497.5, representing a swing low support. This level aligns with the 38.20% Fibonacci retracement, potentially serving as another area of buying interest that could stimulate an upward price bounce.
On the other hand, the 1st resistance level is located at 4575.2. This level acts as a swing high resistance and could provide significant selling pressure, potentially stalling any upward price movements.
Furthermore, the 2nd resistance level is marked at 4638.7. It also serves as a swing high resistance and could act as another significant barrier to upward price movements.
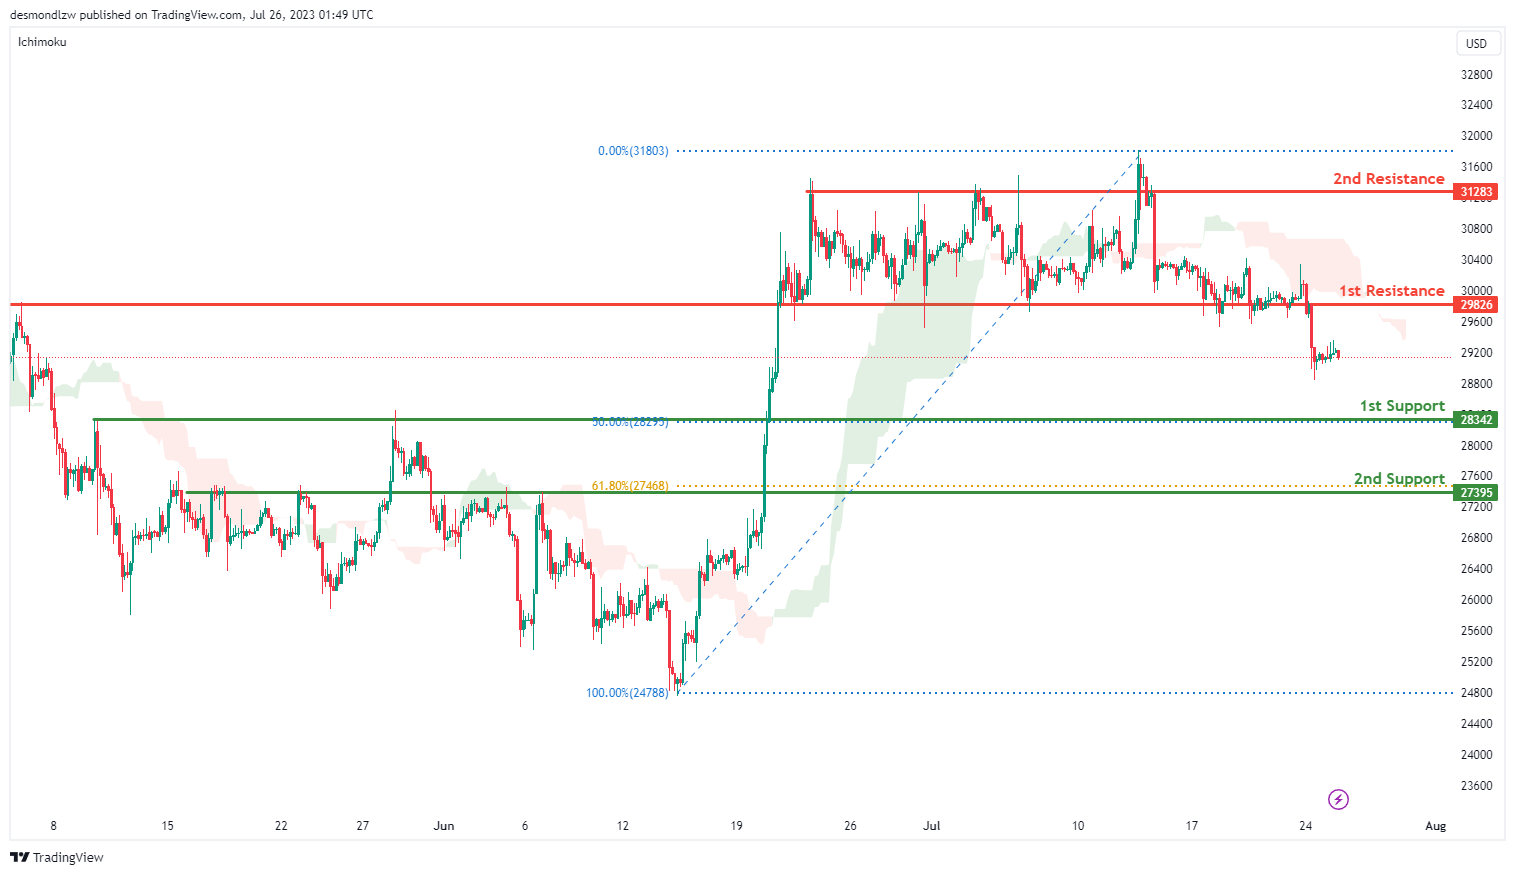
BTC/USD:
The BTC/USD chart currently displays a bearish trend, with the price positioned below the bearish Ichimoku cloud, contributing to the negative momentum. The expectation is for a bearish continuation towards the 1st support level.
The 1st support level, identified at 28342, stands as a pullback support and coincides with the 50% Fibonacci retracement level, suggesting that it could serve as a substantial area of buying interest. A 2nd support level can be found at 27395, which functions as an overlap support and aligns with the 61.80% Fibonacci retracement level, indicating another potential area of significant buying interest.
In terms of resistance, the 1st level is located at 29826 and acts as an overlap resistance. This suggests that it could present a substantial barrier to further price ascents, and potentially attract selling pressure. The 2nd resistance level is found at 31283, also an overlap resistance, implying it could serve as an additional point of selling pressure and a potential obstacle for price growth.
ETH/USD:
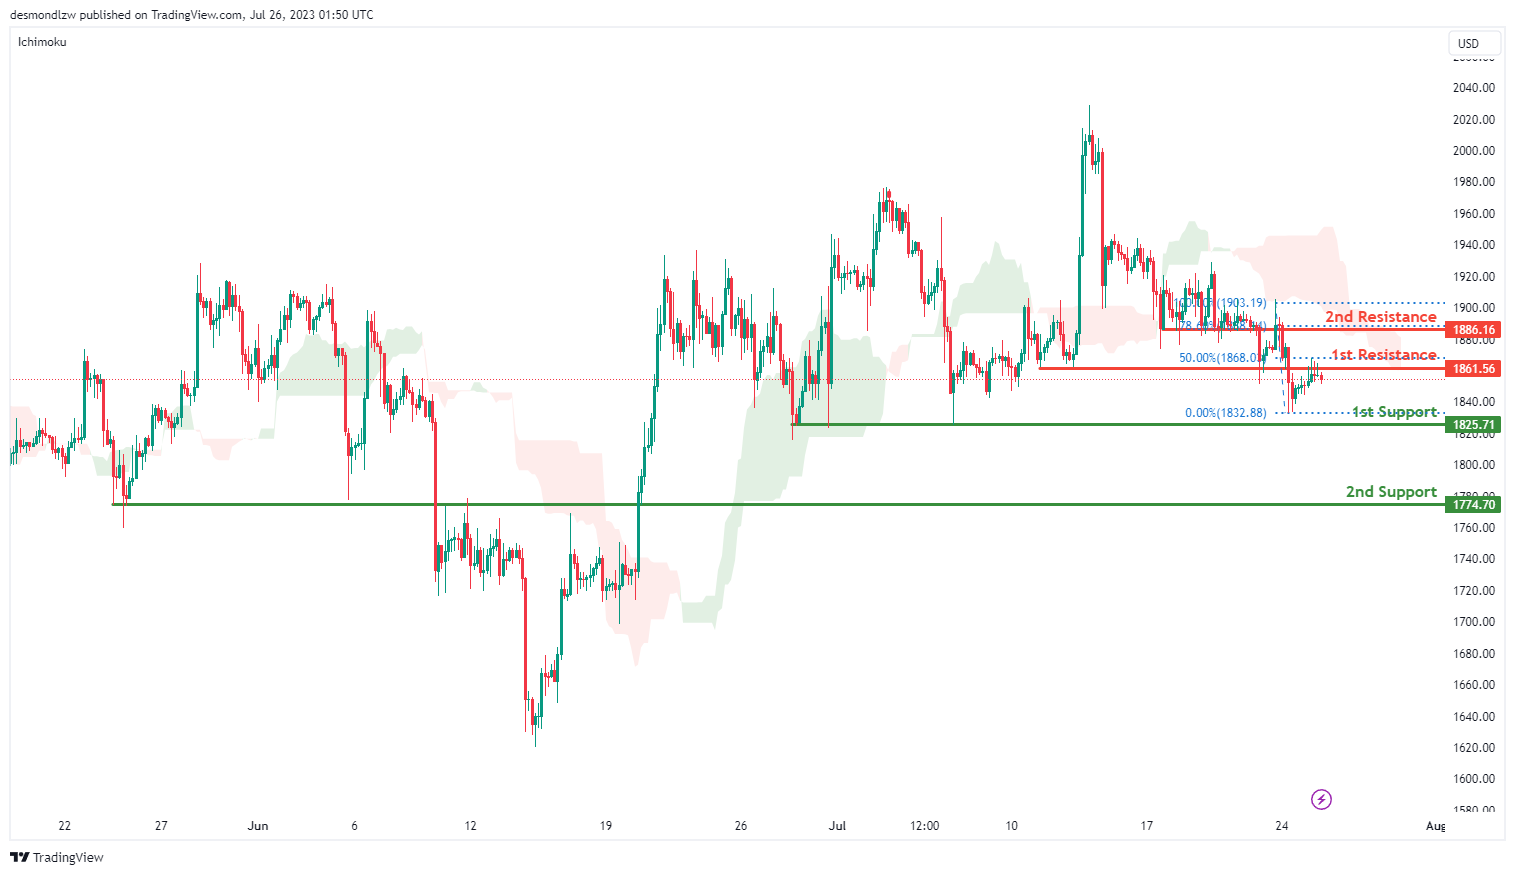
The ETH/USD chart is currently demonstrating a bearish momentum, with the price being positioned below the bearish Ichimoku cloud, which suggests an expected bearish continuation towards the 1st support level.
The 1st support level is set at 1825.71, functioning as a multi-swing low support, and could serve as a key area for potential buying interest.
The 2nd support level is found at 1774.70, operating as an overlap support. This level further bolsters the lower boundaries of the price movement and can act as an additional stronghold for buyers.
On the upside, the 1st resistance level is at 1861.56. This pullback resistance coincides with the 50% Fibonacci retracement level, indicating a potential area of selling pressure.
The 2nd resistance level is marked at 1886.16. This overlap resistance also aligns with the 78.60% Fibonacci retracement level, suggesting another significant hurdle for upward price movements, and possibly a region of increased selling pressure.
WTI/USD:
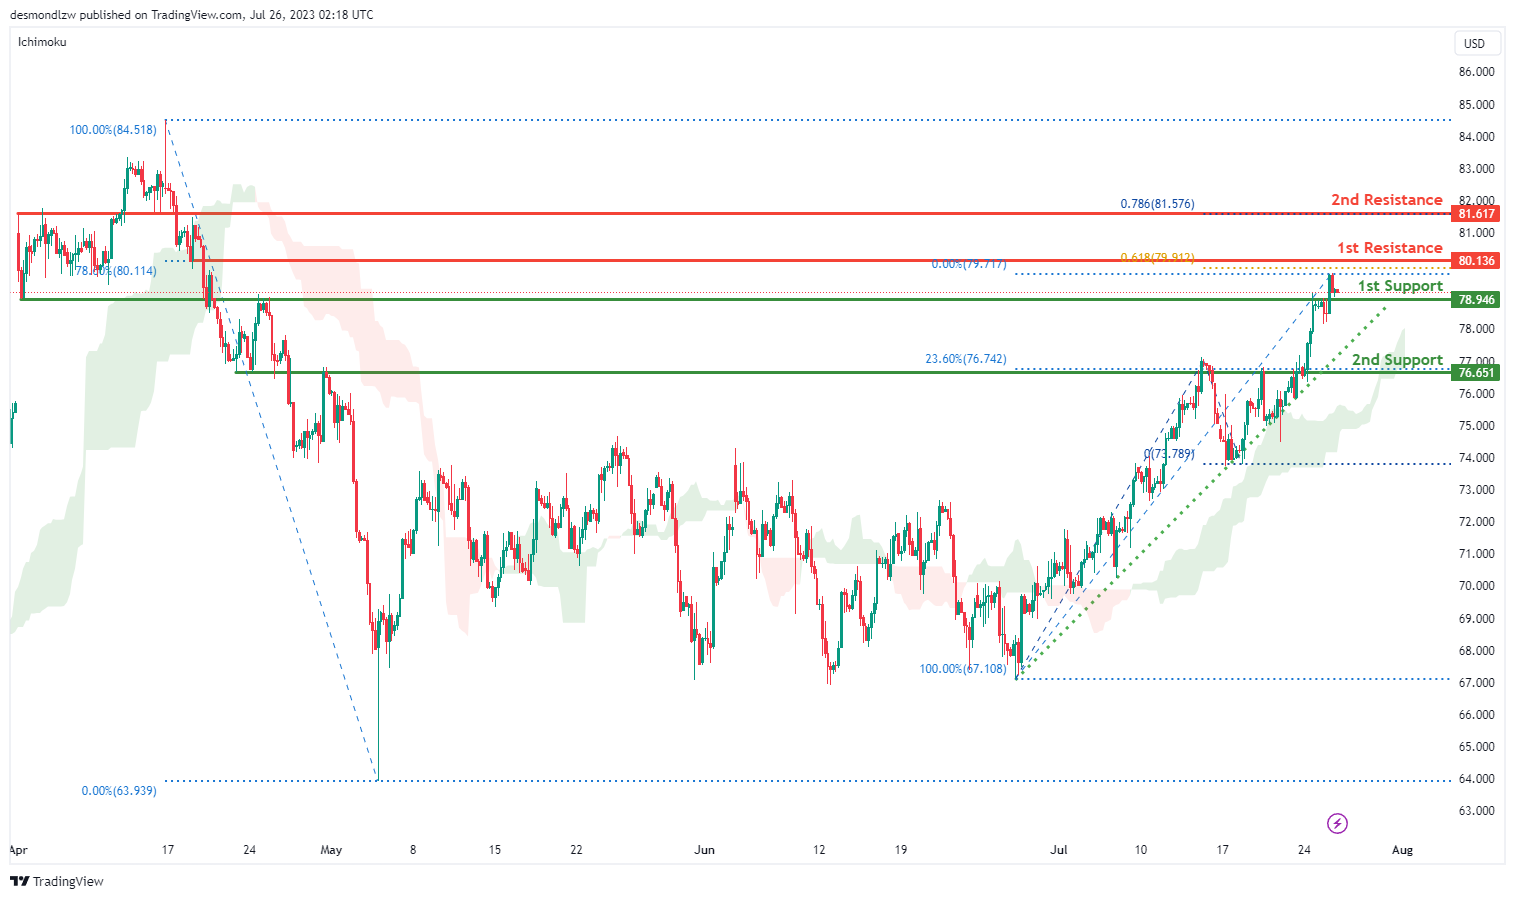
The WTI/USD chart shows a weak bearish momentum with low confidence. There is a potential scenario for a bearish continuation towards the 1st support at 78.95, which is an overlap support. Additionally, the 2nd support at 76.65 serves as another key area, which is also an overlap support that coincides with the 23.60% Fibonacci retracement. Furthermore, there is an ascending trend line that also lies above the Ichimoku cloud.
On the upside, the 1st resistance at 80.14 is an overlap resistance and also aligns with the 78.60% Fibonacci retracement and 61.80% Fibonacci projection levels, indicating a Fibonacci confluence. Further upward movement may find resistance at the 2nd resistance level of 81.62, which is an overlap resistance and corresponds to the 78.60% Fibonacci projection level.
XAU/USD (GOLD):
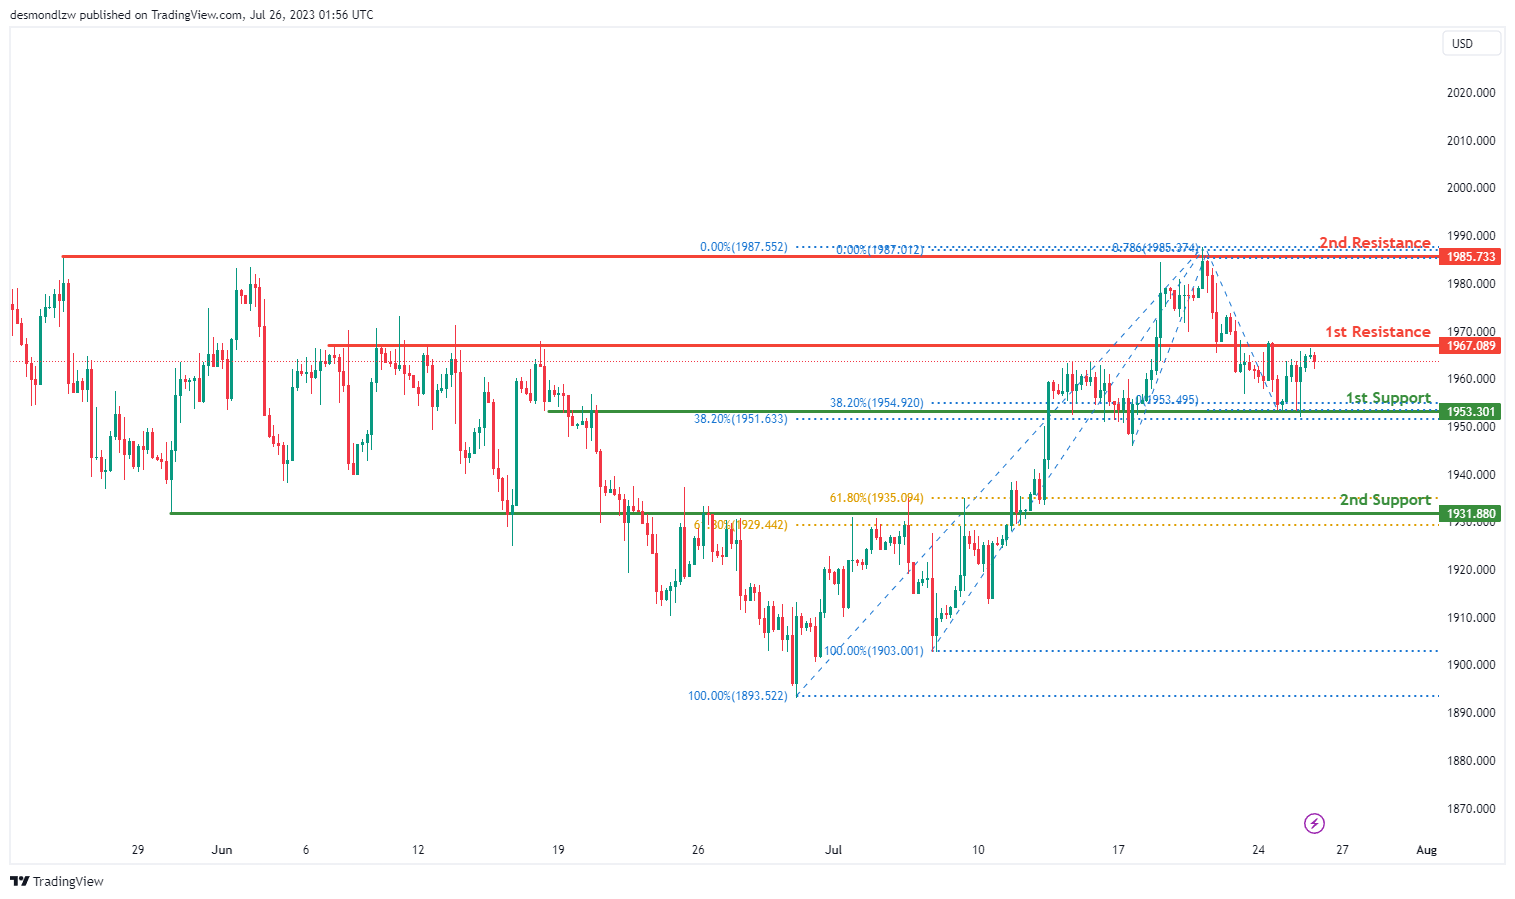
The XAU/USD chart is currently showing a neutral momentum, with the price potentially fluctuating between the 1st resistance and 1st support level.
The 1st support level is at 1953.30, marked by overlap support and coincides with both 38.20% Fibonacci retracement levels, suggesting a significant Fibonacci confluence. The 2nd support is at 1931.88, another overlap support that aligns with both 61.80% Fibonacci retracement levels, further confirming a Fibonacci confluence.
The 1st resistance level is at 1967.08, characterized by overlap resistance, which could potentially cap the price ascent. The 2nd resistance is at 1985.73, marked as a multi-swing high resistance, implying a possible significant barrier for further price increase.