Sample Category Title
NZDUSD at Range Midpoint But Bullish Pressure Rising
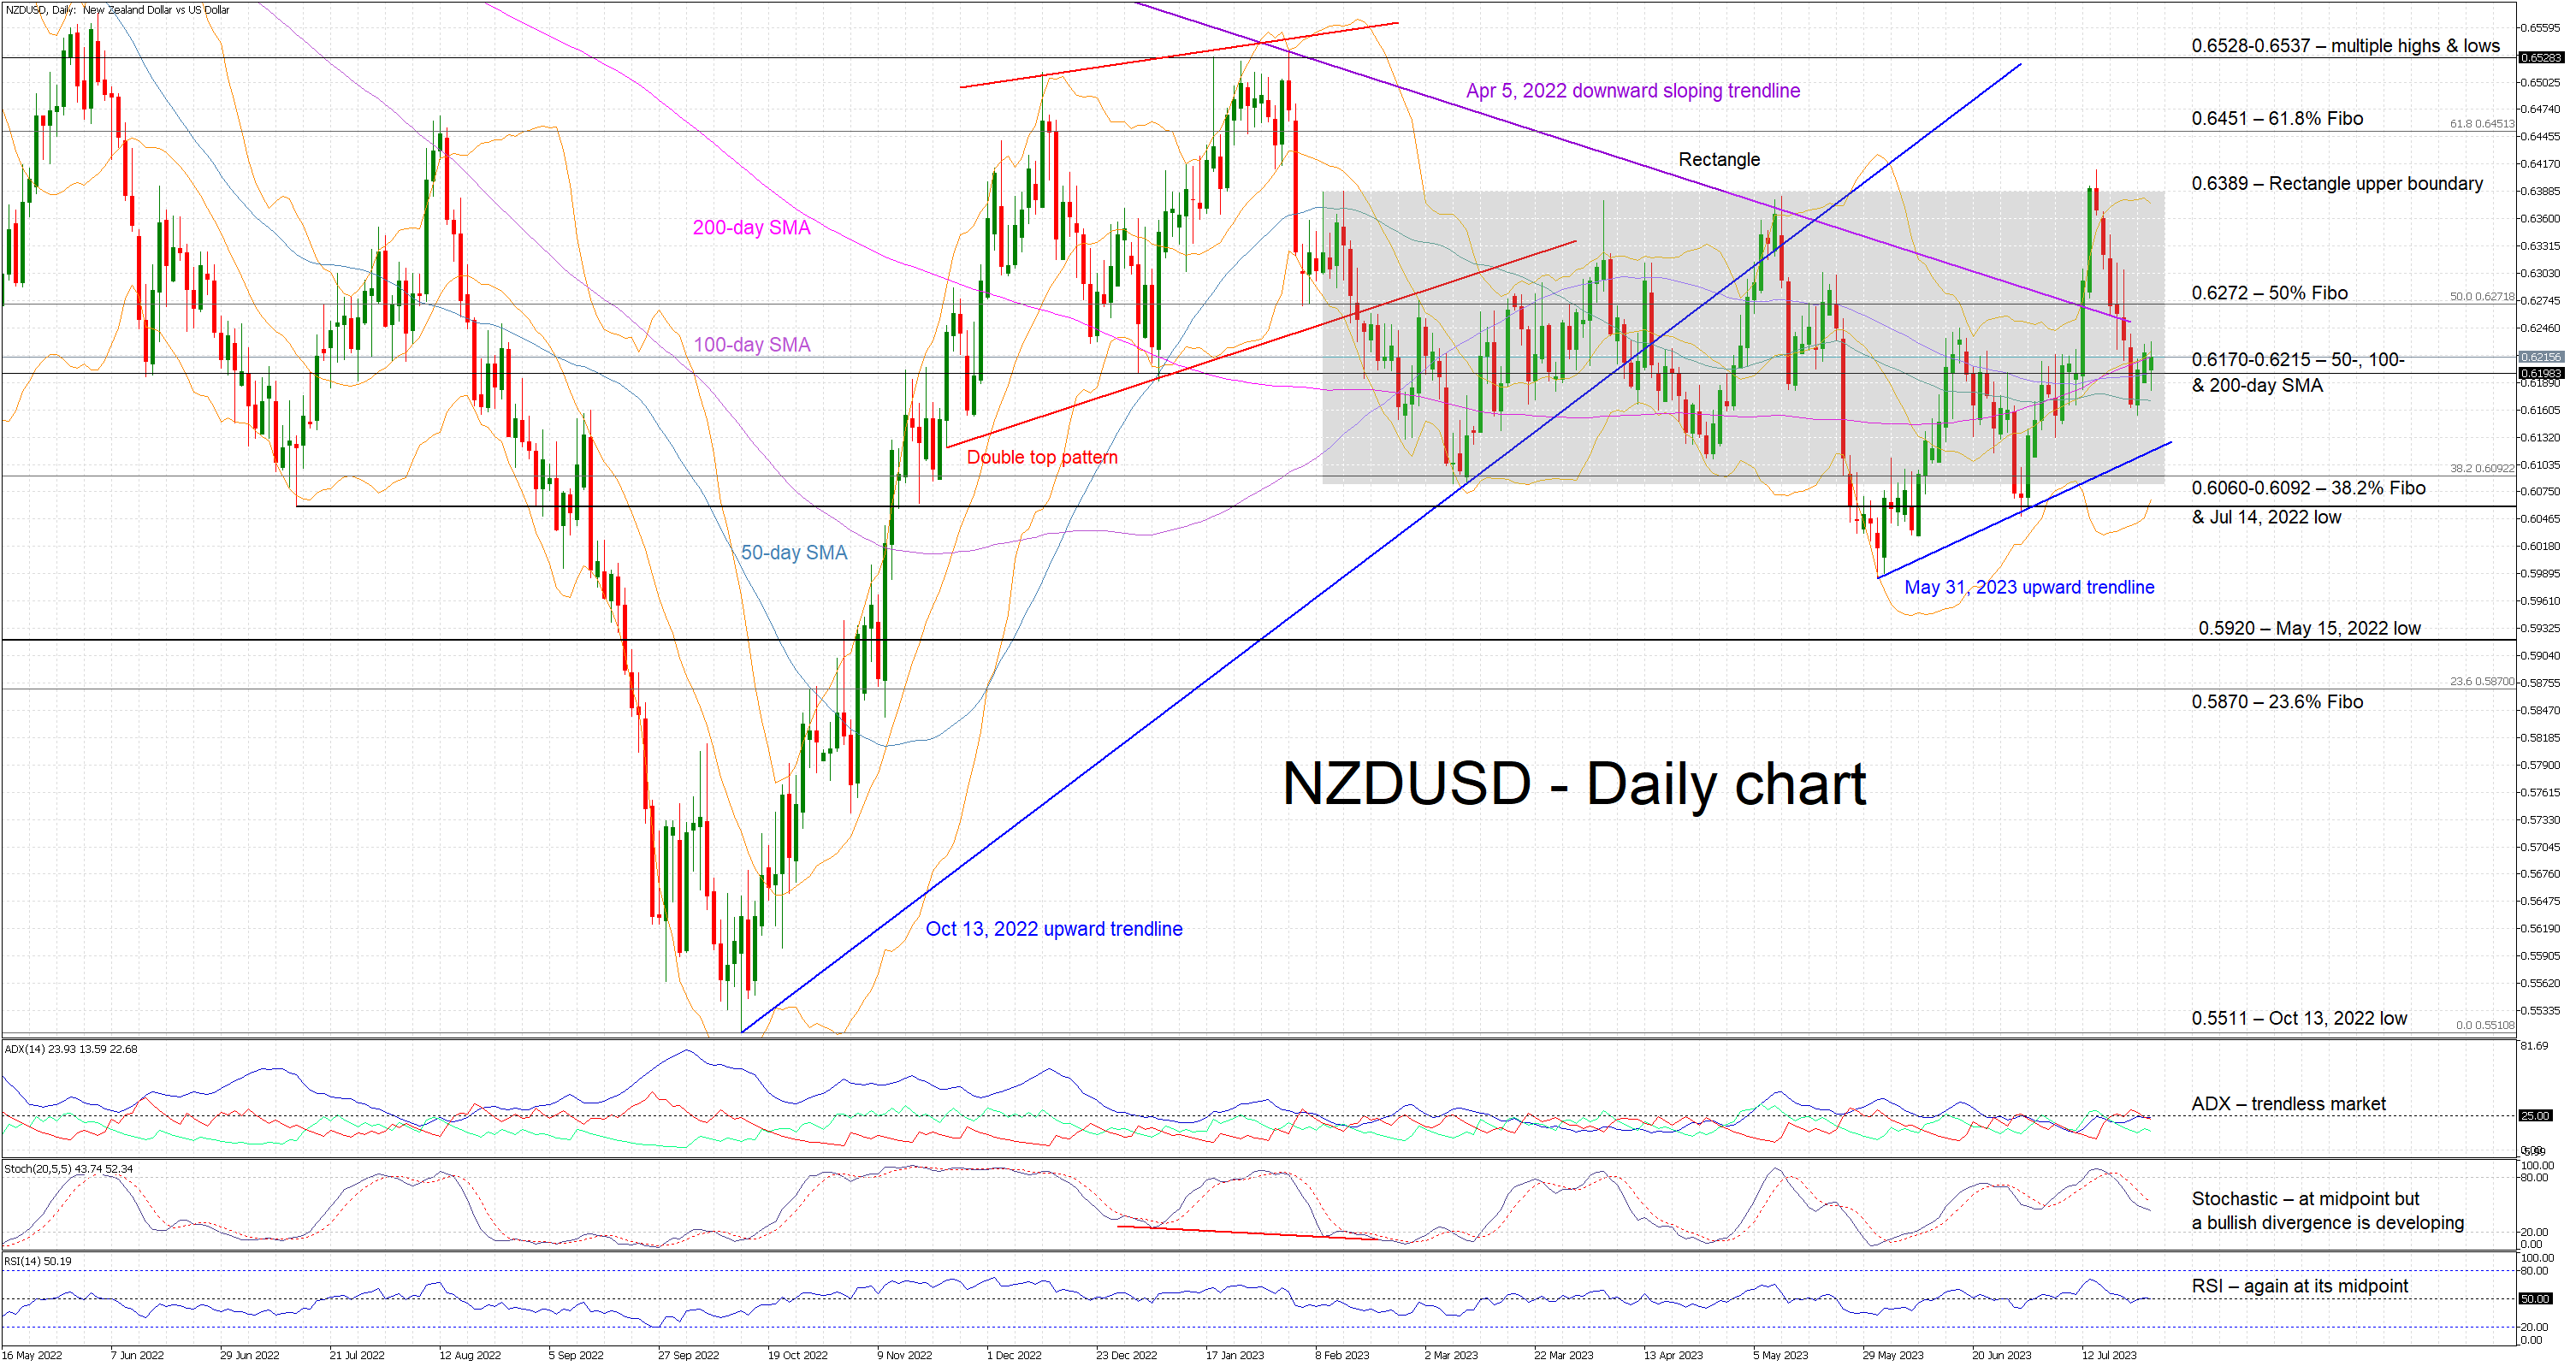
NZDUSD is hovering a tad below the midpoint of the rectangle that has been in place since February 2023, as market participants have been unable to stage a sustained move up to now. However, since the failed late-May bearish breakout, a series of higher highs and higher lows has been in place with the bulls aiming for the next peak to occur above the July 14 high of 0.6411. Maybe, the continued convergence of the simple moving averages (SMAs) could play a role soon.
This delicate balance is reflected in most momentum indicators. The Average Directional Movement Index (ADX) remains in range-trading territory, and the RSI is hovering a tad above its 50-threshold. Similarly, the stochastic oscillator is trading sideways, very close to its midpoint. However, a bullish divergence appears to be forming since the latest higher low in NZDUSD has been met by a lower low in the stochastic.
Should the bulls feel more optimistic, they would try to keep the index above the 0.6170-0.6215 range and gradually test the resistance set by the 50% Fibonacci retracement of the April 5, 2022 – October 13, 2022 downtrend at 0.6272. If successful, they can then lead NZDUSD higher towards the upper boundary of the aforementioned rectangle at 0.6389.
On the other hand, the bears are keen on breaking the busy 0.6170-0.6215 range and then aim for another bearish breakout. However, they first have to overcome the May 31, 2023 upward trendline and the support set by the 0.6060-0.6092 range that is populated by the 38.2% Fibonacci retracement and the July 14, 2022 low respectively.
To conclude, market participants are in waiting mode ahead of this week’s key events. However, NZDUSD bulls might feel more confident on the back of the developing divergence.
FOMC Day, Look Out for Fed Chair Powell’s View on Inflationary Expectations
- Current slowdown in inflationary growth has led to lower odds of another Fed Funds rate hike after today’s FOMC.
- Inflationary expectations measured by US breakeven inflation rates have started to tick higher since the end of May, in line with the 19% rally seen in WTI crude oil futures.
- If rising inflationary expectations are left unchecked, it may spiral into the real economy with a potential upside reversal in the lagging CPI data in the coming months.
The US Federal Reserve FOMC meeting will conclude later today where the interest rates futures market based on the CME FedWatch tool has priced in almost a 100% chance of a 25 basis points (bps) hike to bring the Fed Funds rate to 5.25% to 5.50%, and a 20% chance of another 25 bps hike for the Fed Funds rate to hit the terminal rate of 5.50% to 5.75% on the next FOMC meeting in September before the expected first rate cut to materialize in either May or June next year.
Today’s FOMC meeting will not release any new economic data and Fed Funds rate (dot plot) projections. Thus, Fed Chair Powell’s press conference will be closely watched for clues on the Fed’s current thinking on growth and inflation and how long it will maintain its current “higher interest rates for a longer period” guidance.
There was some form of “rejoice” in the last two weeks when the US and other developed nations’ consumer inflation rates for June grew at the slowest pace in almost two years. In contrast from a supply-side, and financial markets point of view, inflation may start to creep back up in Q4.
Inflationary expectations via breakeven rates have ticked higher since late May
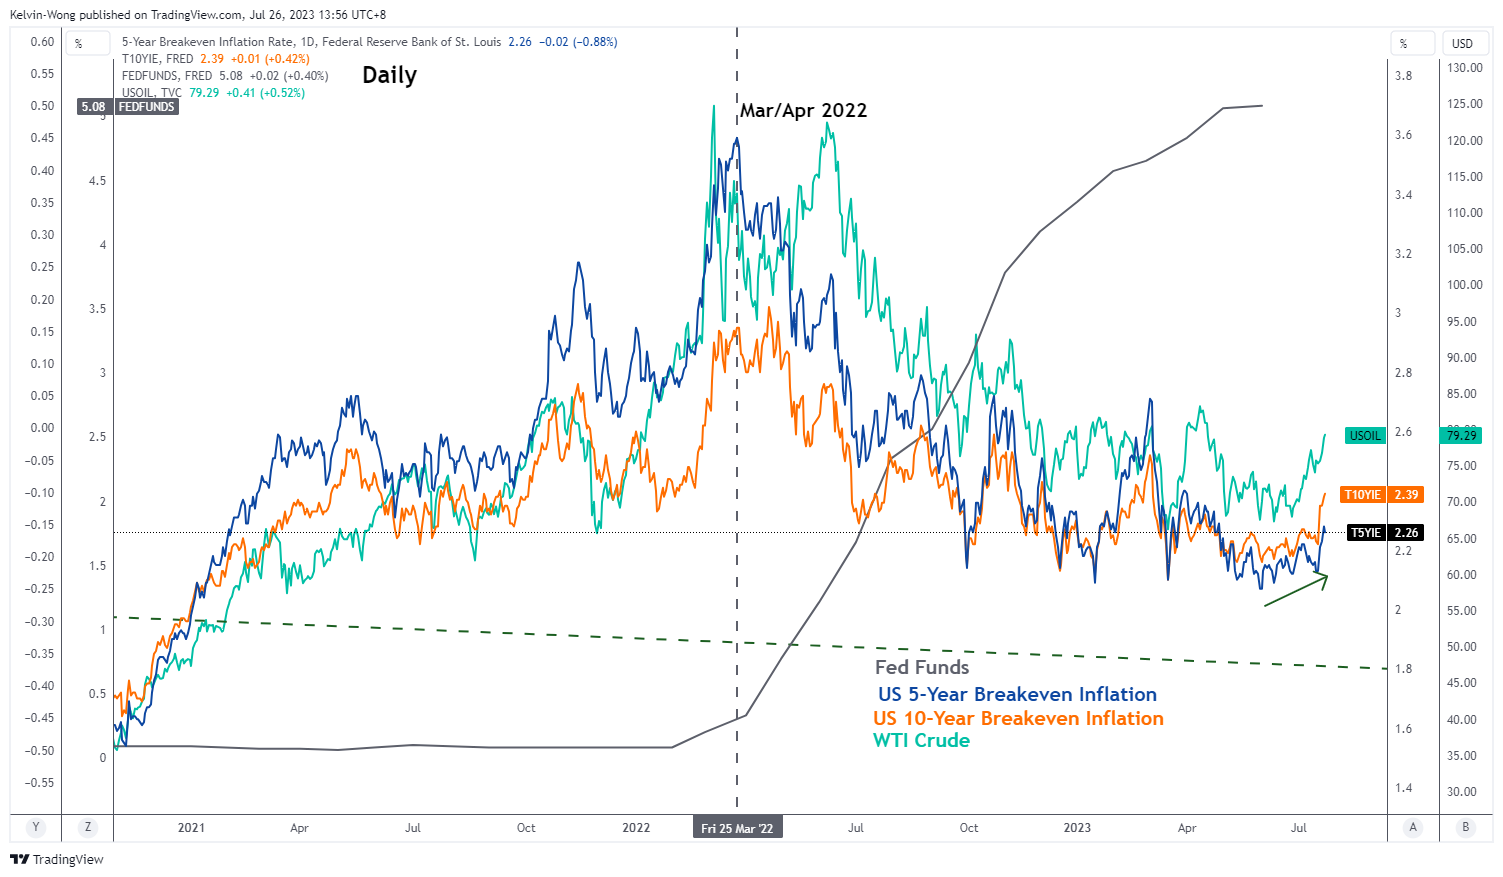
Fig 1: WTI crude oil correlation with US 5-year & 10-year breakeven inflation rates as of 25 Jul 2023 (Source: TradingView, click to enlarge chart)
Based on data in the past five years, oil prices have had a significant direct correlation with inflationary expectations as measured by the tradable 5-year and 10-year US breakeven inflation rates derived from Treasury Inflation-Protected securities.
Since its 28 June 2023 low of US$67.05 per barrel, WTI crude oil futures have rallied by 19% to print a recent high of US$79.90 per barrel on Tues, 25 Jul which in turn led to a similar directional up move in the 5-year and 10-year US breakeven rates. The 10-year US breakeven rate rose to 2.39% on Tuesday, 25 July, that’s close to a four-month high.
Medium-term bullish breakout in WTI crude oil
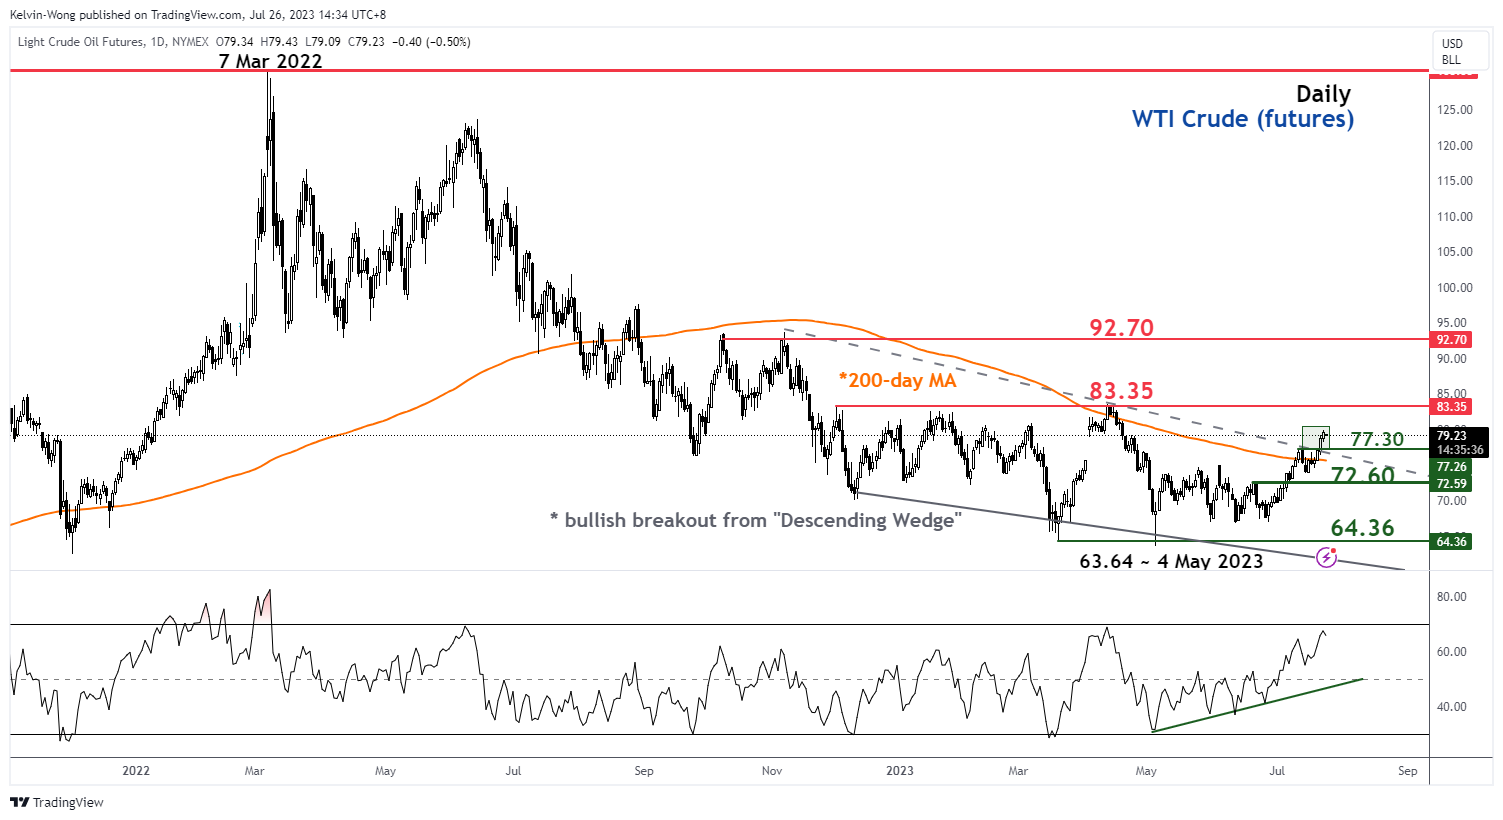
Fig 2: WTI crude oil futures medium-term trend as of 26 Jul 2023 (Source: TradingView, click to enlarge chart)
From a technical analysis standpoint, the medium-term momentum of WTI crude oil futures has turned bullish with the clearance of the US$77.30 per barrel key intermediate resistance level and 200-day moving average. The next resistances stand at US$83.35 and US$92.70 per barrel which implies that inflationary expectations measured by the breakeven inflation rates in the US may tick higher in the coming months. Hence, if left unchecked, these reflexivity feedback loops inherent in financial markets may spiral into the real economy where lagging CPI data faces the risk of an upside reversal.
Therefore, watch Fed Chair Powell’s lips later on any mention of inflationary expectations.
GBP/USD Technical Analysis
On the hourly chart of GBP/USD at FXOpen, the pair found support near the 1.2815 zone. The British Pound even seems to be forming a base and attempting a recovery wave against the US Dollar.
The pair was able to clear a connecting bearish trend line with resistance at 1.2850 and the 50-hour simple moving average. It is now facing a hurdle near the 1.2900 zone. If there is a clear upside break above 1.2900, the pair could rise toward the 1.2960 level in the near term.
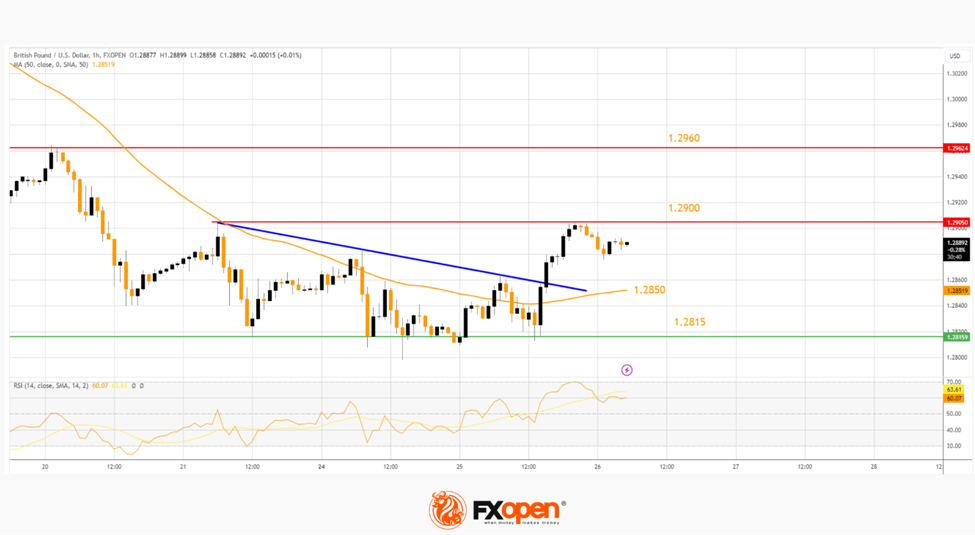
The next key resistance sits near the 1.3000 level, above which the GBP/USD pair might gain bullish momentum and revisit the 1.3050 zone.
On the downside, the first major support is near the 50-hour simple moving average at 1.2850. The next support is forming near the 1.2815 level, below which the pair might move lower toward 1.2750.
This article represents the opinion of the Companies operating under the FXOpen brand only. It is not to be construed as an offer, solicitation, or recommendation with respect to products and services provided by the Companies operating under the FXOpen brand, nor is it to be considered financial advice.
Dollar Little Changed as Markets Counting Down to Fed Decision
Markets
US and European data again parted ways yesterday. EMU data confirmed recent evidence of a loss of momentum in activity. Germany Ifo Business climate worsened for the third consecutive month. The headline index slipped from 88.6 to 87.3, mainly due to a worsening current assessment (91.3 from 93.7). Expectations eased only from 83.8 to 83.5 on a slightly better/less worse assessment in the services sector. The ECB quarterly lending survey showed that standards for credit to enterprises and households tightened further. This will probably continue in Q3, albeit at a more moderate pace. Credit demand also fell sharply. The report indicates that ECB tightening is filtering through to the economy and is relevant input for tomorrow’s ECB decision. US data (S&P Corelogic house prices, Philly Fed nonmanufacturing activity and especially Conference Board consumer confidence) all printed better/stronger than expected. Consumer confidence even reached the best level since July 2021. Still, with the Fed and the ECB meetings looming, the impact of the data on interest rate markets was limited and short-lived. In the end, US and German yields both gained marginally, but no more than 2.5 bps. Equities stay in consolidation modus (S&P +0.28%, Eurostoxx +0.19%). Eco divergence helped the dollar to gain marginally against the euro (EUR/USD close 1.1055), but the greenback lost against the yen (USD/JPY close 140.9). Sterling had a good run. Better than expected CBI confidence maybe helped. EUR/GBP finally forced a technical break back below 0.86 (close 0.857).
This morning Asian equities are trading mixed with the likes of Japan, China and Korea ceding ground. Australia outperforms on softer than expected CPI data (cf infra). US Treasuries and the dollar are little changed as markets are counting down to this evening’s Fed decision and Powell’s press conference. Considering the June median dots for a peak in the target range of 5.50/5.75% and Fed comments over previous month, anything different from a 25 bps hike would be a big surprise. Even with the latest payrolls and CPI marginally softer than expected, other data suggest the US economy is holding resilient and that no recession in imminent. In this context, we expect Powell to keep the door open for a further step in September (or later) depending on the data. For markets, such a scenario shouldn’t be a big surprise. Even if Powell holds a hawkish tone, it won’t be easy for the 2-y and 10-y yield to surpass big figure yields at 5.0% and 4.0% respectively. Such a test/move probably needs strong payrolls (next week) and/or higher than expected inflation data (August 10). Given recent relative data evidence (especially compared to EMU), the dollar might stay well bid, with EUR/USD 1.1012 (22 June top)/1.10 a first next reference.
News and views
The Hungarian central bank (MNB) yesterday again cut the overnight tender rate by 100 bps to 15%. The convergence with the base rate, currently 13% and deemed enough to manage fundamental inflation risks, continues gradually as long as the improvement in risk perceptions vs Hungarian assets (ie. the forint) persists. The MNB expects the economy to grow a mere 0-1.5% this year as real wages decline, corporate costs rise and consumers remain cautious. Momentum should pick up though in the second half of 2023 amid rising real wages due to falling inflation. Growth in 2024 and 2025 is seen at 3.5-4.5% and 3-4% respectively. Inflation would decrease further at a rapid pace because of tight monetary policy, falling global commodity prices and declining domestic consumption. Yearly CPI is projected at 16.5-18.5% for 2023, 3.5-5.5% for 2024 and 2.5-3.5% for 2025. The forint yesterday declined on a net daily basis though losses stayed orderly. EUR/HUF rose from 377.87 to 379.84.
Australian Q2 CPI missed estimates by a slight margin. The headline figure rose 0.8% q/q to be up 6% y/y compared to a 1% and 6.2 % forecast and down from Q1’s 1.4% and 7%. The trimmed mean, a gauge smoothing volatile items and closely watched by the Reserve Bank of Australia, also fell short of consensus, coming in at 0.9% q/q and 5.9% y/y (down from 6.6% in Q1). The RBA meets next week. It kept rates steady in July at 4.10% and today’s data flipped market betting from a 50% chance for a 25 bps rate hike to just 20%. Arguing for additional tightening, though, is Australia’s strong and tight labour market which pushed the unemployment rate to a historically low 3.5% in last week’s June report. In this respect, it is worth nothing that services inflation, closely related to the labour market and wage gains, rose to the highest since 2001, 6.3%. Australian swap yields tumble up to 14 bps at the front end of the curve. The Aussie dollar hit an intraday low of AUD/USD 0.673 before paring losses to 0.676 currently.
EUR/CHF Daily Outlook
Daily Pivots: (S1) 0.9521; (P) 0.9576; (R1) 0.9605; More...
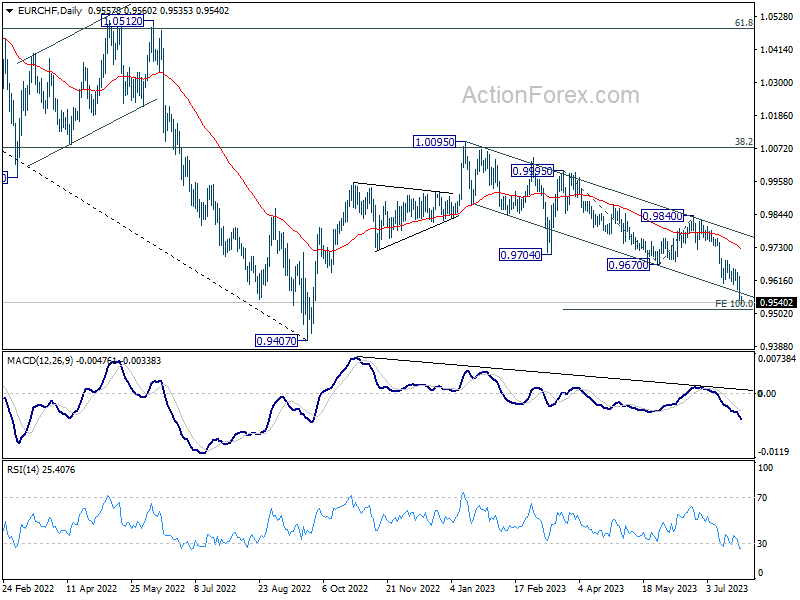
Intraday bias in EUR/CHF stays on the downside at this point. Current fall is part of larger decline from 1.0095. Next target is 100% projection of 0.9995 to 0.9670 from 0.9840 at 0.9515. On the upside, above 0.9586 minor resistance will turn intraday bias neutral and bring consolidations first.
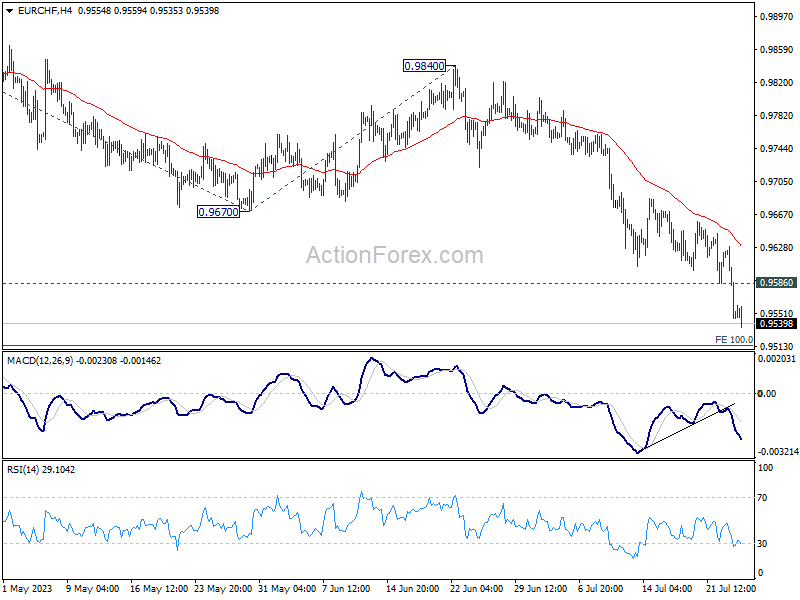
In the bigger picture, medium term outlook is staying bearish as the pair is capped well below falling 55 W EMA (now at 0.9889). Down trend from 1.2004 (2018 high) is in favor to extend through 0.9407 at a later stage. Nevertheless, decisive break of 38.2% retracement of 1.1149 to 0.9407 will raise the chance of bullish trend reversal.
EUR/GBP Daily Outlook
Daily Pivots: (S1) 0.8544; (P) 0.8590; (R1) 0.8616; More...
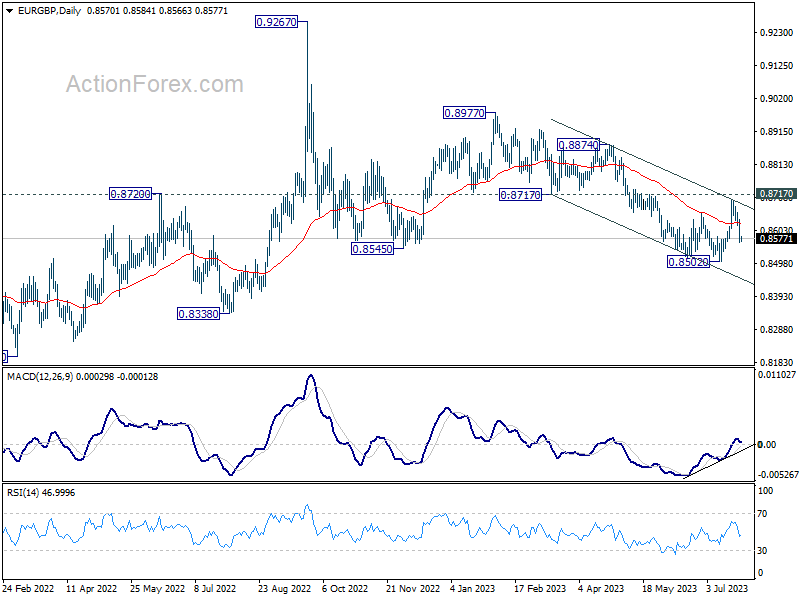
Intraday bias in EUR/GBP stays on the downside at this point. Recovery from 0.8502 could have completed ahead o f0.8717 support turned resistance, keeping outlook bearish. Retest of 0.8502 low should be seen next, and firm break there will resume larger decline form 0.8977. On the upside, above 0.8618 minor resistance will turn intraday bias neutral first.
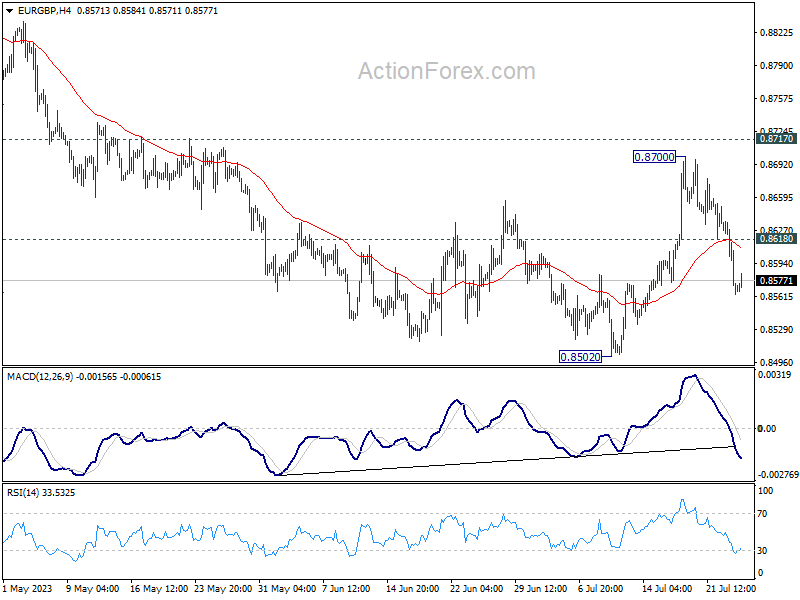
In the bigger picture, the down trend from 0.9267 (2022 high) is seen as part of the long term range pattern from 0.9499 (2020 high). Firm break of 0.8717 support turned resistance will argue that it has completed with three waves down to 0.8502. Further break of 0.8977 will bring retest of 0.9267 high. Nevertheless, rejection by 0.8717, followed by break of 0.8502 will resume the decline towards 0.8201 (2022 low).
EUR/AUD Daily Outlook
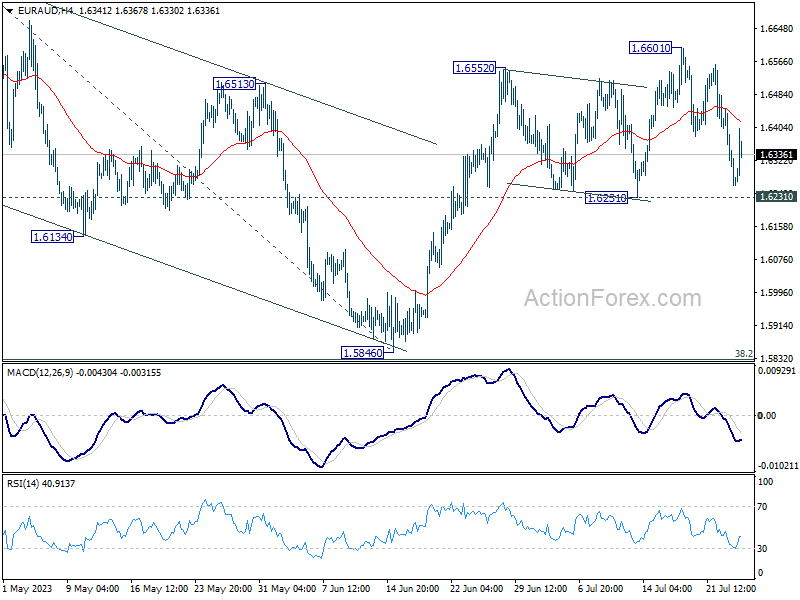
Daily Pivots: (S1) 1.6210; (P) 1.6331; (R1) 1.6398; More...
Intraday bias in EUR/AUD stays neutral and further rally is still in favor with 1.6231 support intact. On the upside, break of 1.6601 will resume the rebound from 1.5846 and target 1.6785 high next. However, firm break of 1.6231 will bring deeper fall to extend the corrective pattern from 1.6785.
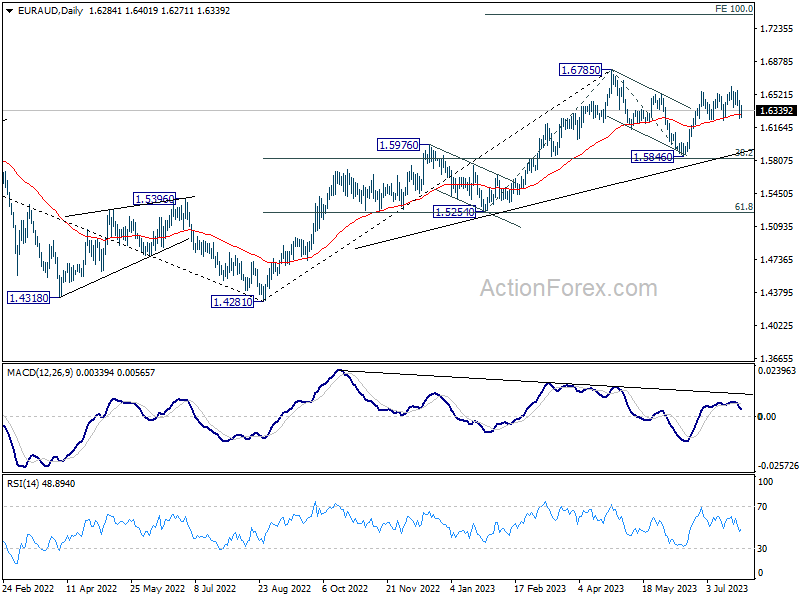
In the bigger picture, with 38.2% retracement of 1.4281 to 1.6785 at 1.5828 intact, rally from 1.4281 is still in progress. Firm break of 1.6785 will confirm rise resumption. Next target is 100% projection of 1.5254 to 1.6785 from 1.5846 at 1.7377. On the other hand, rejection by 1.6785 will extend the corrective pattern with another fall leg. But outlook will stay bullish as long as 1.5828 holds.
GBP/JPY Daily Outlook
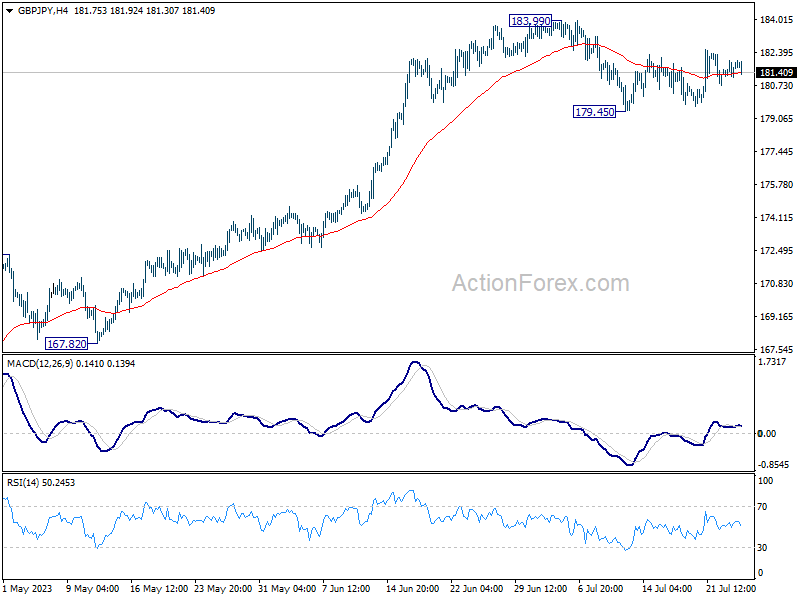
Daily Pivots: (S1) 181.31; (P) 181.66; (R1) 182.16; More...
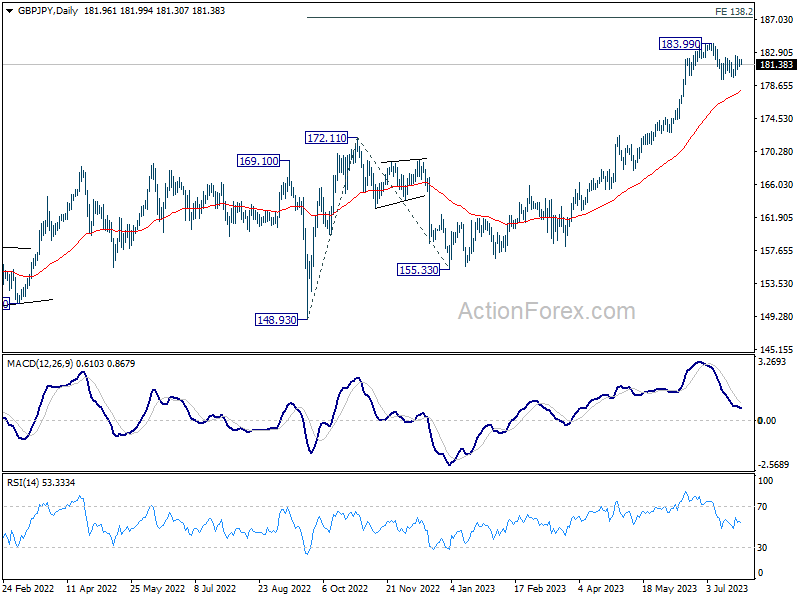
Intraday bias in GBP/JPY remains neutral and outlook is unchanged. On the downside, break of 179.45 will resume the correction from 183.90 to 55 D EMA (now at 177.85) and possibly below. On the upside, firm break of 183.99 high will resume larger up trend to 187.36 projection level.
In the bigger picture, as long as 172.11 resistance turned support holds, up trend from 123.94 (2020 low) is expected to continue. On resumption, next target is 138.2% projection of 148.93 to 172.11 from 155.33 at 187.36, and then 195.86 (2015 high). Nevertheless, firm break of 172.11 will argue that larger correction is already underway.
EUR/JPY Daily Outlook
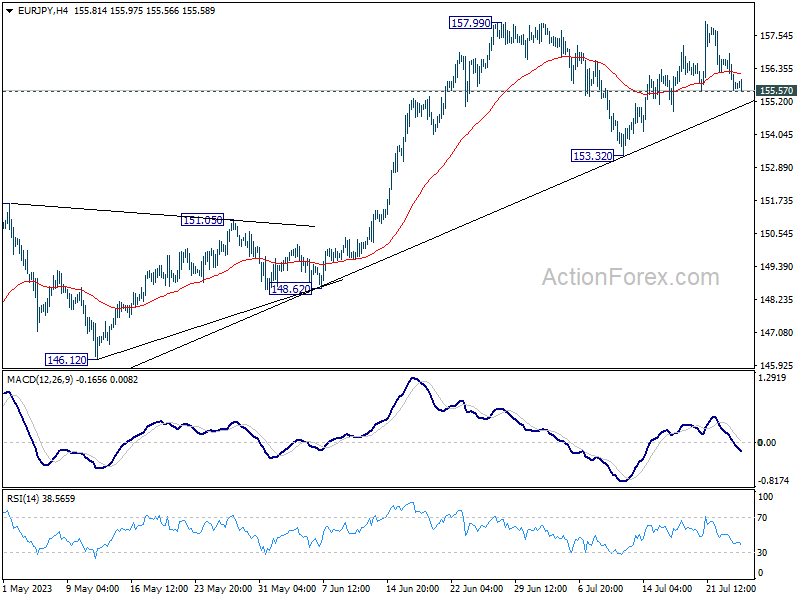
Daily Pivots: (S1) 155.30; (P) 156.10; (R1) 156.57; More....
Intraday bias in EUR/JPY remains neutral at this point. On the upside, sustained break of 157.99 will confirm resumption of larger up trend, and target 162.82 projection level next. Nevertheless, break of 155.57 minor support will bring deeper decline to extend the corrective pattern from 157.99.
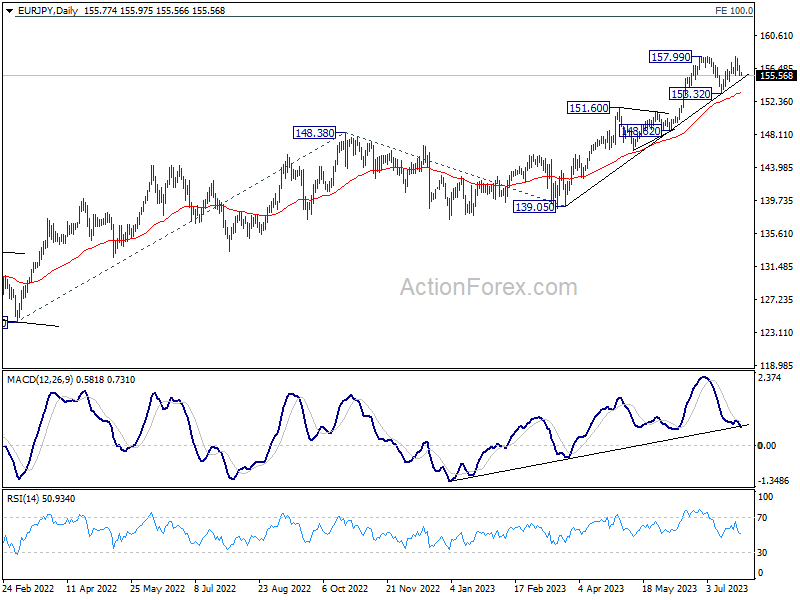
In the bigger picture, as long as 151.60 resistance turned support holds, rise from 114.42 (2020 low) is in progress. On resumption, next target is 100% projection of 124.37 to 148.38 from 138.81 at 162.82. Nevertheless, sustained break of 151.60 will argue that larger correction is already underway.
USD/CAD Daily Outlook
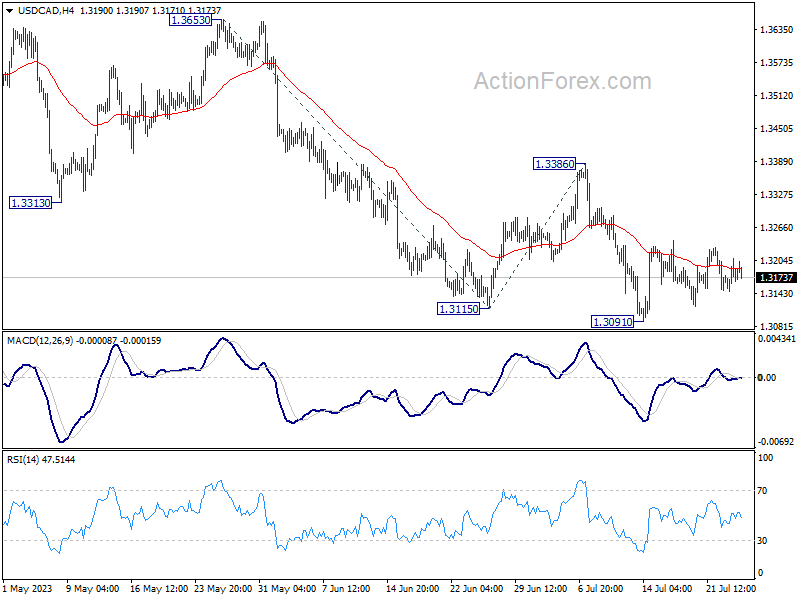
Daily Pivots: (S1) 1.3143; (P) 1.3176; (R1) 1.3206; More....
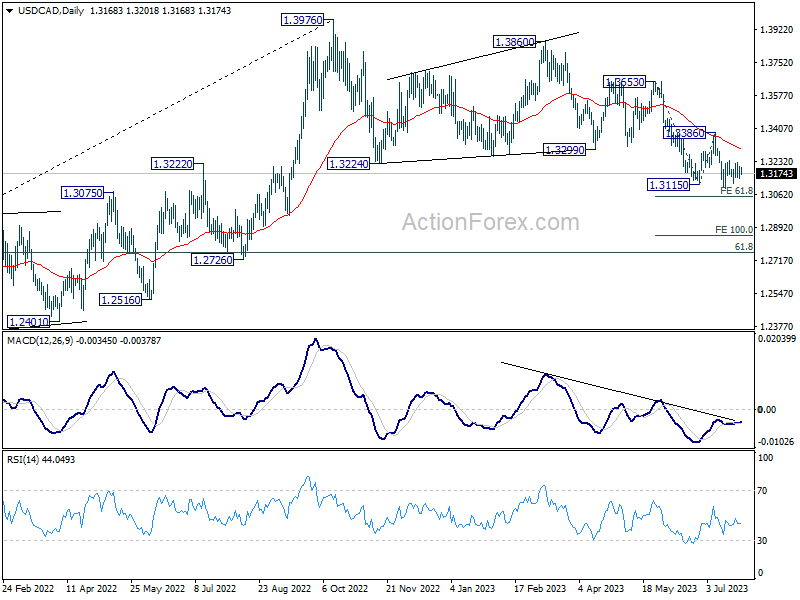
Intraday bias in USD/CAD remains neutral for the moment, and outlook is unchanged. Further decline is expected as long as 1.3386 resistance holds. Break of 1.3091 will resume larger fall and target 61.8% projection of 1.3653 to 1.3115 from 1.3386 at 1.3054. However, firm break of 1.3386 will indicate near term reversal and turn outlook bullish.
In the bigger picture, price actions from 1.3976 are viewed as a correction to up trend from 1.2005 (2021 low) only. But even so, deeper decline is expected as long as 1.3386 resistance holds. Further fall could be seen to 61.8% retracement of 1.2005 to 1.3976 at 1.2758. Meanwhile, break of 1.3386 will be a sign that the correction has completed and bring stronger rally back to retest 1.3976.