

Sample Category Title
Dollar Mixed as FOMC Looms, Aussie Selloff Continues
The financial markets appear to be a little on risk-off mode today, as FOMC rate decision is awaited. Additionally, ECB will announce policy decision tomorrow, followed by BoJ on Friday. Commodity currencies are the worst performers so far, as led by Aussie which was pressured following CPI data earlier today. Yen is currently the strongest, followed by Swiss Franc, and then Euro. Dollar, however, is overall just steady.
Fed will raise interest rate by another 25bps to 5.25-5.50% later today, and there is practically no chance for a deviation from this widely expected decision. The question is whether Chair Jerome Powell would give any guidance on the next move. And the answer is likely a "no", given that two rounds of inflation and employment data are coming in before next FOMC meeting in September. Therefore, unless the Fed shifts from a wait-and-see stance and its commitment to quelling inflation, the event may not significantly roil the markets.
In Europe, at the time of writing, FTSE is down -0.75%. DAX is down -1.20%. CAC is down -2.15%. Germany 10-year yield is up 0.032 at 2.457. Earlier in Asia, Nikkei dropped -0.04%. Hong Kong HSI dropped -0.36%. China Shanghai SSE dropped -0.26%. Singapore Strait Times rose 0.57%. Japan 10-year JGB yield dropped -0.0191 to 0.448.
AUD/JPY gaining downside momentum towards 93.22 support and below
While Dollar is treading water ahead of FOMC rate decision, AUD/JPY is stealing the show as the top mover as markets enter into US session. Aussie's selloff is gaining some momentum as markets continue to digest lower than expected CPI reading from Australia released earlier today. There are increasing calls for RBA to stand pat again on August 1, i.e. next Tuesday.
On the Japanese front, despite the prevailing anticipation that BoJ will maintain its monetary policy and yield curve control unchanged on Friday, traders might be rethinking their positions. This follows the advice of IMF's Chief Economist encouraging BoJ to start planning for rate hikes and gradually distance itself from YCC. BoJ's track record of catching the market off guard—acting when least expected and remaining idle when action is anticipated—complicates any definite predictions.
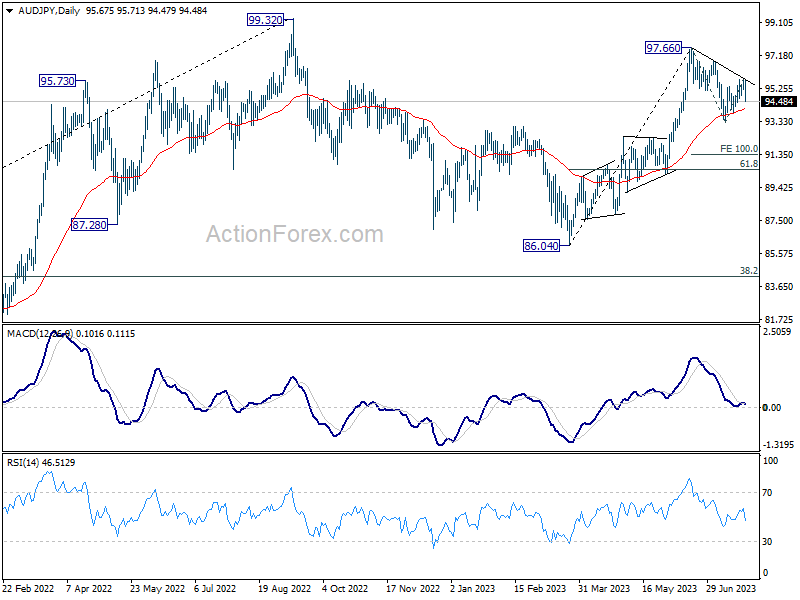
Anyway, the break of 94.63 minor support indicates that AUD/JPY's corrective recovery from 93.22 has completed at 95.84 already, after hitting near term falling trend line resistance. Deeper fall is expected to retest 93.22 support first. Firm break there will resume the whole decline from 97.66.
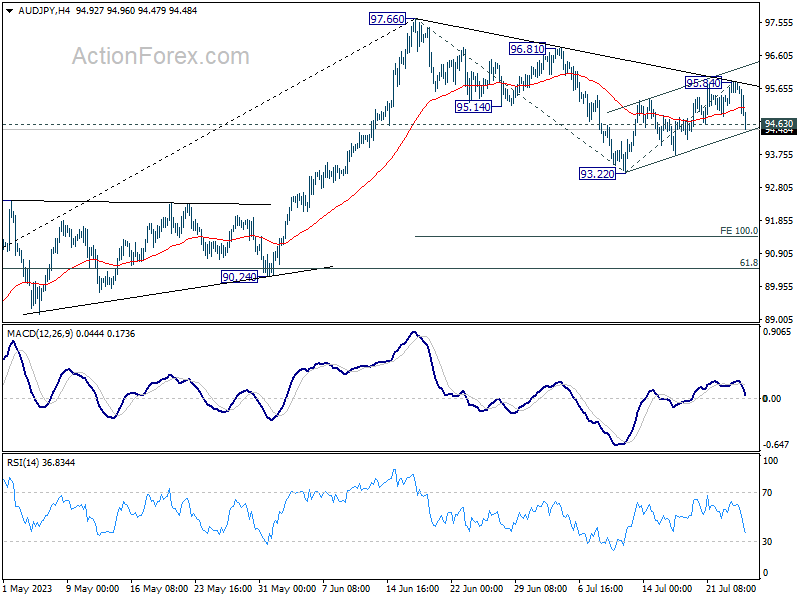
Fall from 97.66 could be interpreted as a correction to rise from 86.04, or the third leg of the medium term pattern from 99.32. In either case, the next near term target after decisively breaking 93.22 will be 100% projection of 97.66 to 93.22 from 95.84 at 91.40.
Australian Q2 CPI records slowest quarterly rate since Q3 2021, annual inflation eases again
In Q2, Australia's CPI decelerated from 1.4% qoq to 0.8% qoq, coming in below the expected 1.0% qoq. This marked the lowest quarterly rate since Q3 2021. Year-on-year, CPI eased from 7.0% to 6.0%, falling short of anticipated 6.2% yoy. Annual inflation rate has been on a downtrend for two consecutive quarters since peaking at 7.8% in Q4 2022.
RBA's trimmed mean CPI registered at 0.9% qoq and 5.9% yoy, which were below forecast of 1.1% qoq and 6.0% yoy respectively. While CPI for goods slowed from 7.6% yoy to 5.8% yoy, CPI for services rose from 6.1% yoy to 6.3% yoy, hitting its highest level since 2001.
Michelle Marquardt, ABS head of prices statistics, noted the shift in inflationary drivers, stating, "This is the first time since September 2021 that services inflation has been higher than goods, highlighting the change from 12 months ago when goods like new dwellings and automotive fuel were driving inflation. Now price increases for a range of services like rents, restaurant meals, child-care and insurance are keeping inflation high."
In June, monthly CPI slipped from 5.5% yoy to 5.4% yoy, in line with expectations. CPI excluding volatile items and holiday travel eased from 6.4% yoy to 6.1% yoy, and trimmed mean CPI fell from 6.1% yoy to 6.0% yoy.
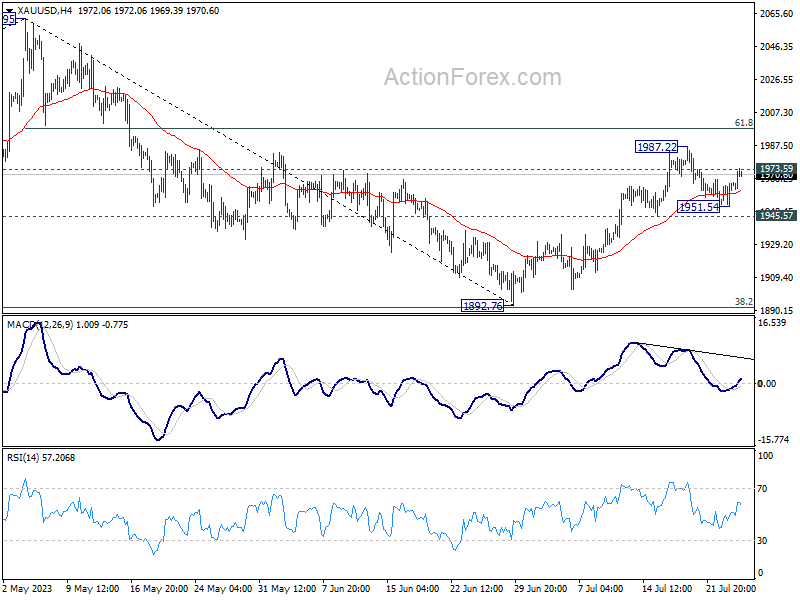
Gold rebounding, eyeing more upside
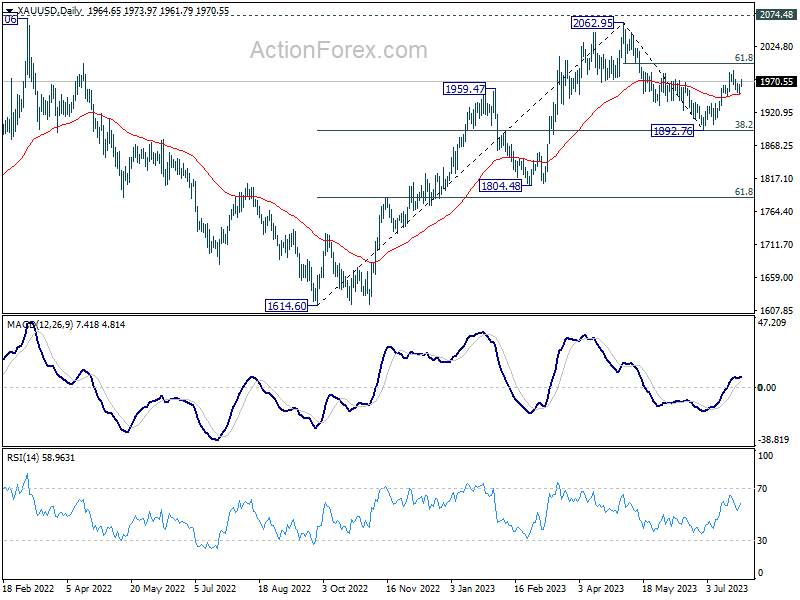
Gold rebounds notably today and immediate focus is now on 1973.59 minor resistance. Firm break there should confirm that pull back from 1987.22 has completed at 1951.54. Further rise should then be seen through 1987.22 to resume whole rally from 1892.76.
More importantly, the support from 55 D EMA (now at 1950.61) is a sign of near term bullishness. The bounce from this EMA could be strong enough to push Gold through the next obstacle at 61.8% retracement of 2062.95 to 1892.76 at 1997.93, which is just inch below 2000 psychological level.
GBP/USD Mid-Day Outlook
Daily Pivots: (S1) 1.2840; (P) 1.2872; (R1) 1.2935; More...
GBP/USD's recovery from 1.2796 continues today but stays below 1.2963 minor resistance. Intraday bias remains neutral at this point. On the downside, below 1.2796 will resume the fall from 1.3141 to 55 D EMA (now at 1.2703) and possibly below. On the upside, break of 1.2963 minor resistance will turn bias back to the upside retest 1.3141 high instead.
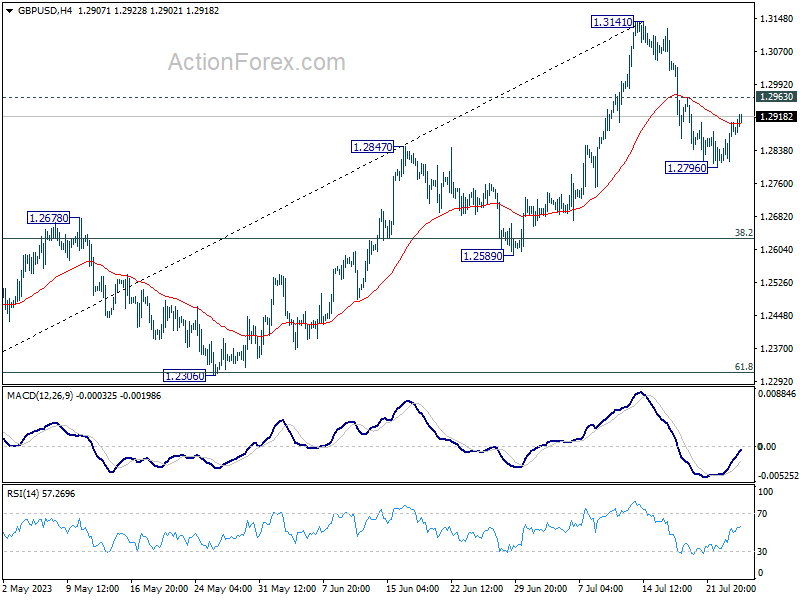
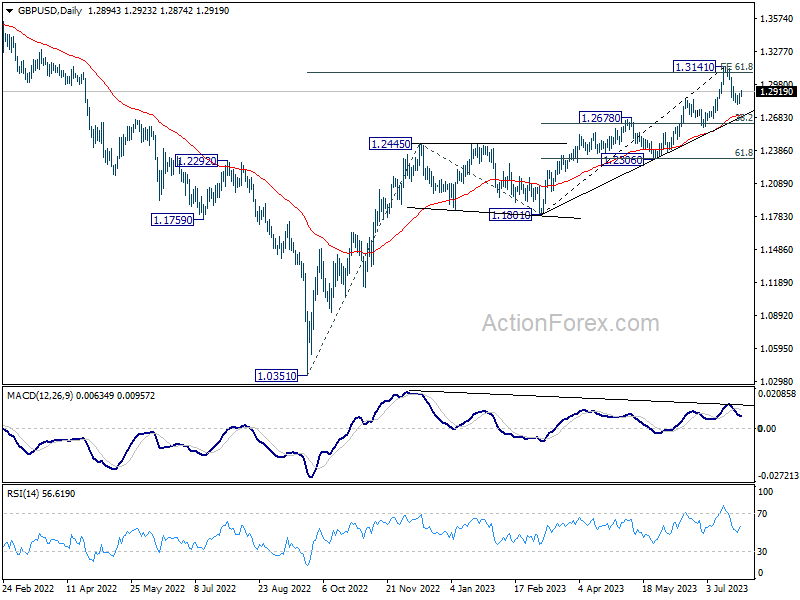
In the bigger picture, as long as 1.2678 resistance turned support holds, rise from 1.0351 (2022 low) is expected to continue. Next target is 100% projection of 1.0351 to 1.2445 from 1.1801 at 1.3895. However, sustained break of 1.2678 will argue that it's at least correcting this rally, with risk of bearish reversal.
Economic Indicators Update
| GMT | Ccy | Events | Actual | Forecast | Previous | Revised |
|---|---|---|---|---|---|---|
| 23:50 | JPY | Corporate Service Price Index Y/Y Jun | 1.20% | 1.50% | 1.60% | 1.70% |
| 01:30 | AUD | Monthly CPI Y/Y Jun | 5.40% | 5.40% | 5.60% | 5.50% |
| 01:30 | AUD | CPI Q/Q Q2 | 0.80% | 1.00% | 1.40% | |
| 01:30 | AUD | CPI Y/Y Q2 | 6.00% | 6.20% | 7.00% | |
| 01:30 | AUD | RBA Trimmed Mean CPI Q/Q Q2 | 0.90% | 1.10% | 1.20% | |
| 01:30 | AUD | RBA Trimmed Mean CPI Y/Y Q2 | 5.90% | 6.00% | 6.60% | |
| 08:00 | CHF | Credit Suisse Economic Expectations Jul | -32.6 | -30.8 | ||
| 08:00 | EUR | Eurozone M3 Money Supply Y/Y Jun | 0.60% | 1.00% | 1.40% | |
| 14:00 | USD | New Home Sales Jun | 720K | 763K | ||
| 14:30 | USD | Crude Oil Inventories | -2.2M | -0.7M | ||
| 17:30 | CAD | BOC Summary of Deliberations | 6.70% | 7.10% | ||
| 18:00 | USD | Fed Interest Rate Decision | 5.50% | 5.25% | ||
| 18:30 | USD | FOMC Press Conference |
Gold rebounding, eyeing more upside
Gold rebounds notably today and immediate focus is now on 1973.59 minor resistance. Firm break there should confirm that pull back from 1987.22 has completed at 1951.54. Further rise should then be seen through 1987.22 to resume whole rally from 1892.76.
More importantly, the support from 55 D EMA (now at 1950.61) is a sign of near term bullishness. The bounce from this EMA could be strong enough to push Gold through the next obstacle at 61.8% retracement of 2062.95 to 1892.76 at 1997.93, which is just inch below 2000 psychological level.
AUD/JPY gaining downside momentum towards 93.22 support and below
While Dollar is treading water ahead of FOMC rate decision, AUD/JPY is stealing the show as the top mover as markets enter into US session. Aussie's selloff is gaining some momentum as markets continue to digest lower than expected CPI reading from Australia released earlier today. There are increasing calls for RBA to stand pat again on August 1, i.e. next Tuesday.
On the Japanese front, despite the prevailing anticipation that BoJ will maintain its monetary policy and yield curve control unchanged on Friday, traders might be rethinking their positions. This follows the advice of IMF's Chief Economist encouraging BoJ to start planning for rate hikes and gradually distance itself from YCC. BoJ's track record of catching the market off guard—acting when least expected and remaining idle when action is anticipated—complicates any definite predictions.
Anyway, the break of 94.63 minor support indicates that AUD/JPY's corrective recovery from 93.22 has completed at 95.84 already, after hitting near term falling trend line resistance. Deeper fall is expected to retest 93.22 support first. Firm break there will resume the whole decline from 97.66.
Fall from 97.66 could be interpreted as a correction to rise from 86.04, or the third leg of the medium term pattern from 99.32. In either case, the next near term target after decisively breaking 93.22 will be 100% projection of 97.66 to 93.22 from 95.84 at 91.40.
Gold Spikes Higher After Mild consolidation
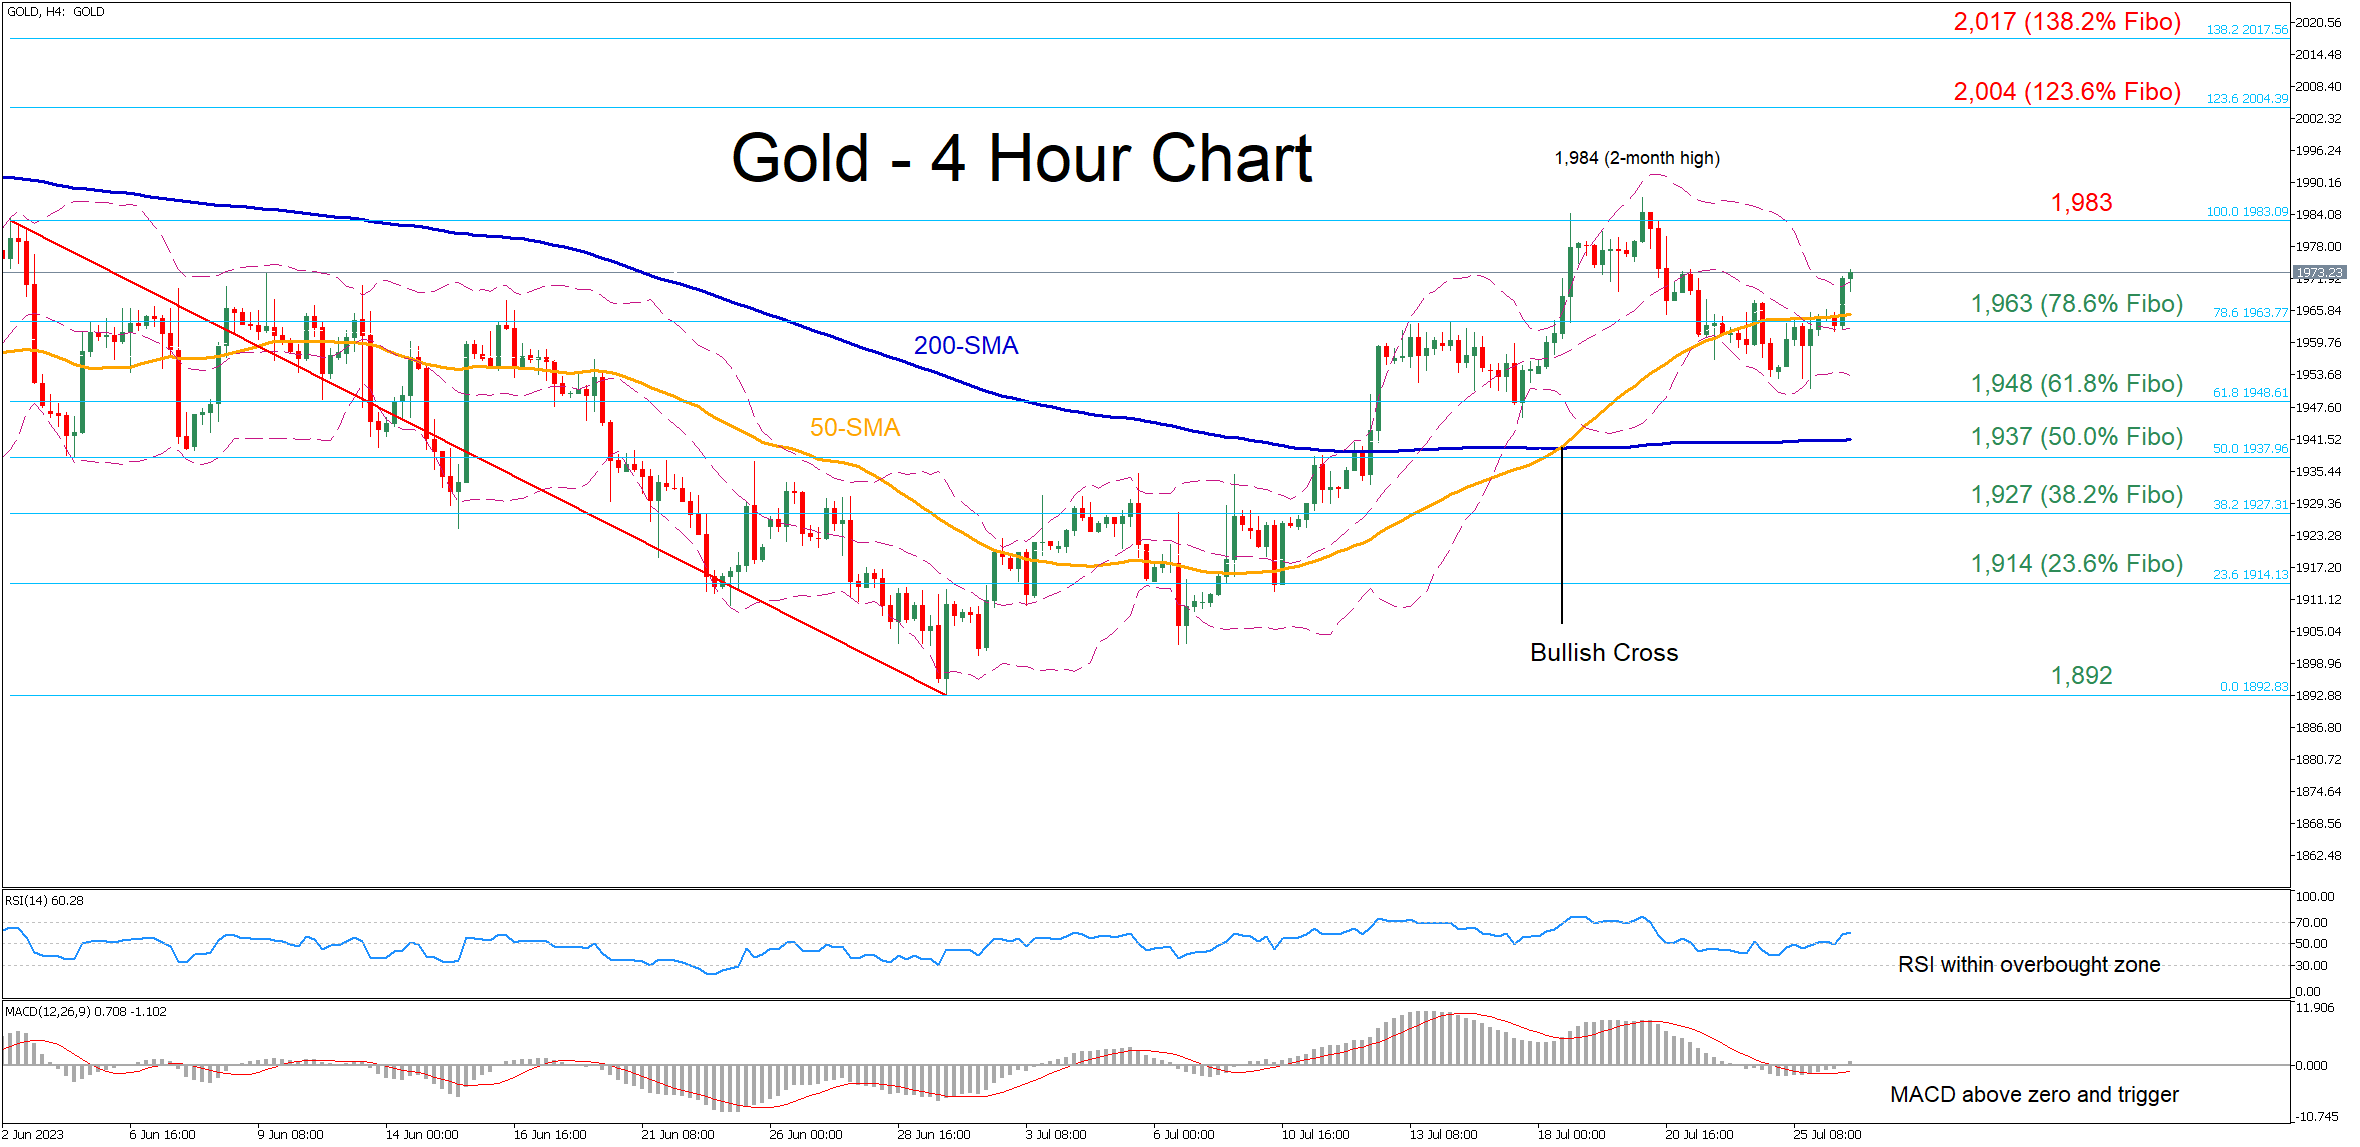
Gold has posted solid gains in July after bouncing off the four-month low of 1,892 in late June. Although bullion experienced a pullback following a fresh two-month peak of 1,984 on July 20, it stormed back higher in the last couple of four-hour sessions, claiming the 50-period simple moving average (SMA).
The momentum indicators are endorsing a bullish near-term bias. Specifically, the RSI is hovering above its 50-neutral mark, while the MACD turned positive after being below zero for two days. Considering that the price is trading above its upper Bollinger Band, traders should remain cautious.
If bullish pressures persist, the recent two-month high of 1,984 could prove to be the first barricade for the price to overcome. Piercing through that wall, gold could face 2,004, which is the 123.6% Fibonacci extension of the 1,983-1,892 downtrend registered in June. Should that hurdle fail, the 138.2% Fibo of 2,017 may curb further upside attempts.
On the flipside, bearish actions could send the price to initially test the 78.6% Fibo of 1,963, which coincides with the 50-period SMA. Even lower, the attention could shift to the 61.8% Fibo of 1,948 before the 50.0% Fibo of 1,937 appears on the radar. If that floor collapses, the 38.2% Fibo of 1,927 could provide downside protection.
In brief, gold posted a bullish breakout after trading sideways around its 50-period SMA for the past five days. Hence, the technical picture could remain bullish for as long as the price holds above that crucial threshold.
Japanese Yen Extends Gains, Fed Rate Decision Looms
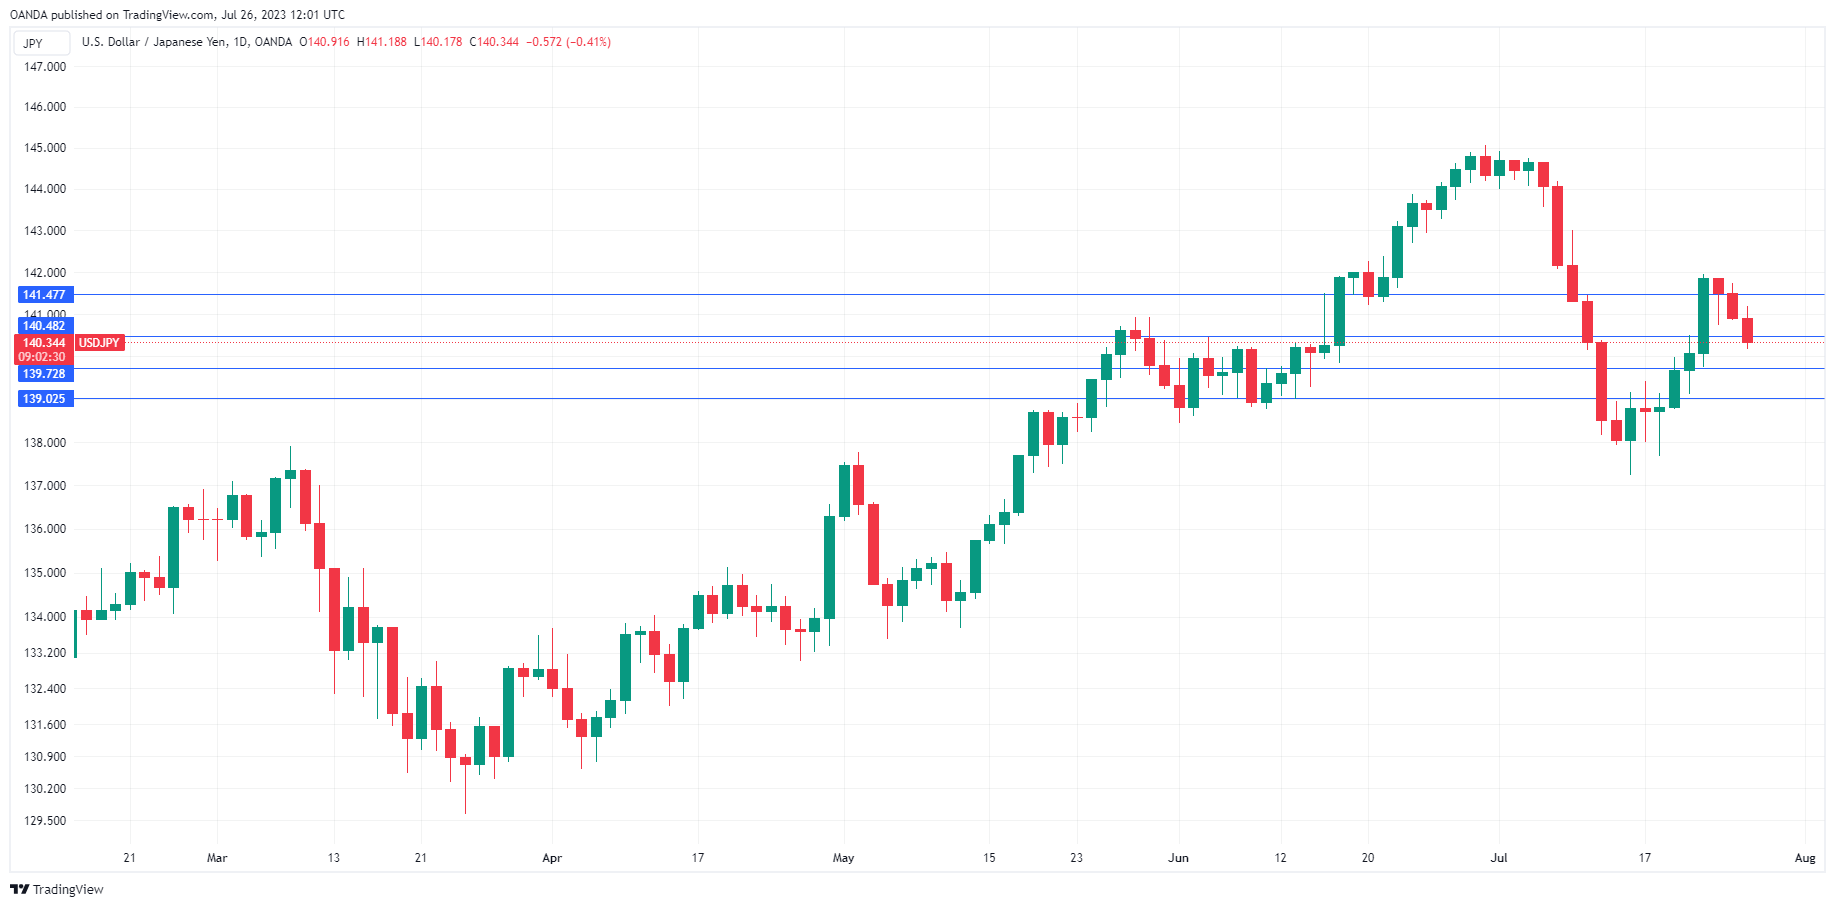
The Japanese yen is showing some strength this week and has gained 1.1%, rebounding from the previous week’s plunge of 2.2%. In Wednesday’s European session, USD/JPY is trading at 140.23, down 0.49%.
Spotlight on Fed, BoJ meetings
The US and Japanese central banks will be on center stage this week, with the Fed meeting later on Wednesday and the Bank of Japan on Friday.
The Fed is widely expected to raise rates today by 0.25%, which would bring the Fed Funds rate to a range of 5.25% to 5.50%. The FOMC will not release any economic forecasts, which means investors will be glued to Fed Chair Powell’s press conference, looking for clues about what the Fed plans to do with rates in the coming months.
The markets are confident that today’s rate hike will wrap up the current tightening cycle, but the Fed has not sounded as optimistic. Powell and other Fed members have warned that inflation is still too high and the battle is not over. True, inflation is under control at 3%, but there is still some distance to go before the Fed’s 2% inflation target is reached. Powell may take a middle-of-the-road approach in his remarks, hinting that the Fed will take a pause after today but keeping the door open to further hikes if needed.
Bank of Japan meetings used to be rather dull affairs with little or no impact on the currency markets. That has all changed in the world of high inflation, and even Japan is grappling with inflation which has persistently remained above the 2% target. This has put pressure on the BoJ to tweak its ultra-loose policy, as it did late last year when it widened the target band on 10-year Japanese bonds.
The BoJ has insisted that it won’t change policy settings at Friday’s meeting, but there is still speculation that the central bank could make a move and send the yen sharply higher. With inflation running around 3%, BoJ meetings have become market-moving events and investors will be keeping a close eye on Friday’s meeting.
USD/JPY Technical
- USD/JPY is testing support at 140.49. Below, there is support at 139.73
- There is resistance at 141.47 and 142.62
Aussie Slips as Inflation Falls, Fed Expected to Hike
- Australian inflation falls more than expected
- Fed widely expected to raise rates by 0.25% on Wednesday
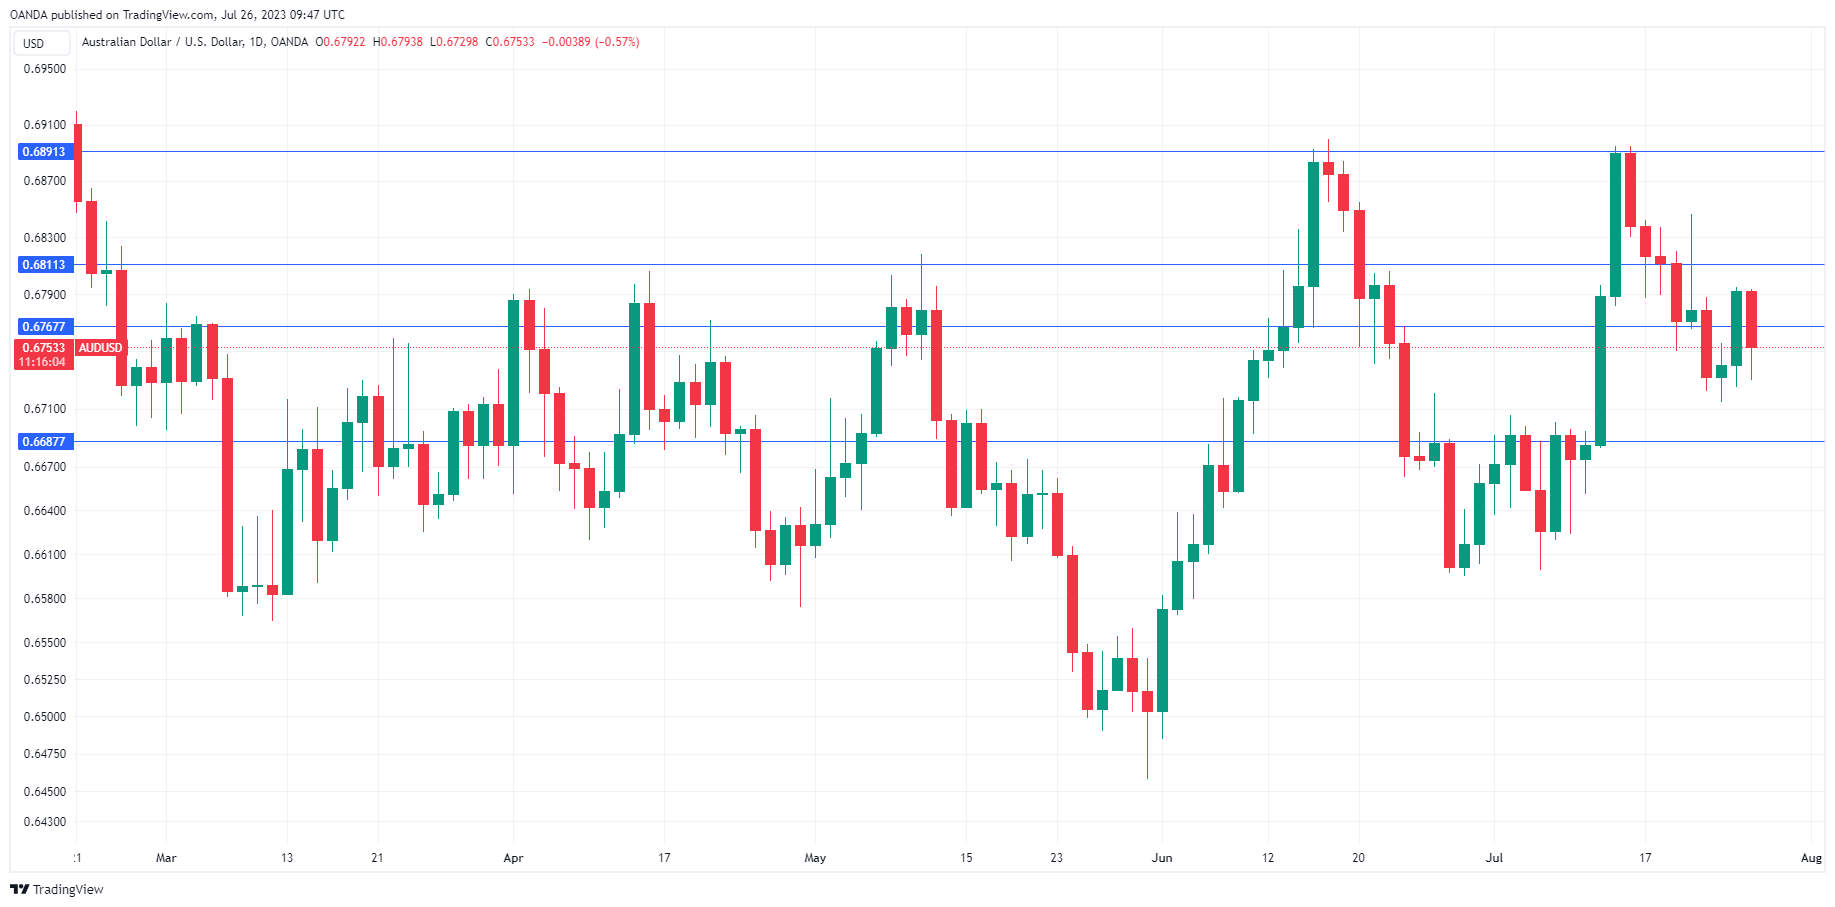
The Australian dollar is in negative territory on Wednesday. In the European session, AUD/USD is trading at 0.6758, down 0.49%. The Aussie fell as much as 0.90% earlier in the day but has recovered some of these losses.
Australian inflation declines more than expected
Australian inflation declined more than expected in the second quarter, sending the Australian dollar lower as pressure has eased on the Reserve Bank of Australia to raise interest rates.
Headline inflation rose 6% y/y in the second quarter, down from 7% in the first quarter and below the consensus estimate of 6.2%. June monthly inflation dipped to 5.4% y/y as expected, below the May reading of 5.5%. The RBA Trimmed Mean CPI, a key gauge of core inflation, fell to 5.9% y/y in Q2, down from 6.6% in Q1 and just below the consensus of 6.0%.
The positive inflation data was spoiled somewhat by services inflation, which accelerated to 6.3% in the second quarter, its highest level since 2001. A key factor driving up services inflation was higher rents, according to the Australian Bureau of Statistics.
The RBA meets on August 1st and investors have lowered the odds of a rate hike following the positive inflation report. The probability of a rate hike has fallen to 31%, down from 41% prior to the inflation report, according to the ASX RBA rate hike tracker. The RBA will release updated economic forecasts at the meeting, and investors will be especially interested in the inflation projections.
What happens after August? An extended pause is the RBA’s preferred move, but that will likely require inflation to continue heading lower toward the 2% target. Otherwise, the RBA will still have work to do on the inflation front and would likely have to continue tightening rates.
Markets await Fed hike
The Federal Reserve is widely expected to raise rates at Wednesday’s meeting, and investors have priced a hike at close to 100%. This would bring the benchmark rate to a range of 5.25% – 5.50%. Investors expect a pause in September but the Fed has signalled another rate hike after Wednesday’s meeting. The Fed’s rate policy will depend to a large extent on inflation levels and the strength of the labour market.
AUD/USD Technical
- AUD/USD is testing support at 0.6767. Below, there is support at 0.6687
- There is resistance at 0.6811 and 0.6891
Fed’s Signals Will Guide Markets Through September
The Fed is widely expected to raise its benchmark interest rates by 25-basis points today; anything else would be a shocker.
The critical question that’s at the forefront of the market’s collective mind is whether this week’s Fed rate hike will indeed be the last of the cycle.
If Chair Powell leans into expectations that the FOMC is ready to pause, or at least skip a September hike, that may encourage further risk-taking across global financial markets.
However, should the Fed acquiesce to its June dot plot and swing the door wide open for yet another rate increase, such repricing should prompt an immediate but possibly limited recovery for the US dollar, while weighing on the likes of gold, stocks, and oil.
Chair Powell’s policy cues later today will also frame how markets interpret top tier US economic data, especially around jobs and inflation, in the leadup to the next FOMC meeting in September.
Dollar Index: Five-Day Rally Loses Traction Ahead of Fed Decision
The dollar index is standing at the back foot on Wednesday, after hitting a two-week high, as traders decided to collect some profits and awaiting fresh signals from the Fed’s decision.
The US Federal Reserve FOMC two-day policy meeting ends today with widely expected decision for 25 basis points hike which will push the interest rate to 5.25%/5.50% range, the highest since 2007/2009 recession.
Today’s decision will mark the eleventh hike in past twelve meetings and likely to signal that the central bank is nearing an end of its hiking cycle, with wide expectations for one more 25 basis points hike until the end of the year.
Faster than expected easing inflation (although is still 2 ½ times above Fed’s 2% target), accelerating economic activity which shows that the US economy is more resilient to rising interest rates than expected and tight labor market (ongoing employment growth and jobless rate at the lowest levels) contribute to scenario of hiking cycle end in the near future.
The central bank shifted its approach to monetary policy from rapid rate hikes to decisions based on meeting-by meeting evaluation of the economic data.
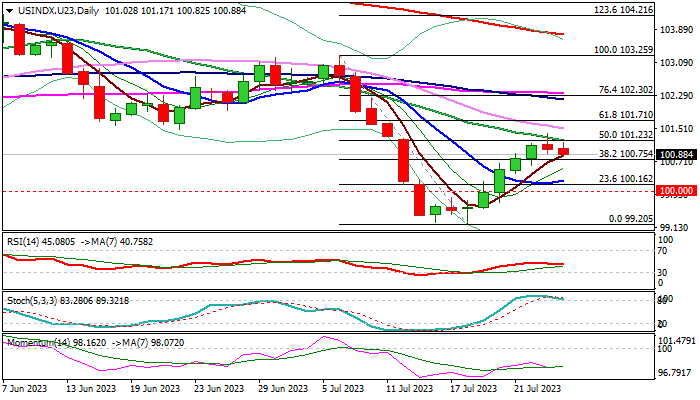
Technical studies on the daily chart show increasing downside risk after the dollar closed in red on Tuesday for the first time in six days and generating an initial signal that five-day recovery rally might be at the end.
Formation of a bull-trap above 101.23 (daily Kijun-sen / 50% retracement of 103.25/99.20 bear-leg) contributes to negative signals from overbought stochastic and 14-d momentum in negative territory, keeping in play the risk of pullback.
Larger picture remains bearish and show broader downtrend from 2022 peak (114.72) intact, with the latest bounce seen as a healthy correction on daily chart and a mild price adjustment on weekly, suggesting that larger bears hold grip.
The dollar is likely to weaken further if Fed keeps its dovish stance, while any more aggressive than expected rhetoric from chief Powell, would offer fresh support to the greenback.
Res: 101.23; 101.37; 101.51; 101.71.
Sup: 100.75; 100.25; 100.00; 99.20.
USDJPY Faces New Struggle as FOMC Decision Looms
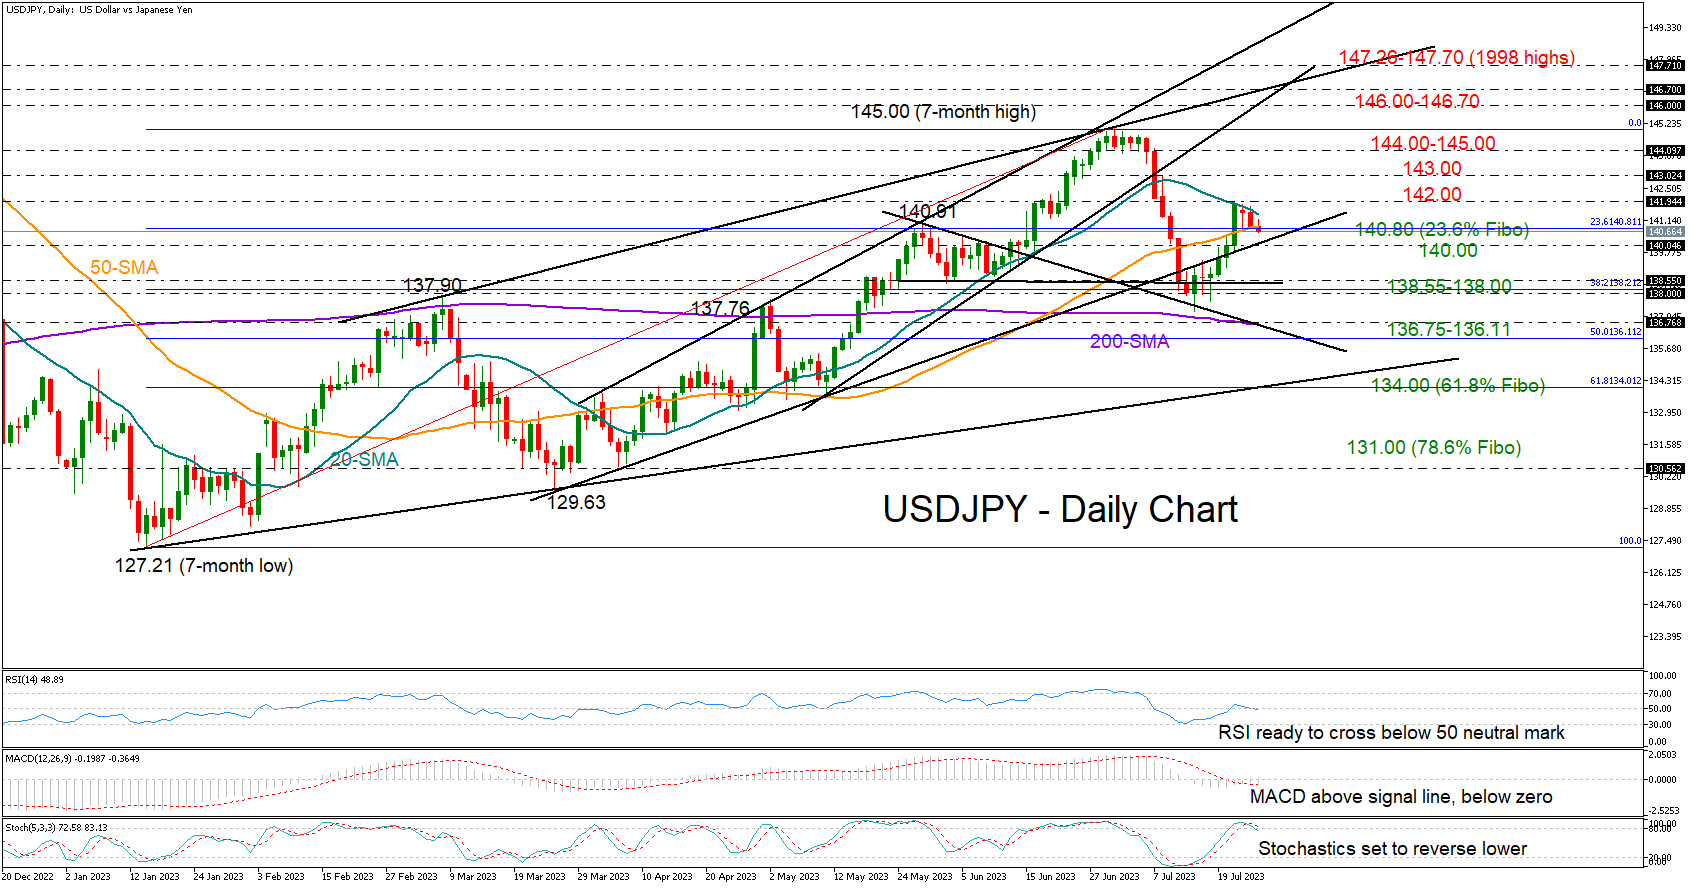
USDJPY bulls took a breather after a constructive week, which saw the pair bouncing from a low of 137.23 to a high of 141.94.
The pair recouped half of July’s freefall, but the 20-day simple moving average (SMA) has been a struggle so far this week, pushing the price softly to the downside. Encouragingly, the 50-day SMA managed to limit losses around 140.80 along with the 23.6% Fibonacci retracement of the 127.21-145.00 uptrend but buying interest seems to be negligible at the moment.
The RSI is ready to re-enter the bearish area below 50 and the Stochastic oscillator is set to reverse lower after its peak in the overbought zone. Meanwhile, the MACD remains muted below zero despite climbing above its red signal line, all showing indecisiveness among traders ahead of today’s FOMC policy announcement.
If the price builds a base around the 50-day SMA or slightly lower at 140.15, where we can find the ascending line from March, it could re-examine the 20-day SMA at 141.34. A close above the latter may not excite traders unless the price crawls above the 142.00 mark too. A victory there could see a pause around 143.00 and then an advance towards the key 144.00-145.00 resistance zone. Breaching this wall, the bulls could post a new higher high within the 146.00-146.70 trendline area, while a more aggressive increase could reach the 1998 ceiling of 147.26-147.70.
In the bearish scenario, where the pair retreats below the 140.00 psychological mark, the spotlight will turn to the 138.55-138.00 support area. If that floor cracks, the decline could expand towards the 200-day SMA and the 50% Fibonacci of 136.11. Another failure at this point might prone a significant sell-off towards the 61.8% Fibonacci level of 134.00 and the tentative support trendline from January.
To sum up, USDJPY seems to have little backing to renew bullish pressure. A negative extension below 140.00 is expected to activate strong selling. Otherwise, the pair will need to claim the 142.00 barricade to continue higher.
EUR/USD Takes Hit While USD/JPY Turns Green
EUR/USD started a fresh decline below 1.1145. USD/JPY climbed higher above 141.00, but it might now correct gains in the near term.
Important Takeaways for EUR/USD and USD/JPY Analysis Today
- The Euro declined below the 1.1145 and 1.1095 support levels.
- There is a major bearish trend line forming with resistance near 1.1095 on the hourly chart of EUR/USD at FXOpen.
- USD/JPY climbed higher above the 140.00 and 141.35 levels.
- There is a key bearish trend line forming with resistance near 141.35 on the hourly chart at FXOpen.
EUR/USD Technical Analysis
On the hourly chart of EUR/USD at FXOpen, the pair started a fresh decline from the 1.1230 zone. The Euro declined below the 1.1140 support zone against the US Dollar.
The pair even settled below the 1.1095 zone and the 50-hour simple moving average. A low is formed near 1.1020, and the pair is now consolidating losses near the 23.6% Fib retracement level of the recent decline from the 1.1146 swing high to the 1.1020 low.
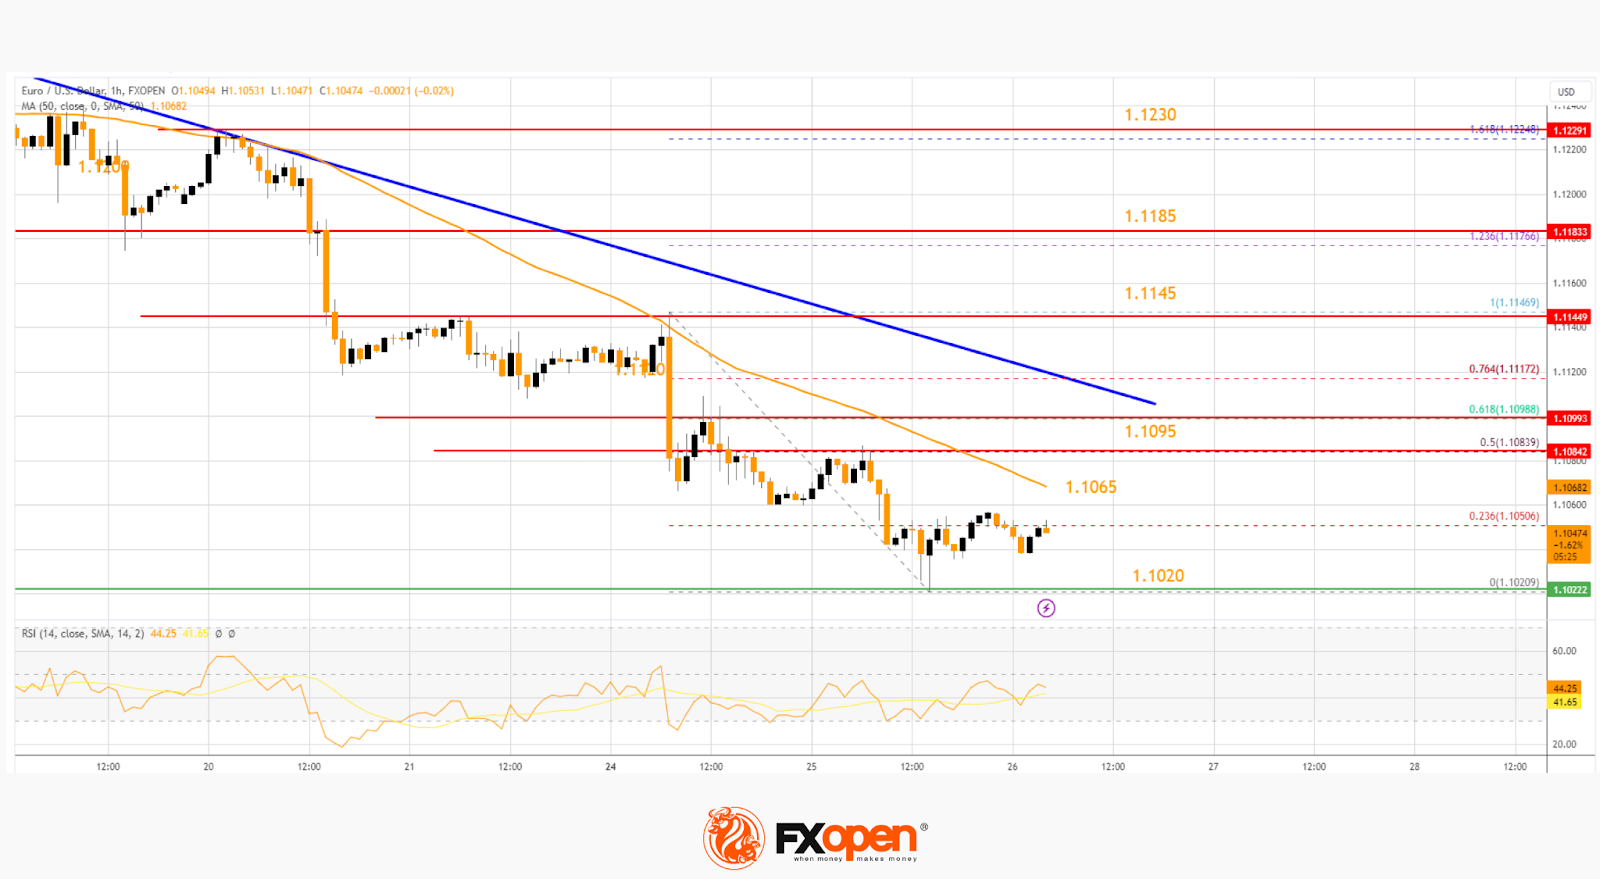
On the upside, the pair is now facing resistance near the 50-hour simple moving average at 1.1065. The next major resistance is near a bearish trend line at 1.1095.
The 50% Fib retracement level of the recent decline from the 1.1146 swing high to the 1.1020 low is also near 1.1095. An upside break above 1.1095 could set the pace for another increase. In the stated case, the pair might rise toward 1.1140.
If not, the pair might resume its decline. The first major support is near 1.1020. The next key support is near 1.1000. If there is a downside break below 1.1000, the pair could drop toward 1.0965. The main support on the EUR/USD chart is near 1.0920, below which the pair could start a major decline.
USD/JPY Technical Analysis
On the hourly chart of USD/JPY at FXOpen, the pair started a strong increase above the 140.00 resistance zone. The US Dollar gained bullish momentum above 141.00 against the Japanese Yen.
The pair tested the 142.00 zone, and a high was formed near 141.94. It is now correcting gains below the 50-hour simple moving average. USD/JPY is testing the 23.6% Fib retracement level of the upward move from the 137.68 swing low to the 141.94 high.
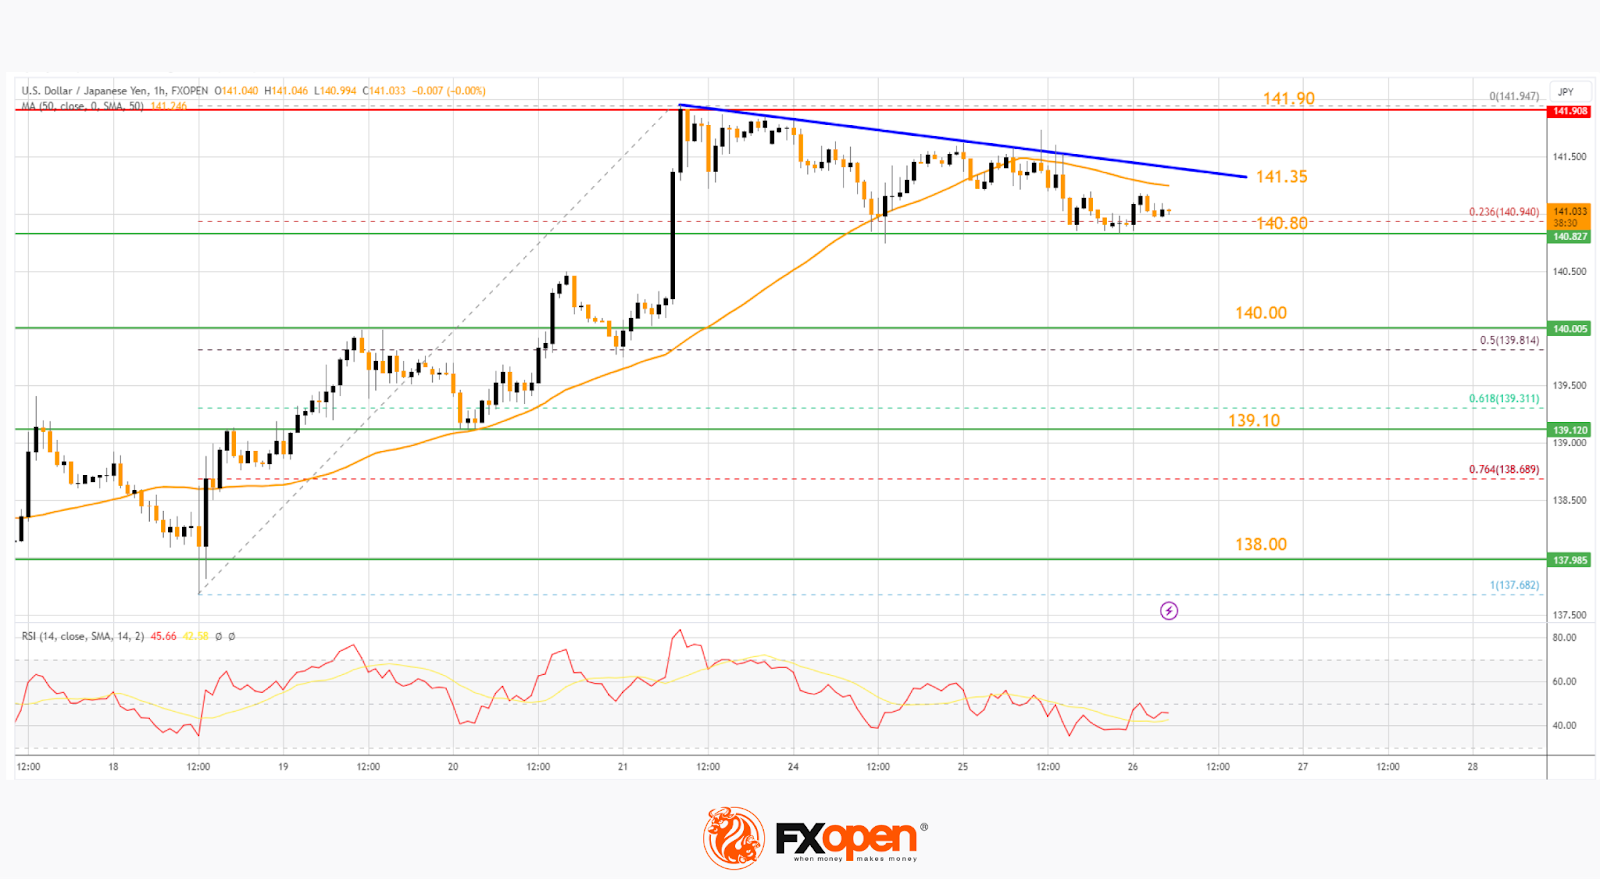
On the downside, the first major support is near 140.80. The next major support is near the 140.00 level or the 50% Fib retracement level of the upward move from the 137.68 swing low to the 141.94 high. If there is a close below 140.00, the pair could decline steadily.
In the stated case, the pair might drop toward 139.10. The next stop for the bears may perhaps be near the 138.00 pivot region.
Immediate resistance on the USD/JPY chart is near a bearish trend line at 141.35 and the 50-hour simple moving average. The first major resistance is near 142.00.
If there is a close above the 142.00 level and RSI moves above 60, the pair could rise toward 142.80. The next major resistance is near 143.50, above which the pair could test 144.00 in the coming days.
Trade global forex with the Innovative Broker of 2022*. Choose from 50+ forex markets 24/5. Open your FXOpen account now or learn more about trading forex with FXOpen.
* FXOpen International, Innovative Broker of 2022, according to the IAFT
This article represents the opinion of the Companies operating under the FXOpen brand only. It is not to be construed as an offer, solicitation, or recommendation with respect to products and services provided by the Companies operating under the FXOpen brand, nor is it to be considered financial advice.