

Sample Category Title
USD/JPY Daily Outlook
Daily Pivots: (S1) 139.73; (P) 140.46; (R1) 140.98; More...
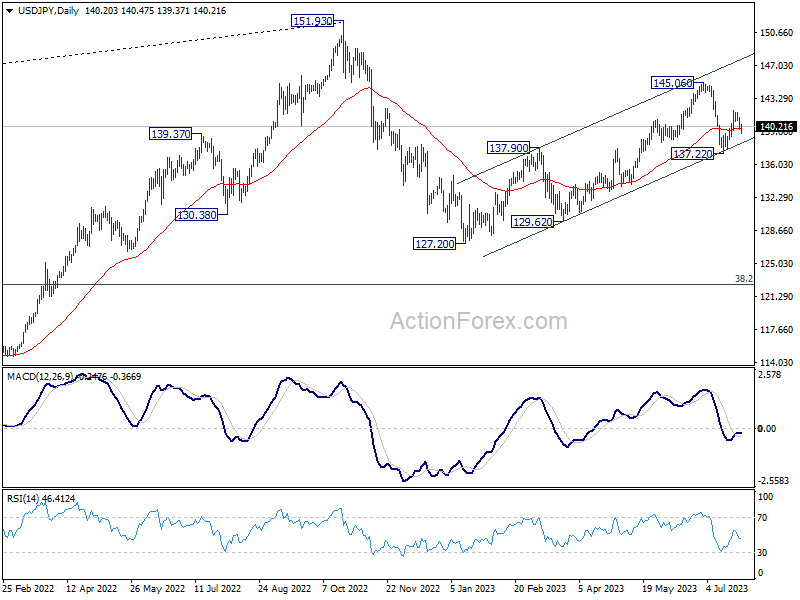
Breach of 139.74 minor support argues that recovery from 137.22 has completed at 141.93. Intraday bias in USD/JPY is back on the downside for retesting 137.22 support. Firm break there will resume whole decline from 145.06. On the upside, however, break of 141.93 will resume the rebound from 137.22 instead.
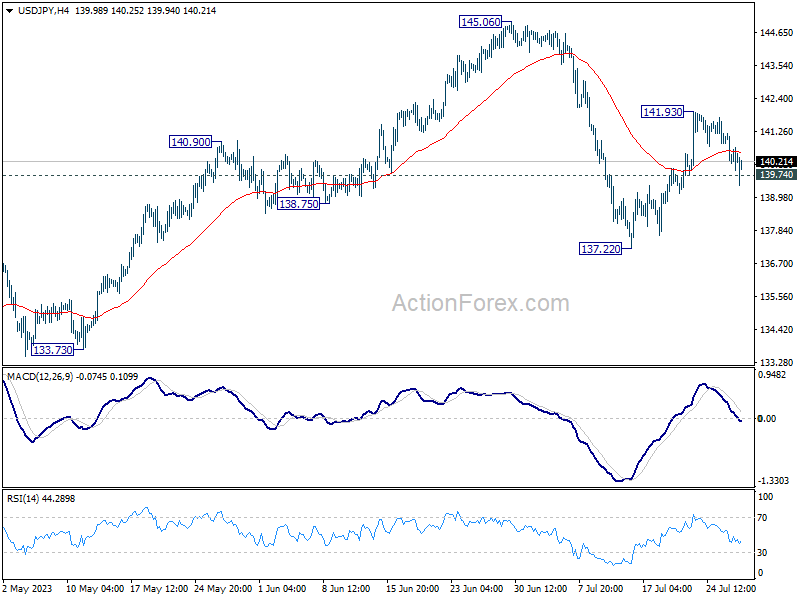
In the bigger picture, overall price actions from 151.93 (2022 high) are views as a corrective pattern. Current development suggests that the second leg (the rise from 127.20) might not be over yet. But even in case of extended rise, strong resistance should be seen from 151.93 to limit upside. Meanwhile, break of 137.22 support should confirm the start of the third leg to 127.20 (2023 low) and below.
EUR/USD Daily Outlook
Daily Pivots: (S1) 1.1047; (P) 1.1077; (R1) 1.1115; More...
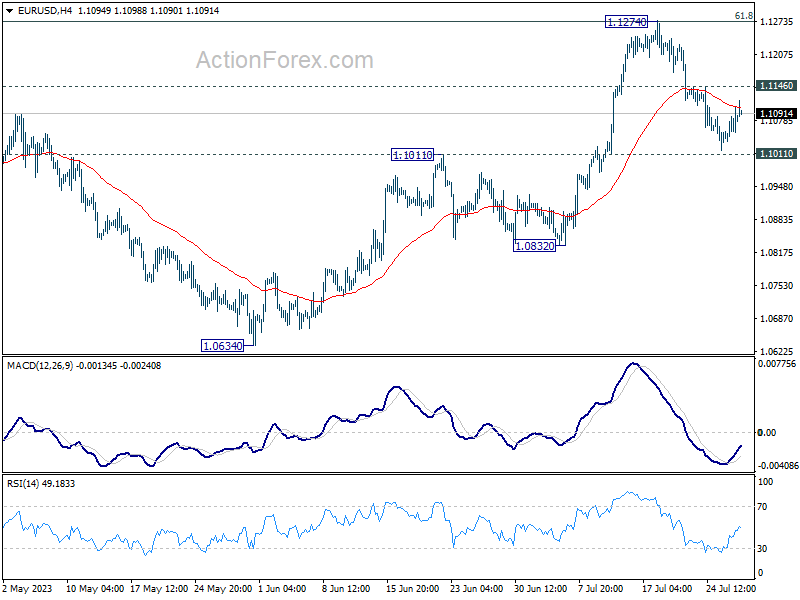
Intraday bias in EUR/USD remains neutral and outlook is unchanged. Further rally will remain in favor as long as 1.1011 resistance turned support holds. Above 1.1146 minor resistance will turn bias back to the upside for retesting 1.1274 high first. However, firm break of 1.1011 will argue that larger correction is underway. Deeper fall would then be seen to 1.0832 support next.
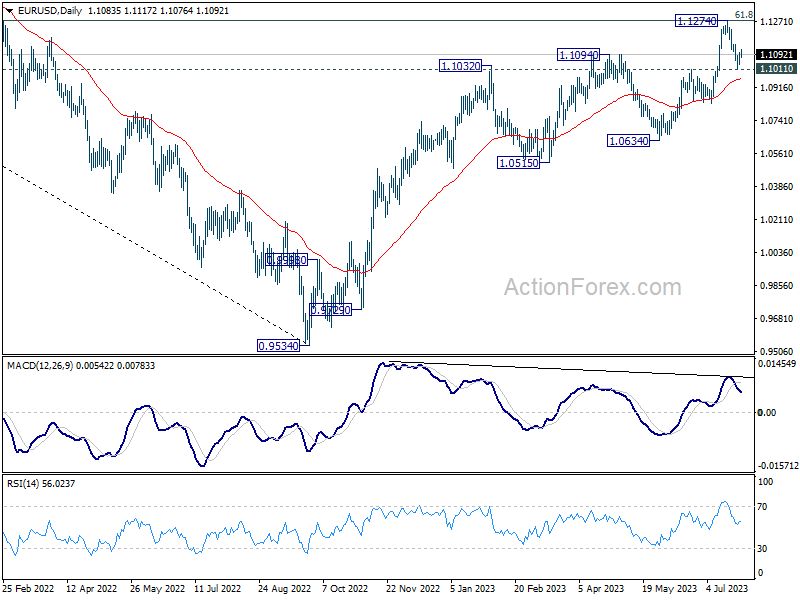
In the bigger picture, rise from 0.9534 is still expected to continue as long as 1.1011 resistance turned support holds. Decisive break of 61.8% retracement of 1.2348 (2021 high) to 0.9534 at 1.1273 will solidify the case of bullish trend reversal and target 1.2348 resistance next. However, firm break of 1.1011 will indicate rejection by 1.1273 and raise the chance of reversal.
GBP/USD Daily Outlook
Daily Pivots: (S1) 1.2840; (P) 1.2872; (R1) 1.2935; More...
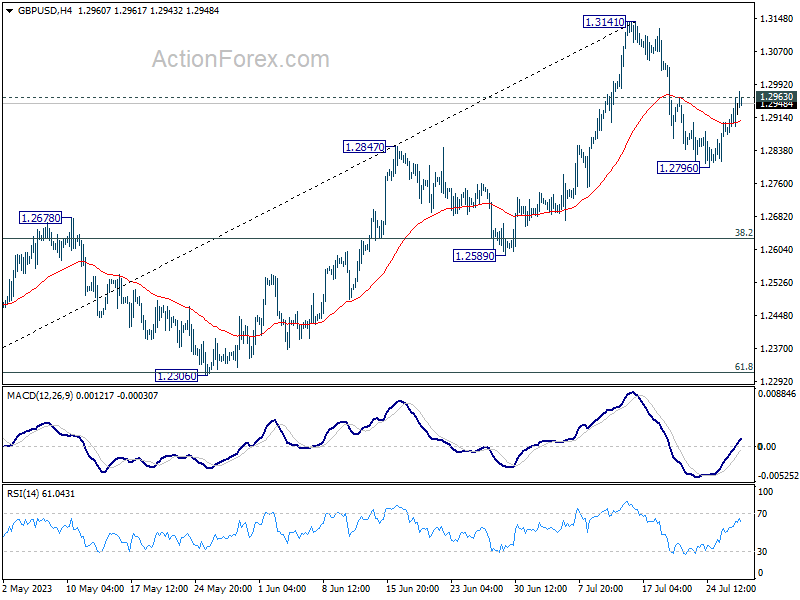
Immediate focus is now on 1.2963 minor resistance as rebound from 1.2796 extends. Firm break there will indicate that pull back from 1.3141 has completed. Intraday bias will be back on the upside for retesting this high next. On the downside, break of 1.2796 will resume the fall from 1.3141 to 55 D EMA (now at 1.2721) and possibly below.
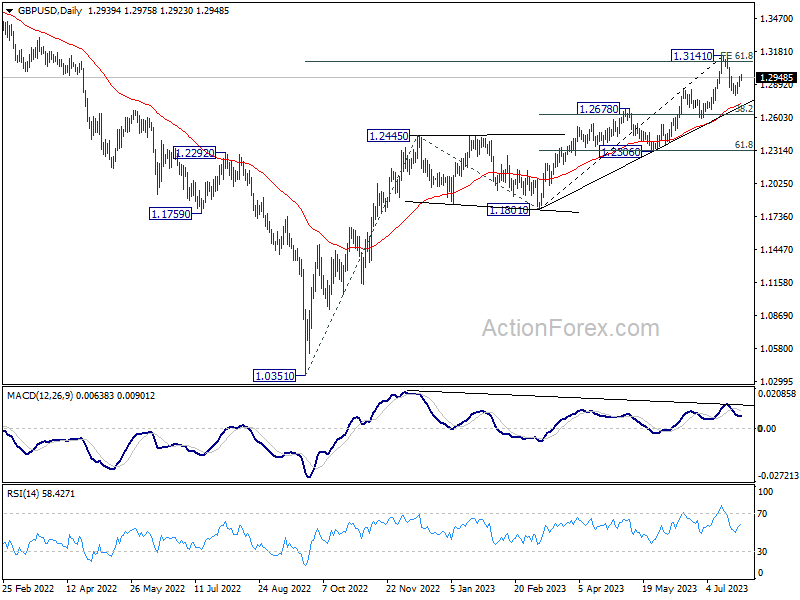
In the bigger picture, as long as 1.2678 resistance turned support holds, rise from 1.0351 (2022 low) is expected to continue. Next target is 100% projection of 1.0351 to 1.2445 from 1.1801 at 1.3895. However, sustained break of 1.2678 will argue that it's at least correcting this rally, with risk of bearish reversal.
USD/CHF Daily Outlook
Daily Pivots: (S1) 0.8585; (P) 0.8621; (R1) 0.8643; More...
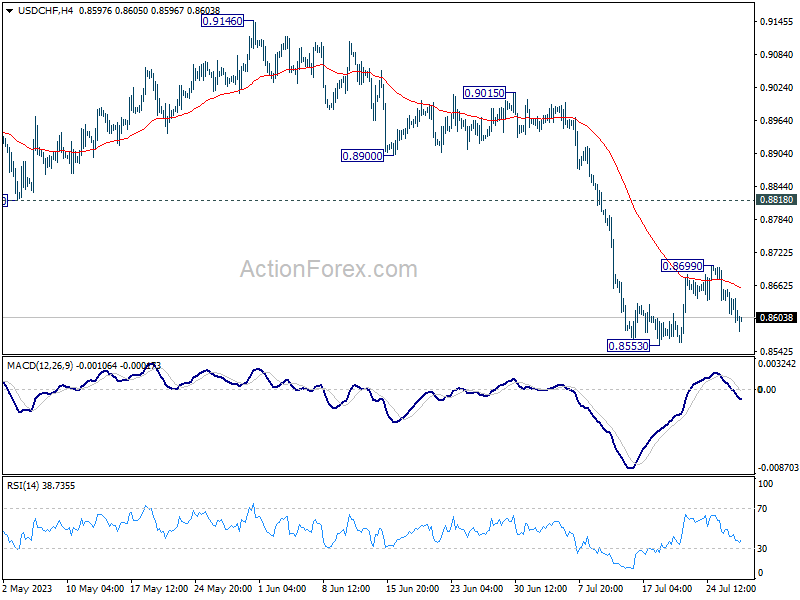
USD/CHF is staying in range above 0.8853 and intraday bias remains neutral at this point. Outlook stays bearish with 0.8818 support turned resistance intact. Break of 0.8553 will resume larger down trend from 1.0146, targeting 0.8317 fibonacci level. On the upside, above 0.8599 will resume the rebound towards 0.8818 instead.
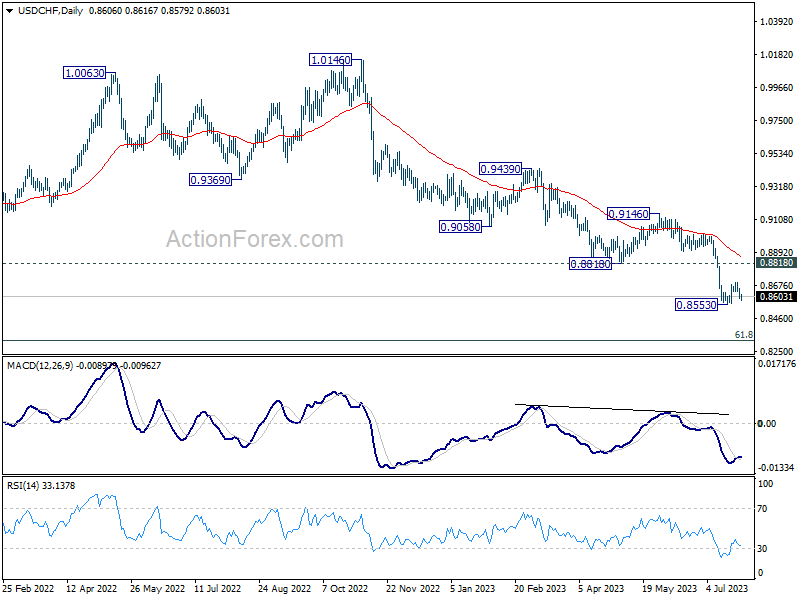
In the bigger picture, the break of 0.8756 (2021 low) indicates break out from the long term range pattern. For now, medium term outlook will stay bearish as long as 0.9146 resistance holds. Further fall would be seen to 61.8% retracement of 0.7065 (2011 low) to 1.0342 (2016 high) at 0.8317 next.
USD/CAD Daily Outlook
Daily Pivots: (S1) 1.3170; (P) 1.3205; (R1) 1.3241; More....
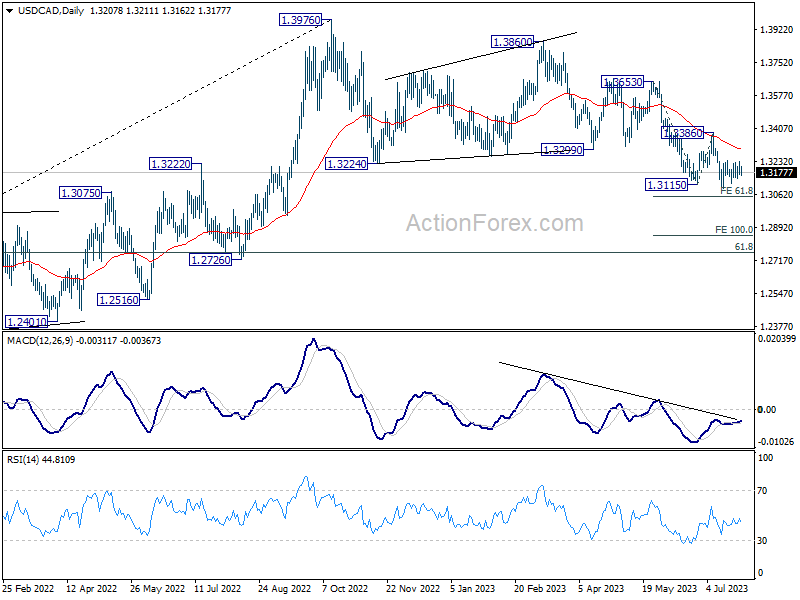
USD/CAD is still bounded in sideway trading and intraday bias stays neutral. Further decline is expected as long as 1.3386 resistance holds. Break of 1.3091 will resume larger fall and target 61.8% projection of 1.3653 to 1.3115 from 1.3386 at 1.3054. However, firm break of 1.3386 will indicate near term reversal and turn outlook bullish.
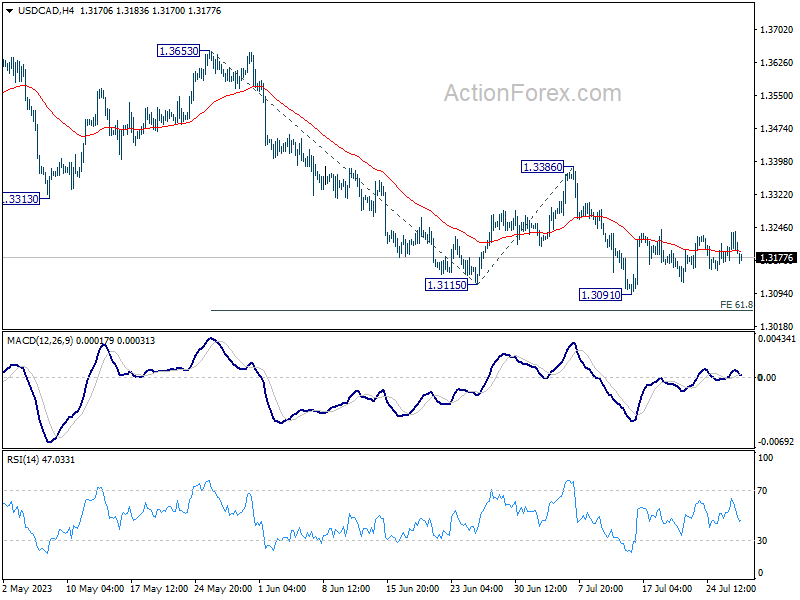
In the bigger picture, price actions from 1.3976 are viewed as a correction to up trend from 1.2005 (2021 low) only. But even so, deeper decline is expected as long as 1.3386 resistance holds. Further fall could be seen to 61.8% retracement of 1.2005 to 1.3976 at 1.2758. Meanwhile, break of 1.3386 will be a sign that the correction has completed and bring stronger rally back to retest 1.3976.
Technical Outlook and Review
DXY:
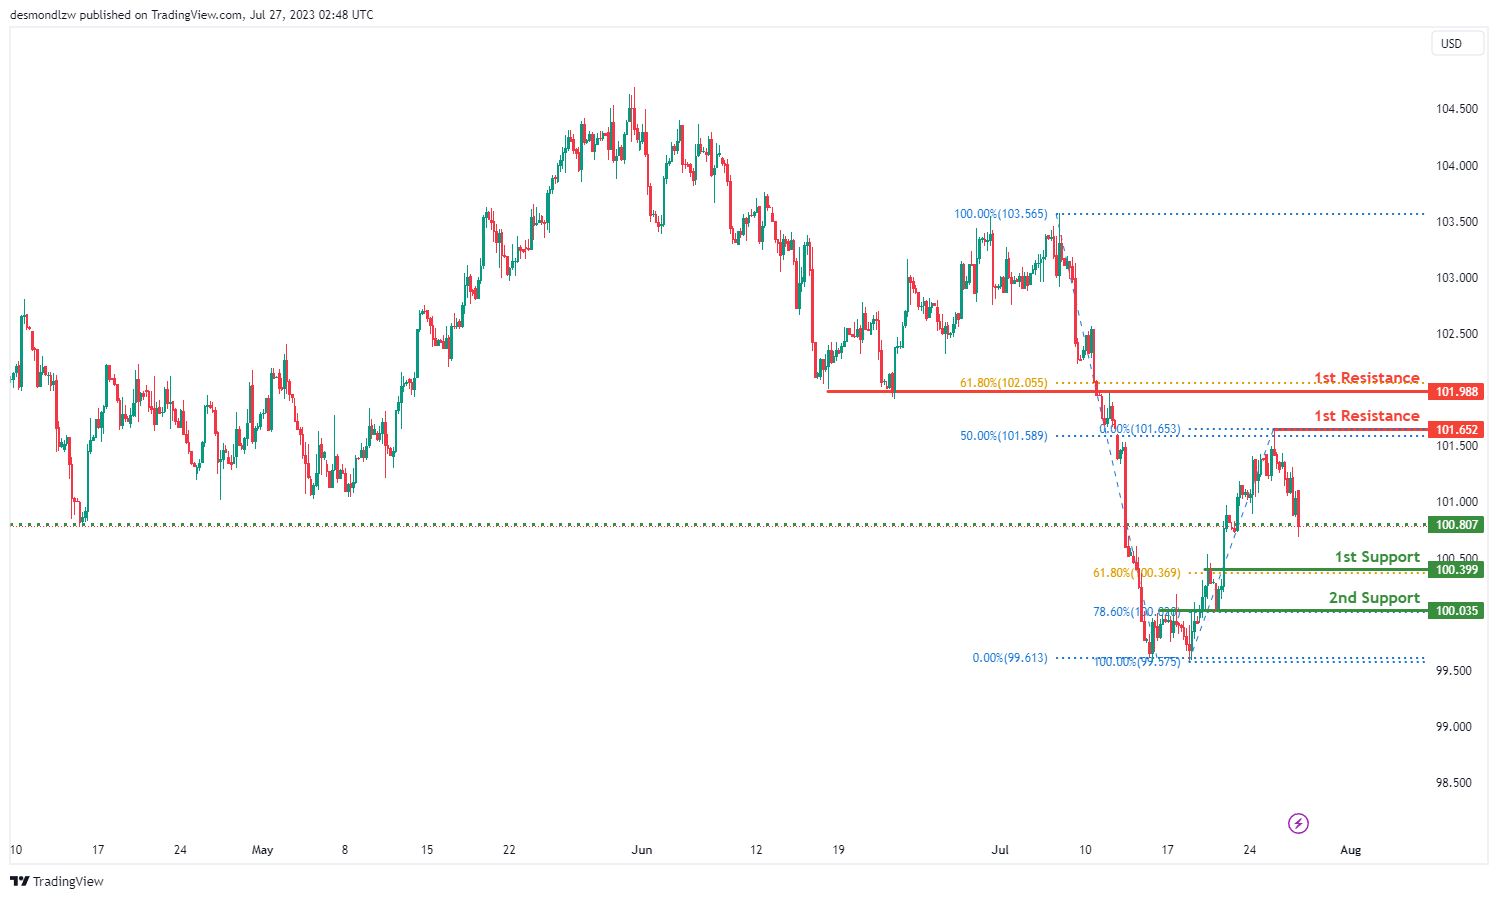
The DXY instrument is currently showing a bearish overall momentum. It’s predicted that the price could potentially make a bearish reaction off the 1st resistance and drop to the 1st support level.
The 1st support is located at 100.39 and is seen as good due to its quality as a pullback support and its position at the 61.80% Fibonacci retracement level.
The 2nd support level is found at 100.03 and is considered beneficial as it acts as an overlap support and is positioned at the 78.60% Fibonacci retracement level.
Regarding resistance levels, the 1st resistance stands at 101.65 and is notable for being a swing high resistance and positioned at the 50% Fibonacci retracement level.
The 2nd resistance level is at 101.98 and is recognized for its quality as a pullback resistance and its position at the 61.80% Fibonacci retracement level.
EUR/USD:
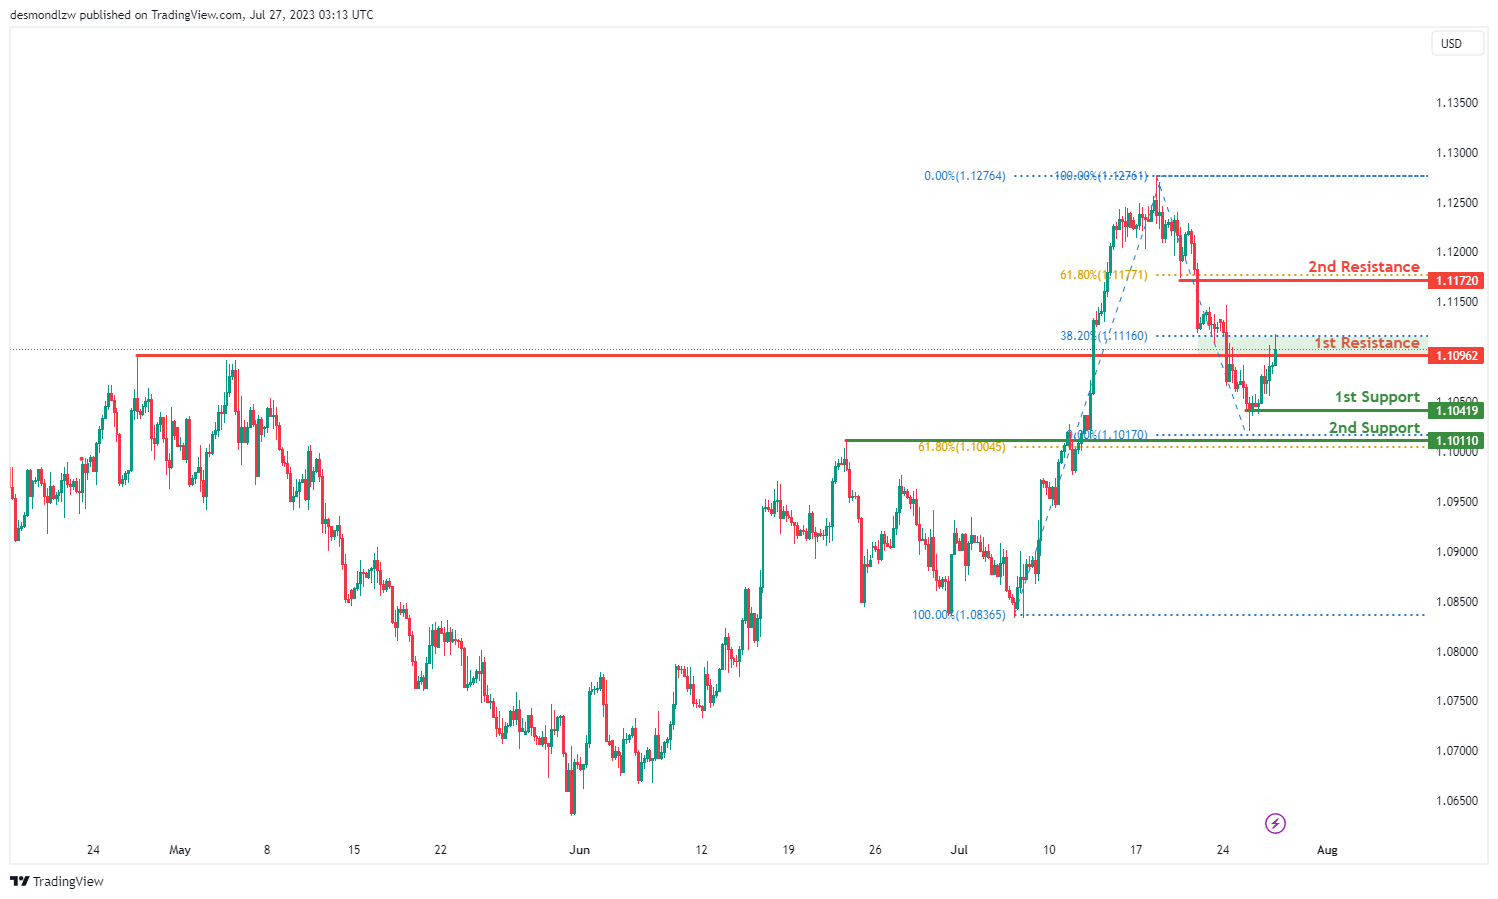
The EURUSD instrument is currently showing a bullish overall momentum. It’s anticipated that the price could potentially drop further to the 1st support level in the short term before bouncing from there and rising to the 1st resistance.
The 1st support is located at 1.1096 and is considered favourable due to its quality as a pullback support and its position at the 38.20% Fibonacci retracement level.
The 2nd support level is found at 1.1011 and is recognized for being an overlap support and its position at the 61.80% Fibonacci retracement level.
Regarding resistance levels, the 1st resistance stands at 1.1096 and is notable for being a pullback resistance, as well as its position at the 38.20% Fibonacci retracement level.
The 2nd resistance level is at 1.1172 and is seen as strong due to its quality as a pullback resistance and its position at the 61.80% Fibonacci retracement level.
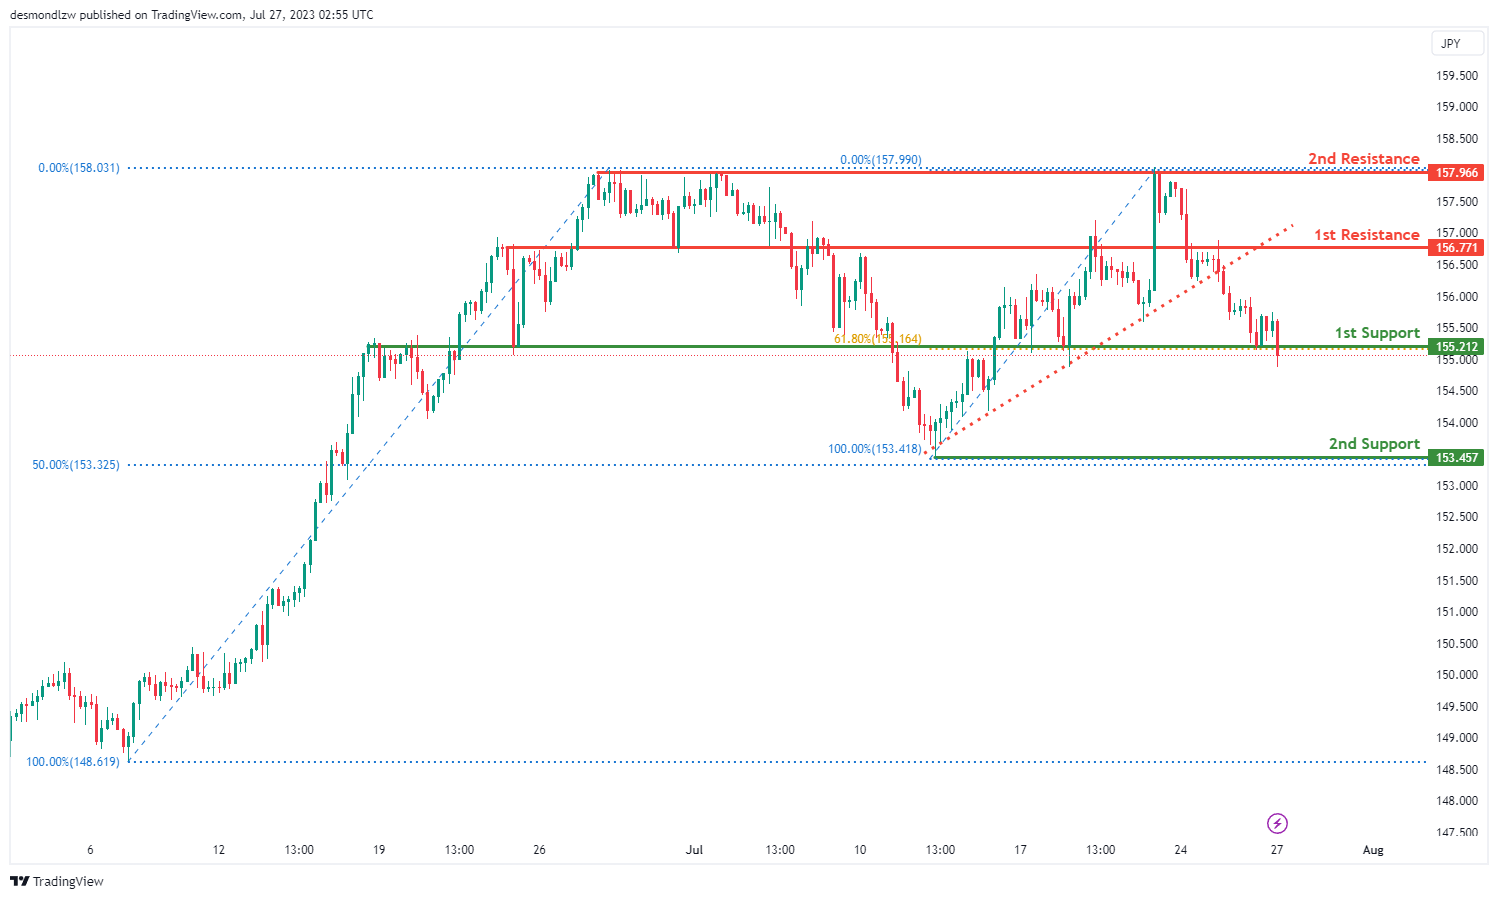
EUR/JPY:
The EUR/JPY instrument is currently demonstrating a bearish overall momentum. This bearish sentiment is attributed to the price breaking below an ascending support line, signaling the potential for a bearish move.
It is anticipated that the price could potentially undergo a bearish break off the 1st support level, leading to a subsequent drop towards the 2nd support level.
The 1st support level, situated at 155.21, is considered significant as it represents an overlap support and is positioned at the 61.80% Fibonacci retracement level.
The 2nd support level, located at 153.45, holds significance as a swing low support, coinciding with the 50% Fibonacci retracement level.
On the other hand, resistance levels are also observed. The 1st resistance, found at 156.77, is noteworthy for being an overlap resistance.
Lastly, the 2nd resistance level at 157.96 is recognized as a pullback resistance.
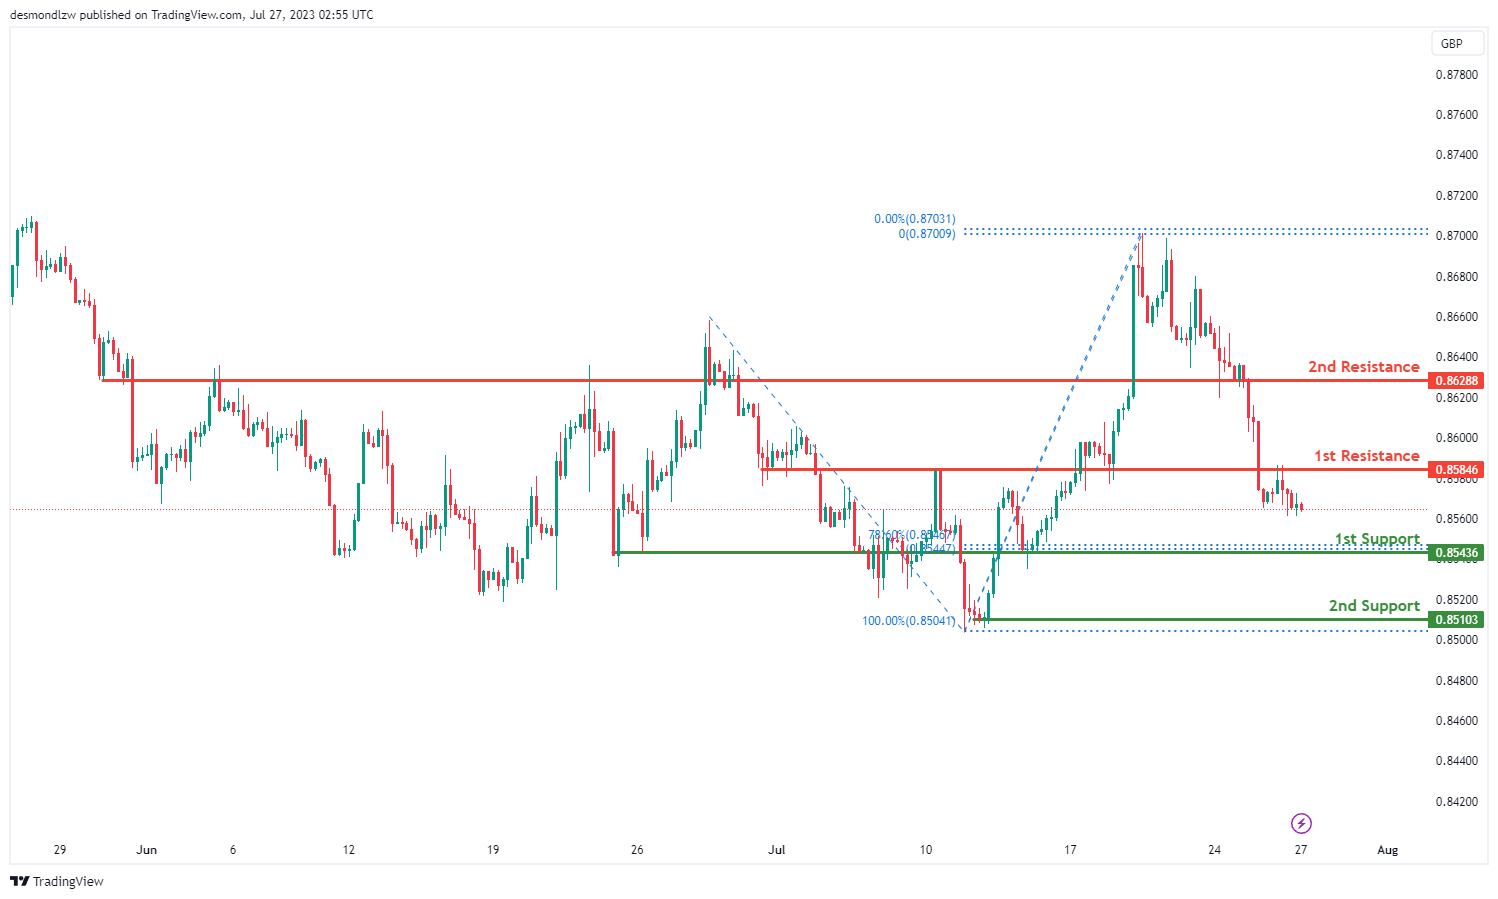
EUR/GBP:
The EUR/GBP instrument is currently demonstrating a bearish overall momentum.
It is anticipated that the price could potentially make a bearish continuation towards the 1st support level.
The 1st support is situated at 0.8543, and it is considered significant as it represents an overlap support and is positioned at the 78.60% Fibonacci retracement level.
The 2nd support level is located at 0.8510 and is recognized as a multi-swing low support, adding to its importance.
Regarding resistance levels, the 1st resistance stands at 0.8584 and is significant for being an overlap resistance.
The 2nd resistance level at 0.8628 is recognized as a pullback resistance, further reinforcing its significance in the current market dynamics.
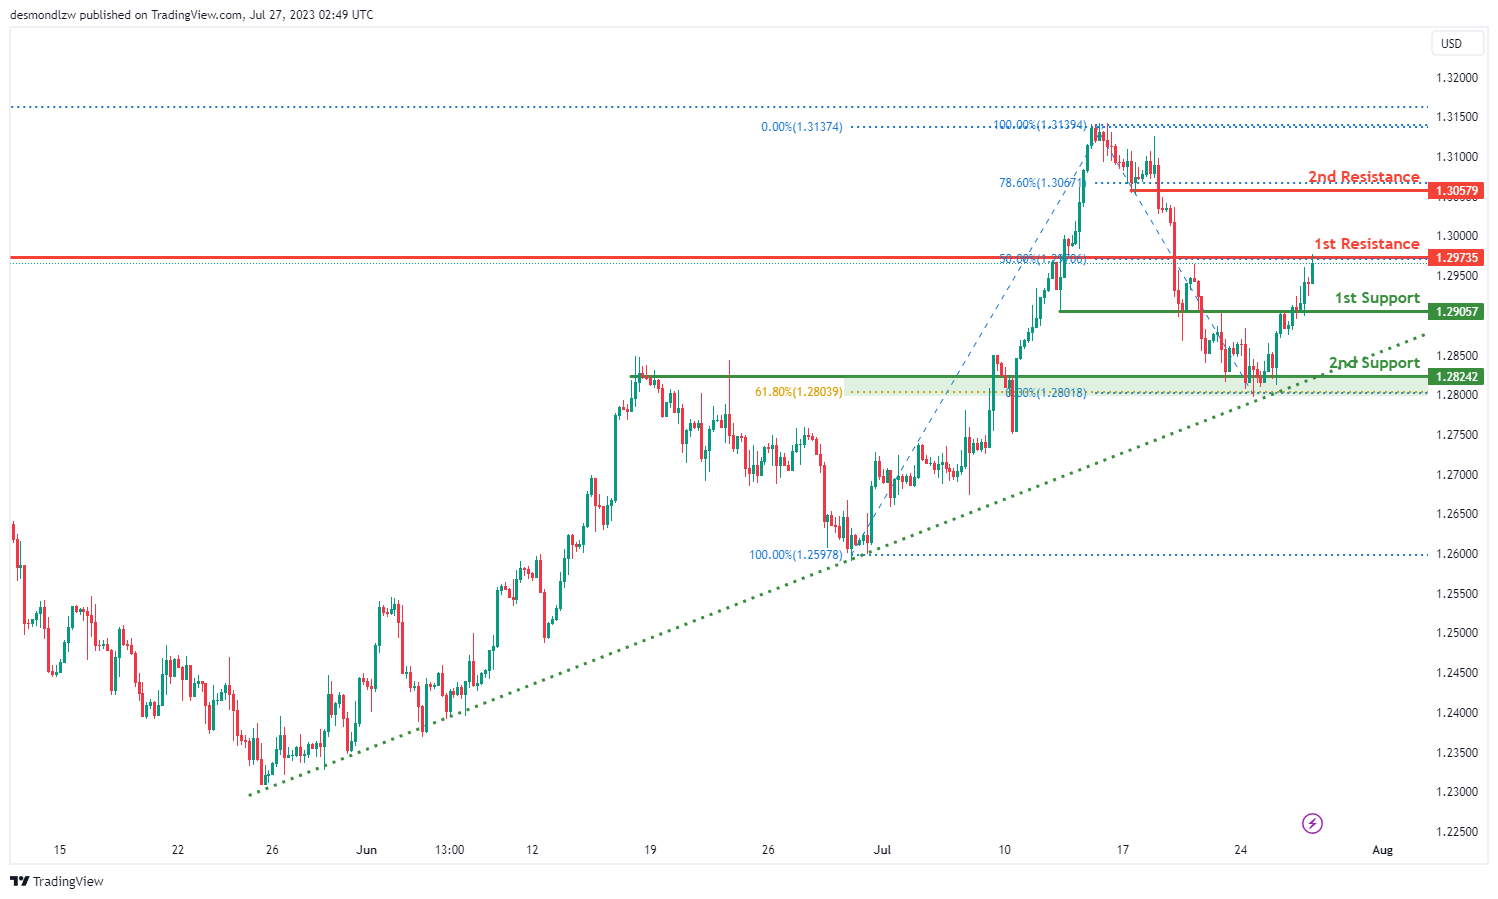
GBP/USD:
The GBP/USD instrument is currently showing a bearish overall momentum. However, factors contributing to the momentum suggest a possible bullish scenario as the price is above a major ascending trend line, indicating the potential for further bullish momentum.
It is predicted that the price could potentially make a bearish reaction off the 1st resistance level and drop to the 1st support level.
The 1st support is located at 1.2905 and is considered significant as it represents an overlap support.
The 2nd support level is found at 1.2824 and is recognized as an overlap support, further strengthened by its position at the 61.80% Fibonacci retracement level.
Regarding resistance levels, the 1st resistance stands at 1.2973 and is considered important for being a pullback resistance, as well as its position at the 50% Fibonacci retracement level.
The 2nd resistance level at 1.3057 is recognized as a pullback resistance and is further reinforced by its position at the 78.60% Fibonacci retracement level.
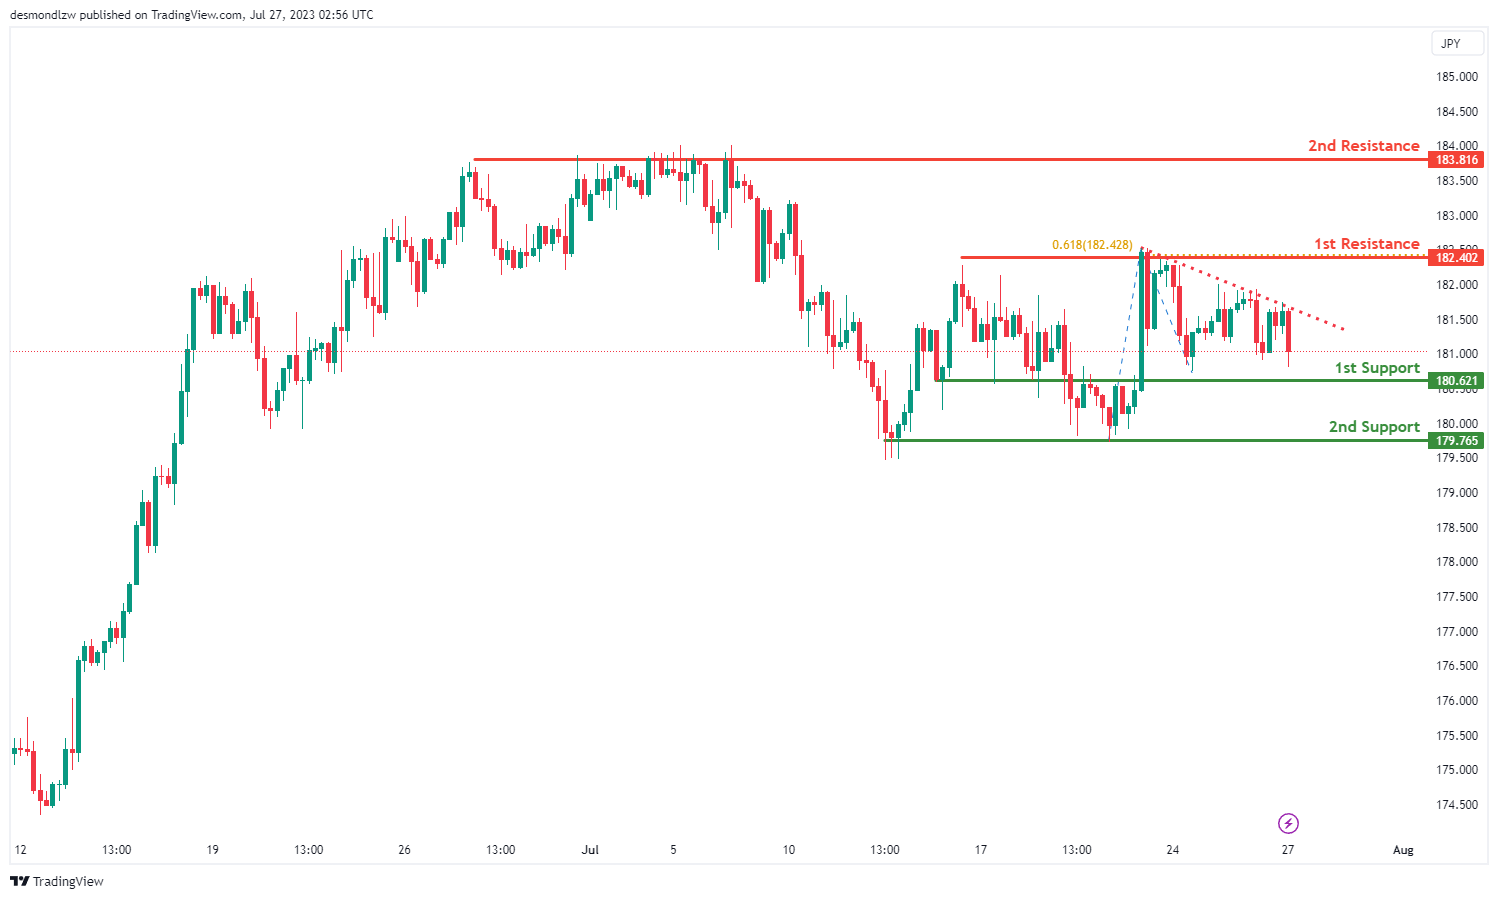
GBP/JPY:
The GBP/JPY instrument is currently showing a bearish overall momentum. Contributing to this momentum is the fact that the price is below a major descending trend line, suggesting that further bearish momentum is likely.
It is predicted that the price could potentially make a bearish break off the 1st support level and drop towards the 2nd support level.
The 1st support is located at 180.62 and is considered good as it represents a pullback support.
The 2nd support level is found at 179.76 and is recognized as a multi-swing low support, adding to its significance.
Regarding resistance levels, the 1st resistance stands at 182.40 and is considered important as it represents a multi-swing high resistance.
The 2nd resistance level, also at 182.40, is recognized as a multi-swing high resistance and is further reinforced by its positioning at the 61.80% Fibonacci projection level.
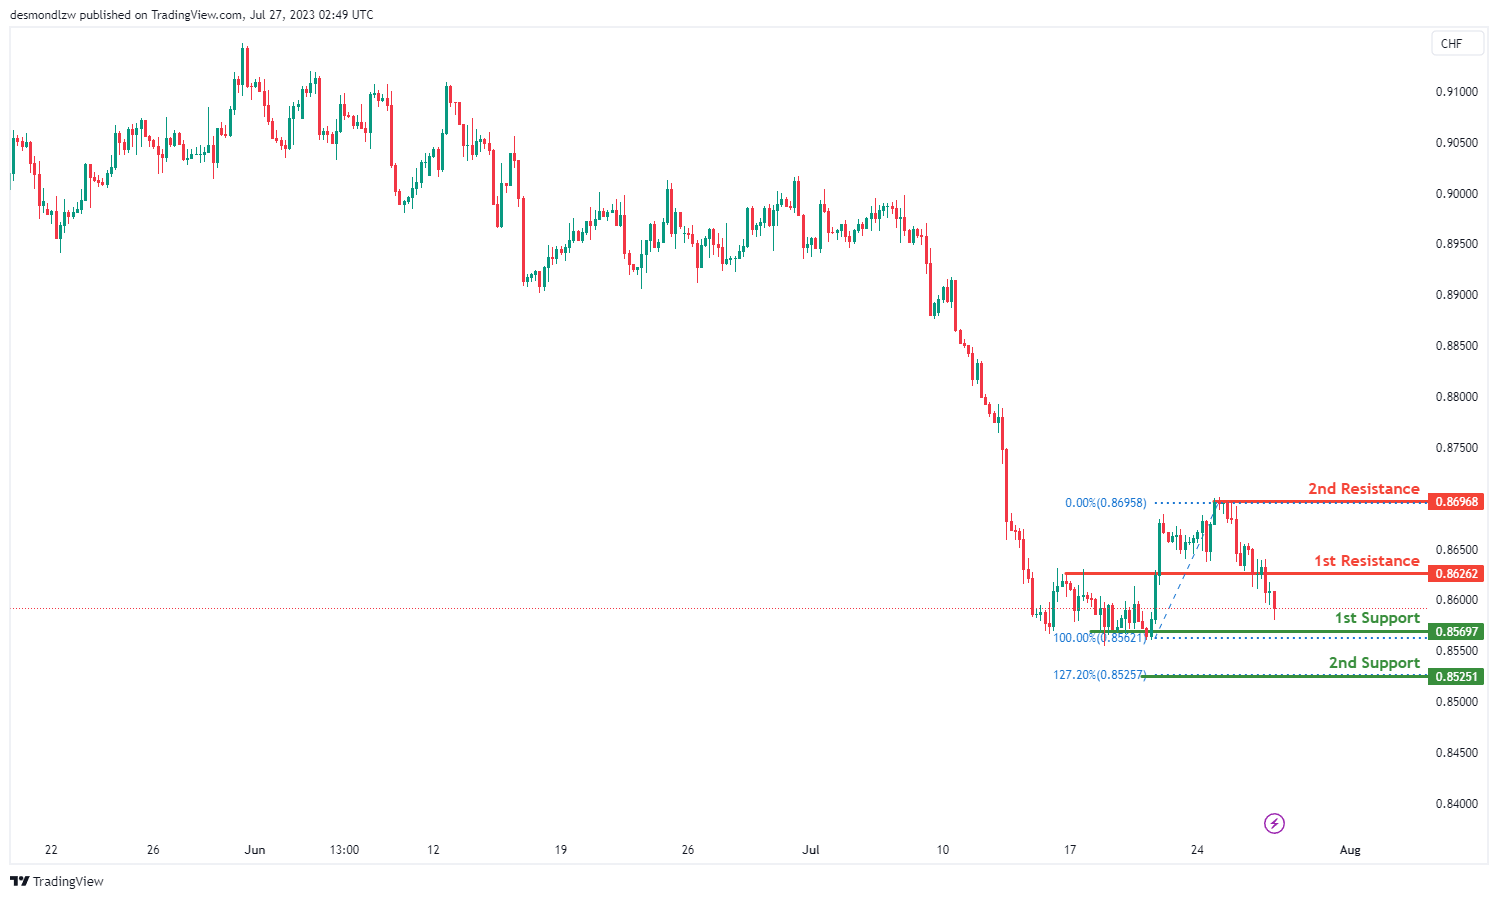
USD/CHF:
The USD/CHF instrument is currently showing a bearish overall momentum.
It is anticipated that the price could potentially make a bearish continuation towards the 1st support level.
The 1st support is situated at 0.8569 and is considered significant as it represents a multi-swing low support.
The 2nd support level is found at 0.8525 and is recognized as being at the 127.20% Fibonacci extension level, further adding to its importance.
Regarding resistance levels, the 1st resistance stands at 0.8626 and is seen as a pullback resistance.
The 2nd resistance level at 0.8696 is considered significant as it represents a multi-swing high resistance, reinforcing its importance in the current market dynamics.
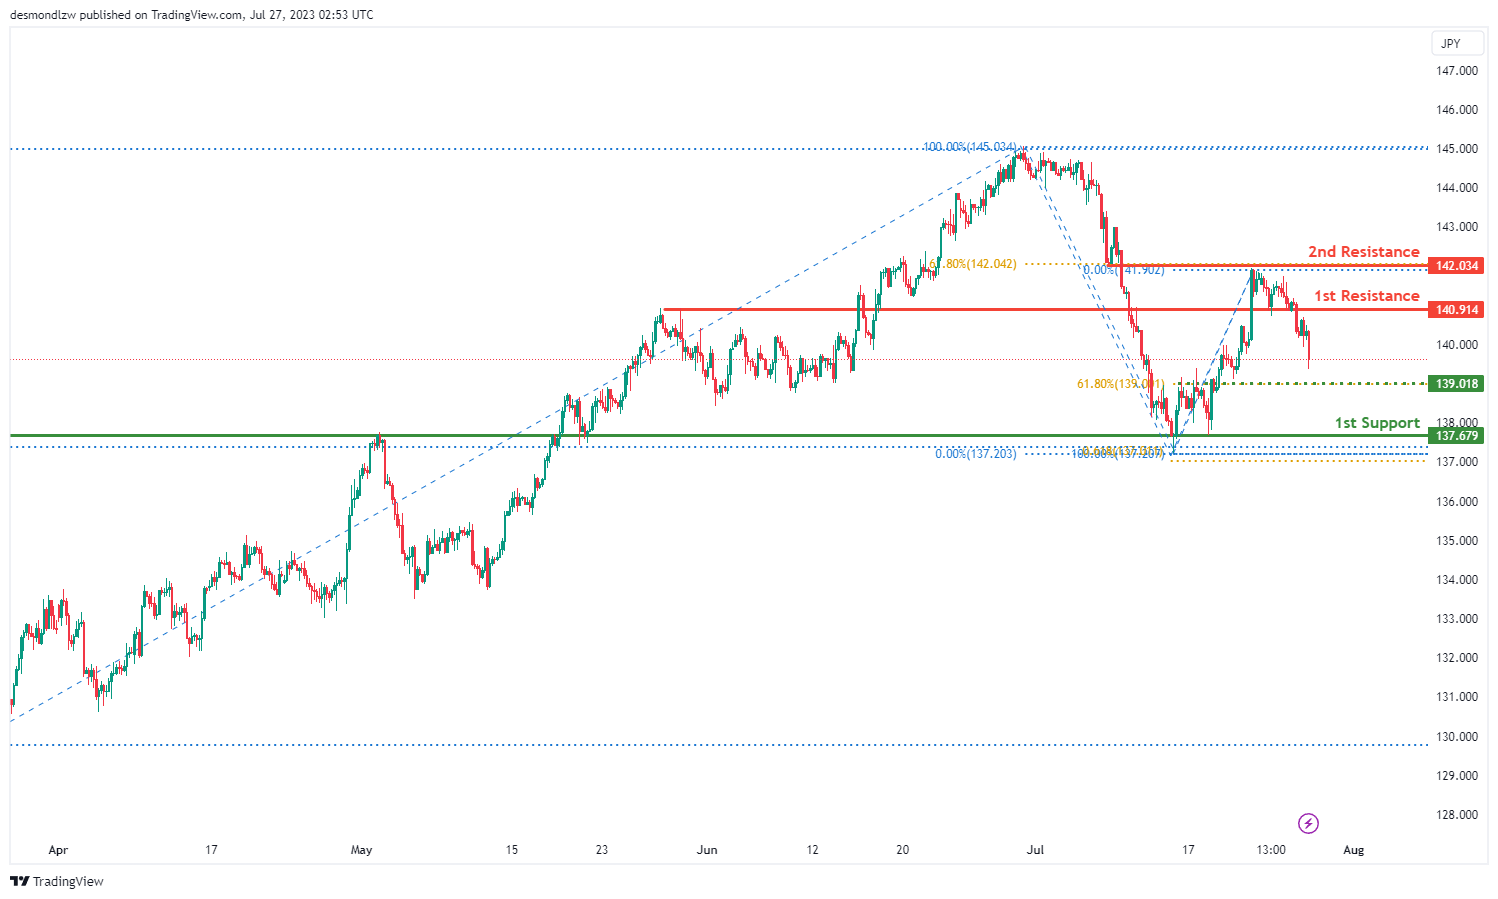
USD/JPY:
The USD/JPY instrument is currently showing a bearish overall momentum.
It is anticipated that the price could potentially make a bearish continuation towards the 1st support level.
The 1st support is located at 137.67 and is considered significant as it represents an overlap support and is positioned at the 61.80% Fibonacci projection level.
An intermediate support level is found at 139.01, which is recognized as a pullback support and is positioned at the 61.80% Fibonacci retracement level.
Regarding resistance levels, the 1st resistance stands at 140.91 and is considered important as it represents a pullback resistance.
The 2nd resistance level at 142.03 is significant as it represents an overlap resistance and is further reinforced by its position at the 61.80% Fibonacci retracement level.
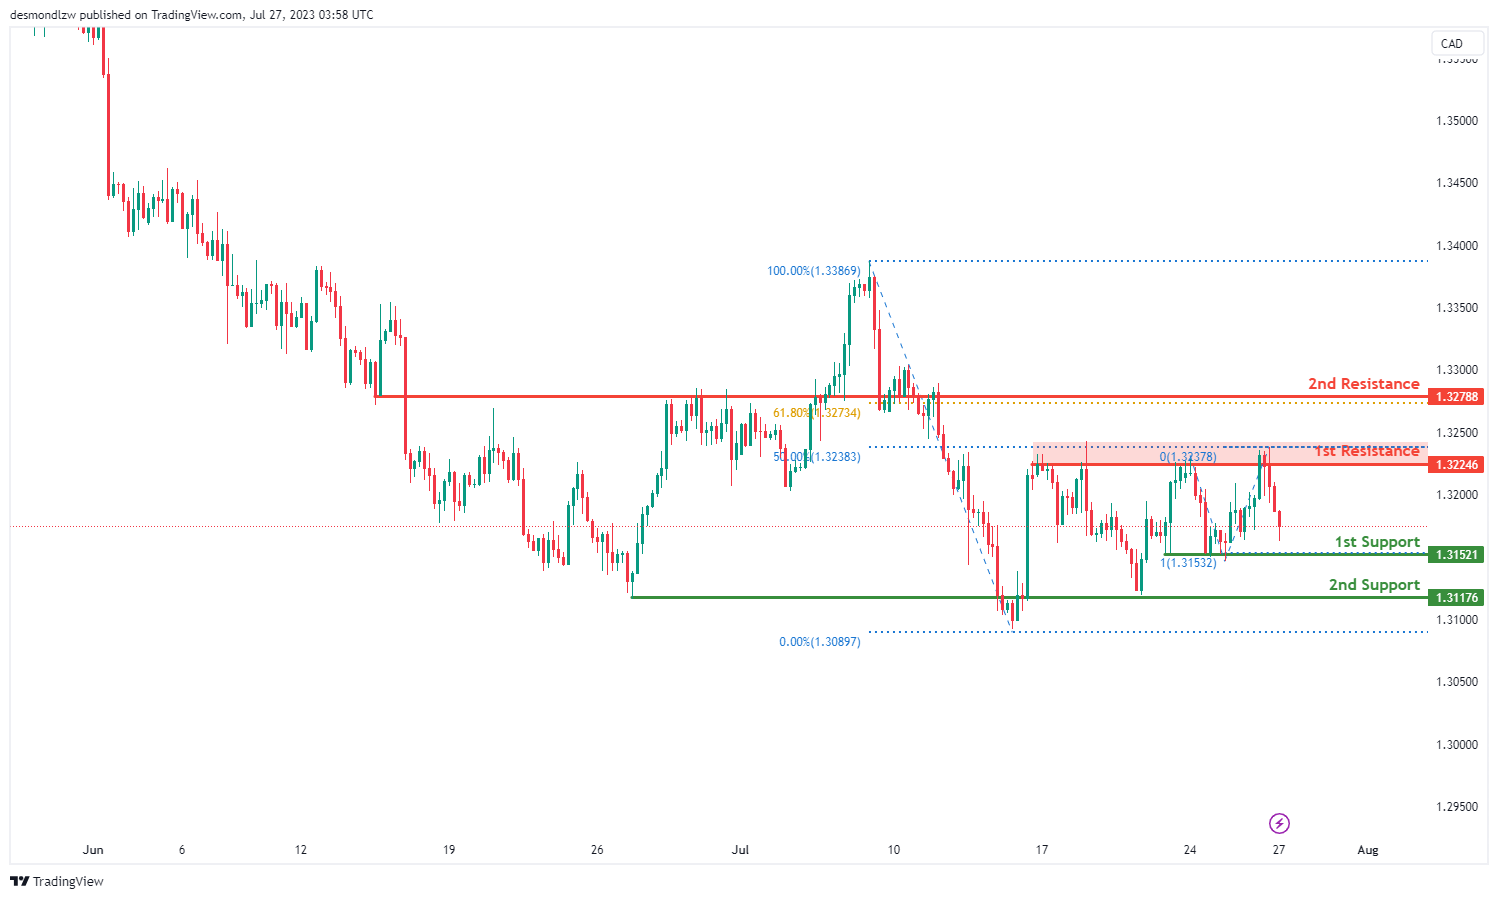
USD/CAD:
The USD/CAD chart demonstrates a bearish momentum, suggesting the potential for further downward movement.
There is a possibility of a bearish continuation towards the 1st support level at 1.3152. This support level holds significance as it represents a pullback support that coincides with the 100.00% Fibonacci projection level. In addition, the 2nd support level at 1.3118 is characterized as an overlap support.
To the upside, the 1st resistance at 1.3225 is identified as an overlap resistance that coincides with the 50.00% Fibonacci retracement level. Additionally, the 2nd resistance at 1.3279 is also recognized as an overlap resistance coinciding with the 61.80% Fibonacci retracement level.
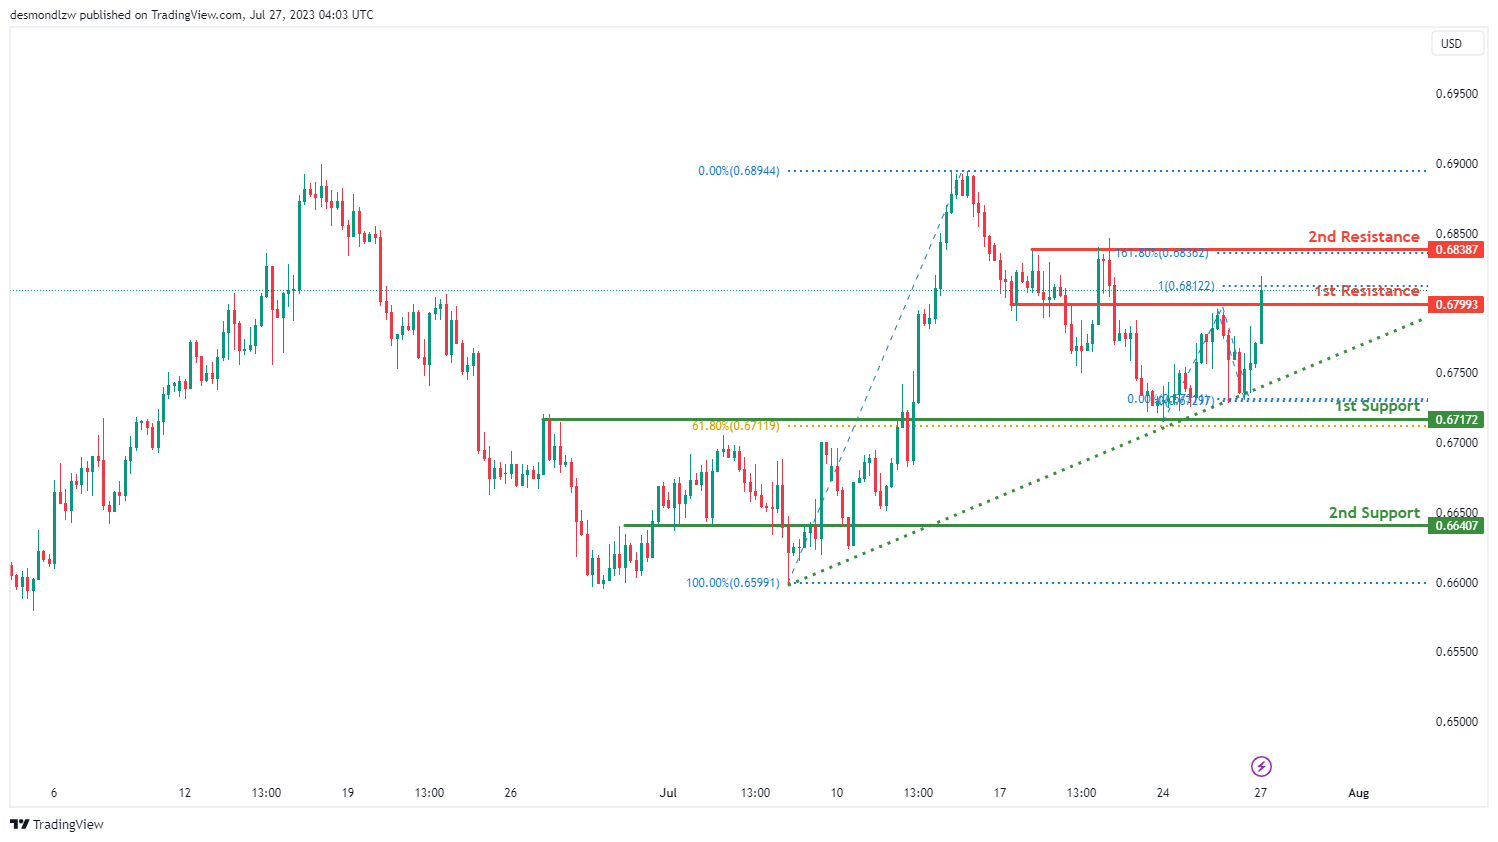
AUD/USD:
The AUD/USD chart exhibits strong bullish momentum with high confidence, indicating a potential continuation of the uptrend after breaking through the 1st resistance at 0.6799.
There is a likelihood of a bullish continuation towards the 2nd resistance level at 0.6839, which is a pullback resistance that coincides with both the 161.80% Fibonacci extension level.
On the downside, the 1st support at 0.6717 is recognized as an overlap support and aligns with the 61.80% Fibonacci retracement level.
Further downward movement may encounter another barrier at the 2nd support level of 0.6641. This support is identified as an overlap support level.
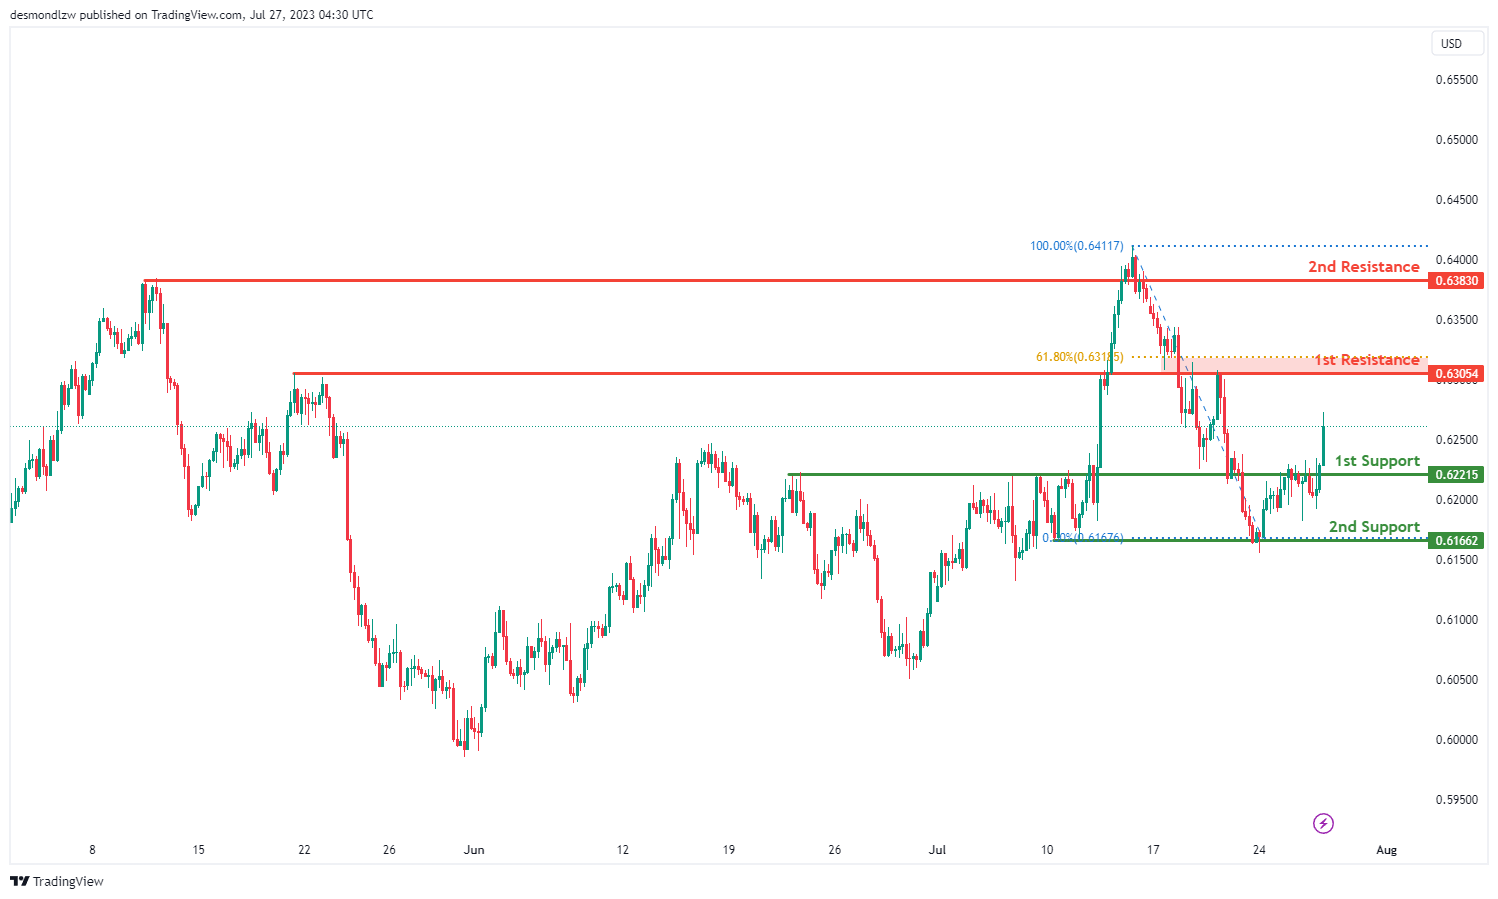
NZD/USD
The NZD/USD instrument is currently showing a bullish overall momentum.
It is predicted that the price could potentially make a bullish continuation towards the 1st resistance level.
The 1st support is located at 0.6221 and is considered significant as it represents a pullback support.
The 2nd support level is found at 0.6166 and is recognized as a multi-swing low support.
Regarding resistance levels, the 1st resistance stands at 0.6305 and is considered important as it represents an overlap resistance.
The 2nd resistance level at 0.6383 is also significant as it represents a pullback resistance, further reinforcing its importance in the current market dynamics.
With the bullish momentum of the chart, the price is likely to continue its upward movement towards the resistance levels, providing potential trading opportunities for bullish traders.
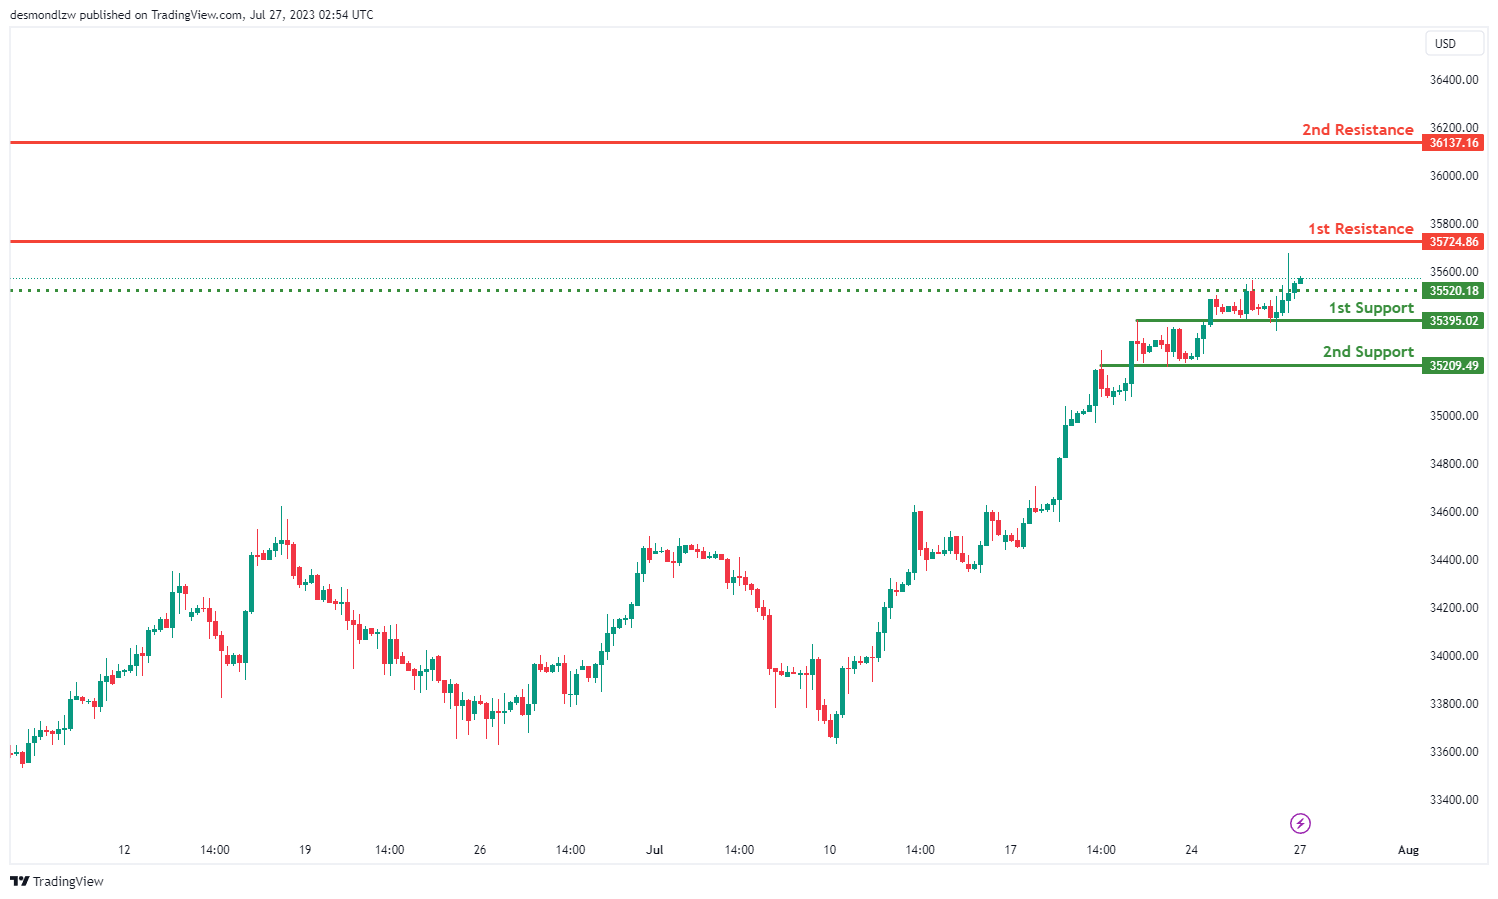
DJ30:
The DJ30 instrument is currently exhibiting a bullish overall momentum.
It is anticipated that the price could potentially make a bullish continuation towards the 1st resistance level.
The 1st support is located at 35395.02 and is considered significant as it represents an overlap support.
The 2nd support level is found at 35209.49 and is recognized as another overlap support.
Regarding resistance levels, the 1st resistance stands at 35724.86 and is considered important as it represents a pullback resistance.
The 2nd resistance level at 36137.16 is also significant as it represents another pullback resistance, further reinforcing its importance in the current market dynamics.
Additionally, there is an intermediate support level at 35520.18, which is recognized as a pullback support, adding to its significance in the overall chart analysis.
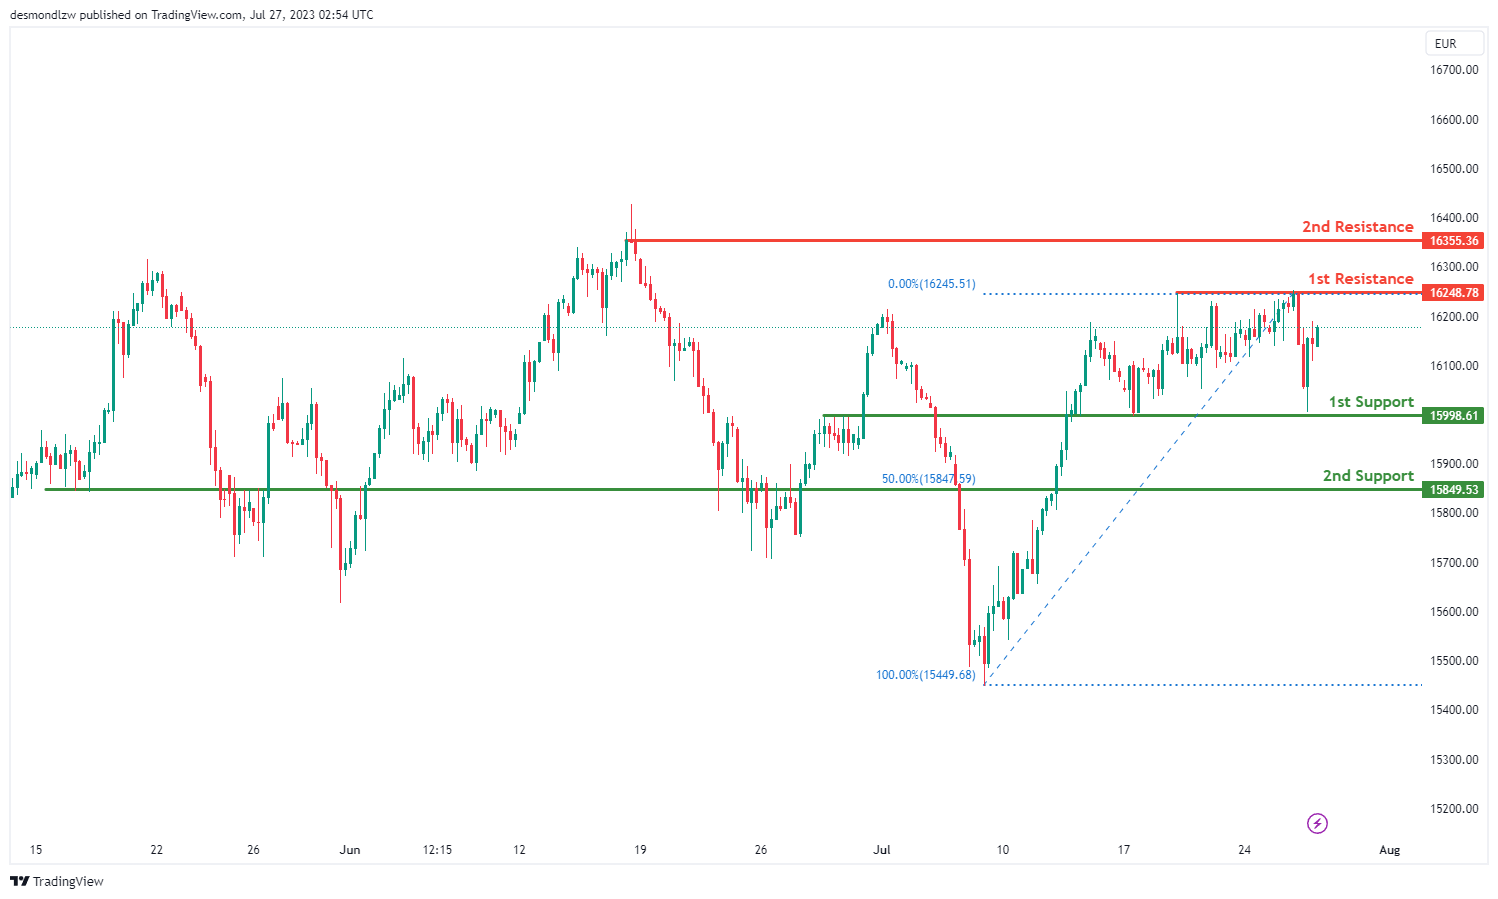
GER30:
The GER30 instrument is currently showing a bullish overall momentum.
It is predicted that the price could potentially make a bullish continuation towards the 1st resistance level.
The 1st support is located at 15998.61 and is considered significant as it represents an overlap support.
The 2nd support level is found at 15849.53 and is recognized as a pullback support.
Regarding resistance levels, the 1st resistance stands at 16248.78 and is considered important as it represents a multi-swing high resistance.
The 2nd resistance level at 16355.36 is also significant as it represents a multi-swing high resistance, further reinforcing its importance in the current market dynamics
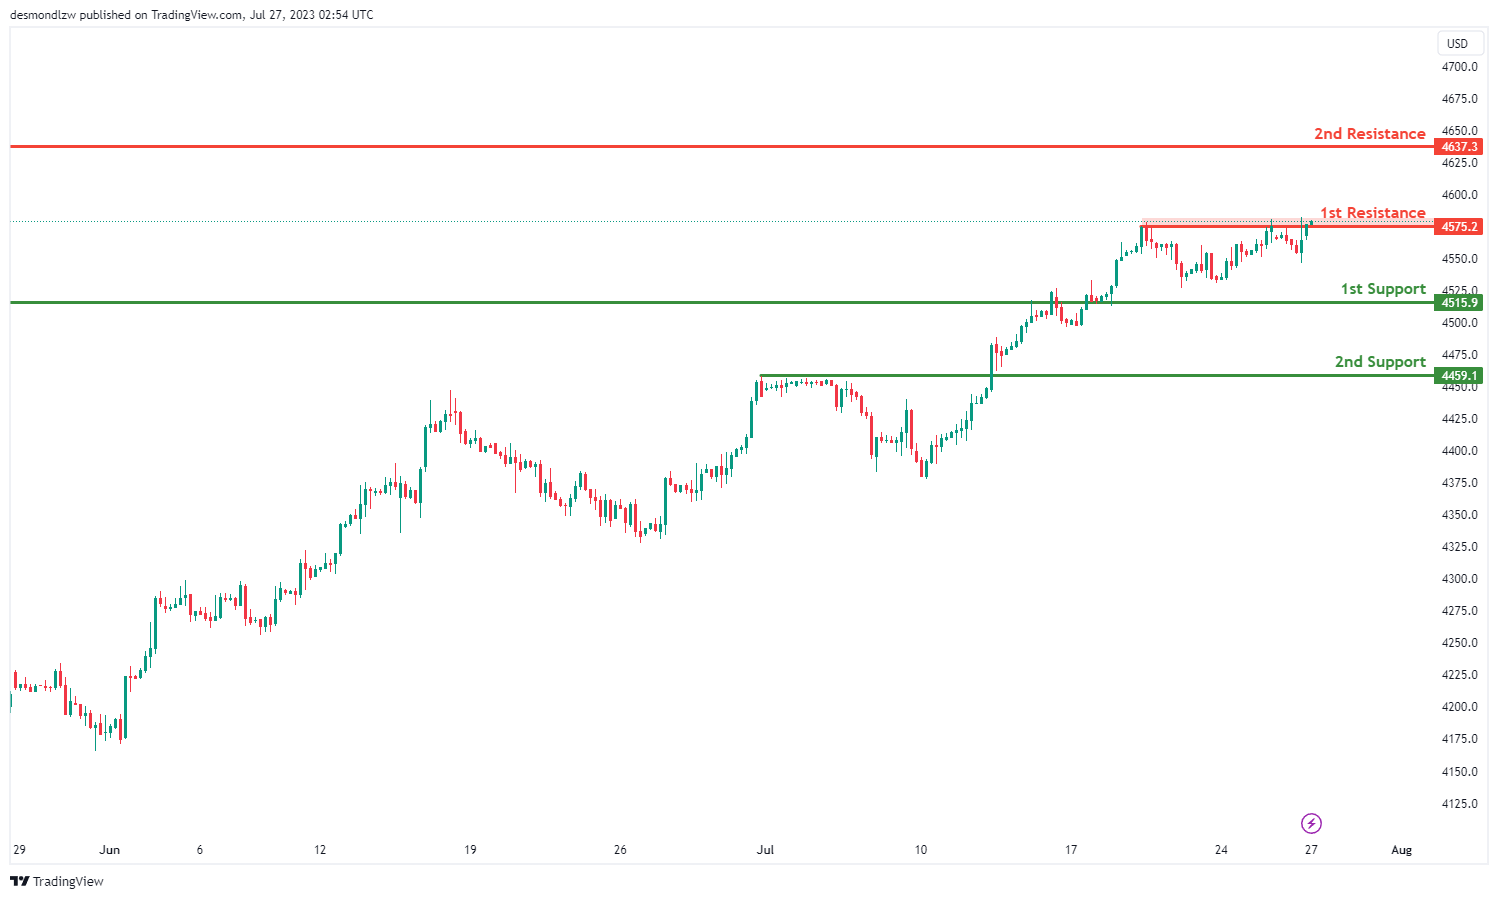
US500
The US500 instrument is currently displaying a bullish overall momentum.
It is anticipated that the price could potentially make a bullish break through the 1st resistance level and rise towards the 2nd resistance level.
The 1st support is located at 4515.9 and is considered significant as it represents a pullback support.
The 2nd support level is found at 4459.1 and is recognized as an overlap support.
Regarding resistance levels, the 1st resistance stands at 4575.2 and is considered important as it represents a multi-swing high resistance.
The 2nd resistance level at 4637.2 is also significant as it represents a multi-swing high resistance, further reinforcing its importance in the current market dynamics.
BTC/USD:
The BTC/USD instrument is currently showing a bearish overall momentum.
It is anticipated that the price could potentially make a bearish continuation towards the 1st support level.
The 1st support is situated at 28427 and is considered significant as it represents a pullback support.
The 2nd support level is found at 27456 and is also recognized as a pullback support.
Regarding resistance levels, the 1st resistance stands at 29610 and is considered important as it represents an overlap resistance.
The 2nd resistance level at 30431 is significant as it represents a multi-swing high resistance.
Additionally, there is an intermediate support level at 29002, which is recognized as a multi-swing low support, further adding to its significance.
ETH/USD:
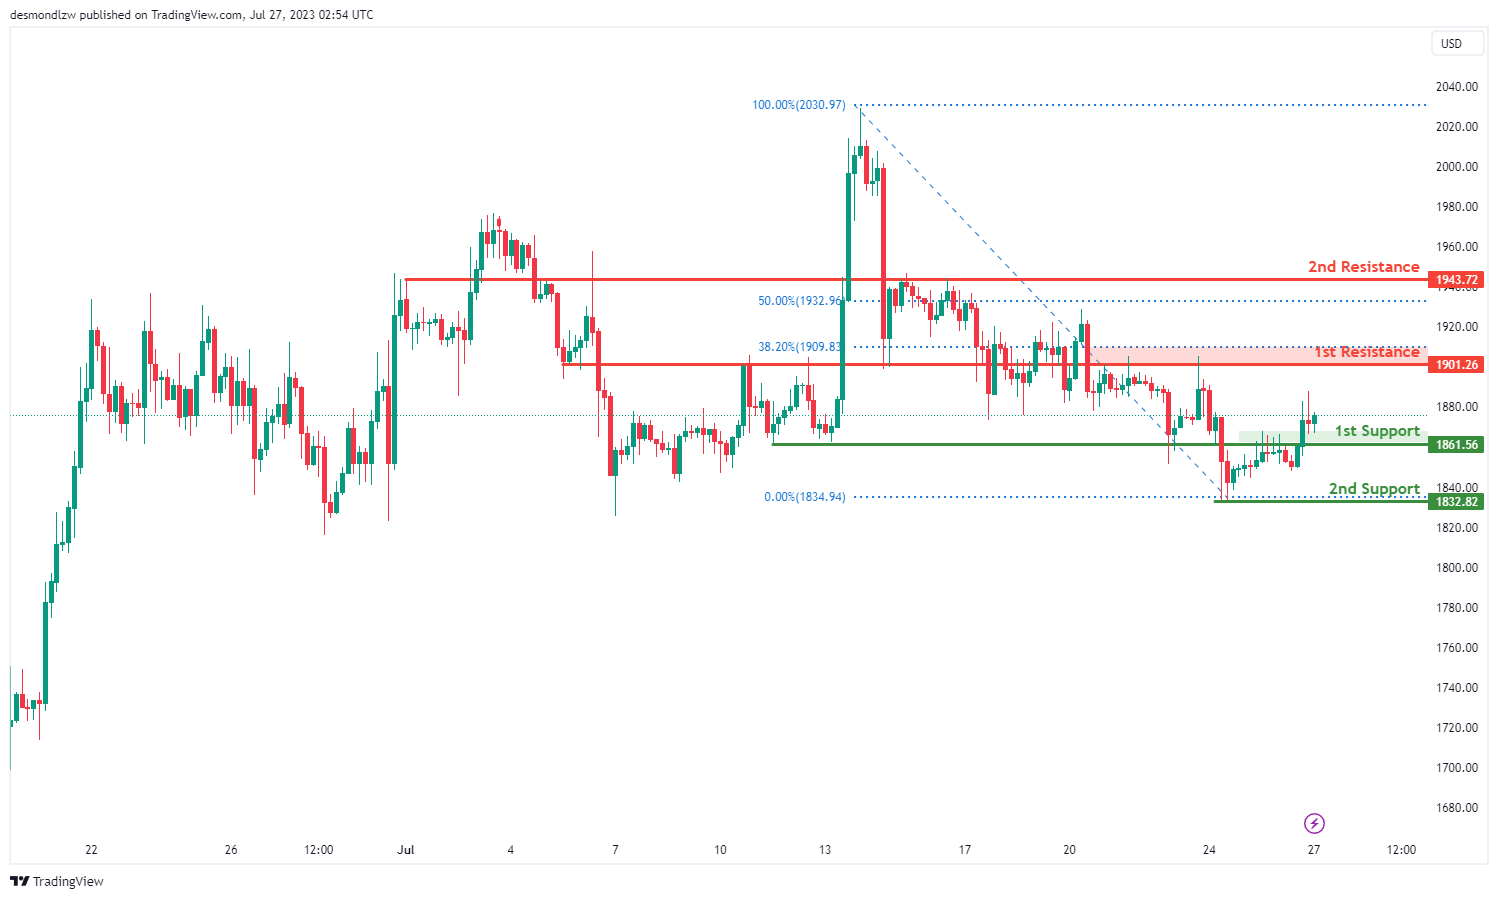
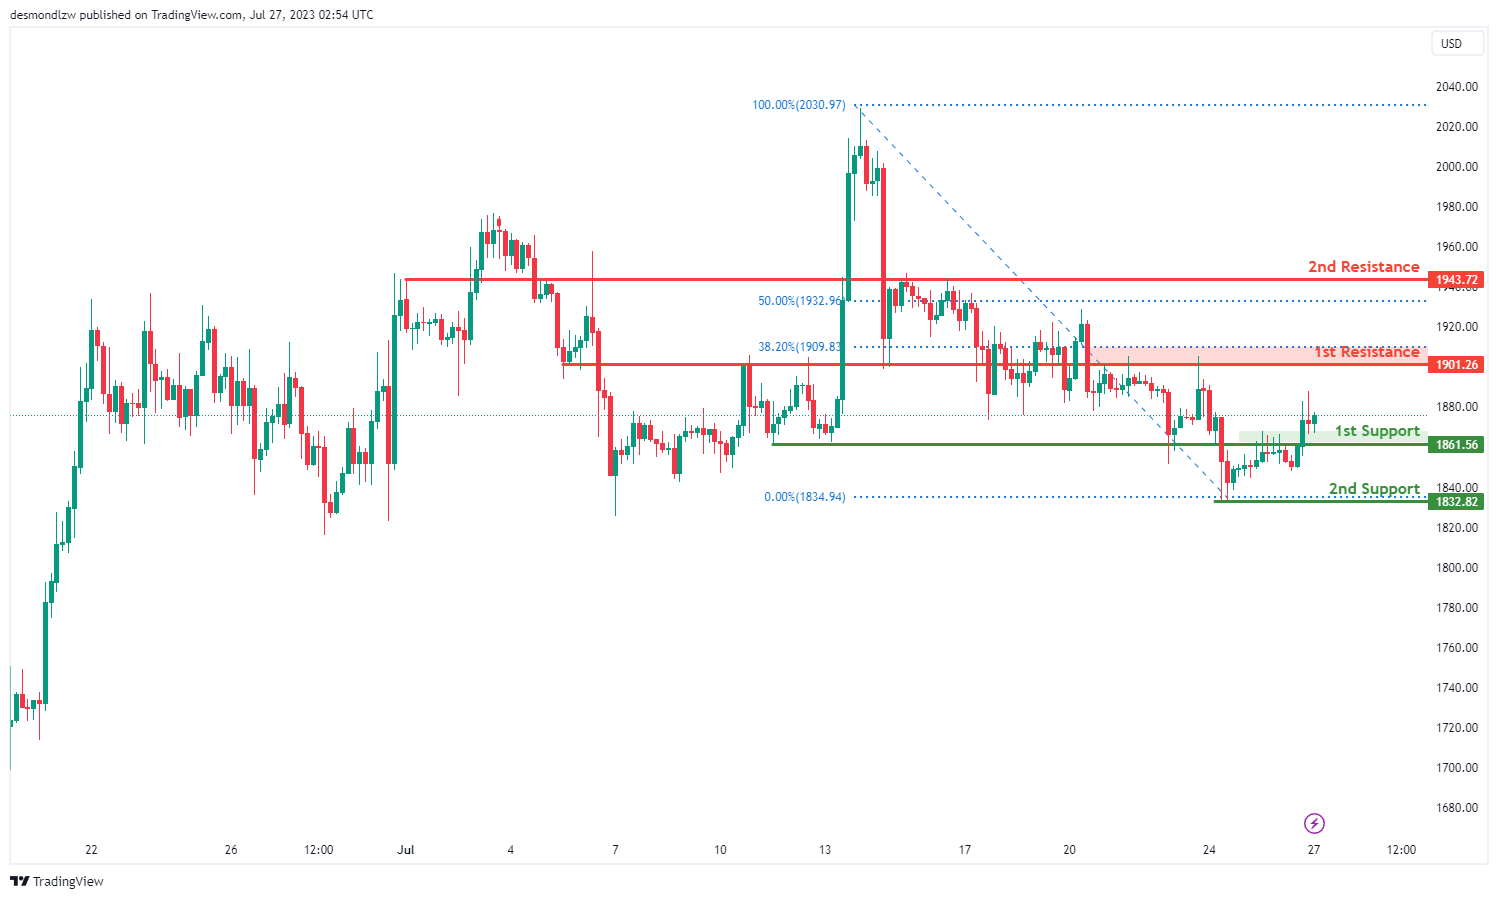
The ETH/USD instrument is currently exhibiting a bullish overall momentum.
It is predicted that the price could potentially make a bullish continuation towards the 1st resistance level.
The 1st support is located at 1861.56 and is considered significant as it represents a pullback support.
The 2nd support level is found at 1832.82 and is recognized as a swing low support.
Regarding resistance levels, the 1st resistance stands at 1901.26 and is considered important as it represents an overlap resistance and is positioned at the 38.20% Fibonacci retracement level.
The 2nd resistance level at 1943.72 is significant as it represents an overlap resistance and is further reinforced by its position at the 50% Fibonacci retracement level.
WTI/USD:
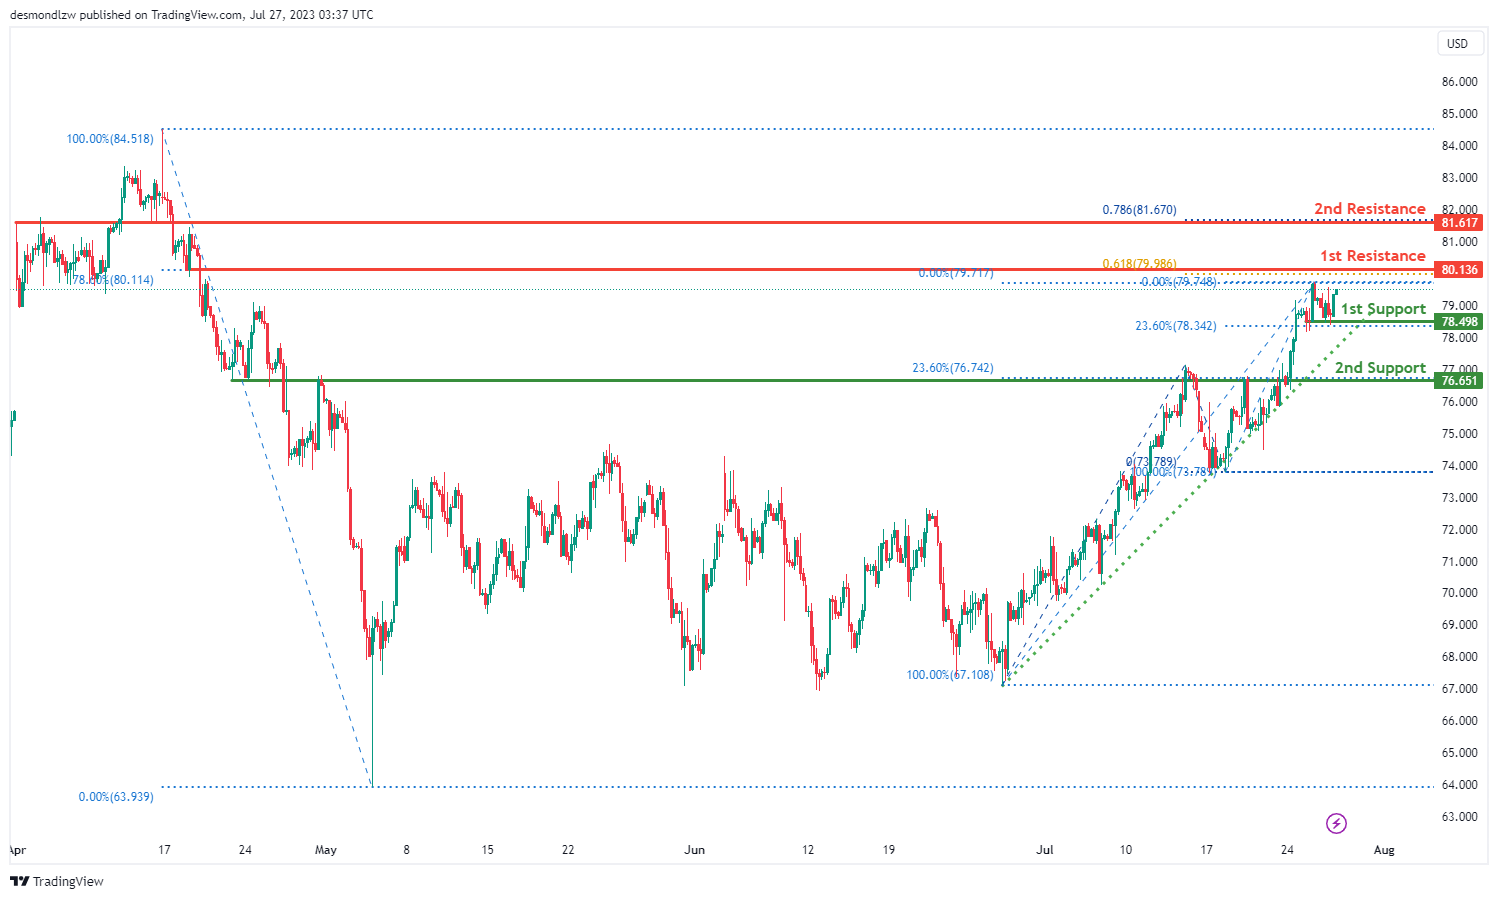
The WTI/USD chart shows a bullish momentum with a potential scenario for a bullish continuation towards the 1st resistance at 80.14, which is an overlap resistance that coincides with a confluence of Fibonacci levels namely the 78.60% retracement and 61.80% projection levels. Additionally, the 2nd resistance at 81.62 serves as another key area, which is also an overlap resistance that coincides with the 78.60% Fibonacci retracement level.
On the downside, the 1st support at 78.49 is a pullback support that also aligns with the 23.60% Fibonacci retracement level. Further downward movement may find support at the 2nd support level of 76.65, which is an overlap support that corresponds with the 23.60% Fibonacci retracement level. Furthermore, price is trading above an ascending trend line.
XAU/USD (GOLD):
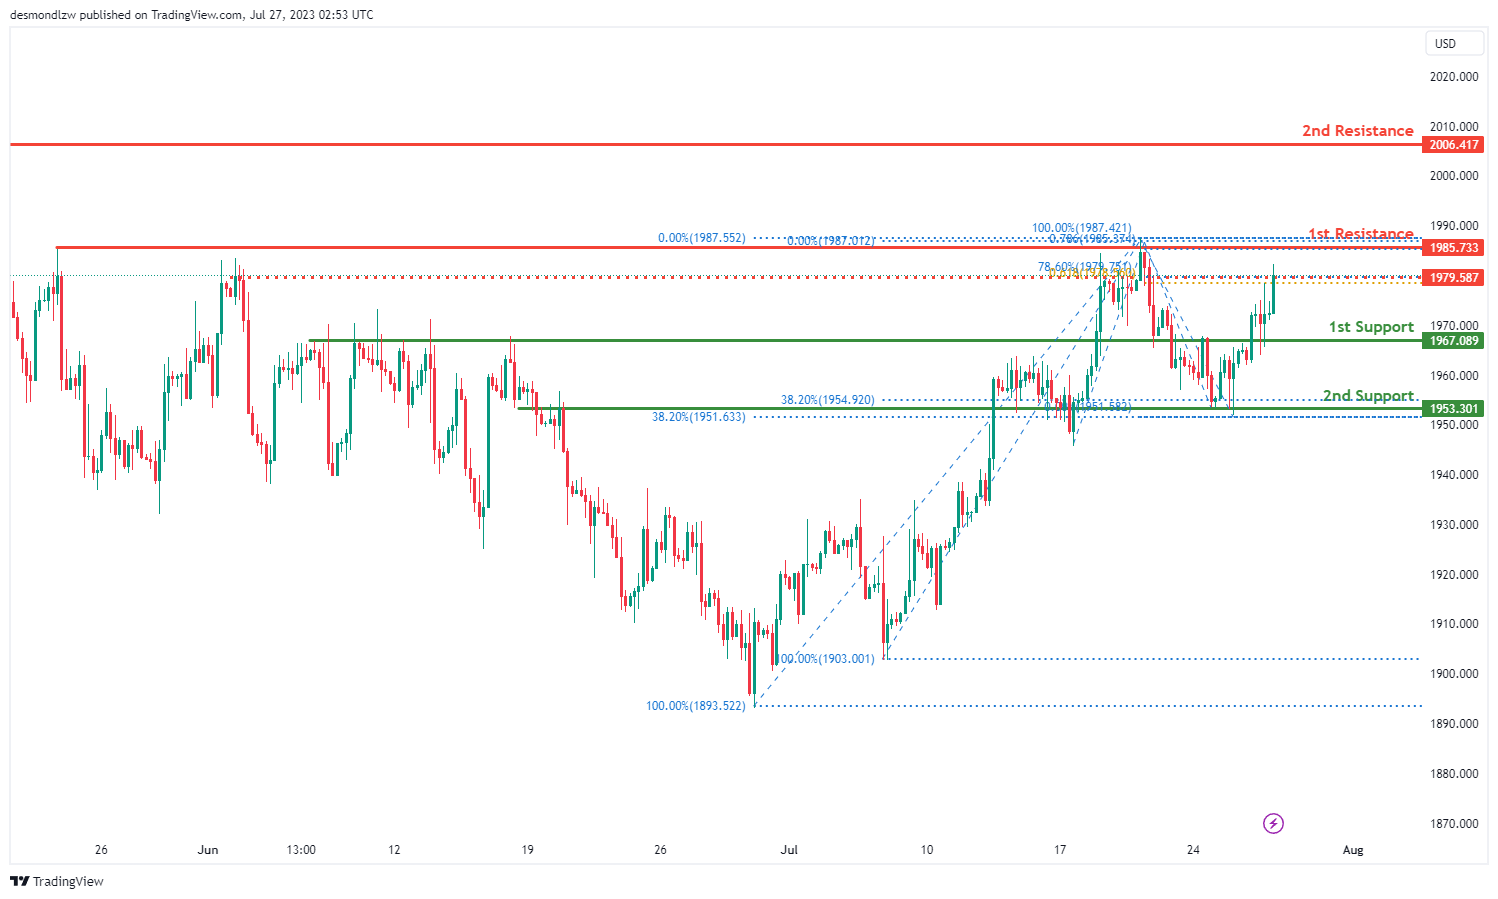
The XAU/USD instrument is currently displaying a bullish overall momentum.
It is predicted that the price could potentially make a bullish continuation towards the 1st resistance level.
The 1st support is located at 1967.08 and is considered significant as it represents an overlap support.
The 2nd support level is found at 1953.30, which is recognized as an overlap support and is positioned at both the 38.20% Fibonacci retracement level and the 38.20% Fibonacci retracement level, indicating a Fibonacci confluence.
Regarding resistance levels, the 1st resistance stands at 1985.73 and is considered important as it represents a multi-swing high resistance.
The 2nd resistance level at 2006.41 is significant as it represents a pullback resistance.
An intermediate resistance level is found at 1979.00, recognized as a pullback resistance and positioned at both the 78.60% Fibonacci retracement level and the 61.80% Fibonacci projection level, indicating a Fibonacci confluence.
AUD/USD Daily Report
Daily Pivots: (S1) 0.6729; (P) 0.6761; (R1) 0.6792; More...
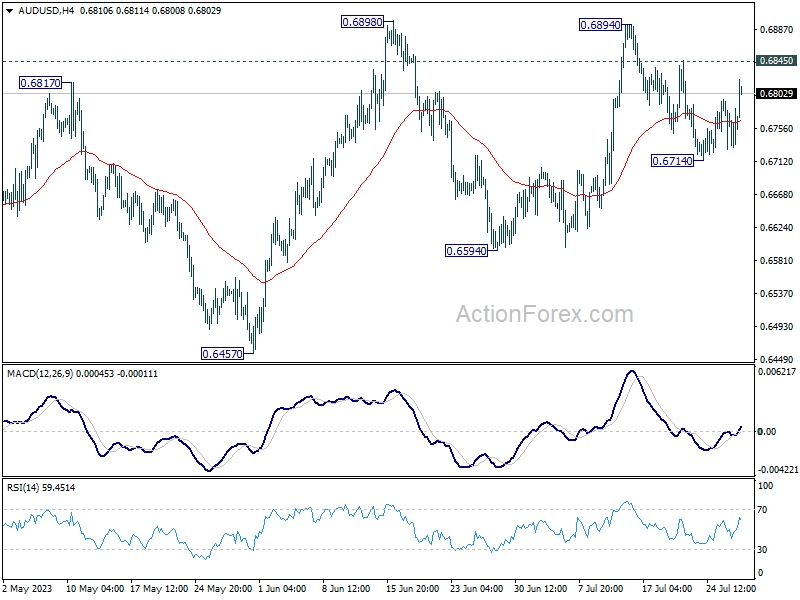
AUD/USD's rebound from 0.6714 extends higher today but stays below 0.6845 minor resistance. Intraday bias remains neutral at this point. On the upside, above 0.6845 will bring retest of 0.6898 resistance. Decisive break there will resume rise from 0.6457. On the downside below 0.6714 will resume the fall from 0.6894, as the third leg of the corrective pattern from 0.6898. But downside should be contained above 0.6594 support to bring rebound.
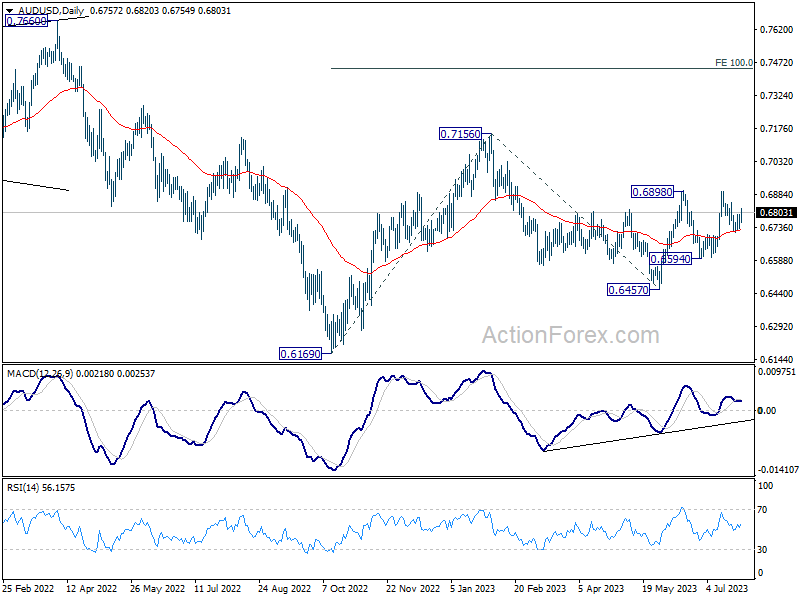
In the bigger picture, price actions from 0.7156 are seen as a correction to the rebound from 0.6169 (2022 low). Break of 0.6898 resistance will argue that rise from 0.6169 is ready to resume through 0.7156. Next target will be 100% projection of 0.6169 to 0.7156 from 0.6457 at 0.7444. For now, this will be the favored case as long as 55 D EMA (now at 0.6715) holds.
Bullish Sentiment Surfaces in Asia after Fed Hike, ECB and US GDP Awaited
Asian markets are trading in positive mood today, even though US stocks were unmoved by FOMC's rate hike overnight. Fed Chair Jerome Powell was predictably non-committal regarding next policy decision. But investors appear content to go along with the prevailing trend. Meanwhile, this upbeat sentiment is giving a notable boost to commodity currencies, with Australian Dollar emerging as the frontrunner. Dollar, however, is facing broad-based pressure, closely followed by European majors, while Yen is holding steady as it awaits its next catalyst.
ECB rate decision is definitely a major focus today. However, it's essential to keep in mind that the US is set to release key economic data today as well, including Q1 GDP advance estimate, durable goods orders, and weekly jobless claims figures. Both ECB decision and US GDP data have the potential to significantly stir the markets. Meanwhile, any unusual fluctuations in Yen should also be closely monitored, particularly ahead of tomorrow's policy decision by BoJ.
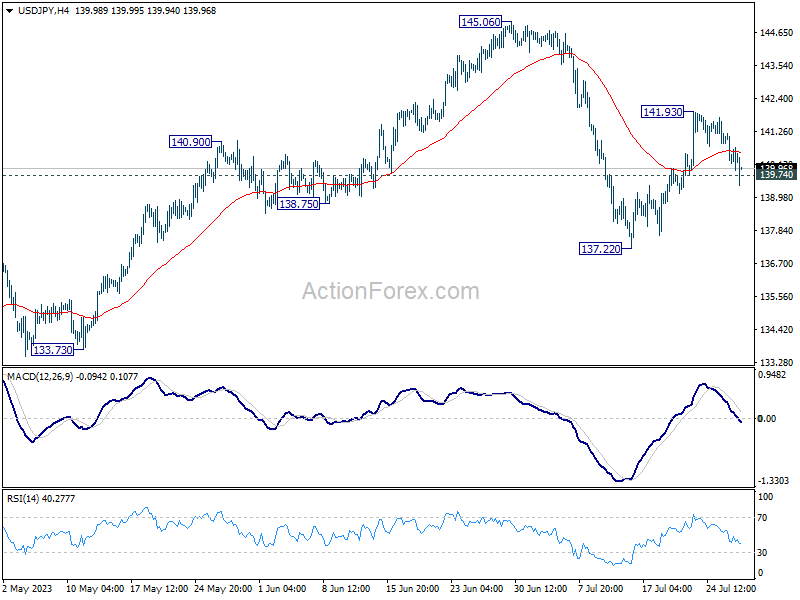
Talking about Yen, the breach of 139.74 minor support in USD/JPY argues that recovery from 137.22 might have completed at 141.93 already. More importantly, fall from 145.06 is probably not over yet. Risk will now stay mildly on the downside as long as 141.93 resistance holds, for retesting 137.22 support next.
In Asia, at the time of writing, Nikkei up 0.64%. Hong Kong HSI is up 1.36%. China Shanghai SSE is up 0.44%. Singapore Strait Times is up 0.66%. Japan 10-year JGB yield is up 0.0040 at 0.452. Overnight, DOW rose 0.23%. S&P 500 dropped -0.02%. NASDAQ dropped -0.12%. 10-year yield dropped -0.0061 to 3.851.
Fed Powell keeps Sep hike open, S&P 500 continues to lose upside momentum
US equities ended mixed in Wednesday's session, following Fed's expected rate increase by 25 bps to 5.25-5.50%. Despite the major policy decision, market volatility was surprisingly restrained throughout the trading session. Fed Chair Jerome Powell indicated that another rate hike could be on the table for September, while steering clear of predicting when a rate cut might transpire, pointing to the prevailing high economic uncertainty.
Current market expectations for additional rate hikes this year stand at 22% for September, 33% for November, and 30% for December. The likelihood of a rate cut commencing as early as March next year is considered to be 55.8%.
Powell, in the post-meeting press conference, stated, "It is certainly possible we would raise the funds rate at the September meeting if the data warranted, and I would also say it's possible that we would choose to hold steady at that meeting". He emphasized that Fed's monetary policy decisions will continue to be formulated on a meeting-by-meeting basis, largely dependent on economic data and indicators.
When discussing potential rate cuts, Powell asserted, "We'd be comfortable cutting rates when we're comfortable cutting rates," suggesting that a cut could take place next year if inflation hovers consistently near the Fed's target. However, he stressed that this scenario remains a considerable 'if,' given the considerable uncertainty surrounding future economic developments and subsequent policy meetings.
More on FOMC
- FOMC to Assess Policy One Meeting at a Time
- Fed Review: Balancing Act With Focus on Data
- FOMC Goes for a Summer Hike
- FOMC Hikes Again, Signals More May Be Needed
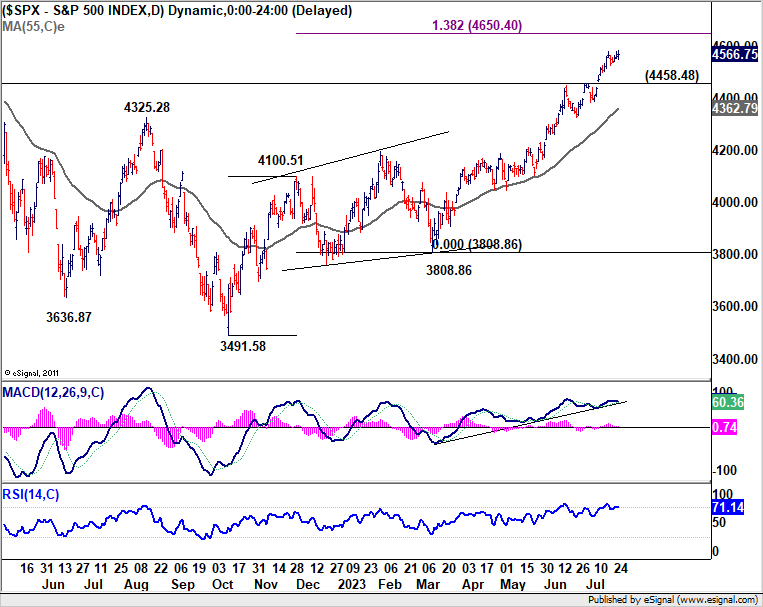
S&P 500 closed down slightly by -0.02% overnight. The index continued to lose upside momentum as seen in D MACD. While further rise cannot be ruled out, upside would likely be limited by 138.2% projection of 3491.58 to 4100.51 from 3808.86 at 4650.40. Meanwhile, break of 4458.48 resistance turned support will confirm that a correction is at least underway, and target 55 D EMA (now at 4362.79) and below.
Australia export price down -8.5% qoq in Q2, largest fall since 2009
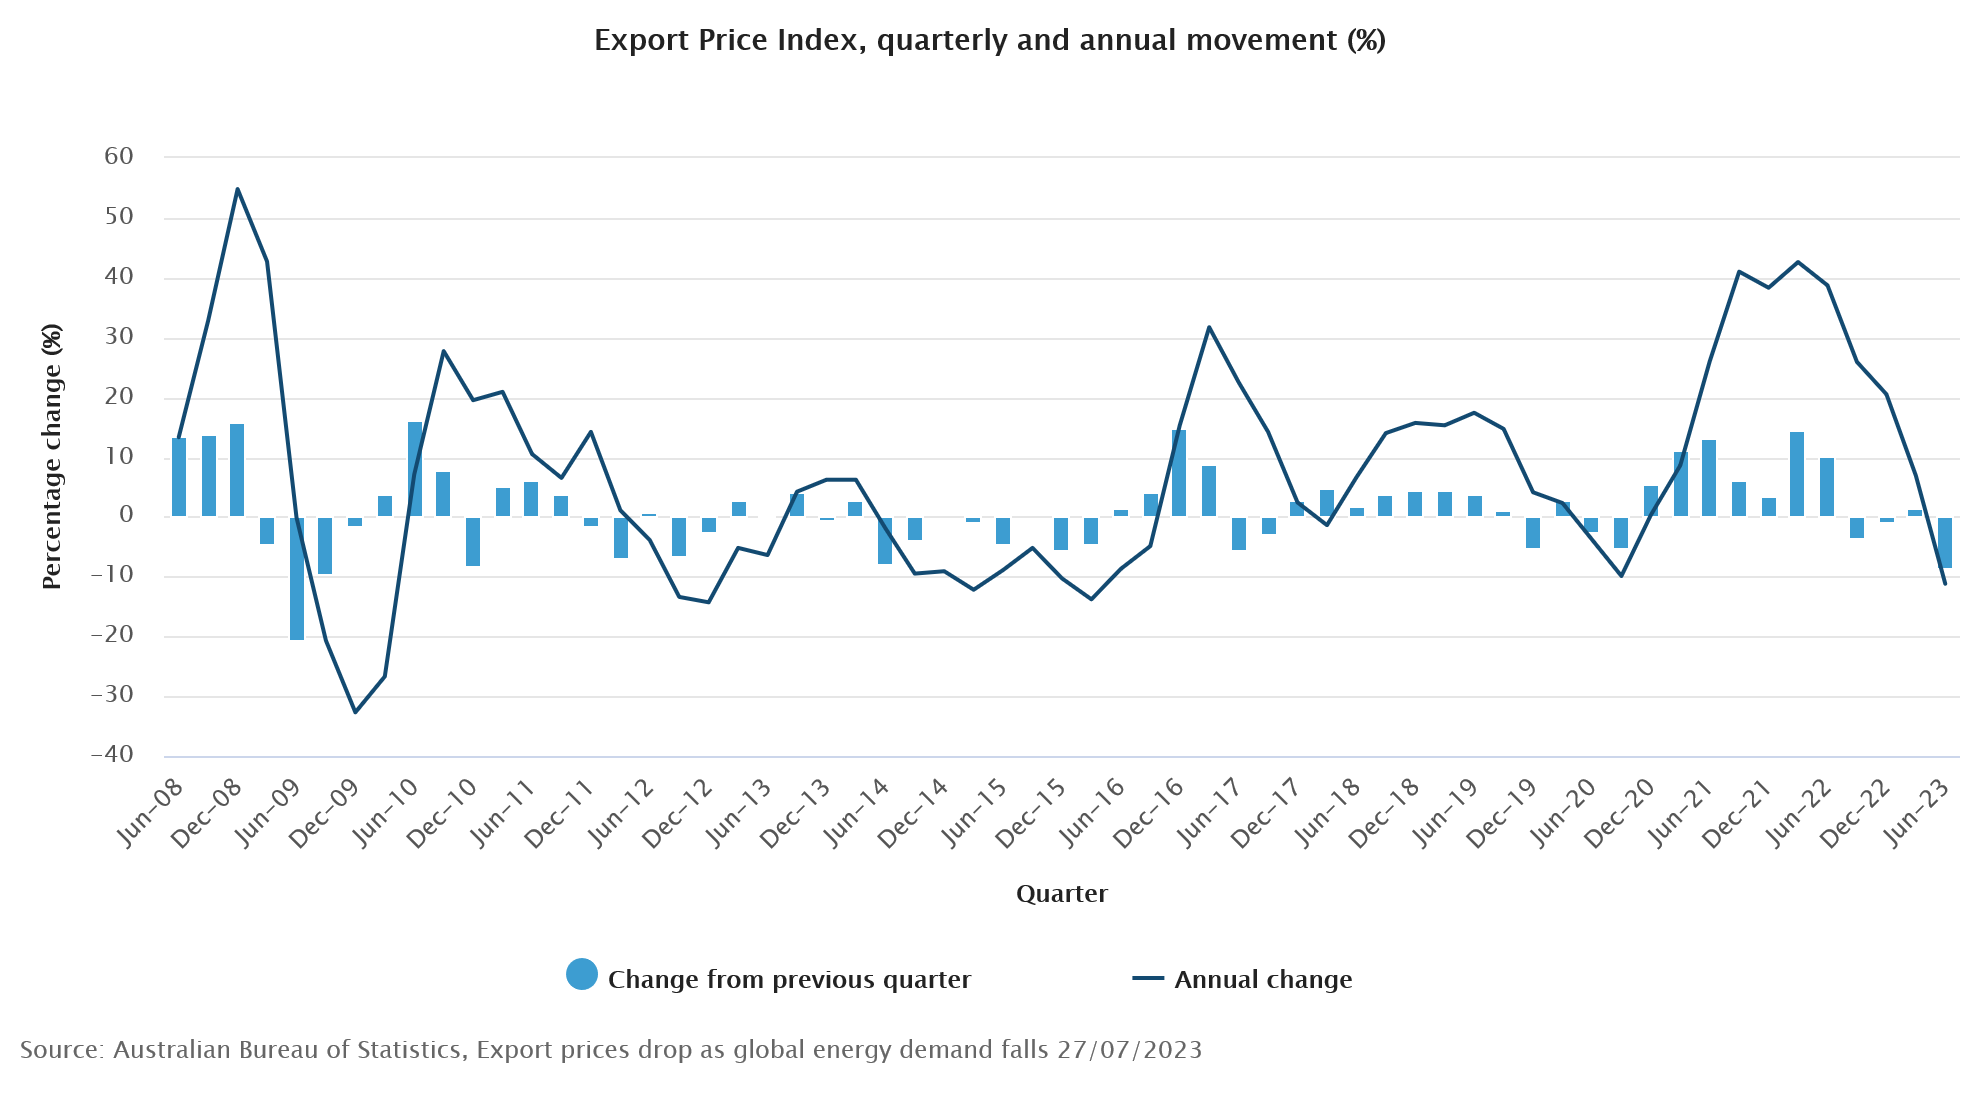
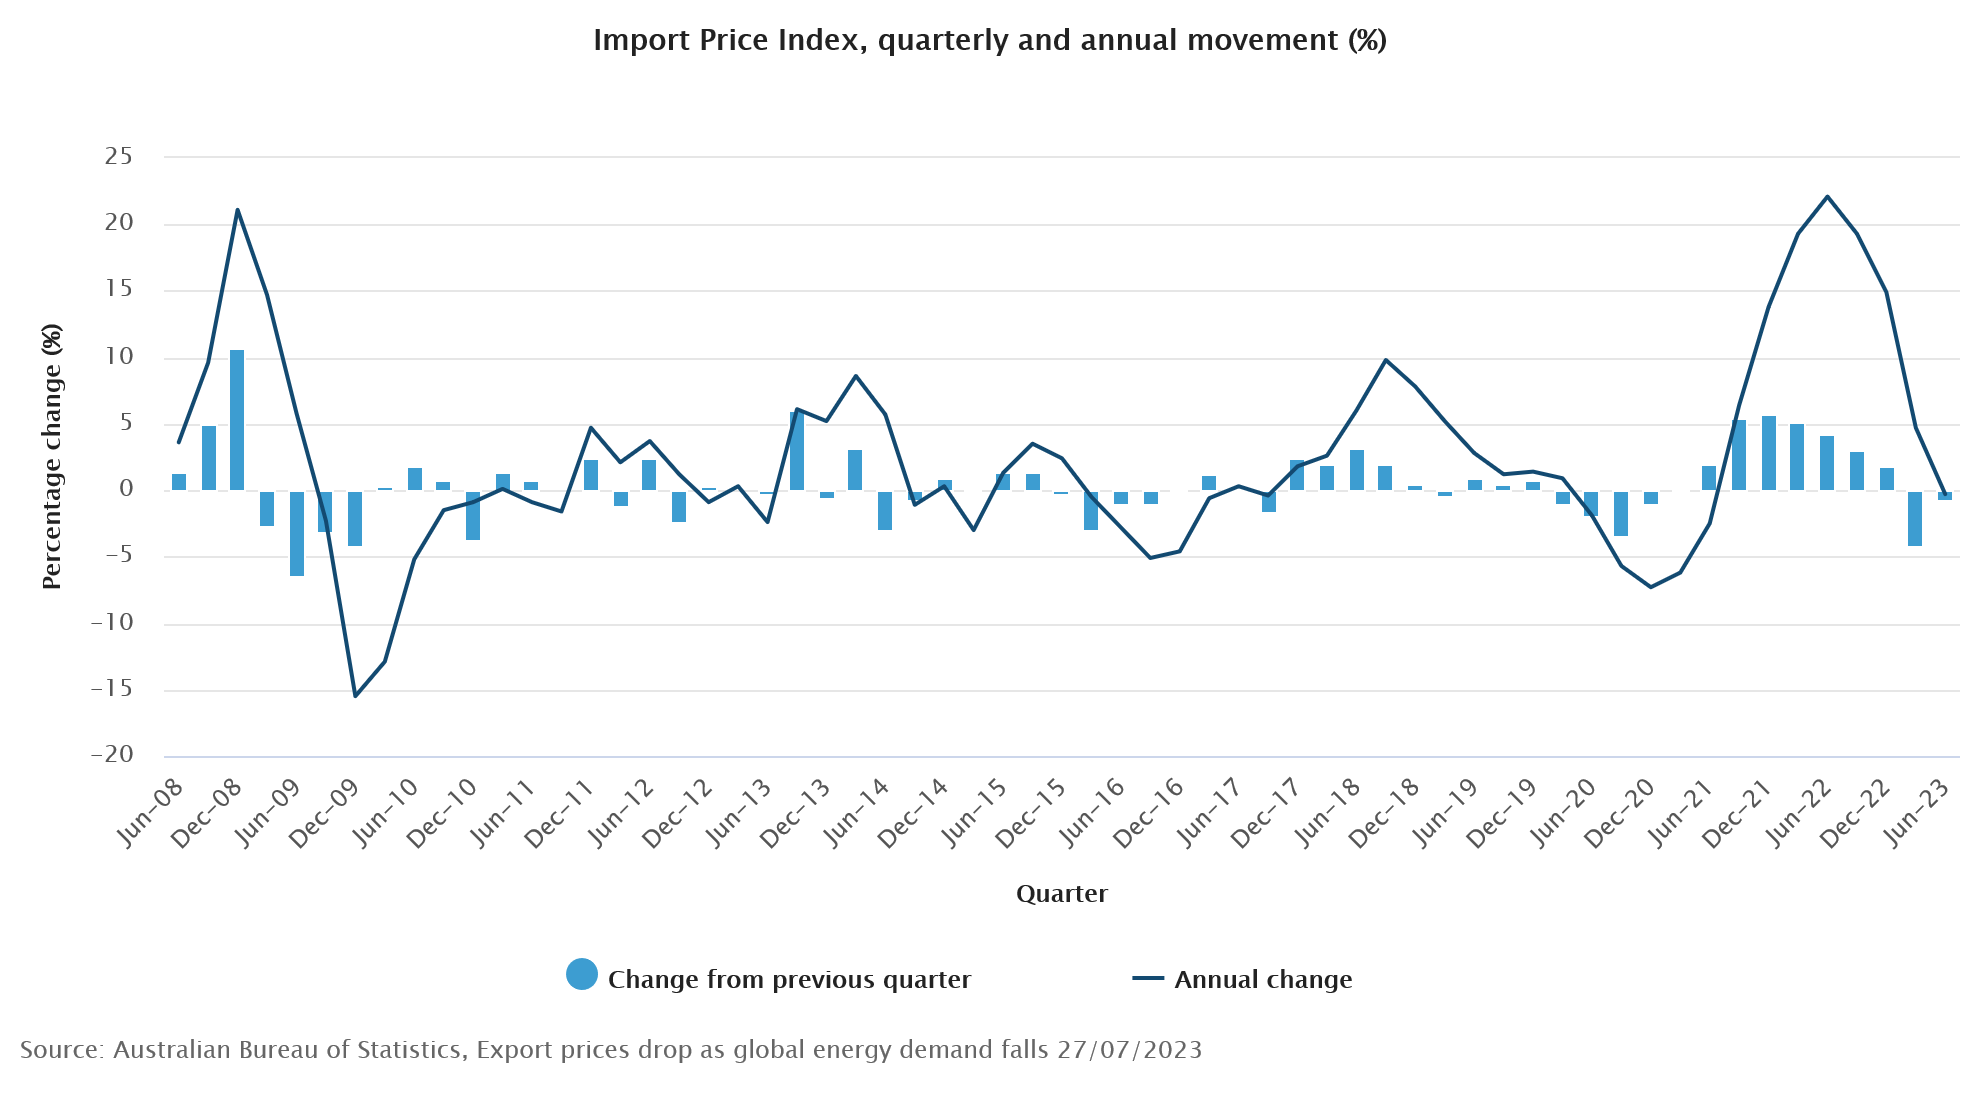
Australia's Q2 Export Price Index registered -8.5% qoq drop, the most substantial quarterly decline since Q3 2009. Concurrently, the index declined -11.2% yoy compared to the same quarter last year. On the flip side, Import Price Index dipped slightly by -0.8% qoq, - 0.3% yoy.
Michelle Marquardt, Head of Price Statistics at Australian Bureau of Statistics (ABS), attributed this steep fall in the Export Price Index to a substantial contraction in global energy demand. "Global economic slowdown and eased supply pressures are contributing to a retreat in energy prices from their 2022 peak," said Marquardt.
The dampening effect of weaker energy prices extended to the Import Price Index, which saw a decline of -0.8% in Q2 2023. More specifically, the prices of petroleum and petroleum products decreased by -7.0% in this quarter. Nevertheless, this decline in energy prices was somewhat counterbalanced by inflationary pressures on various imported consumption and capital goods.
ECB to hike another 25bps, EUR/CHF accelerating downwards
ECB is widely expected to raise interest rates for the ninth time in a row today. The main refinancing rate will be lifted by 25bps to 4.25%. Deposit rate, once negative will be raised by 25bps to 3.50%. The question remains on what the central bank would do next, and whether there would be further tightening in September. But it's unlikely for President Christine Lagarde to provide any concrete answer, other likely pointing to incoming data and the new economic projections to be prepared before next decision.
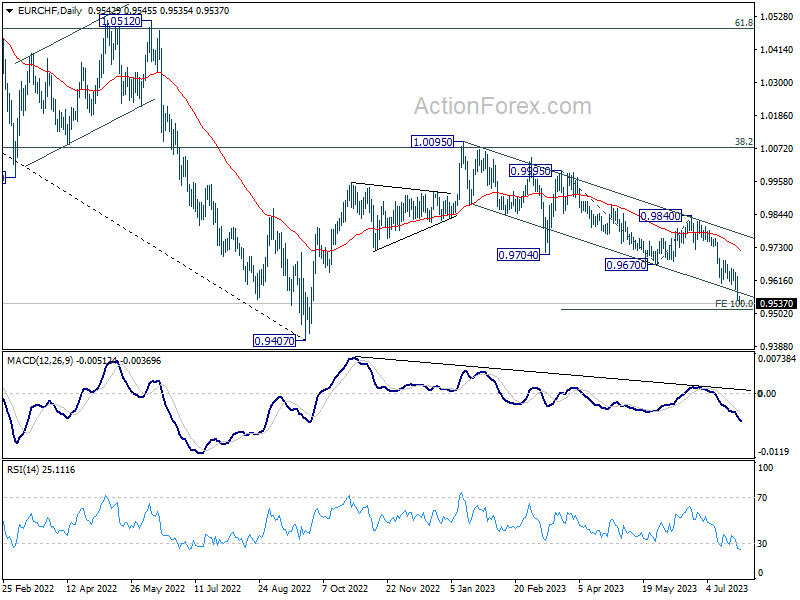
EUR/CHF's decline from 1.0095 is showing sign of downside acceleration this week, by breaking through near term falling channel support, and as displayed in D MACD too. Next target is 100% projection of 0.9995 to 0.9670 from 0.9840 at 0.9515. Sustained break there will put 0.9407 (2022 low) in focus. Regardless of any recovery, outlook will remain bearish as long as 0.9670 support turned resistance holds.
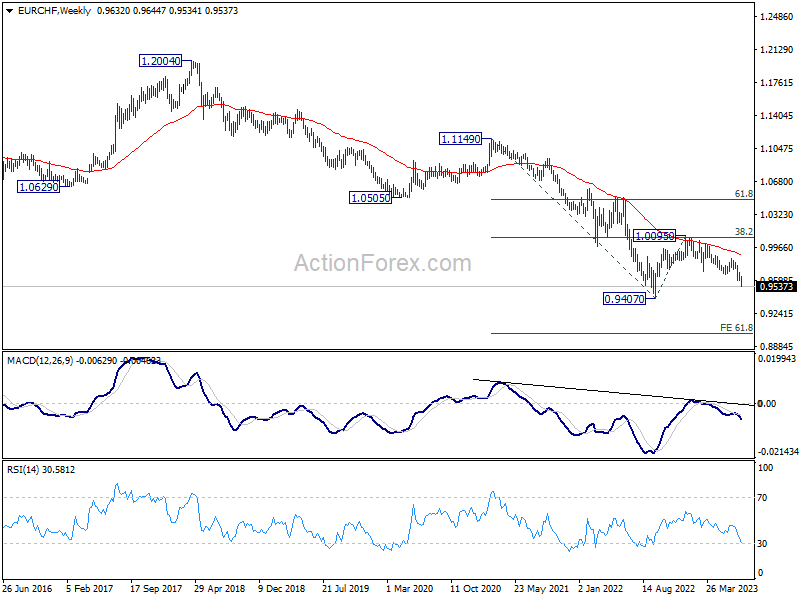
Meanwhile, it should also be noted that prior rejection by 55 W EMA keeps medium term outlook in EUR/CHF bearish. That is, the down trend from 1.2004 (2018 high) is in favor to continue. Firm break of 0.9407 would set the stage for 61.8% projection of 1.1149 to 0.9407 from 1.0095 at 0.9018 in the medium term. The unfolding of this bearish scenario would depend significantly on the evolution of increasing recession risks in the latter half of the year and the impact on timing of the first ECB rate cut.
Looking ahead
Germany Gfk consumer sentiment will also be released in European session, in addition to ECB rate decision. Later in the day, US will release Q12 GDP, durable goods orders, jobless claims, and pending home sales.
AUD/USD Daily Report
Daily Pivots: (S1) 0.6729; (P) 0.6761; (R1) 0.6792; More...
AUD/USD's rebound from 0.6714 extends higher today but stays below 0.6845 minor resistance. Intraday bias remains neutral at this point. On the upside, above 0.6845 will bring retest of 0.6898 resistance. Decisive break there will resume rise from 0.6457. On the downside below 0.6714 will resume the fall from 0.6894, as the third leg of the corrective pattern from 0.6898. But downside should be contained above 0.6594 support to bring rebound.
In the bigger picture, price actions from 0.7156 are seen as a correction to the rebound from 0.6169 (2022 low). Break of 0.6898 resistance will argue that rise from 0.6169 is ready to resume through 0.7156. Next target will be 100% projection of 0.6169 to 0.7156 from 0.6457 at 0.7444. For now, this will be the favored case as long as 55 D EMA (now at 0.6715) holds.
Economic Indicators Update
| GMT | Ccy | Events | Actual | Forecast | Previous | Revised |
|---|---|---|---|---|---|---|
| 01:30 | AUD | Import Price Index Q/Q Q2 | -0.80% | -0.80% | -4.20% | |
| 06:00 | EUR | Germany Gfk Consumer Confidence Aug | -24.7 | -25.4 | ||
| 12:15 | EUR | ECB Main Refinancing Rate | 4.25% | 4.00% | ||
| 12:15 | EUR | ECB Rate On Deposit Facility | 3.75% | 3.50% | ||
| 12:30 | USD | Initial Jobless Claims (Jul 21) | 233K | 228K | ||
| 12:30 | USD | GDP Annualized Q2 P | 1.60% | 2.00% | ||
| 12:30 | USD | GDP Price Index Q2 P | 3.10% | 4.10% | ||
| 12:30 | USD | Goods Trade Balance (SUD) Jun P | -91.8B | -91.1B | ||
| 12:30 | USD | Wholesale Inventories Jun P | -0.10% | 0% | ||
| 12:30 | USD | Durable Goods Orders Jun | 1.00% | 1.80% | ||
| 12:30 | USD | Durable Goods Orders ex Transportation Jun | 0.10% | 0.70% | ||
| 12:45 | EUR | ECB Press Conference | ||||
| 14:00 | USD | Pending Home Sales M/M Jun | -0.50% | -2.70% | ||
| 14:30 | USD | Natural Gas Storage | 12B | 41B |
ECB to hike another 25bps, EUR/CHF accelerating downwards
ECB is widely expected to raise interest rates for the ninth time in a row today. The main refinancing rate will be lifted by 25bps to 4.25%. Deposit rate, once negative will be raised by 25bps to 3.50%. The question remains on what the central bank would do next, and whether there would be further tightening in September. But it's unlikely for President Christine Lagarde to provide any concrete answer, other likely pointing to incoming data and the new economic projections to be prepared before next decision.
EUR/CHF's decline from 1.0095 is showing sign of downside acceleration this week, by breaking through near term falling channel support, and as displayed in D MACD too. Next target is 100% projection of 0.9995 to 0.9670 from 0.9840 at 0.9515. Sustained break there will put 0.9407 (2022 low) in focus. Regardless of any recovery, outlook will remain bearish as long as 0.9670 support turned resistance holds.
Meanwhile, it should also be noted that prior rejection by 55 W EMA keeps medium term outlook in EUR/CHF bearish. That is, the down trend from 1.2004 (2018 high) is in favor to continue. Firm break of 0.9407 would set the stage for 61.8% projection of 1.1149 to 0.9407 from 1.0095 at 0.9018 in the medium term. The unfolding of this bearish scenario would depend significantly on the evolution of increasing recession risks in the latter half of the year and the impact on timing of the first ECB rate cut.
Australia export price down -8.5% qoq in Q2, largest fall since 2009
Australia's Q2 Export Price Index registered -8.5% qoq drop, the most substantial quarterly decline since Q3 2009. Concurrently, the index declined -11.2% yoy compared to the same quarter last year. On the flip side, Import Price Index dipped slightly by -0.8% qoq, - 0.3% yoy.
Michelle Marquardt, Head of Price Statistics at Australian Bureau of Statistics (ABS), attributed this steep fall in the Export Price Index to a substantial contraction in global energy demand. "Global economic slowdown and eased supply pressures are contributing to a retreat in energy prices from their 2022 peak," said Marquardt.
The dampening effect of weaker energy prices extended to the Import Price Index, which saw a decline of -0.8% in Q2 2023. More specifically, the prices of petroleum and petroleum products decreased by -7.0% in this quarter. Nevertheless, this decline in energy prices was somewhat counterbalanced by inflationary pressures on various imported consumption and capital goods.
Full Australia international trade price indexes release here.