

Sample Category Title
USD/JPY Could Gain Bullish Momentum Above 141.20
Key Highlights
- USD/JPY is recovering higher from the 137.25 zone.
- It is facing many hurdles near 141.20 on the 4-hour chart.
- EUR/USD started a downside correction below 1.1200.
- GBP/USD extended its decline toward the 1.2840 support.
USD/JPY Technical Analysis
The US Dollar declined heavily below the 141.20 support zone against the Japanese Yen. USD/JPY even traded below 139.00 before the bulls appeared.
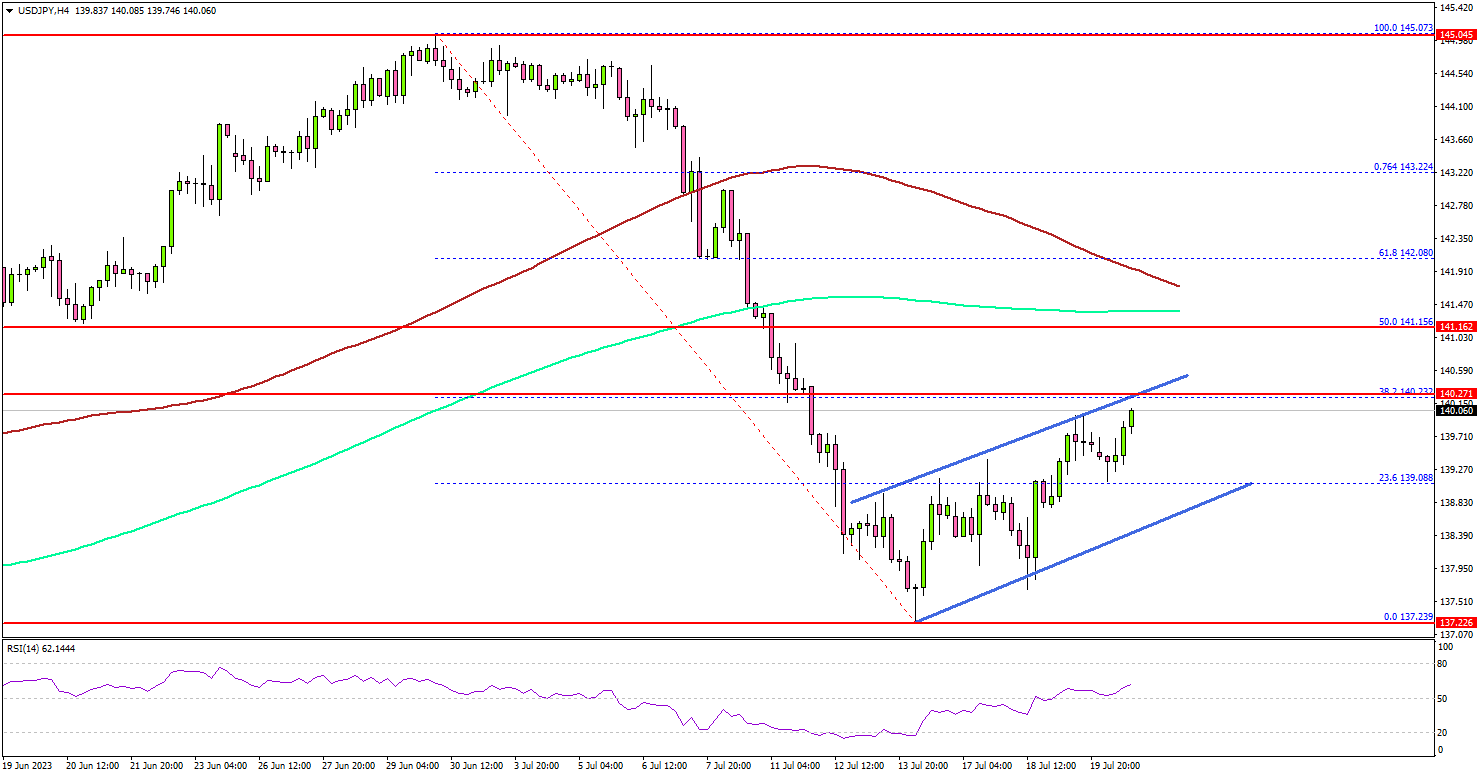
Looking at the 4-hour chart, the pair tested the 137.25 zone. A low was formed near 137.23 and the pair is now recovering higher. There was a move above the 139.00 resistance.
The pair climbed above the 23.6% Fib retracement level of the downward move from the 145.07 swing high to the 137.23 low. It is now facing resistance near the 141.20 level and the 200 simple moving average (green, 4 hours).
The next resistance is near the 100 simple moving average (red, 4 hours) or the 61.8% Fib retracement level of the downward move from the 145.07 swing high to the 137.23 low.
Any more gains might send the pair toward the 145.00 resistance zone in the near term. Immediate support is near the 139.00 level. There is also a rising channel forming with support at 139.00.
The next major support is seen near the 138.50 level, below which there could be a drop to 137.25. Any more losses might send the pair toward the 136.50 support zone.
Looking at EUR/USD, the pair failed to start a fresh increase and recently started a downside correction below the 1.1200 support.
Economic Releases
- UK Retail Sales for June 2023 (YoY) - Forecast -1.5%, versus -2.1% previous.
- UK Retail Sales for June 2023 (MoM) - Forecast +0.2%, versus +0.3% previous.
USD/JPY Technical: Potential Continuation of the Bearish Trend
- The +326 pips rebound seen in the USD/JPY from the 14 July 2023 low of 137.24 has reached a minor key inflection point.
- Short-term momentum (hourly RSI) has turned bearish.
- 60 is the key short-term resistance to watch.
The USD/JPY has staged the expected corrective rebound after a test on the 200-day moving average and hit the 139.70/140.10 resistance zone as highlighted in our previous report. It printed an intraday high of 140.50 during yesterday, 20 July US session.
Japan’s nationwide inflation for June came in within expectation
Considering today’s Asian morning release of Japan’s nationwide inflation data for June that came in within expectation, remained sticky, and elevated at a 32-year high, the USD/JPY has ticked down by -75 pips from yesterday’s US session high to today’s Asian session current intraday low of 139.75 at this time of the writing.
Japan’s core inflation (excluding fresh food) came in at 3.30% year-on-year, above May’s reading of 3.20%. Core-core inflation (excluding fresh food & energy) rose to 4.2% year-on-year, slightly below the 4.3% recorded in May.
From a technical analysis standpoint, the +326 pips rebound from the 137.24 swing low of 14 July 2023 has started to show signs of bullish exhaustion which indicates a potential continuation of its short-term downtrend phase from 30 June 2023 high of 145.07.
Short-term momentum has turned bearish
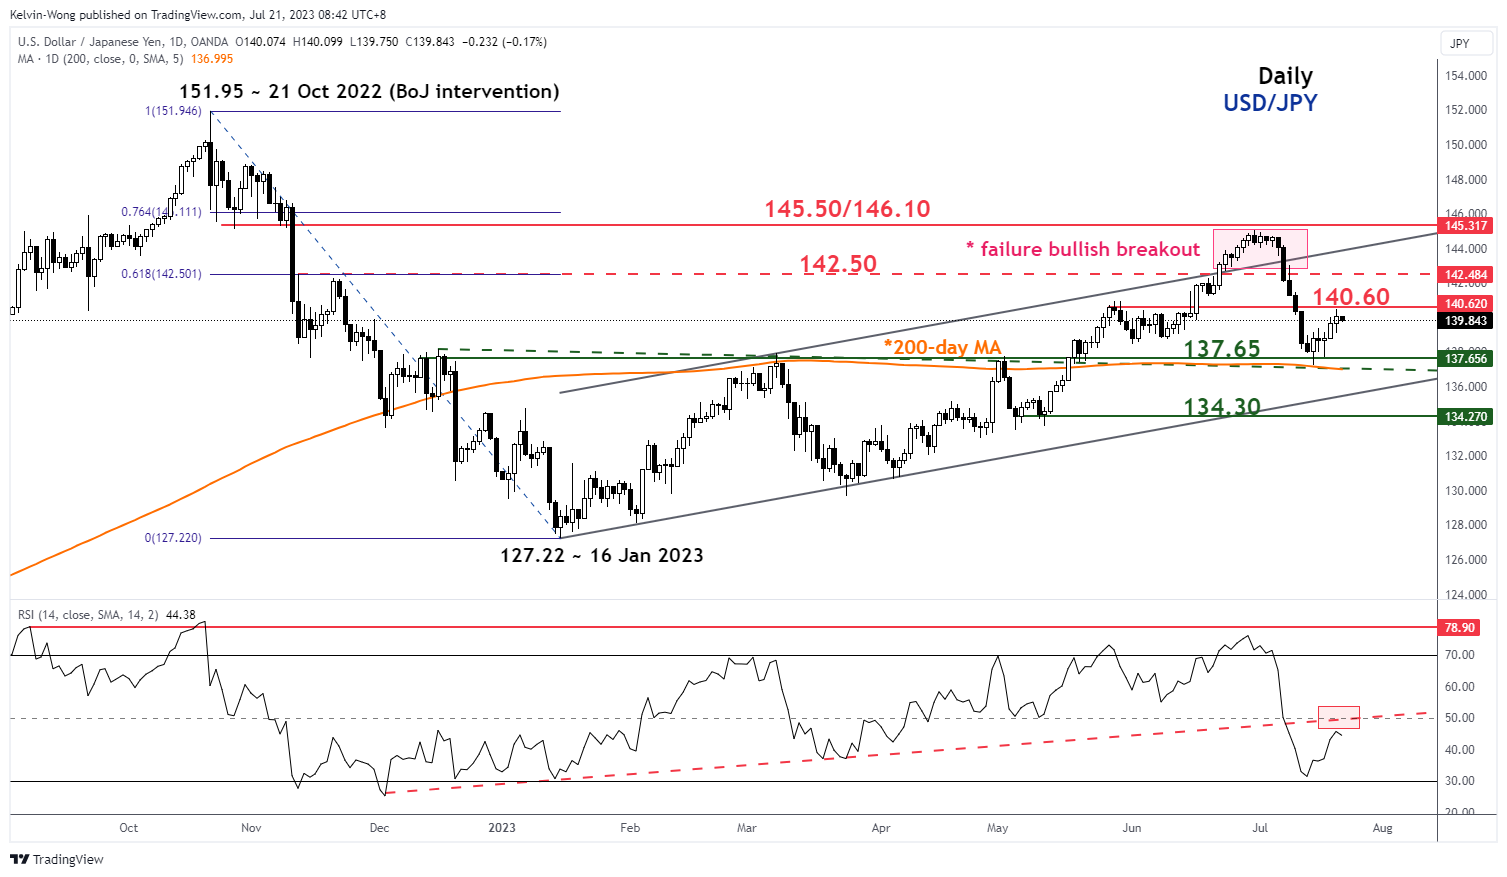
Fig 1: USD/JPY medium-term trend as of 21 Jul 2023 (Source: TradingView, click to enlarge chart)
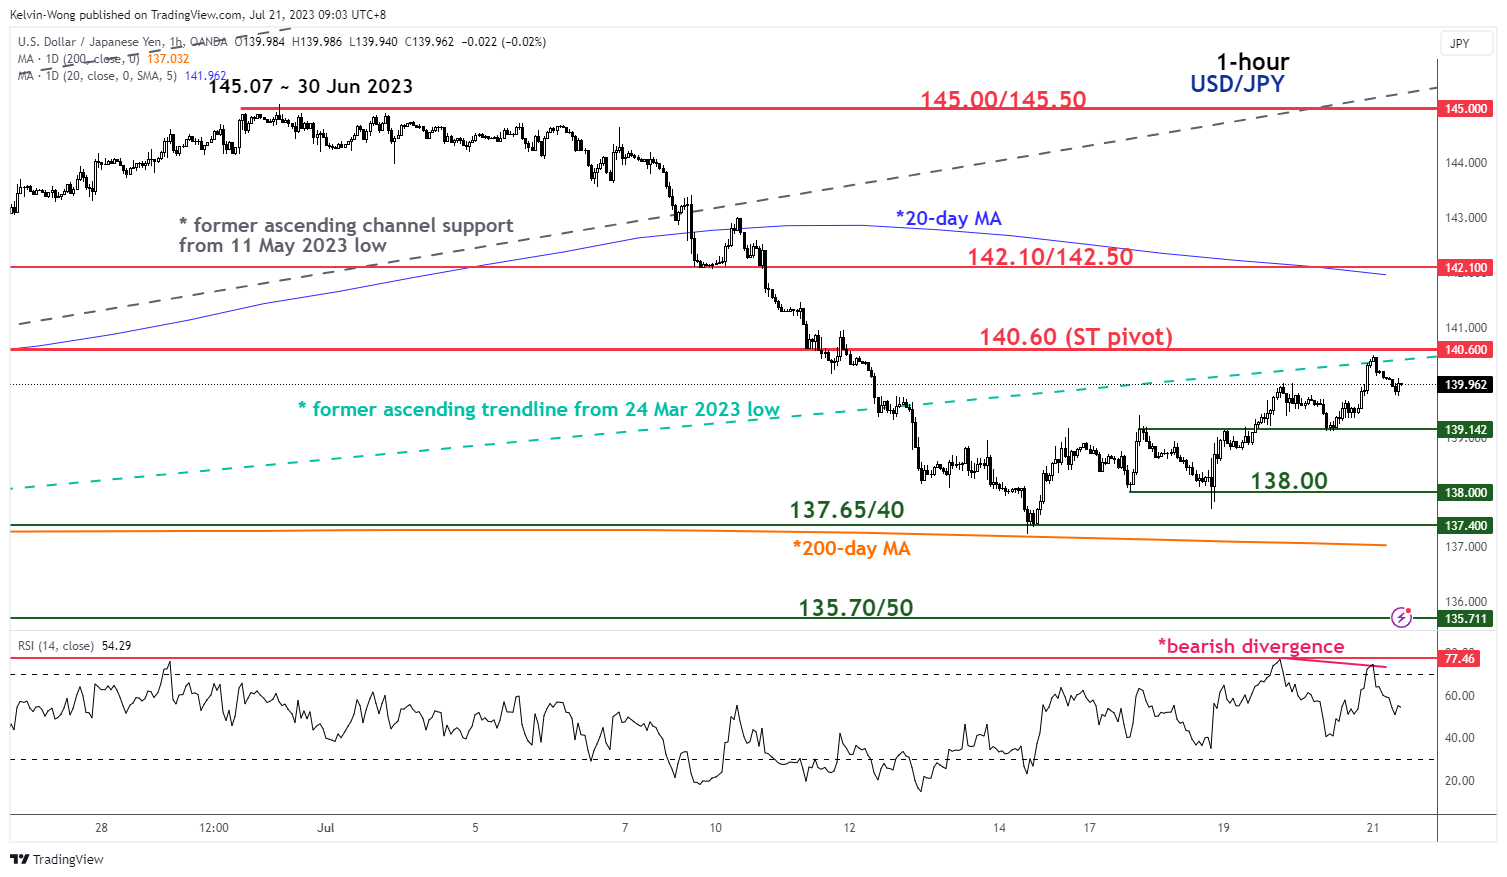
Fig 2: USD/JPY minor short-term trend as of 21 Jul 2023 (Source: TradingView, click to enlarge chart)
The hourly RSI oscillator has flashed a bearish divergence signal at its overbought region which indicates the minor up move from the 14 July 2023 low to 21 July 2023 high has started to lose upside momentum.
This negative observation in momentum occurred when the price actions of USD/JPY retested its former medium-term ascending trendline support from the 24 March 2023 low during yesterday’s 20 July US session (see 1-hour chart).
Watch the 140.60 short-term pivotal resistance and a break below 139.15 exposes the next near-term supports of 138.00, and 137.65/40 in the first step.
On the other hand, a clearance above 140.60 negates the bearish tone to see the key medium-term resistance zone of 142.10/50 (20-day moving average & the 61.8% Fibonacci retracement of the prior down move from the 30 June 2023 high to 14 July 2023 low).
Natural Gas Wave Analysis
- Natural gas rising inside sideways price range
- Likely to rise to resistance level 2.915
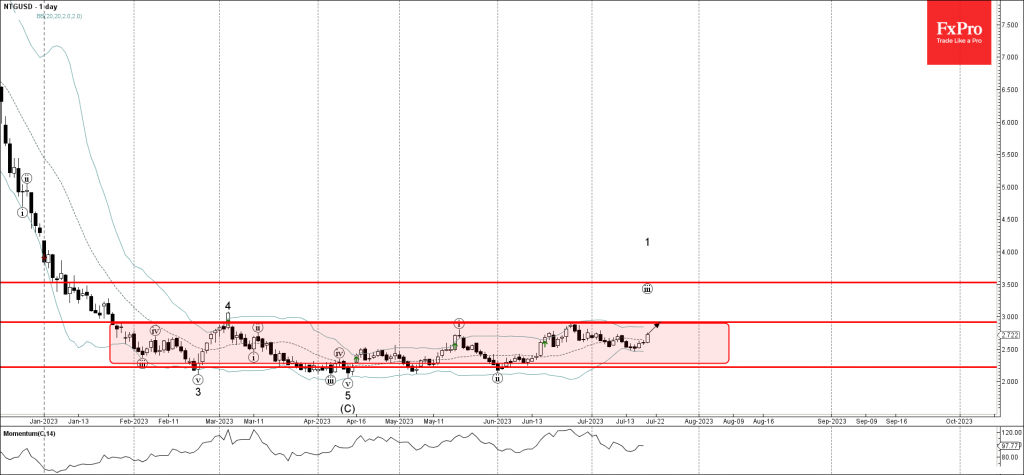
Natural gas continues to rise inside the narrow extended sideways price range from the start of this year (enclosed by the price levels 2.224 and 2.915).
The price earlier reversed up from the support level 2.500 continuing the active impulse waves iii and 1.
Given approaching end of summer and the strength of the lower boundary of this price range, 2.224, Natural gas can be expected to soon test the upper border of this price range, 2.915.
GBPCHF Wave Analysis
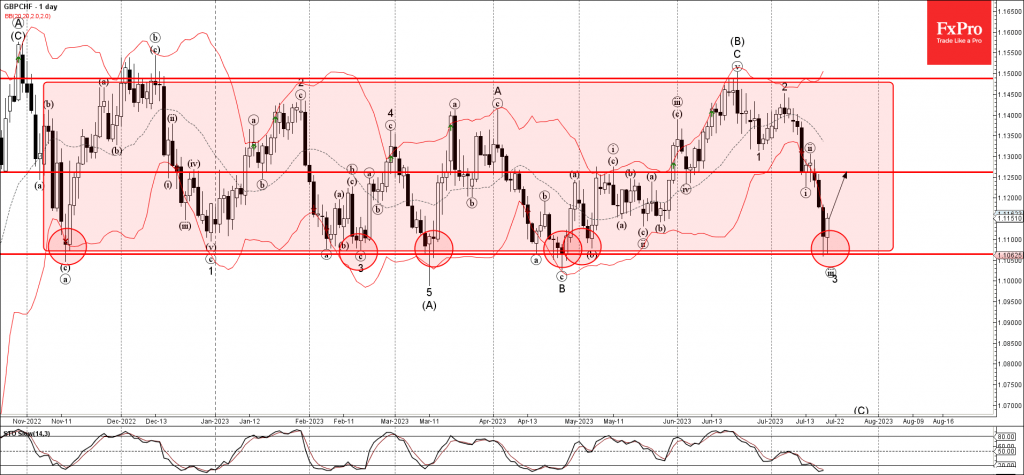
- GBPCHF reversed from support level 1.1065
- Likely to rise to resistance level 1.1250
GBPCHF currency pair previously reversed up from the major support level 1.1065, lower boundary of the sideways price range from November, strengthened by the lower daily Bollinger Band.
The upward reversal from the support level 1.1065 stopped the previous impulse waves iii and 3.
Given the strength of the support level 1.1065 and the oversold daily Stochastic, GBPCHF currency pair can be expected to rise further toward the next resistance level 1.1250.
Fed Preview: July Marks the End of the Hiking Cycle
- We expect the Fed to hike interest rates for the final time by 25bp in the next week's meeting, and then go on hold.
- While economic activity has still held up well, easing underlying inflation and declining inflation expectations limit the need for further rate hikes.
- We expect the immediate market reaction to be muted, with risks skewed towards a hawkish reaction, if Powell still maintains the door open for another hike. We see 10y UST yield at 3.50% and EUR/USD at 1.06 by the end of the year.
A 25bp hike in the next week's meeting is largely 'a done deal', as market pricing for the meeting has remained remarkably stable through the recent data releases. The focus will be on forward guidance for the remainder of the year, and whether the FOMC is still convinced it will hike the Fed Funds target rate all the way to 5.50-5.75%, as outlined in the June SEP.
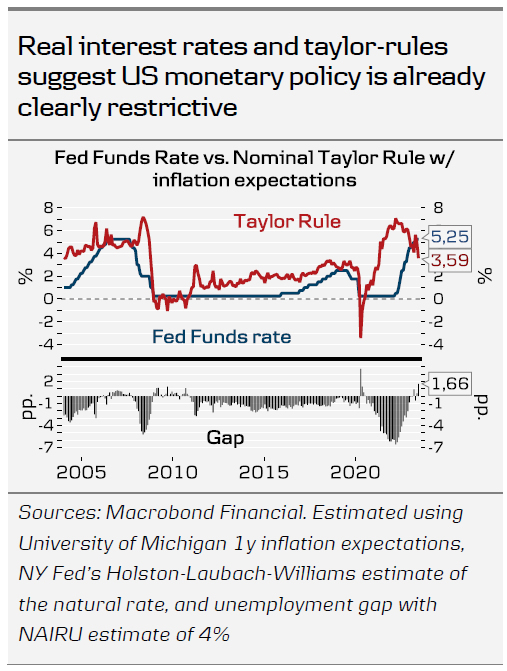
As we discussed two weeks ago in Research US - Rising real rates cast a shadow over upbeat macro data, 7 July, the combination of rising nominal policy rate and declining inflation expectations increases the risk of a harder landing down the line. Short real interest rates are at the highest levels since the GFC, and a simple taylor-rule with inflation expectations gives a similar sense of tight monetary policy stance.
That said, the latest leading economic data as well as this week's June retail sales suggest that activity is holding up relatively well. Excess savings from the pandemic have likely been soon depleted, which is evident in consumers having already started to increase their savings rates, but strong labour markets continue to support consumption nevertheless.
The situation can be seen in two ways. Either 1) the economy is headed for a true soft landing, where the disinflation seen today continues without a substantial drop in economic activity or that 2) subtly weakening demand, higher interest rates and real wage growth are squeezing companies' profit margins, paving way for layoffs going forward. In either scenario, we do not foresee a need for further policy rate hikes.
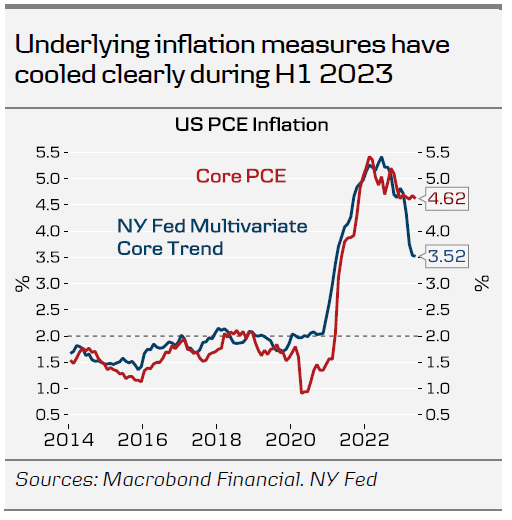
In this week's Global Inflation Watch, 18 July, we flagged that seasonally adjusted m/m changes in the underlying components of inflation suggests that price pressures have cooled substantially over the past few months. Similarly, measures such as NY Fed's Multivariate Core Trend PCE, which overweight the more stable components of the PCE price index, have recently cooled faster than the 'official' rate which the Fed targets.
But even so, Powell is unlikely to close the door for more hikes next week, as the Fed aims to maintain financial conditions restrictive as long as realized inflation remains elevated. Note that we will not get updated rate projections in this meeting.
We anticipate a muted market reaction as Powell reiterates the FOMC's data dependent approach, essentially kicking the can down the road. As markets only price in around 8bp for another hike beyond July, the risks could be skewed towards a hawkish reaction. We see 10Y UST yields declining to the 3.50% area by the end of the year, with concurrent steepening of the 2s10s curve, and expect EUR/USD to fall towards 1.06 level in 6M time.
As Dollar Fights Back, Can Flash PMIs Revive Euro and Pound Rally?
The flash PMI readings for July are due on Monday for the major economies. The highlights as usual will be for the euro area (08:00 GMT), the United Kingdom (08:30 GMT) and the United States (13:45 GMT). Economic growth has been losing steam in most parts of the world amid surging interest rates, but the pace of disinflation has been somewhat less synchronized. This has put the spotlight on monetary policy divergence as far as the FX market is concerned. Thus, how the euro, pound and US dollar react will vary on whether the data will magnify or lessen this divergence.
Teetering on the brink of recession
European economies have slowed sharply this year, as higher prices and borrowing costs have squeezed households’ purchasing power, while a weakening recovery in China has depressed demand for manufactured goods, particularly for German exporters. The services sector remains a bright spot, but even there, momentum is waning.
The good news is that inflation is also on the way down, with the Eurozone headline figure falling to 5.5% in June. This has raised hopes that the ECB doesn’t have that much to go with its rate hiking cycle and if there is a recession, it will be a mild one.
The composite PMI fell to 49.9 in June, indicating a slight contraction for the euro area. The UK’s composite PMI stood at a healthier 52.8 in June and it was even higher in the US at 53.2.
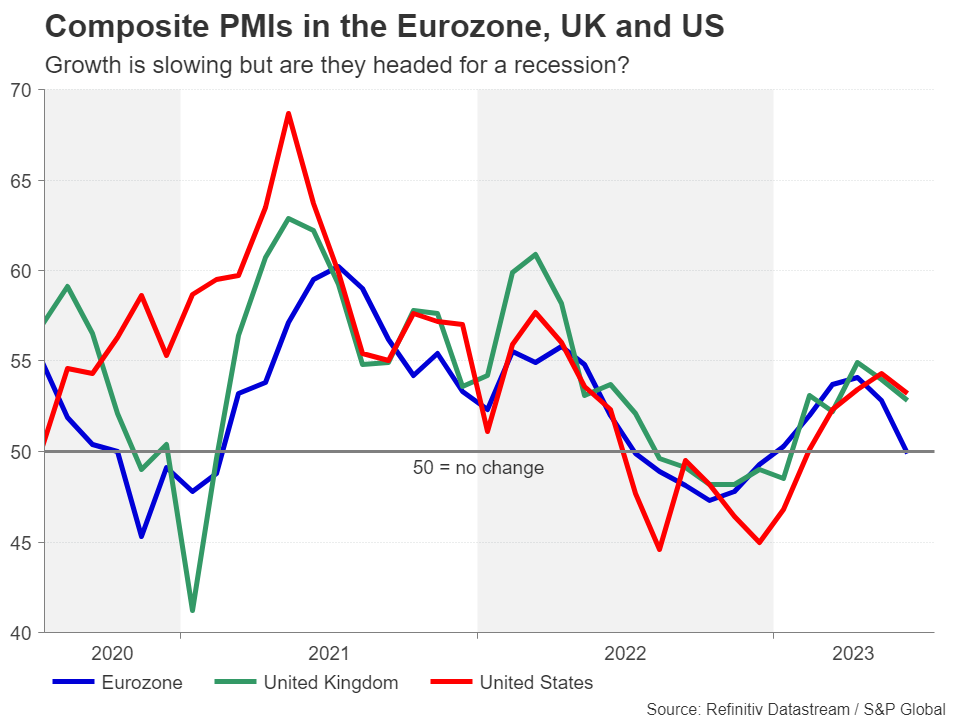
However, despite the disparity in the PMIs, actual GDP growth in the UK has been stagnating and not that much higher than the Eurozone’s in recent quarters. It’s only the US economy that’s growing at a respectable pace.
‘Higher for longer’ clouding the outlook
Nevertheless, the risk of a recession continues to hang over all the big economies as central banks are not quite fully done with rate increases, and perhaps more importantly, rates are set to stay elevated for some time. In such a macroeconomic backdrop, investors have to weigh economic prospects against the spreads in real interest rates, and this is where it gets complicated for the dollar outlook.
The Eurozone economy seems the most vulnerable to rising interest rates but if inflation continues to decline rapidly, then the ECB could potentially pause after just additional hike. The British economy has so far defied dire predictions but unless inflation drops more substantially in the coming months, there is a strong possibility that the Bank of England will have to hike rates to at least 6.0%, making it the highest in the developed world and exacerbating the economic pain.
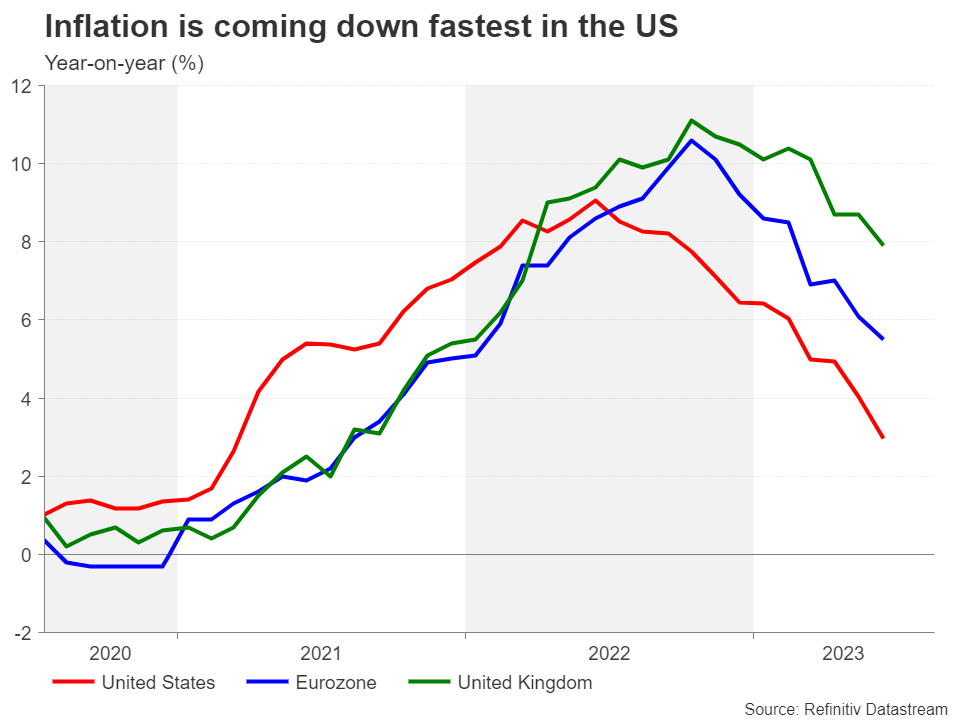
America, meanwhile, is enjoying the best of both worlds – it currently has the lowest inflation and it is the furthest away from a broad-based downturn.
Upbeat PMIs may be a mixed blessing
So where does this leave the euro and pound against the mighty greenback? If the flash PMIs point to a slight pickup in European and UK business activity in the first half of July, this would probably be a mixed blessing for the two currencies.
The more resilient the economy, the more likely that policymakers will feel confident to keep playing it safe and raise rates until CPI is on a sure path to 2%. But with both economies so fragile, rates are already very close to the tipping point of a recession.
In the US, there is less of a question about how much higher rates will go and it’s more about how many times the Fed will cut rates in 2024. Investors seem certain that once core inflation dips below the 2% target, rate cuts will follow. But in reality, when the labour market is so tight at this late stage of the business cycle, that is a testament to the underlying dynamism and the Fed will not want to risk allowing the economy to overheat again by cutting rates too early.
Can the dollar extend its recovery?
However, it may be a while yet before traders are forced to rethink their rate cut predictions and in the immediate term, the dollar could face renewed selling pressure if Monday’s PMIs lift some of the gloom for the euro and pound and at the same time, point to weaker growth in the US.
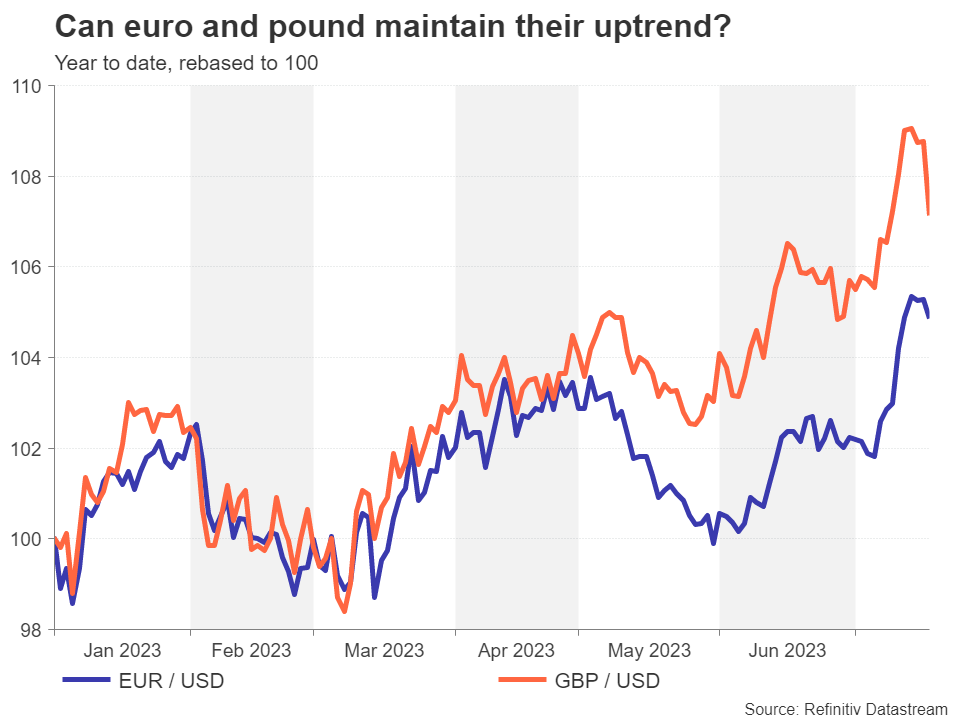
There are considerable downside risks too for the euro and pound as the past week has shown. With the recent rally potentially built on the misguided expectations that the ECB and BoE will remain hawkish well after the Fed has pivoted, their pullback could accelerate if European and UK PMIs continue to edge lower.
Dollar Index: Bulls Gain Traction But Recovery Likely to be Limited
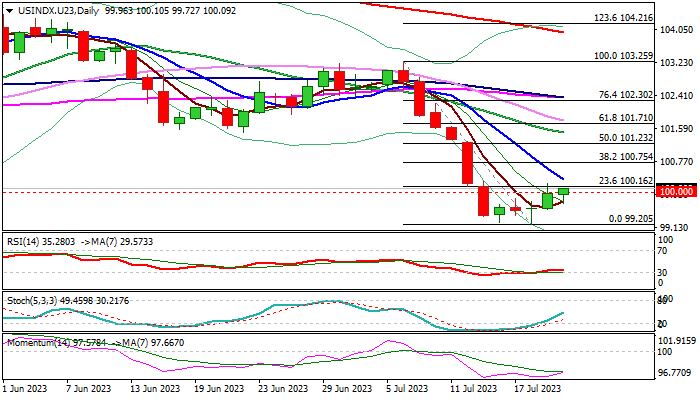
The dollar index keeps firm tone and pushing through psychological 100 barrier again, after Wednesday’s spike higher failed to register close above this level.
Recovery from 2.9% drop in past two weeks (which accelerated on cooler-than-expected US inflation data and added to expectations that the Fed may end its tightening cycle soon) gained traction on Wednesday, after holding within narrow consolidation, shaped in a triple-Doji.
Fresh strength faces minimum requirement on break through 100.00/33 zone (psychological / falling 10DMA) to generate initial reversal signal, which will look for verification on lift through 100.75 (Fibo 38.2% of 103.25/99.20 bear-leg).
On the other hand, optimism is likely to be limited, as dollar remains weighed by improving US rate outlook and fading possibilities that the economy may enter recession that prompts investors into riskier assets.
Overall bearish daily studies (strong negative momentum and MA’s in bearish configuration) support scenario of limited correction (ideally to be capped under 103.75 Fibo barrier) ahead of fresh push lower and attack at pivotal Fibo support at 98.92 (61.8% retracement of 89.15/114.72 2021/2022 uptrend).
Res: 100.33; 100.45; 100.75; 101.23.
Sup: 99.77; 99.20; 98.92; 97.72.
Broad Growth of the Crypto Market
Market picture
Crypto market capitalisation reached 1.218 trillion, up 1.1% in the last 24 hours. Altcoins are growing across the board. Although the momentum is far from euphoric, it is more like interest in the market. And this is particularly attractive as equity indices have lost ground over the past 24 hours.
The big question in the short term is whether we’re seeing a reallocation of interest towards the riskier part (crypto vs stocks) or a delayed reaction (Nasdaq hit highs since January 2022 on Wednesday).
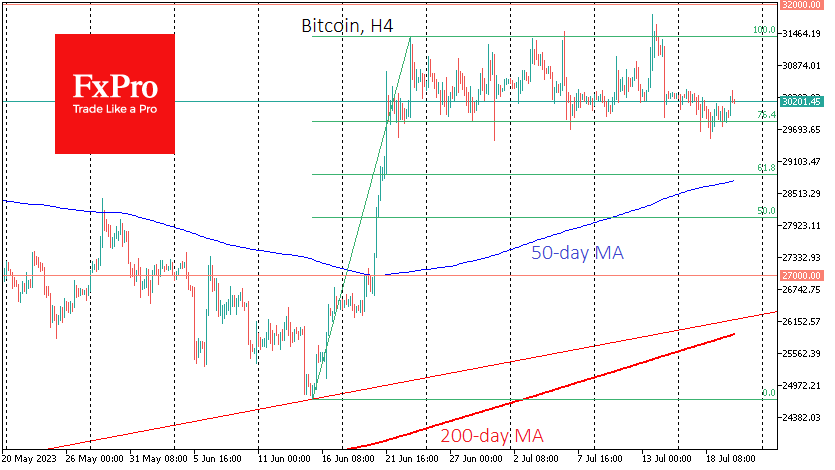
Bitcoin continued to find support on Wednesday on dips below $30K, returning to the range of the last four weeks. A move to the upper boundary at $31.3K is most likely in this environment. At the same time, medium-term traders should pay more attention to the price dynamics at the boundaries of the range between $29.8 and $31.3 an ounce. A break above these boundaries will greatly increase the chances of a continuation in the breakout direction.
News background
The main sellers of BTC in recent days have been short-term investors, Glassnode notes. They have been preparing to take profits for several weeks. Long-term investors who have held the cryptocurrency for more than 12 months are in no hurry to join the sellers.
At the end of June, miners sent a record $128 million worth of bitcoins to trading platforms – 315% of their daily production.
The US stock exchange Nasdaq has abandoned plans to launch a crypto asset storage service due to “regulatory risks” in the US. The launch had been announced for the end of the year’s first half.
Ethereum blockchain co-founder Vitalik Buterin discussed implementing account abstraction in the ETH network. He said, this feature can attract a billion users to the Ethereum network, but its implementation has some problems.
Sunset Market Commentary
Markets
Disappointing earnings from tech giants Netflix and Tesla in US after-market hours yesterday to some extent dampened the equity mood in Europe too. The EuroStoxx50 slid 0.5% at the open but soon recovered to trade 0.1% in green currently. Its information technology subindex still eases 2.8% though with semiconductor company ASML slumping after cutting the outlook. The Nasdaq on Wall Street underperforms its peers S&P 500 and DJI too with losses of about 0.4%. US Treasuries and Bunds fell on FI markets. The former slipped with losses extending after US weekly jobless claims printed at a lower-than-expected 228k (240k consensus) for a second week straight. US Yields change +3.7 bps (30-y) to +8.4 bps (5-y). The July Philly Fed Business outlook came in on the weak side of expectations (-13.5 vs -10 expected, stabilizing near the June figure) but a surge in the six month outlook did more than merely counterbalance the headline miss. The series jumped from 12.7 to 29.1, the highest in almost two years with details (new orders, shipments and employment) all looking good. The 10y yield (+6.2 bps) is testing intermediate resistance around 3.79/3.80%. German yields initially moved in opposite ways depending where you looked at the curve before getting caught in slipstream of the US. Changes vary between +1.3 (30-y) and +2.8 bps (2-y). UK gilt yields more or less stabilize after falling off a cliff yesterday on the first weaker-than-expected CPI in four months. The 2y yield recuperates about 4 bps. Turning to currency markets, we spot the Aussie dollar’s outperformance. It follows this mornings stronger-than-expected June labour report, adding pressure to the Reserve Bank of Australia to once again resume tightening in August after a pause at 4.1% in June. AUD/USD surpasses the 0.68 mark. Neither the US dollar nor the euro have a clear directional trend. EUR/USD is showing further signs of a gentle topping out with the pair moving south of 1.12. For the technical dollar picture to improve, a return sub 1.1095 is required. Things are more obvious in the UK. Sterling managed to close off intraday lows after being hit by the CPI numbers yesterday but it turned out to be pointless. EUR/GBP today edges north again towards the 0.87 big figure, moving beyond 0.868 resistance. A weekly close tomorrow above that level is important from a technical point of view.
News & Views
The Turkish central bank (CBRT) raised its policy rate today by 250 bps, from 15% to 17.5%. Most analysts expected an increase to somewhere between 18% and 20%. Last month, the CBRT started a return to a normal monetary policy stance with an inaugural rate hike of 650 bps (from 8.5%) in an order to regain credibility. It’s a joint effort with the ministry of finance which stopped the costly FX intervention policy to slow the rot in the Turkish lira. Governor Hafize Gaye Erkan is on a mission to establish a disinflation course as soon as possible, to anchor inflation expectations and to control the deterioration in pricing behavior. Monetary tightening will be further strengthened as much as needed in a timely and gradual manner until a significant improvement in the inflation outlook is achieved. For now, underlying inflation trends remain upward stemming from consumption, wages, the TRY rate and services inflation. EUR/TRY today continues to hover around all-time highs of 30+.
Eurostat cosmetically revised up its Q1 GDP figure for the euro zone from -0.1% Q/Q to stagnation, suggesting that the EMU dodged a (technical) recession after all (Q4 2022 GDP: -0.1% Q/Q). It’s more symbolic than anything else with the outlook remaining grim. KBC Economics expects quarterly GDP growth to be marginally positive in coming quarters, resulting in an annual growth figure of only 0.6% for 2023 as a whole.