Sample Category Title
USD/JPY Mid-Day Outlook
Daily Pivots: (S1) 138.97; (P) 139.48; (R1) 140.19; More...
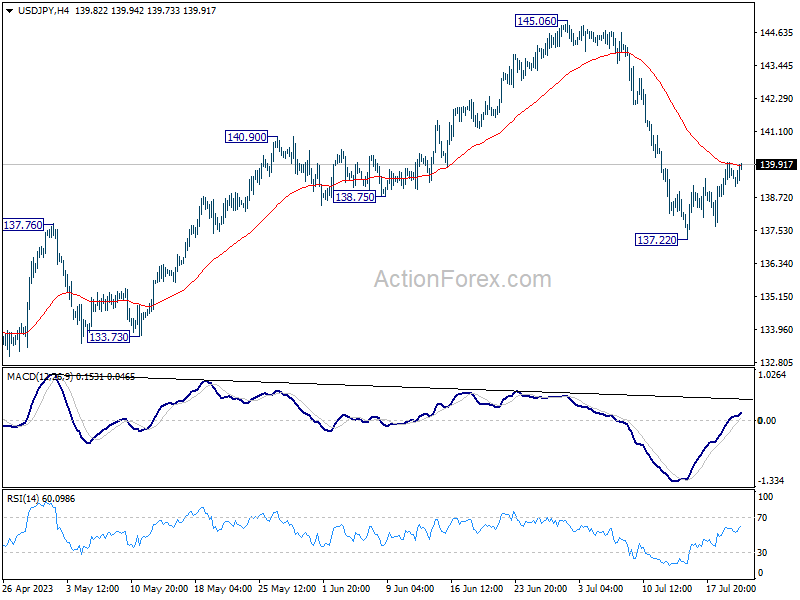
For now, strong resistance is still expected by 55 4H EMA (now at 139.87) to complete the recovery from 137.22. Break of 137.22 and sustained trading below 137.90 resistance turned support will confirm the larger bearish case, and target 127.20 and below. Nevertheless, sustained trading above 55 4H EMA will turn bias back to the upside for stronger rebound.
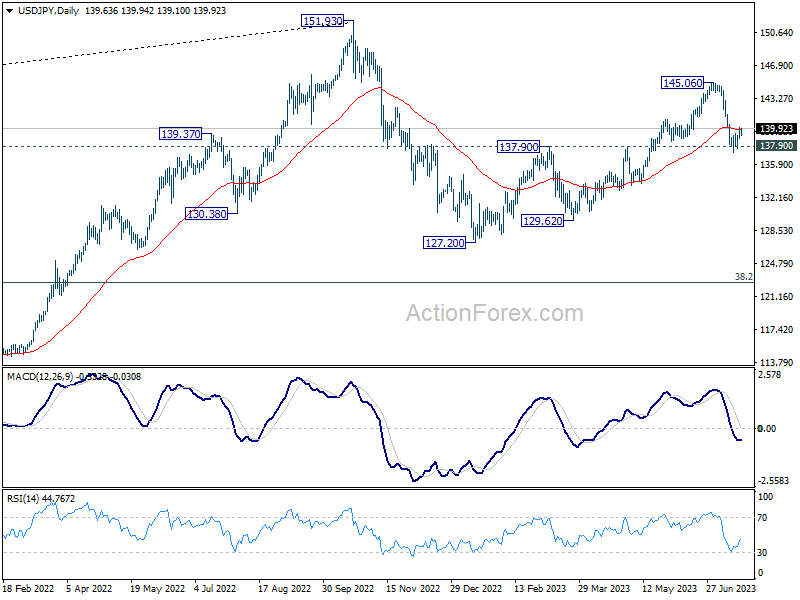
In the bigger picture, fall from 145.06 is seen as the third leg of the corrective pattern from 151.93 (2022 high). Sustained break of 137.90 resistance turned support should confirm this case and target 127.20 (2023 low) and below. For now, this will remain the favored case as long as 145.06 resistance holds, even in case of strong rebound.
USD/CHF Mid-Day Outlook
Daily Pivots: (S1) 0.8563; (P) 0.8588; (R1) 0.8610; More...
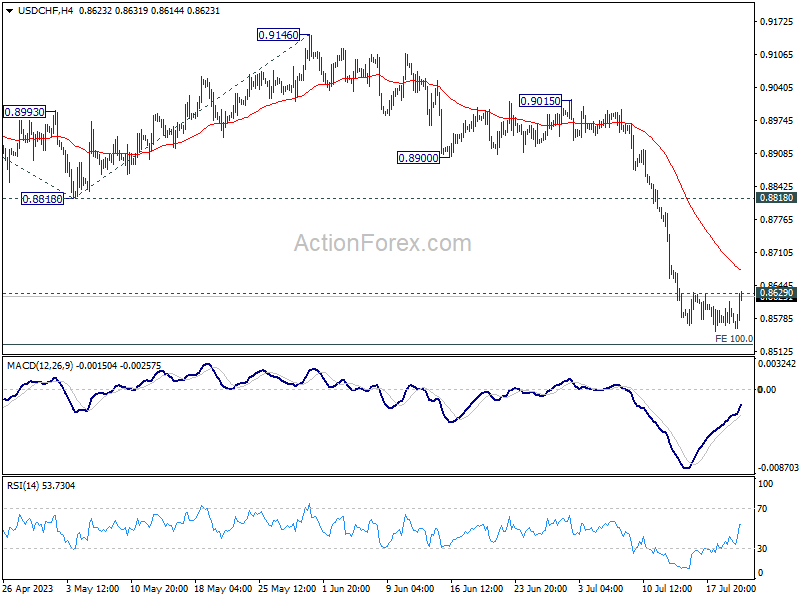
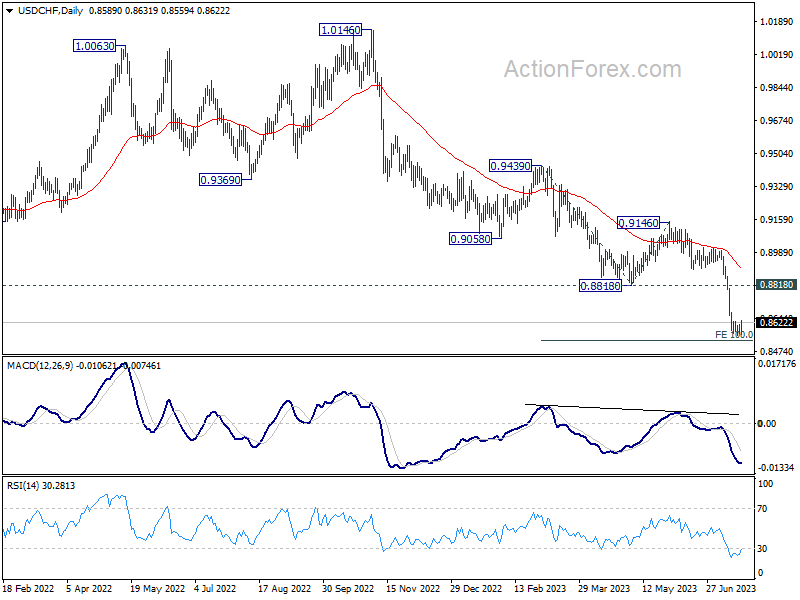
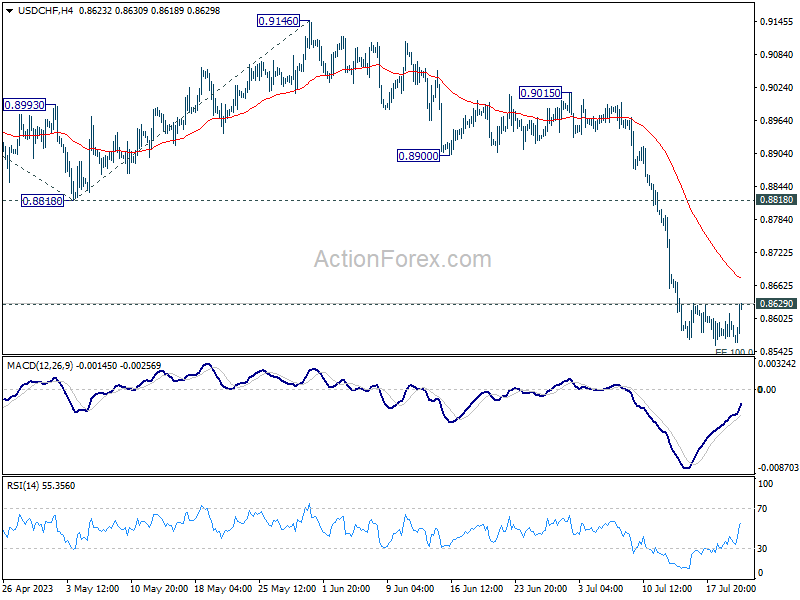
No change in USD/CHF's outlook. While another decline cannot be ruled out, some support could be seen from 100% projection of 0.9439 to 0.8818 from 0.9146 at 0.8525 to bring rebound. Break of 0.8629 minor resistance will turn bias to the downside for 55 4H EMA (now at 0.8675) and above.
In the bigger picture, the break of 0.8756 (2021 low) indicates break out from the long term range pattern. For now, medium term outlook will stay bearish as long as 0.9146 resistance holds. Further fall would be seen to 61.8% retracement of 0.7065 (2011 low) to 1.0342 (2016 high) at 0.8317 next.
GBP/USD Mid-Day Outlook
Daily Pivots: (S1) 1.2857; (P) 1.2951; (R1) 1.3034; More...
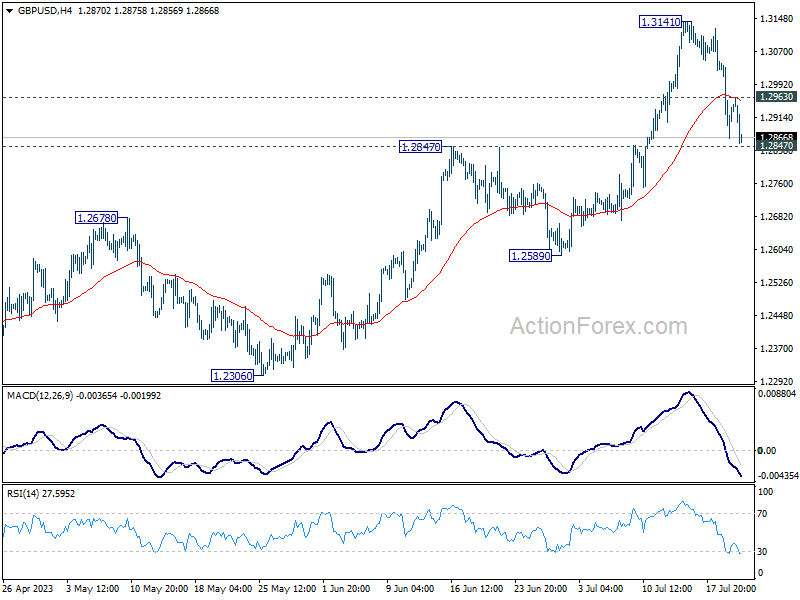
Intraday bias bias in GBP/USD remains neutral at this point. With 1.2847 resistance turned support intact, outlook stays bullish. On the upside, above 1.2963 minor resistance will turn bias back to the upside for retesting 1.3141 high. Nevertheless, decisive break of 1.2847 will argue that larger correction is underway and target 1.2589 support next.
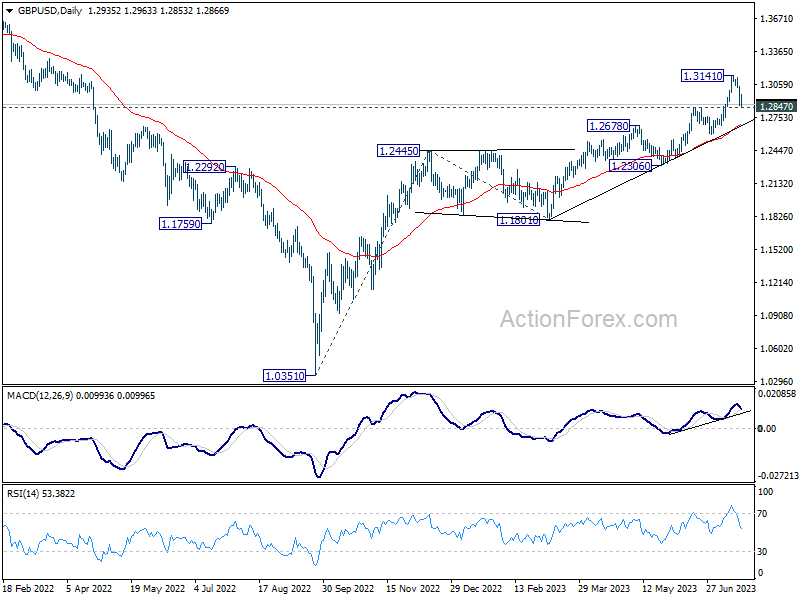
In the bigger picture, rise from 1.0351 medium term bottom (2022 low) is in progress. Next target is 100% projection of 1.0351 to 1.2445 from 1.1801 at 1.3895. Break there will target 1.4248 key long term resistance (2021 high) next. This will now remain the favored case as long as 1.2678 resistance turned support holds.
EUR/USD Mid-Day Outlook
Daily Pivots: (S1) 1.1171; (P) 1.1206; (R1) 1.1237; More...
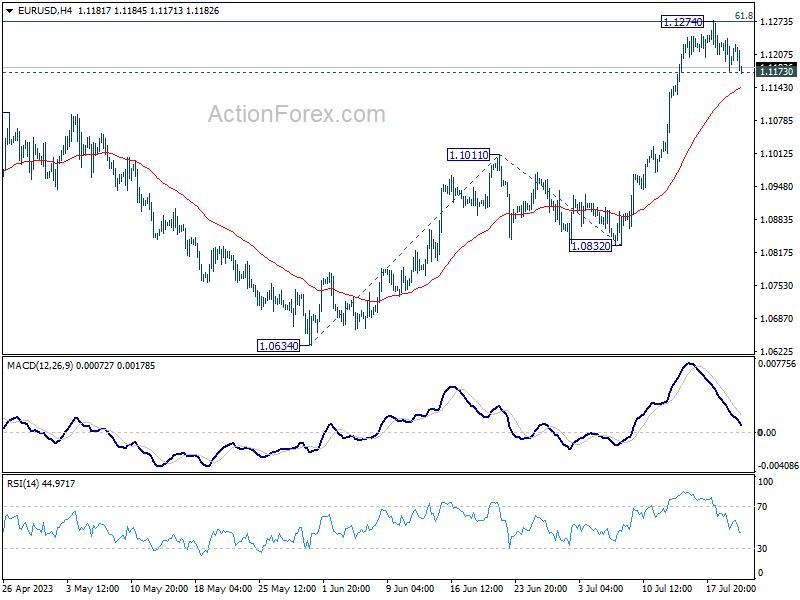
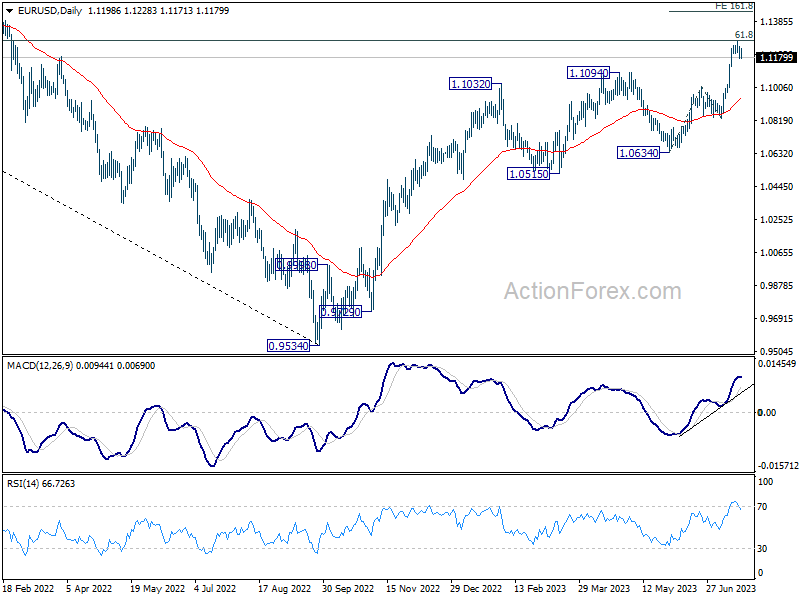
Intraday bias in EUR/USD remains neutral for the moment. On the downside, firm break of 1.1173 minor support will confirm rejection by 1.1273 fibonacci level. Intraday bias will be back on the downside for deeper pull back to 55 4H EMA (now at 1.1141) and below. Nevertheless, sustained break of 1.1273 will extend larger up trend to 161.8% projection of 1.0634 to 1.1011 from 1.0832 at 1.1442 next.
In the bigger picture, as rise from 0.9534 extends, focus is now on 61.8% retracement of 1.2348 (2021 high) to 0.9534 at 1.1273. Sustained break there will solidify the case of bullish trend reversal and target 1.2348 resistance next. Meanwhile, outlook will continue to stay bullish as long as 1.0832 support holds, even in case of deep pull back.
Dollar Attempting Stronger Rebound in Subdued Trading
Today's trading has been notably subdued after Asian session, characterized by limited news flow from Europe, and just US jobless claims and Philadelphia Fed survey in early US session. Sterling weakness continues to be a dominant theme for the week, experiencing a fresh round of selling as US session opens. Concurrently, slight softening is evident in Euro and Swiss Franc.
Despite Australian Dollar holding the position of the day's strongest performer, it has not witnessed clear, sustained buying after its initial rise on job data, rebound in Yuan and copper. In contrast, US Dollar is making attempts to stage a stronger rebound, while Yen's performance remains mixed as it awaits tomorrow's CPI data release from Japan.
Technically, immediate focus is now on 1.1173 minor support in EUR/USD and 0.8629 minor resistance in USD/CHF. Firm break there this levels will indicate that stronger rebound in Dollar is underway. While that's still far from a reversal signal even if realized, that would signal the start of a prolonged consolidations, probably extending to next week's FOMC rate decision.
In Europe, at the time of writing, FTSE is up 0.62%. DAX is up 0.23%. CAC is up 0.36%. Germany 10-year yield is up 0.0230 at 2.463. Earlier in Asia, Nikkei fell -1.23%. Hong Kong HSI dropped -0.13%. China Shanghai SSE dropped -0.92%. Singapore Strait Times dropped -0.03%. Japan 10-year JGB yield dropped -0.0076 to 0.460.
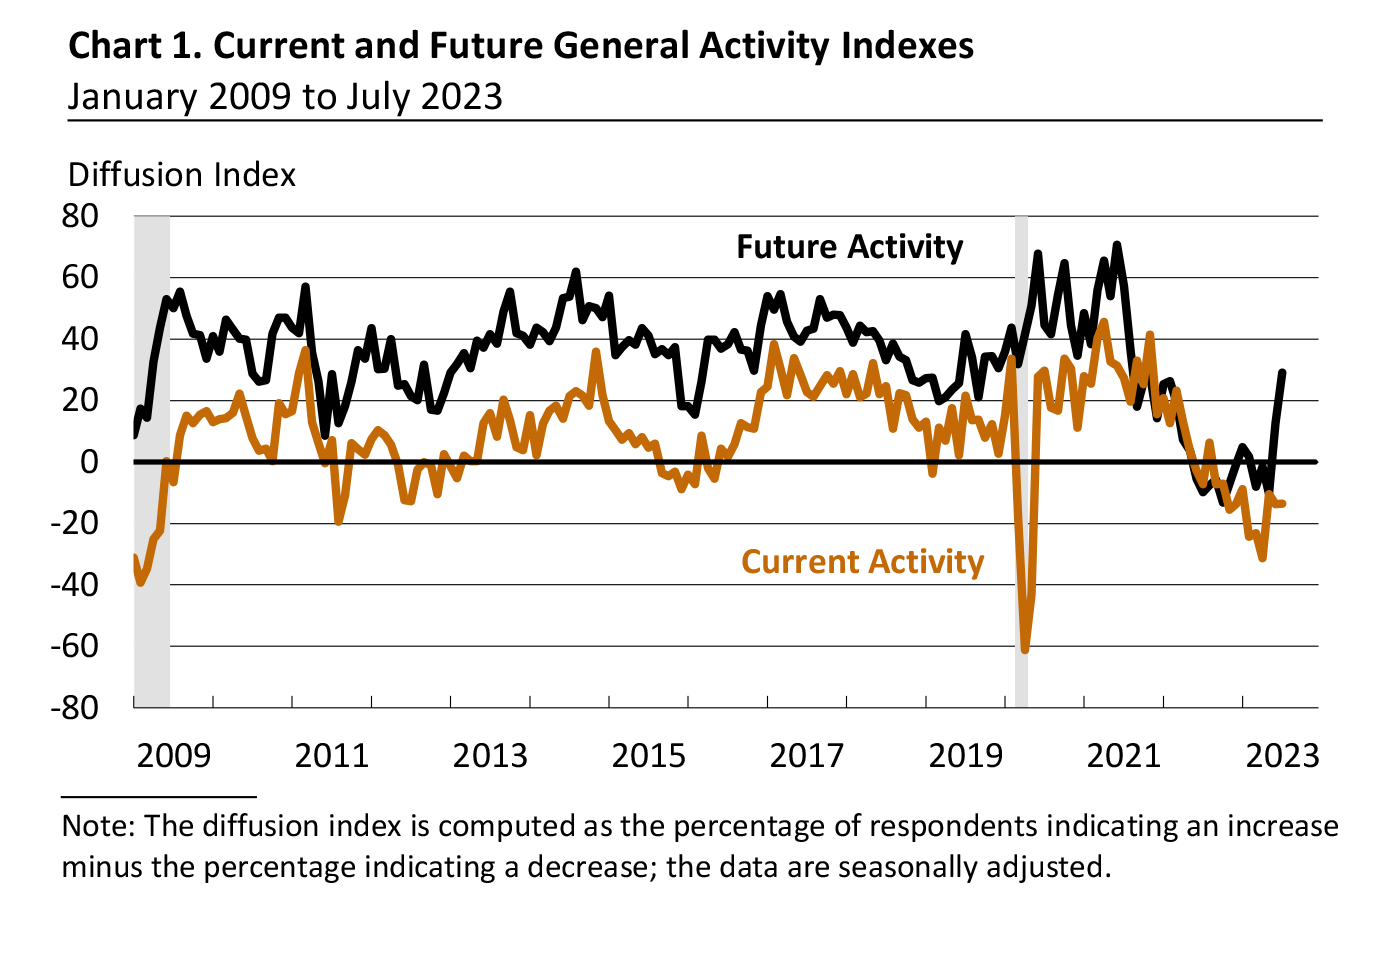
Philadelphia Fed manufacturing outlook shows signs of optimism despite persistent negativity in general activity
The July Manufacturing Business Outlook Survey from the Philadelphia Fed presented a mixed bag of indicators. The diffusion index for current general activity marginally improved from -13.7 to -13.5, slightly exceeding expectations of -15.5. But it registered its 11th consecutive negative reading. Also, the persistent negativity was reflected as over 30% of the firms reported decreases, outnumbering the 17% that reported increases. Nearly half of the firms (49%) reported no change in current activity.
The new orders index took a hit, dropping -5 points to -15.9, marking its 14th consecutive negative reading. The employment index also dipped marginally from -0.4 last month to -1.0 this month. Furthermore, the prices paid diffusion index decline by -1 point to 9.5.
In a ray of hope, the diffusion index for future general activity saw a significant jump from 12.7 in June to 29.1, recording the index's highest reading since August 2021. This indicates growing optimism about future business conditions. Nearly 40% of firms anticipate an increase in activity over the next six months, up from 33% last month, with only 11% expecting a decrease (down from 20%). Meanwhile, 46% anticipate no change, slightly up from 44% in the previous month.
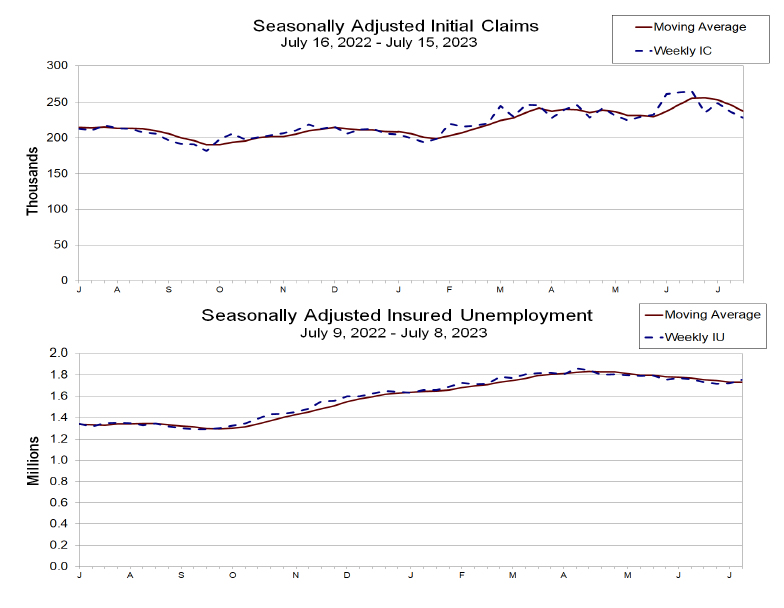
US initial claims fell to 228k, below expectations
US initial jobless claims fell -9k to 228k in the week ending July 15, below expectation of 245k. Four-week moving average of initial claims dropped -9k to 238k. Continuing claims rose 33k to 1754k in the week ending July 8. Four-week moving average of continuing claims fell -2k to 1732k.
Japan's export to US up 11.7% yoy in Jun, to EU up 15%, to China down -11%
Japan's exports rose by 1.5% yoy to JPY 8744B in June. The significant rise in exports to US by 11.7% yoy and to EU by 15.0% yoy was offset by the -11.0% yoy decline in exports to China (marking the most significant drop since January).
Rise in US-bound exports was primarily driven by shipments of cars and mining machinery. Meanwhile, dip in exports to China was attributed the decreased shipments of steel, chips, and nonferrous metal, which led to an overall double-digit decline.
Japan's imports contracted by -12.9% yoy to JPY 8701B. The decrease in value of imports is primarily linked to drop in crude, coal, and liquefied natural gas.
As a result, Japan recorded a trade surplus of JPY 43B, the first such instance in nearly two years since July 2021.
In seasonally adjusted term, exports rose 3.3% mom to JPY 8269B. Imports rose 0.5% mom to JPY 8822B. Trade balance reported JPY -553B deficit, versus expectation of JPY -550B.
Australia employment grew 32.6k, but demand met by people working more hours
Australian's June employment data showed persistent tightness in the job markets. The 32.6k growth in employment significantly surpassed expectations of 15.0k. Employment-population ratio remained at record high. Monthly hours worked outpaced employment growth, suggesting that labor demand was met by people working more hours.
Among the 32.6k job growth, rise of 39.3k full-time employment was offset by a decrease of -6.7k in part-time roles. Unemployment rate remained steady at 3.5%, below expectation of 3.6%. Participation rate dipped slightly from 66.9% to 66.8%. Monthly hours worked rose 0.3% mom, faster than growth in employment at 0.2% mom.
Bjorn Jarvis, ABS head of labour statistics, stated: "The rise in employment in June saw the employment-to-population ratio remain at a record high 64.5 per cent, reflecting a tight labour market in which employment has recently increased in line with population growth."
He further emphasized that the current labour market is stronger than it was prior to the pandemic. Jarvis elaborated, "In addition to there being over a million more employed people than before the pandemic, a much higher share of the population is employed. In June 2023, 64.5 per cent of people 15 years or older were employed, an increase of 2.1 percentage points since March 2020."
Jarvis also highlighted the ongoing demand for labour, saying: "The strength in hours worked since late 2022, relative to employment growth, shows the demand for labour is continuing to be met, to some extent, by people working more hours."
EUR/USD Mid-Day Outlook
Daily Pivots: (S1) 1.1171; (P) 1.1206; (R1) 1.1237; More...
Intraday bias in EUR/USD remains neutral for the moment. On the downside, firm break of 1.1173 minor support will confirm rejection by 1.1273 fibonacci level. Intraday bias will be back on the downside for deeper pull back to 55 4H EMA (now at 1.1141) and below. Nevertheless, sustained break of 1.1273 will extend larger up trend to 161.8% projection of 1.0634 to 1.1011 from 1.0832 at 1.1442 next.
In the bigger picture, as rise from 0.9534 extends, focus is now on 61.8% retracement of 1.2348 (2021 high) to 0.9534 at 1.1273. Sustained break there will solidify the case of bullish trend reversal and target 1.2348 resistance next. Meanwhile, outlook will continue to stay bullish as long as 1.0832 support holds, even in case of deep pull back.
Economic Indicators Update
| GMT | Ccy | Events | Actual | Forecast | Previous | Revised |
|---|---|---|---|---|---|---|
| 23:50 | JPY | Trade Balance (JPY) Jun | -0.55T | -0.66T | -0.78T | -0.77T |
| 01:30 | AUD | NAB Business Confidence Q2 | -3 | -4 | ||
| 01:30 | AUD | Employment Change Jun | 32.6K | 15.0K | 75.9K | 76.5K |
| 01:30 | AUD | Unemployment Rate Jun | 3.50% | 3.60% | 3.60% | 3.50% |
| 06:00 | CHF | Trade Balance (CHF) Jun | 4.82B | 4.23B | 5.48B | |
| 06:00 | EUR | Germany PPI M/M Jun | -0.30% | -0.40% | -1.40% | |
| 06:00 | EUR | Germany PPI Y/Y Jun | 0.10% | 0.00% | 1.00% | |
| 08:00 | EUR | Eurozone Current Account (EUR) May | 9.1B | 2.5B | 3.6B | 3.8B |
| 12:30 | USD | Initial Jobless Claims (Jul 14) | 228K | 245K | 237K | |
| 12:30 | USD | Philadelphia Fed Manufacturing Jul | -13.5 | -15.5 | -13.7 | |
| 14:00 | USD | Existing Home Sales Jun | 4.27M | 4.30M | ||
| 14:00 | EUR | Eurozone Consumer Confidence Jul P | -16 | -16 | ||
| 14:30 | USD | Natural Gas Storage | 45B | 49B |
Philadelphia Fed manufacturing outlook shows signs of optimism despite persistent negativity in general activity
The July Manufacturing Business Outlook Survey from the Philadelphia Fed presented a mixed bag of indicators. The diffusion index for current general activity marginally improved from -13.7 to -13.5, slightly exceeding expectations of -15.5. But it registered its 11th consecutive negative reading. Also, the persistent negativity was reflected as over 30% of the firms reported decreases, outnumbering the 17% that reported increases. Nearly half of the firms (49%) reported no change in current activity.
The new orders index took a hit, dropping -5 points to -15.9, marking its 14th consecutive negative reading. The employment index also dipped marginally from -0.4 last month to -1.0 this month. Furthermore, the prices paid diffusion index decline by -1 point to 9.5.
In a ray of hope, the diffusion index for future general activity saw a significant jump from 12.7 in June to 29.1, recording the index's highest reading since August 2021. This indicates growing optimism about future business conditions. Nearly 40% of firms anticipate an increase in activity over the next six months, up from 33% last month, with only 11% expecting a decrease (down from 20%). Meanwhile, 46% anticipate no change, slightly up from 44% in the previous month.
US initial claims fell to 228k, below expectations
US initial jobless claims fell -9k to 228k in the week ending July 15, below expectation of 245k. Four-week moving average of initial claims dropped -9k to 238k.
Continuing claims rose 33k to 1754k in the week ending July 8. Four-week moving average of continuing claims fell -2k to 1732k.
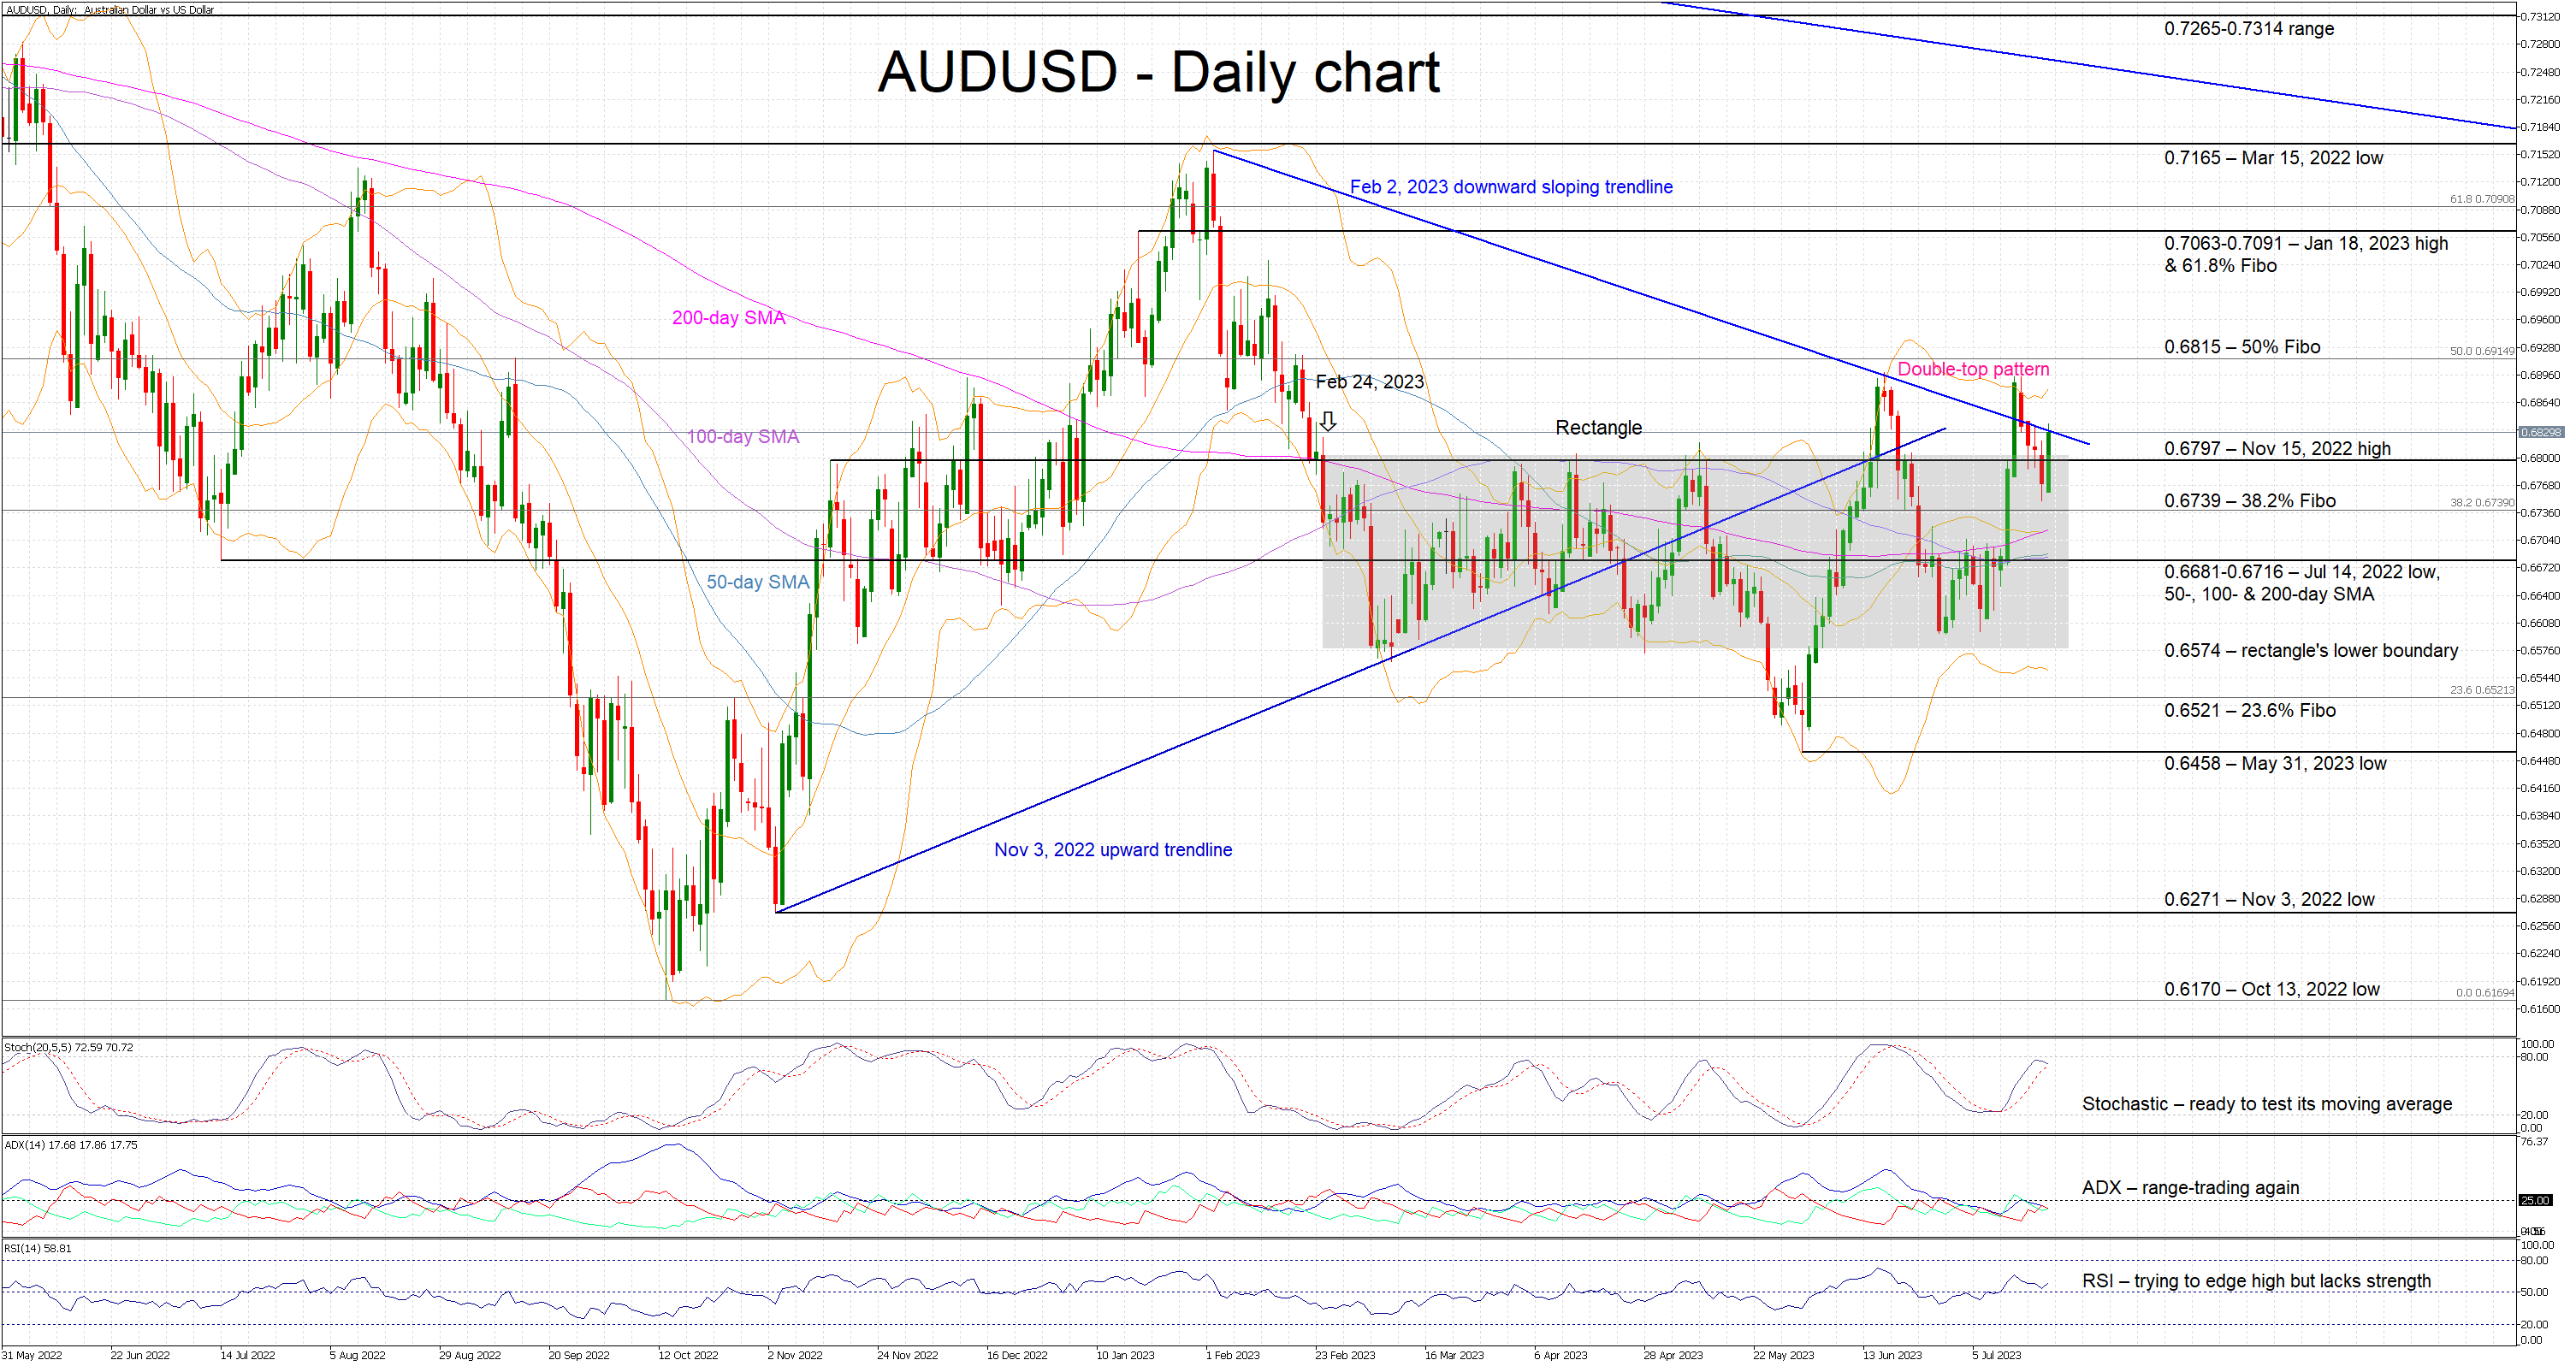
Next Leg in AUDUSD Lies in Hands of Downtrend Line
AUDUSD bulls are staging another breakout as they desperately try to move away from the recent rectangle. However, the February 2, 2023 downward sloping trendline is proving too strong for them, halting twice their advance. This is the bulls’ third attempt to overcome this resistance trendline in the past 35 days.
Gradually, the market momentum is shifting away from the bulls. The Average Directional Movement Index (ADX) appears to be uninterested in the bulls’ efforts and is stuck below its 25-threshold. Similarly, the RSI remains above its midpoint but is failing to make a higher high. More significantly, the stochastic oscillator is edging lower as it prepares to test the support set by its moving average. The outcome of the battle could offer a strong signal on the next AUDUSD leg.
In addition, a double-top pattern appears to be forming with the neckline set at the 0.6595 region. A break below this level is necessary for this bearish pattern to become valid.
Should the bulls finally manage to break the February 2, 2023 downward sloping trendline, they would come up against the 50% Fibonacci retracement level of the April 5, 2022 – October 13, 2022 downtrend at 0.6815. Breaking this level would then open the door for a move towards the 0.7063-0.7091 area.
On the flip side, the bears are preparing for a significant pullback if they successfully defend the February 2, 2023 trendline. They would then have the chance of pushing AUDUSD back inside the aforementioned rectangle and towards the 38.2% Fibonacci retracement at 0.6739. Even lower, they could have a go at the much busier 0.6681-0.6716 range.
To sum up, the February 2, 2023 trendline holds the key to the next AUDUSD leg. If it holds, the bears appear ready to regain market control and stage an aggressive correction.
BTCUSD Sustains Monthly Neutral Status
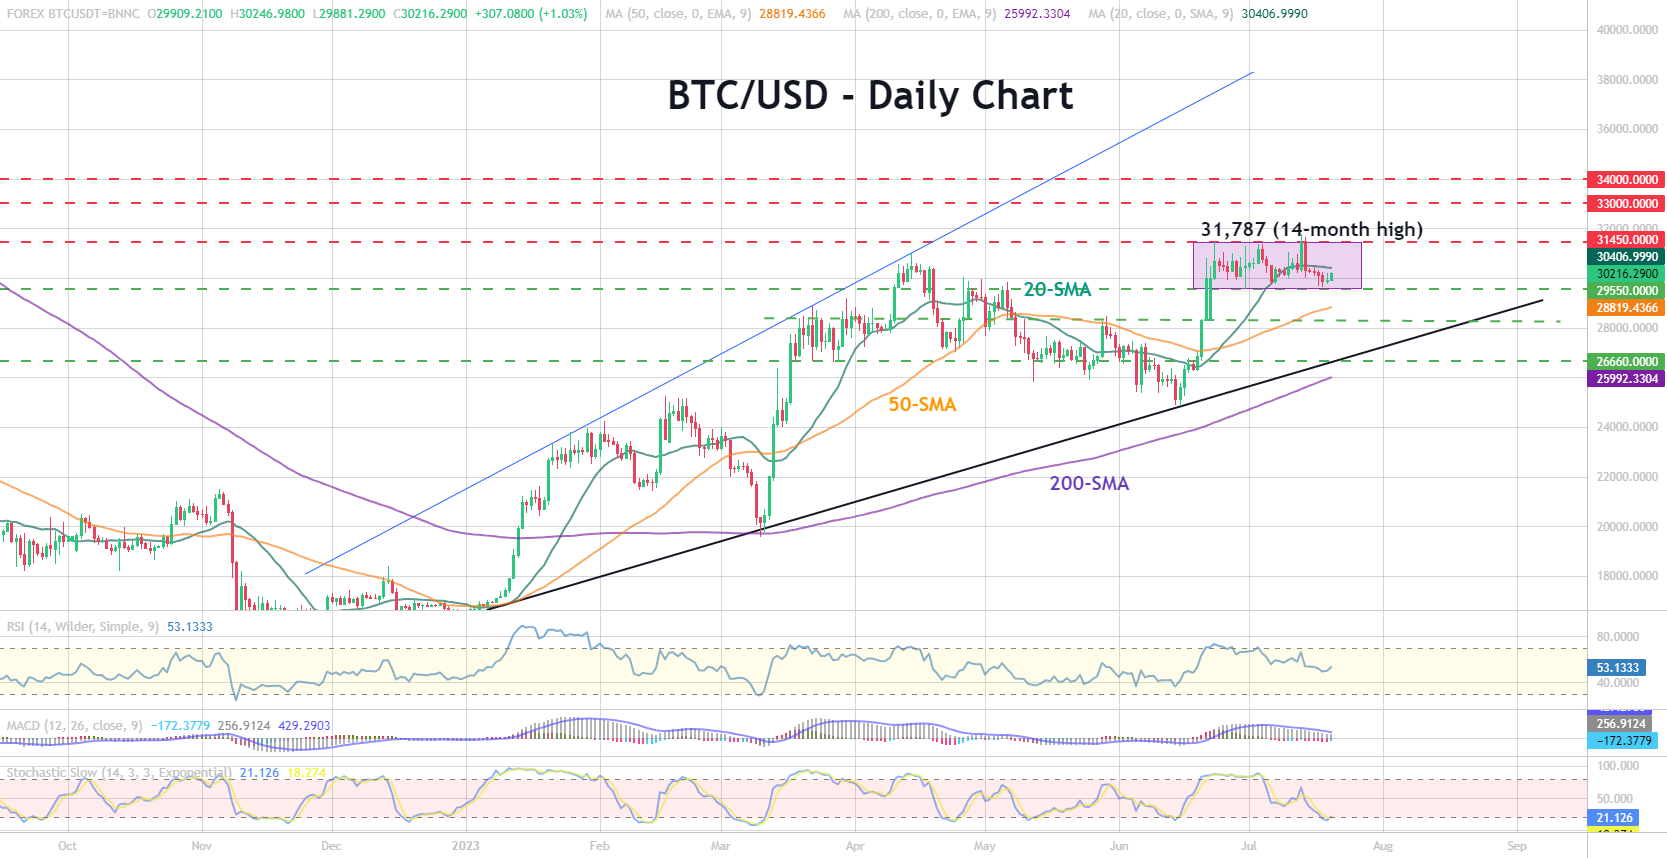
BTCUSD (Bitcoin) has been range bound between 31,450 and 29,550 for a month now. This is a familiar range territory, which the popular crypto used to visit occasionally during the previous two years.
The Stochastic oscillator is looking to pivot northwards in the oversold region, flagging a potential upside reversal. That said, the RSI and MACD are sustaining a negative trajectory, keeping optimism for an upside correction low after the price dropped below the 20-day SMA.
The bulls will need to lift the price back above the 20-day SMA at 30,316 to gain access to the 31,450 ceiling. Should they successfully re-activate the 2023 uptrend above the range, they could form a new higher high within the 32,750-33,000 former constraining zone. The 34,000 psychological mark could be the next destination.
If the price breaks its sideways move below 29,550, support could develop somewhere between the 50-day SMA at 28,819 and the 28,830 barrier. Failure to rebound there would shift the attention straight to the ascending trendline at 26,660, which has been navigating the market higher since the end of 2022. Slightly lower, the 200-day SMA could be another important spot, as a violation at this point would enhance concerns of a down-trending market.
All in all, BTCUSD is maintaining a neutral status in the short-term picture. A bounce above 31,450 or a drop below 29,550 could provide the next direction in the market.
Japanese Yen Edges Up Ahead of Japanese Inflation Report
- US employment claims expected to rise
- Japan’s core inflation projected to tick higher
- BoJ’s Ueda says no plans to tighten policy
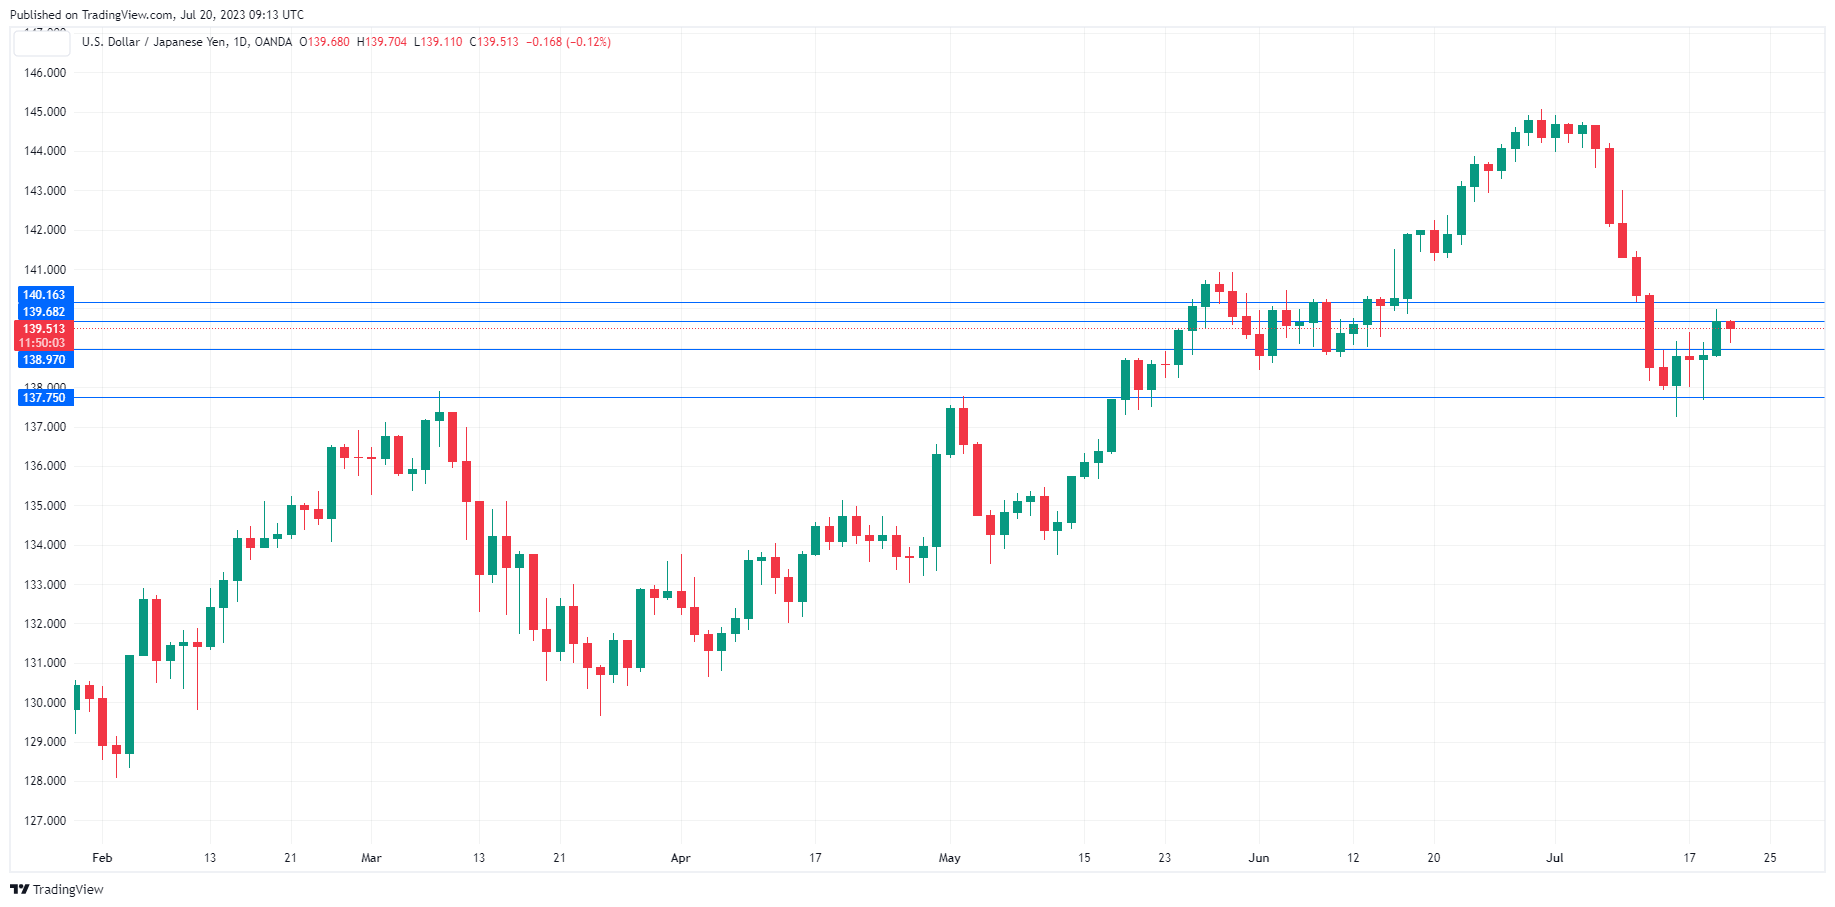
The Japanese yen is trading quietly on Thursday. In the European session, USD/JPY is trading at 139.45, down 0.16%.
Japan’s core inflation expected to inch higher
Japan releases National Core CPI for June on Friday. The inflation indicator, which excludes fresh food, is expected to tick upwards to 3.3%, up from 3.2% in May. The “core-core” index, which excludes fresh food and energy and is closely watched by the Bank of Japan, is projected to dip to 4.2%, down from 4.3%.
Barring a major surprise, the inflation picture will remain pretty much the same after the June data is released. There is still pressure on the Bank of Japan to tighten policy, as inflation is expected to remain above the 2% target for a 15th straight month. This is making the BoJ’s argument that high inflation is temporary more difficult to swallow.
BoJ Governor Kazuo Ueda has been in office for several months and has essentially toed the line of the Bank’s ultra-loose monetary policy. Ueda said on Tuesday that the BoJ would continue this policy as there was “some distance to sustainably and stably achieving the central bank’s 2% inflation target”. Ueda’s comments were likely intended to dampen speculation about a shift in policy when the BoJ meets on July 28th.
We could see stronger movement from USD/JPY in the North American session when the US releases unemployment claims and the Philly Fed Manufacturing Index. The US labour market remains tight and any signs of cooling could raise expectations that the Fed will ease policy, which would be bearish for the US dollar. Unemployment claims are expected to rise slightly to 242,000, up from 237,000.
The manufacturing sector has been sputtering and the Philly Fed Manufacturing Index has declined for ten consecutive months. The consensus for June stands at -10, following -13.7 in May.
USD/JPY Technical
- There is resistance at 139.68 and 140.16
- USD/JPY is putting pressure on support at 138.97. The next support line is 137.75