Sample Category Title
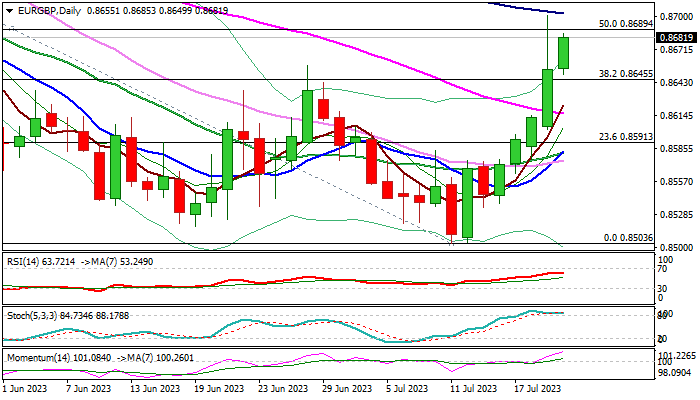
EUR/GBP: Dovish Shift in BoE Rate Outlook Adds Pressure on Sterling
EURGBP cross keeps firm tone and extends steep ascend into fifth consecutive day on Thursday, despite Wednesday’s strong upside rejection just under falling 100DMA (0.8702) and daily cloud top (0.8705) which left bullish daily candle with long upper shadow.
Sterling came under fresh pressure from the latest dovish shift in rate outlook on stronger than expected UK inflation cooling and from prevailing view from current and former BoE policymakers, which almost halved bets for 50 basis points hike in August.
Very strong bullish momentum on daily chart continues to underpin the action, though overbought conditions warn of repeated failure and potential bull-trap on repeated close below 0.8689 barrier (50% retracement of 0.8875/0.8503 descend).
Near-term action is expected to keep bullish bias while the price stays above 0.8650, however firm break of 0.8702/05 pivots and nearby 200DMA (0.8727) is required to signal continuation of recovery leg from 0.8503 (July 11 low).
Res: 0.8696; 0.8705; 0.8727; 0.8783.
Sup: 0.8650; 0.8610; 0.8582; 0.8564.
NIKKEI ( $NKD_F ) Buying The Dips At The Blue Box Area
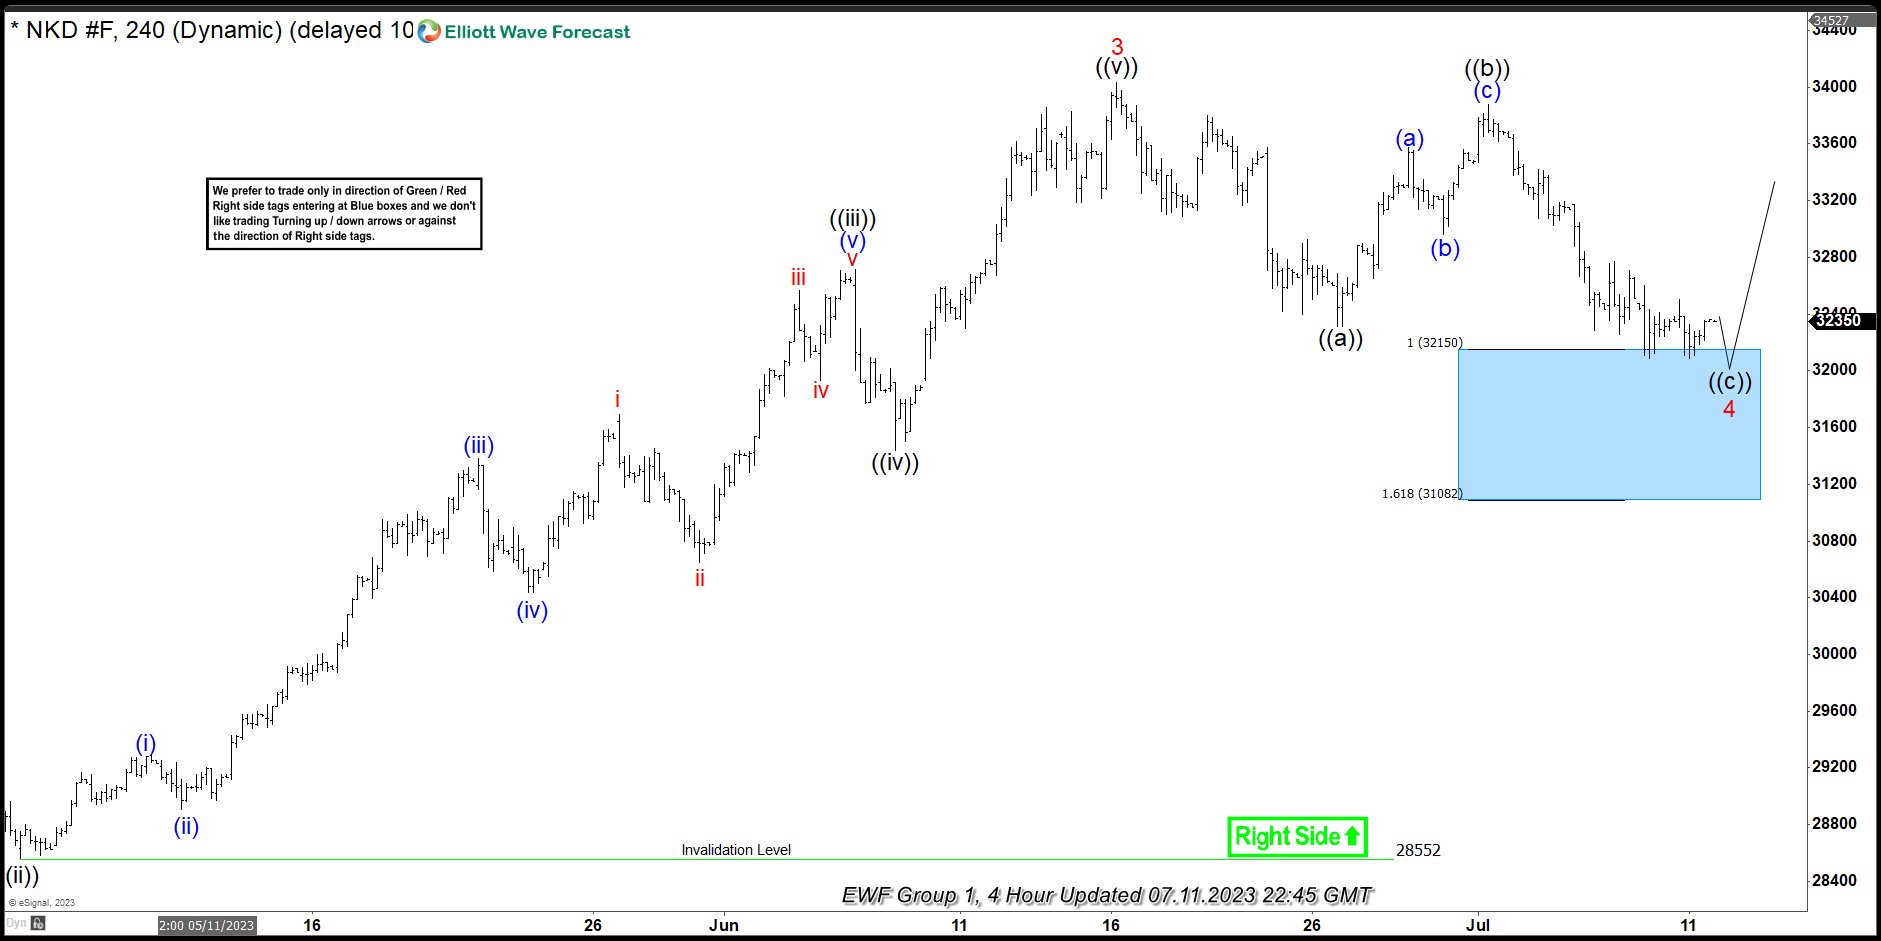
In this article we’re going to take a quick look at the Elliott Wave charts of NIKKEI published in members area of the website. As our members know NIKKEI is showing impulsive bullish sequences that are calling for a further strength. Recently we got a 3 waves pull back that has ended right at the Blue Box zone (our buying area) . In the further text we are going to explain the Elliott Wave Forecast and trading setup.
NIKKEI Elliott Wave 4 Hour Chart 07.11.2022
NIKKEI is giving us pull back in 3 waves that are reaching extreme area at 32150-31082 blue box ( buying zone) . We don’t recommend selling the futures and prefer the long side. NIKKEI should ideally make a rally toward new highs or 3 waves bounce alternatively. As our members know Blue boxes are based on 100% – 161.8% Fibonacci extension area , that we trade in 3, 7, or 11 swing corrective sequence. Once bounce reaches 50 Fibs against the B red high , we will make long position risk free ( put SL at BE) and take partial profits. Invalidation for the long trades is break of 1.618 fib ext : 31082
Quick reminder on how to trade our charts :
Red bearish stamp+ blue box = Selling Setup
Green bullish stamp+ blue box = Buying Setup
Charts with Black stamps are not tradable. 🚫
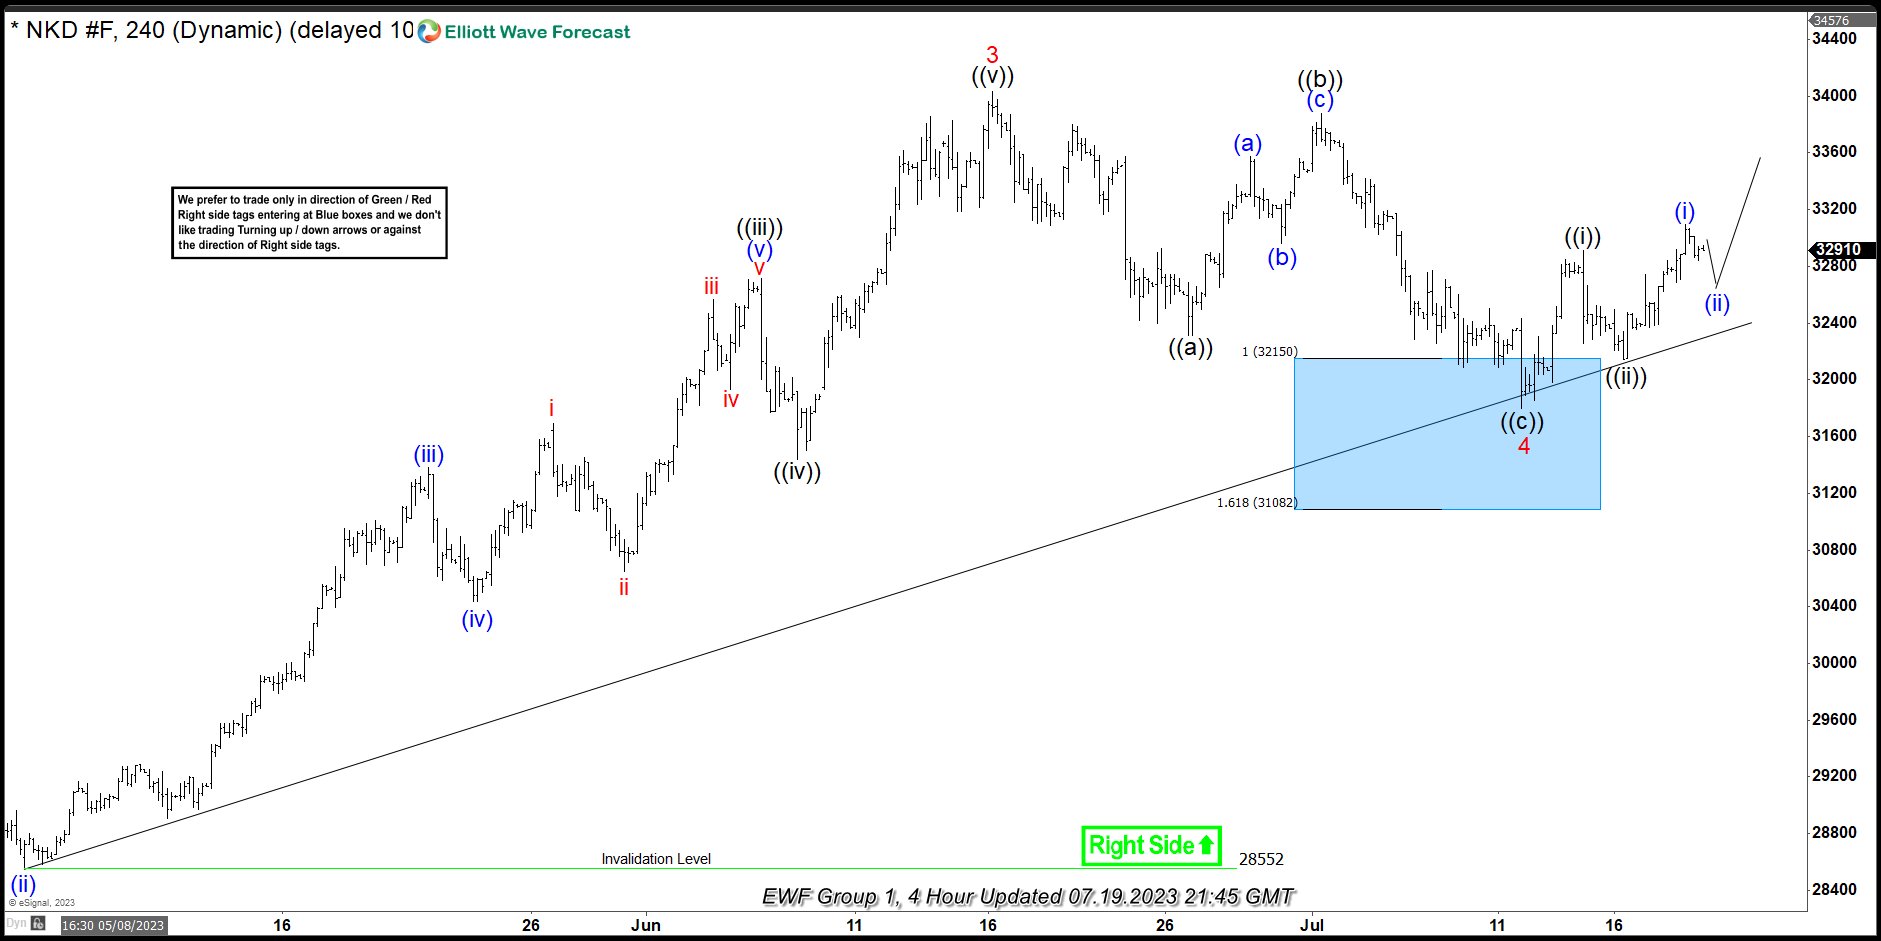
NIKKEI Elliott Wave 4 Hour Chart 07.19.2022
NIKKEI made good reaction from our buying zone. We call wave 4 red completed at 31811 low. The price has reached and exceeded 50 fibs against the ((b)) black high. Members who took the long trade are enjoying profits now in a risk free positions. We would like to see break of 3 red high, to confirm next leg up is in progress.
FTSE 100 Bounces Back on UK Inflation News
Participants in financial markets were closely watching yesterday the data on inflation in the UK, where it is at the highest level among the G7 countries. The news turned out to be positive:
- CPI was 7.9% (forecast = 8.2%, last month = 8.7%) in annual terms;
- Сore CPI dropped from 31-year high from 7.1% to 6.9%.
Consequently:
- the price of the British pound fell against the US dollar and other currencies;
- the price of the FTSE 100 index rose sharply, rising from the July lows by about 5%.
Thus, the quotes demonstrate the expectations of market participants — they suggest that the Bank of England has received a reason to ease the ongoing tight monetary policy aimed at suppressing inflation.
The publication of the decision of the Bank of England is scheduled for August 3, and the interest rate can be raised only by 0.25%, although earlier 0.5% was called more likely.
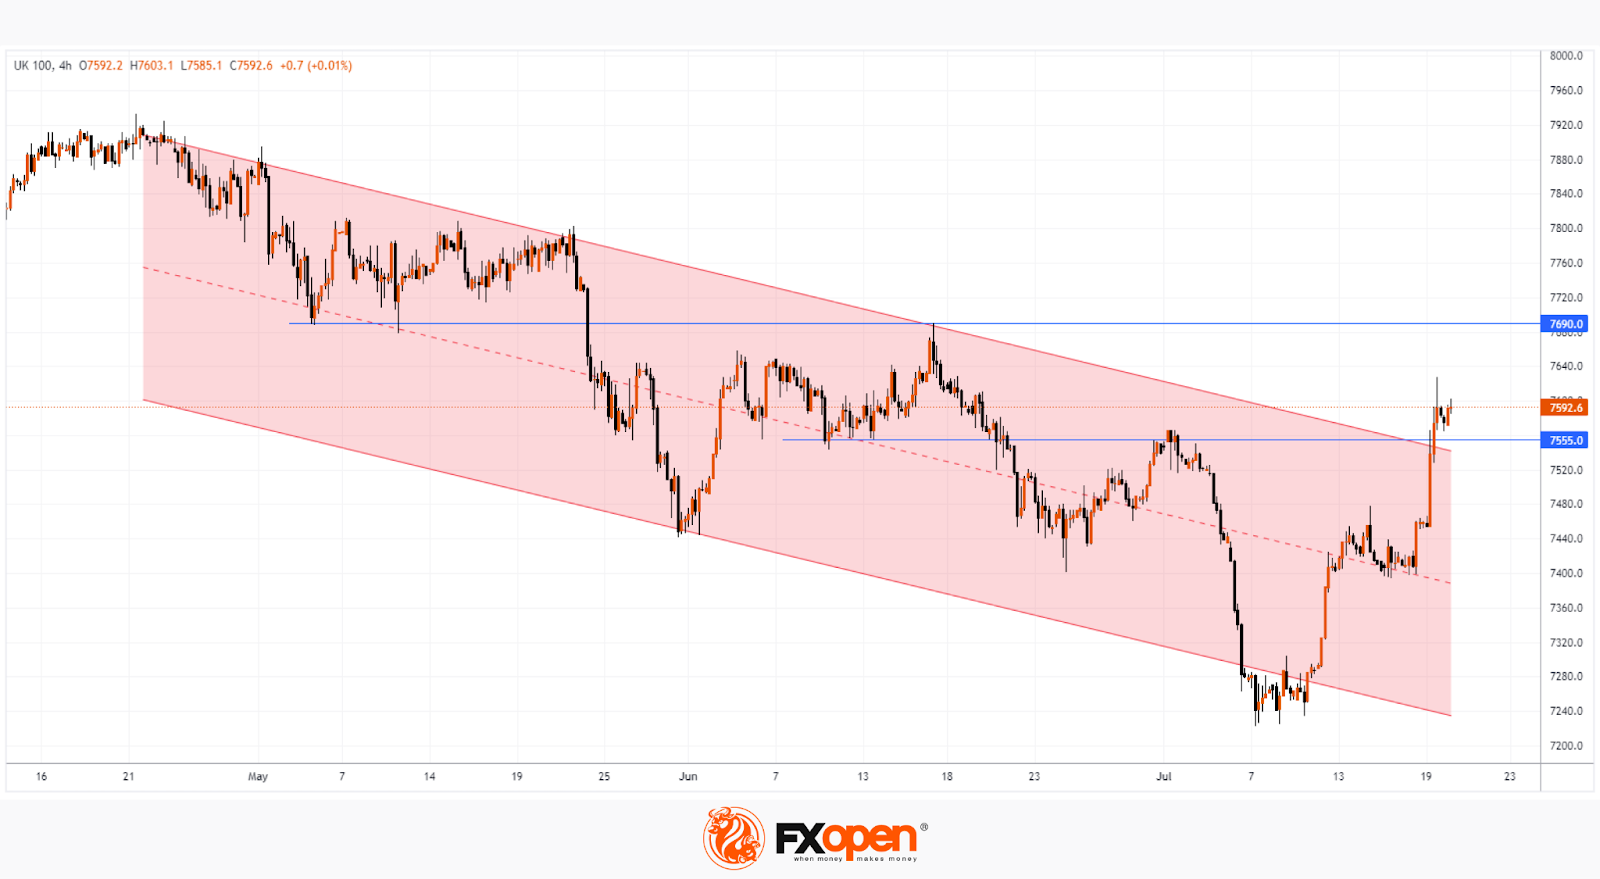
The sharp rise in the price of the FTSE 100 has led to the fact that the descending channel is broken, as is the resistance level at 7,555. It is possible that after such a sharp impulse, we will witness a consolidation period, which may be limited to the levels of 7,555 and 7,690.
AUD/USD: Aussie Dollar Sharply Up on Robust Labor Data and Forming Reversal pattern on daily chart
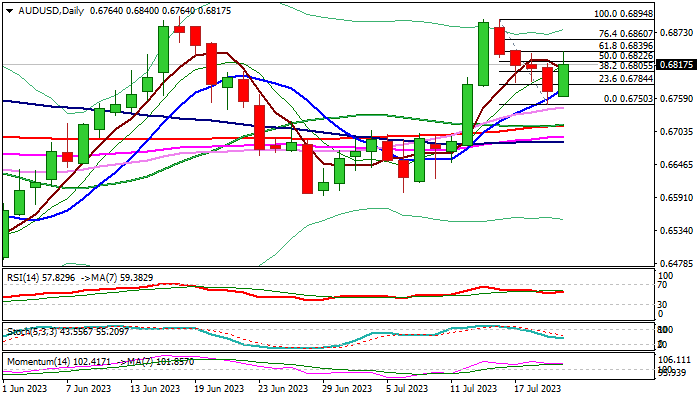
Australian dollar bounced around 1% in early Thursday, reversing more than a half of four-day 0.6894/0.6750 pullback and suggesting that correction from 0.6894 double-top of July 13/14, might be over.
Aussie dollar received strong support from robust Australian jobs data in June (employment grew more than a double of expectations and jobless rate remained unchanged despite forecasts for ticking higher) which signal that labor market remains tight and continues to fuel inflation.
Upbeat data impacted rate outlook, pushing higher percentage of bets for RBA’s 0.25% rate hike on Aug 1 policy meeting, as well as lifting projections of a terminal rate and subsequently lifted Australian dollar.
Fresh strength improved near-term structure, as bullish engulfing pattern is forming on daily chart (requires close above 0.6820 for confirmation) and expected to generate reversal signal.
Technical picture is overall bullish on daily chart (strong positive momentum / MA’s in bullish setup) contributing to positive signals, which will be verified on extension above cracked Fibo pivot at 0.6839 (61.8% of 0.6894/0.6750 bear-leg).
Res: 0.6839; 0.6860; 0.6877; 0.6894.
Sup: 0.6805; 0.6784; 0.6764; 0.6750.
GBP Sees Pullback
GBP/USD seeks support
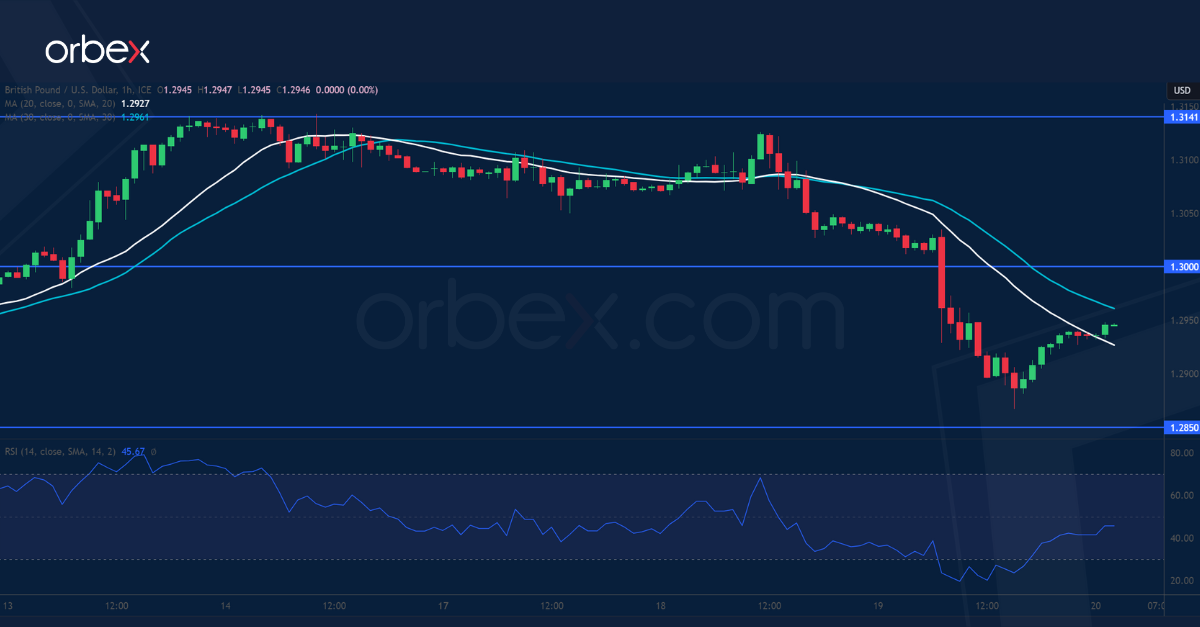
The pound tumbled after the UK’s consumer price growth showed a noticeable slowdown in June. A clean cut below the first support and the round number of 1.3000 suggests that short-term buyers have trimmed their exposures, turning it into a resistance level. Medium-term sentiment remains upbeat though and the bulls may see the current pullback as an opportunity. As the RSI sinks into the oversold area, the confluence of a previous daily swing high and the 20-day SMA at 1.2850 is the level to see if buyers would reemerge.
US Oil consolidates gains
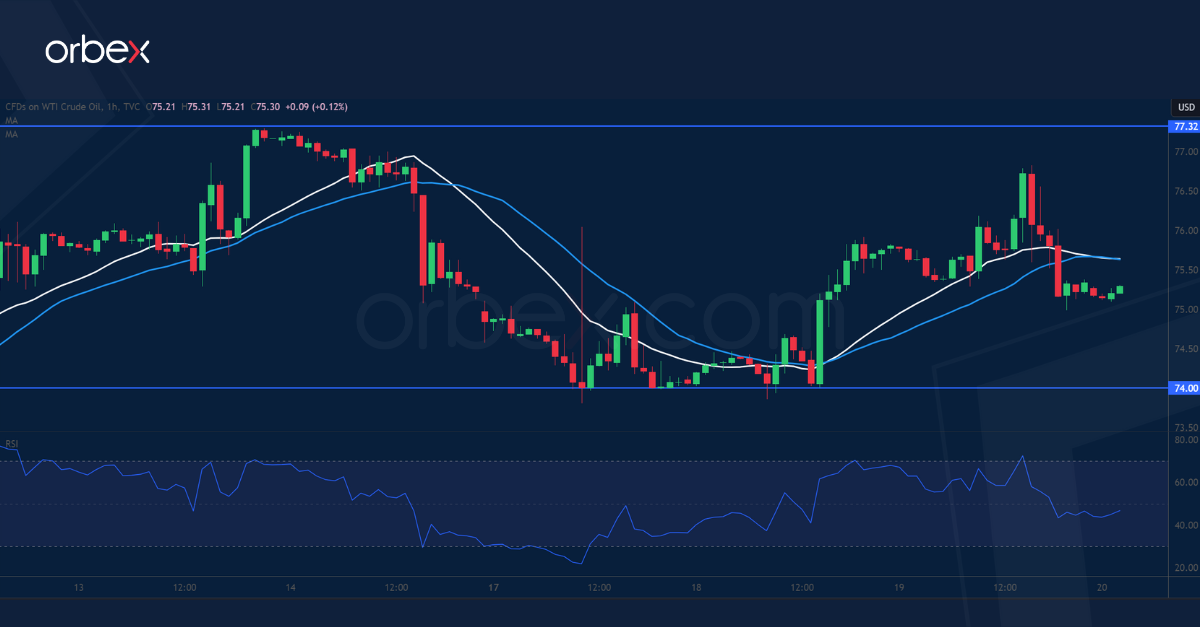
WTI crude rallies as the market becomes more optimistic over easing inflation. On the daily chart, a move above the major supply zone of 74.50 is a strong recovery signal by shifting the market mood to a brighter side. The rally has been fuelled by sellers looking to cover and momentum buyers jumping at the rebound opportunity. 74.00 is a fresh support and 77.30 is a recent top offering the bulls some breathing room and a break back above this level would extend the rally towards the psychological level of 80.00.
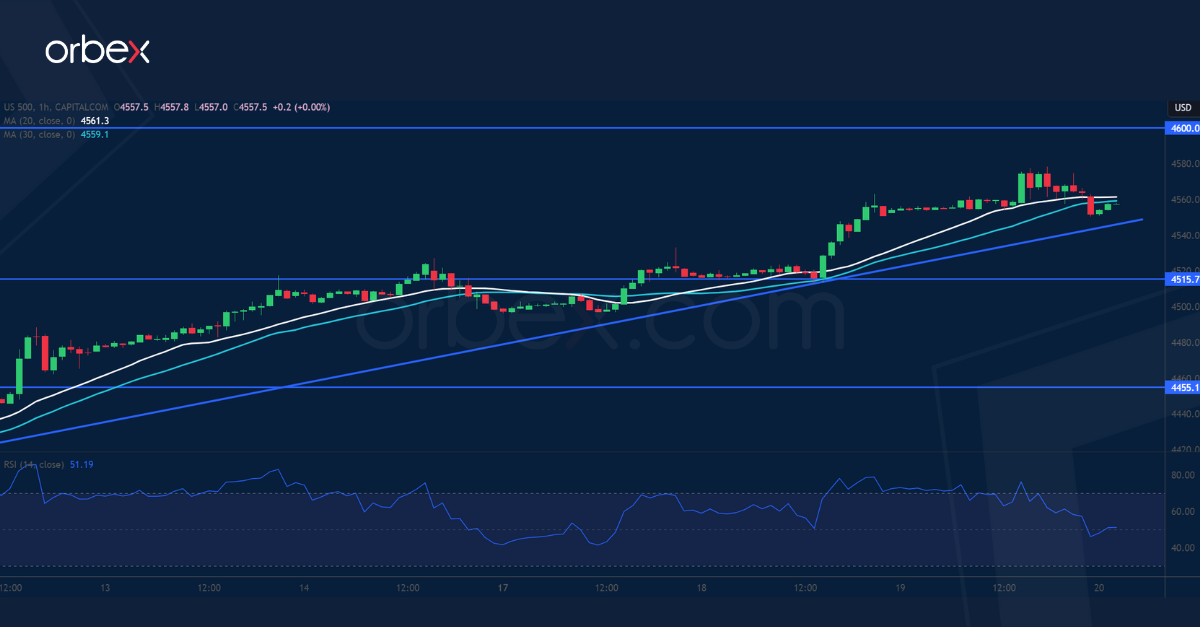
SPX 500 grinds rising trend line
The S&P 500 advances in the hope that the Fed will stop hiking rates soon. The rally accelerated after breaking above the previous daily top of 4455 and a rising trend line with a steep angle indicates a robust bullish pressure. From the daily chart’s perspective, the index is on its way to the March 2022’s high of 4640 with 4600 as an intermediate resistance. The RSI’s repeatedly overbought condition may temporarily limit the upward thrust if intraday buyers start to take profit. 4515 is the closest support should this happen.
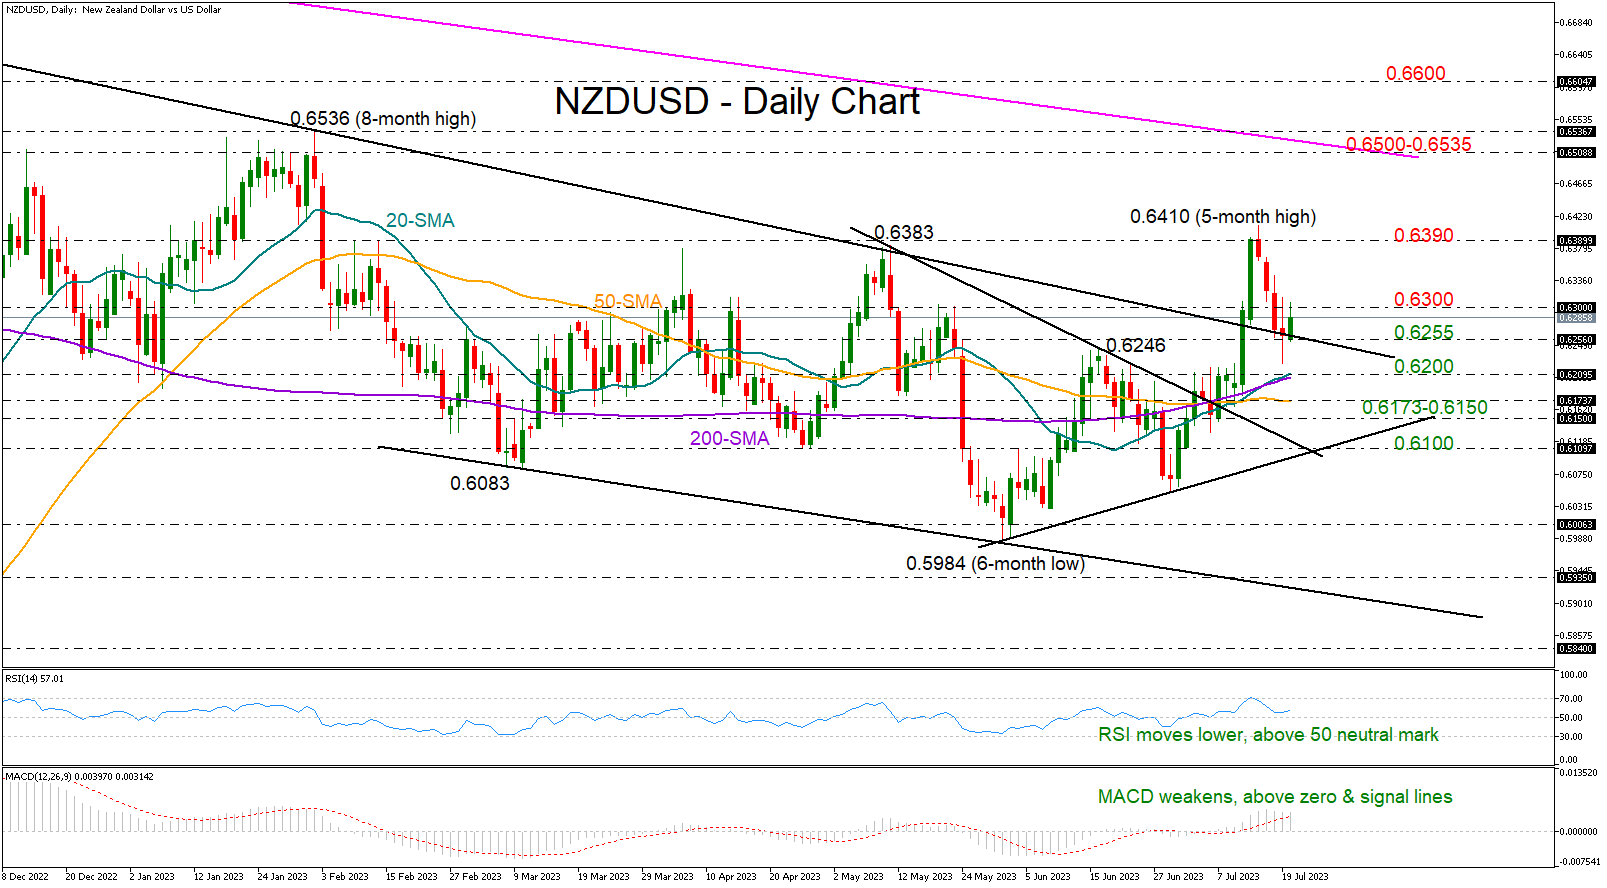
NZDUSD Defends Summer Uptrend
NZDUSD drifted higher on Thursday after four negative days, defending its summer uptrend above the 2022 resistance trendline and June’s high of 0.6246.
The RSI and the MACD have lost strength within the positive area, though they are still fluctuating above their neutral levels, keeping the risk skewed to the upside. Some optimism is also rising due to the double bullish crosses between the 20-day SMA and the longer-term SMAs, but traders will see if the crosses are lasting.
Should the pair close comfortably above Wednesday’s doji candlestick, and specifically above 0.6300, the recovery mood could strengthen towards last week’s bar of 0.6390. A continuation above 0.6400 could then target the 0.6500-0.6535 key resistance zone, where the crucial 2021 descending trendline is positioned. A decisive step above the latter would upgrade the long-term outlook from neutral to bullish, likely motivating fresh buying to 0.6600.
In the negative scenario, where the floor at 0.6255 cracks, the bears could re-challenge the 20- and 200-day SMAs around 0.6200. Even lower, the 50-day SMA at 0.6173 and the 0.6150 constraining area might prevent an aggressive downfall towards the tentative support trendline from June at 0.6100.
To sum up, NZDUSD could stay attractive to buyers if the 0.6255 floor stands firm, but for the pair to gain fresh impetus, the pair will need to climb above 0.6300.
Tesla, Netflix Down Post Earnings
Nasdaq futures are down this morning, by about 0.50% at the time of writing, after the afterhours trading session was shaken by results from two US tech giants: Tesla and Netflix. For both there was good and less good news.
Tesla’s price cuts that boosted sales and got the company to sell almost half a million cars less quarter, also squeezed its profit margins for the 3rd straight quarter to 9.6%. This number was almost 15% earlier this year. But Elon Musk said he believes this is the right choice still, and it certainly is. Tesla’s earnings jumped 20% and total revenue rose 47% - both better than expected. But the stock price fell more than 4% in the afterhours trading. Netflix on the other hand added 5.9 mio subscribers last quarter – more than double what was estimated by analysts - as banning password sharing encouraged people to … subscribe! Note that Netflix had its 2nd best quarter since the heart of the pandemic, yet, its sales and revenue fell short of expectations due to price cuts in some markets and the unfavourable exchange rate, while Q3 forecast disappointed, and the stock fell more than 8% in the afterhours trading. Netflix rally could pause after a 175% rally since last May but Hollywood strike and the deteriorating macro conditions are not all negative for Netflix. First, Netflix gets a big chunk of its content from outside the US and should help the streaming giant diversify risks from Hollywood, and second, as the living crisis in some parts of the world gets worse, people could be tempted to stay home and watch Netflix. Plus, it is said that with competition tightening its purse’s strings, Netflix could find itself with less competition too. Pricewise, it could be time for a downside correction in Netflix which actually trades in overbought market conditions, but price pullbacks could also serve as interesting entry opportunities for further gains. Though, we all know that this quarter’s jump in subscriptions was probably a one-off jump, making it hard to predict how the numbers be impacted in the next few quarters.
Apple also made headlines yesterday, as news that it’s quietly working on generative AI called ‘Ajax’ but that employees call Apple GPT, pleased investors sent Apple just a few points below the $200 mark yesterday. Microsoft and Google fell more than 1% on the news. But Apple doesn’t have a clear strategy for releasing the technology to customers, and no matter what they say, ChatGPT’s arrival was like a bomb, and it will be hard to dethrone Microsoft with a bigger bang soon.
On the banks front, well Goldman Sachs was right warning investors that it was going to have a BAD quarter, because it really had a BAD one. I mean its earnings slumped 58% last quarter on investment banking – the worst among the big US banks and the return on equity – the key measure of profitability - fell 4%. That was also the worst among the big US banks. But happily, investors were prepared for the bad news and barely reacted. The bank shares will likely come under pressure in the coming weeks in expectation of tighter capital rules.
Overall, the S&P500 and Nasdaq both extended gains yesterday but we could see some consolidation and downside correction today. The US 2-year yield remains steady around 4.70/4.80% range, as Federal Reserve (Fed) officials are in their quiet period before the next policy meeting and can’t insist that there will be more rate hikes on horizon! The US dollar index consolidates and slightly corrects near the overbought territory. The dollar-yen tested the 140 resistance, again, on the back of softening Bank of Japan (BoJ) expectations with no more than a fifth of forecasters predicting that the BoJ will adjust its YCC policy this July. The new governor Ueda is sticking to easy policy and the improved functioning of the bond market doesn’t call for urgent action. October is now the month that investors expect a change to happen.
Cable tipped a toe below the 1.29 mark yesterday after the latest inflation figures came in softer than expected yesterday morning and helped traders trim a 50bp hike expectation for the next meeting. While the euro took the opposite direction, after the core CPI came in higher than expected, at 5.5% in June. The latter somehow pushed back the European Central Bank (ECB) doves that were boosted earlier this week by comments from ECB’s Knot that a rate hike beyond the next policy meeting is all but guaranteed.
In commodities, wheat futures were up 8.5% yesterday as Russia fuels tensions in the Black Sea. Russian Defense ministry said that all vessels in the Back Sea heading to Ukrainian ports will be considered potential carriers of military cargo starting from today.
EUR/AUD Daily Outlook
Daily Pivots: (S1) 1.6475; (P) 1.6539; (R1) 1.6610; More...
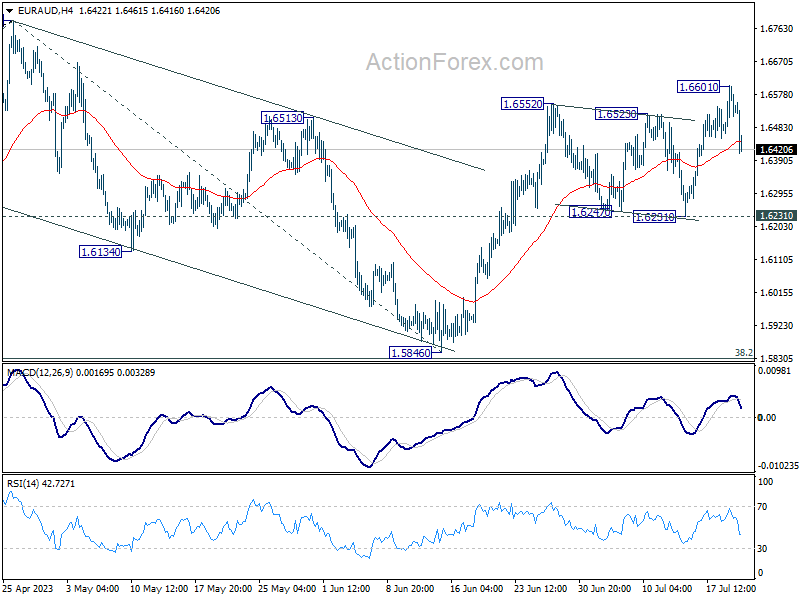
EUR/AUD retreated quickly after edging higher to 1.6601 and intraday bias remains neutral for the moment. Further rally will remain in favor as long as 1.6231 support holds. As noted before, correction from 1.6785 should have completed with three waves down to 1.5846. Above 1.6601 will resume the rise from 1.5864 to retest 1.6785 high next.
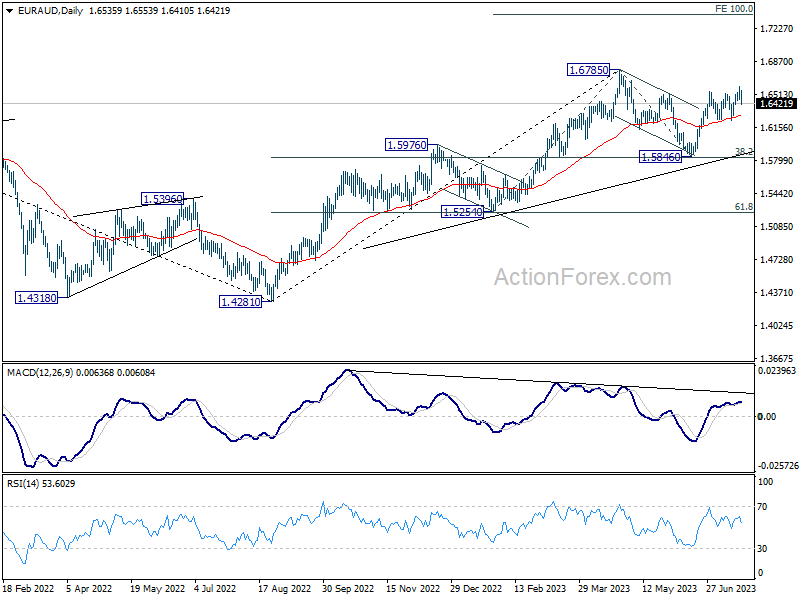
In the bigger picture, with 38.2% retracement of 1.4281 to 1.6785 at 1.5828 intact, rally from 1.4281 is still in progress. Firm break of 1.6785 will confirm rise resumption. Next target is 100% projection of 1.5254 to 1.6785 from 1.5846 at 1.7377. On the other hand, rejection by 1.6785 will extend the corrective pattern with another fall leg. But outlook will stay bullish as long as 1.5828 holds.
EUR/GBP Daily Outlook
Daily Pivots: (S1) 0.8608; (P) 0.8655; (R1) 0.8703; More...
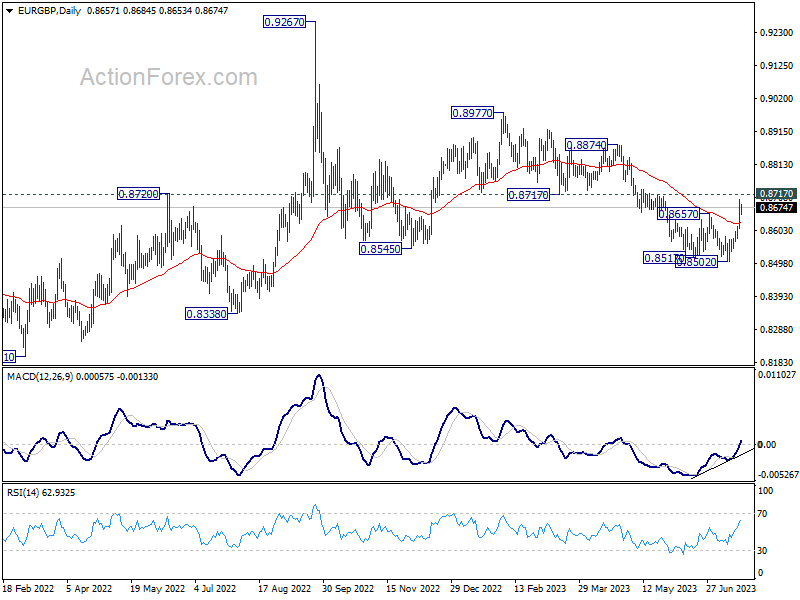
Intraday bias in EUR/GBP remains on the upside at this point. Current development argues that fall from 0.8977 might have completed its five-wave sequence. Firm break of 0.8717 support resistance will solidify this bullish case and target 0.8977 resistance next. On the downside, though, below 0.8619 minor support will mix up the outlook and turn intraday bias neutral first.
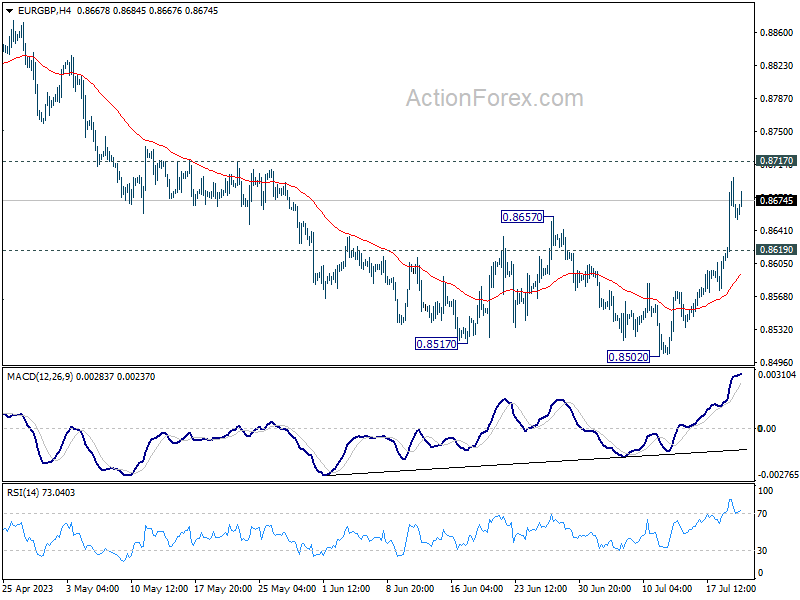
In the bigger picture, the down trend from 0.9267 (2022 high) is seen as part of the long term range pattern from 0.9499 (2020 high). Firm break of 0.8717 support turned resistance will argue that it has completed with three waves down to 0.8502. Further break of 0.8977 will bring retest o f0.9267 high. Nevertheless, break of 0.8502 will resume the decline towards 0.8201 (2022 low).
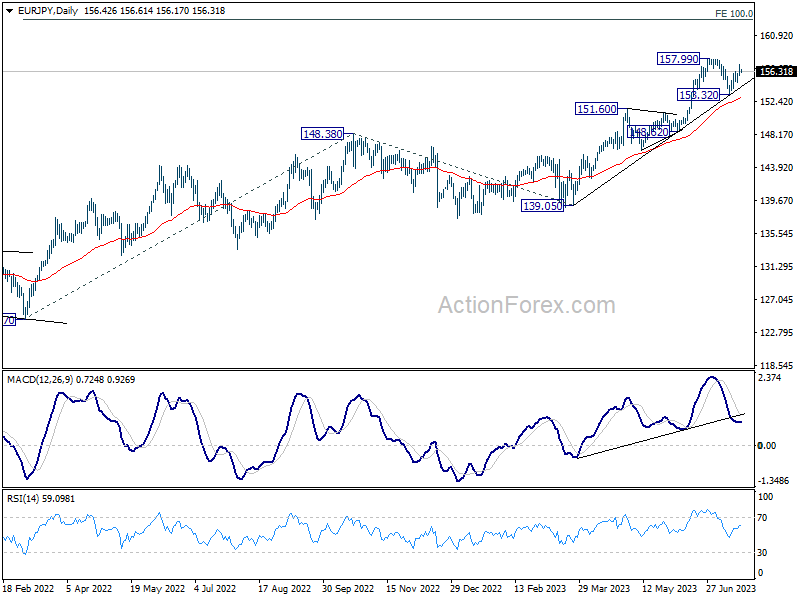
EUR/JPY Daily Outlook
Daily Pivots: (S1) 155.72; (P) 156.46; (R1) 157.23; More....
Intraday bias in EUR/JPY remains on the upside at this point. Rebound from 153.32 is in progress to retest 157.99 high. Firm break there will resume larger up trend. On the downside, below 154.86 minor support should resume the corrective fall from 157.99 through 153.32 support, to 55 D EMA (now at 153.00) and below.
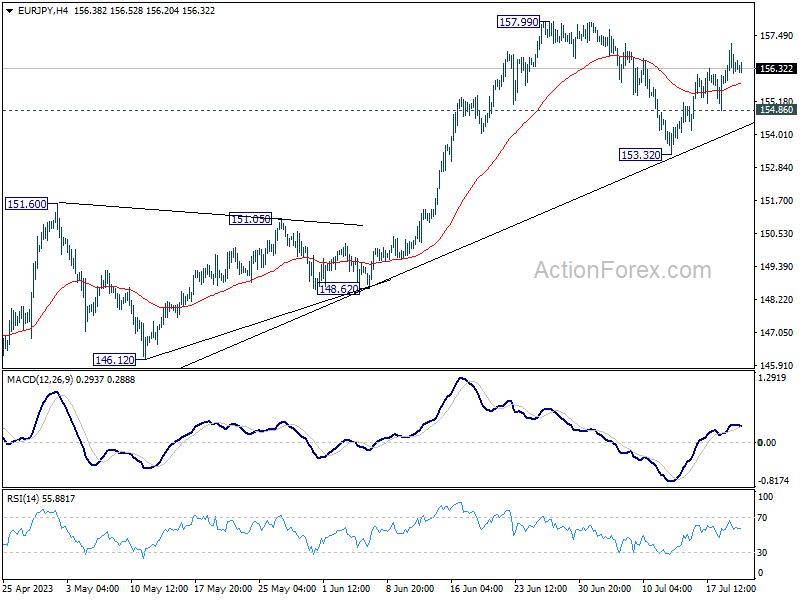
In the bigger picture, as long as 151.60 resistance turned support holds, rise from 114.42 (2020 low) is in progress. On resumption, next target is 100% projection of 124.37 to 148.38 from 138.81 at 162.82. Nevertheless, sustained break of 151.60 will argue that larger correction is already underway.