Sample Category Title
Australia June Labour Force: Showing Few Signs of Letting Up
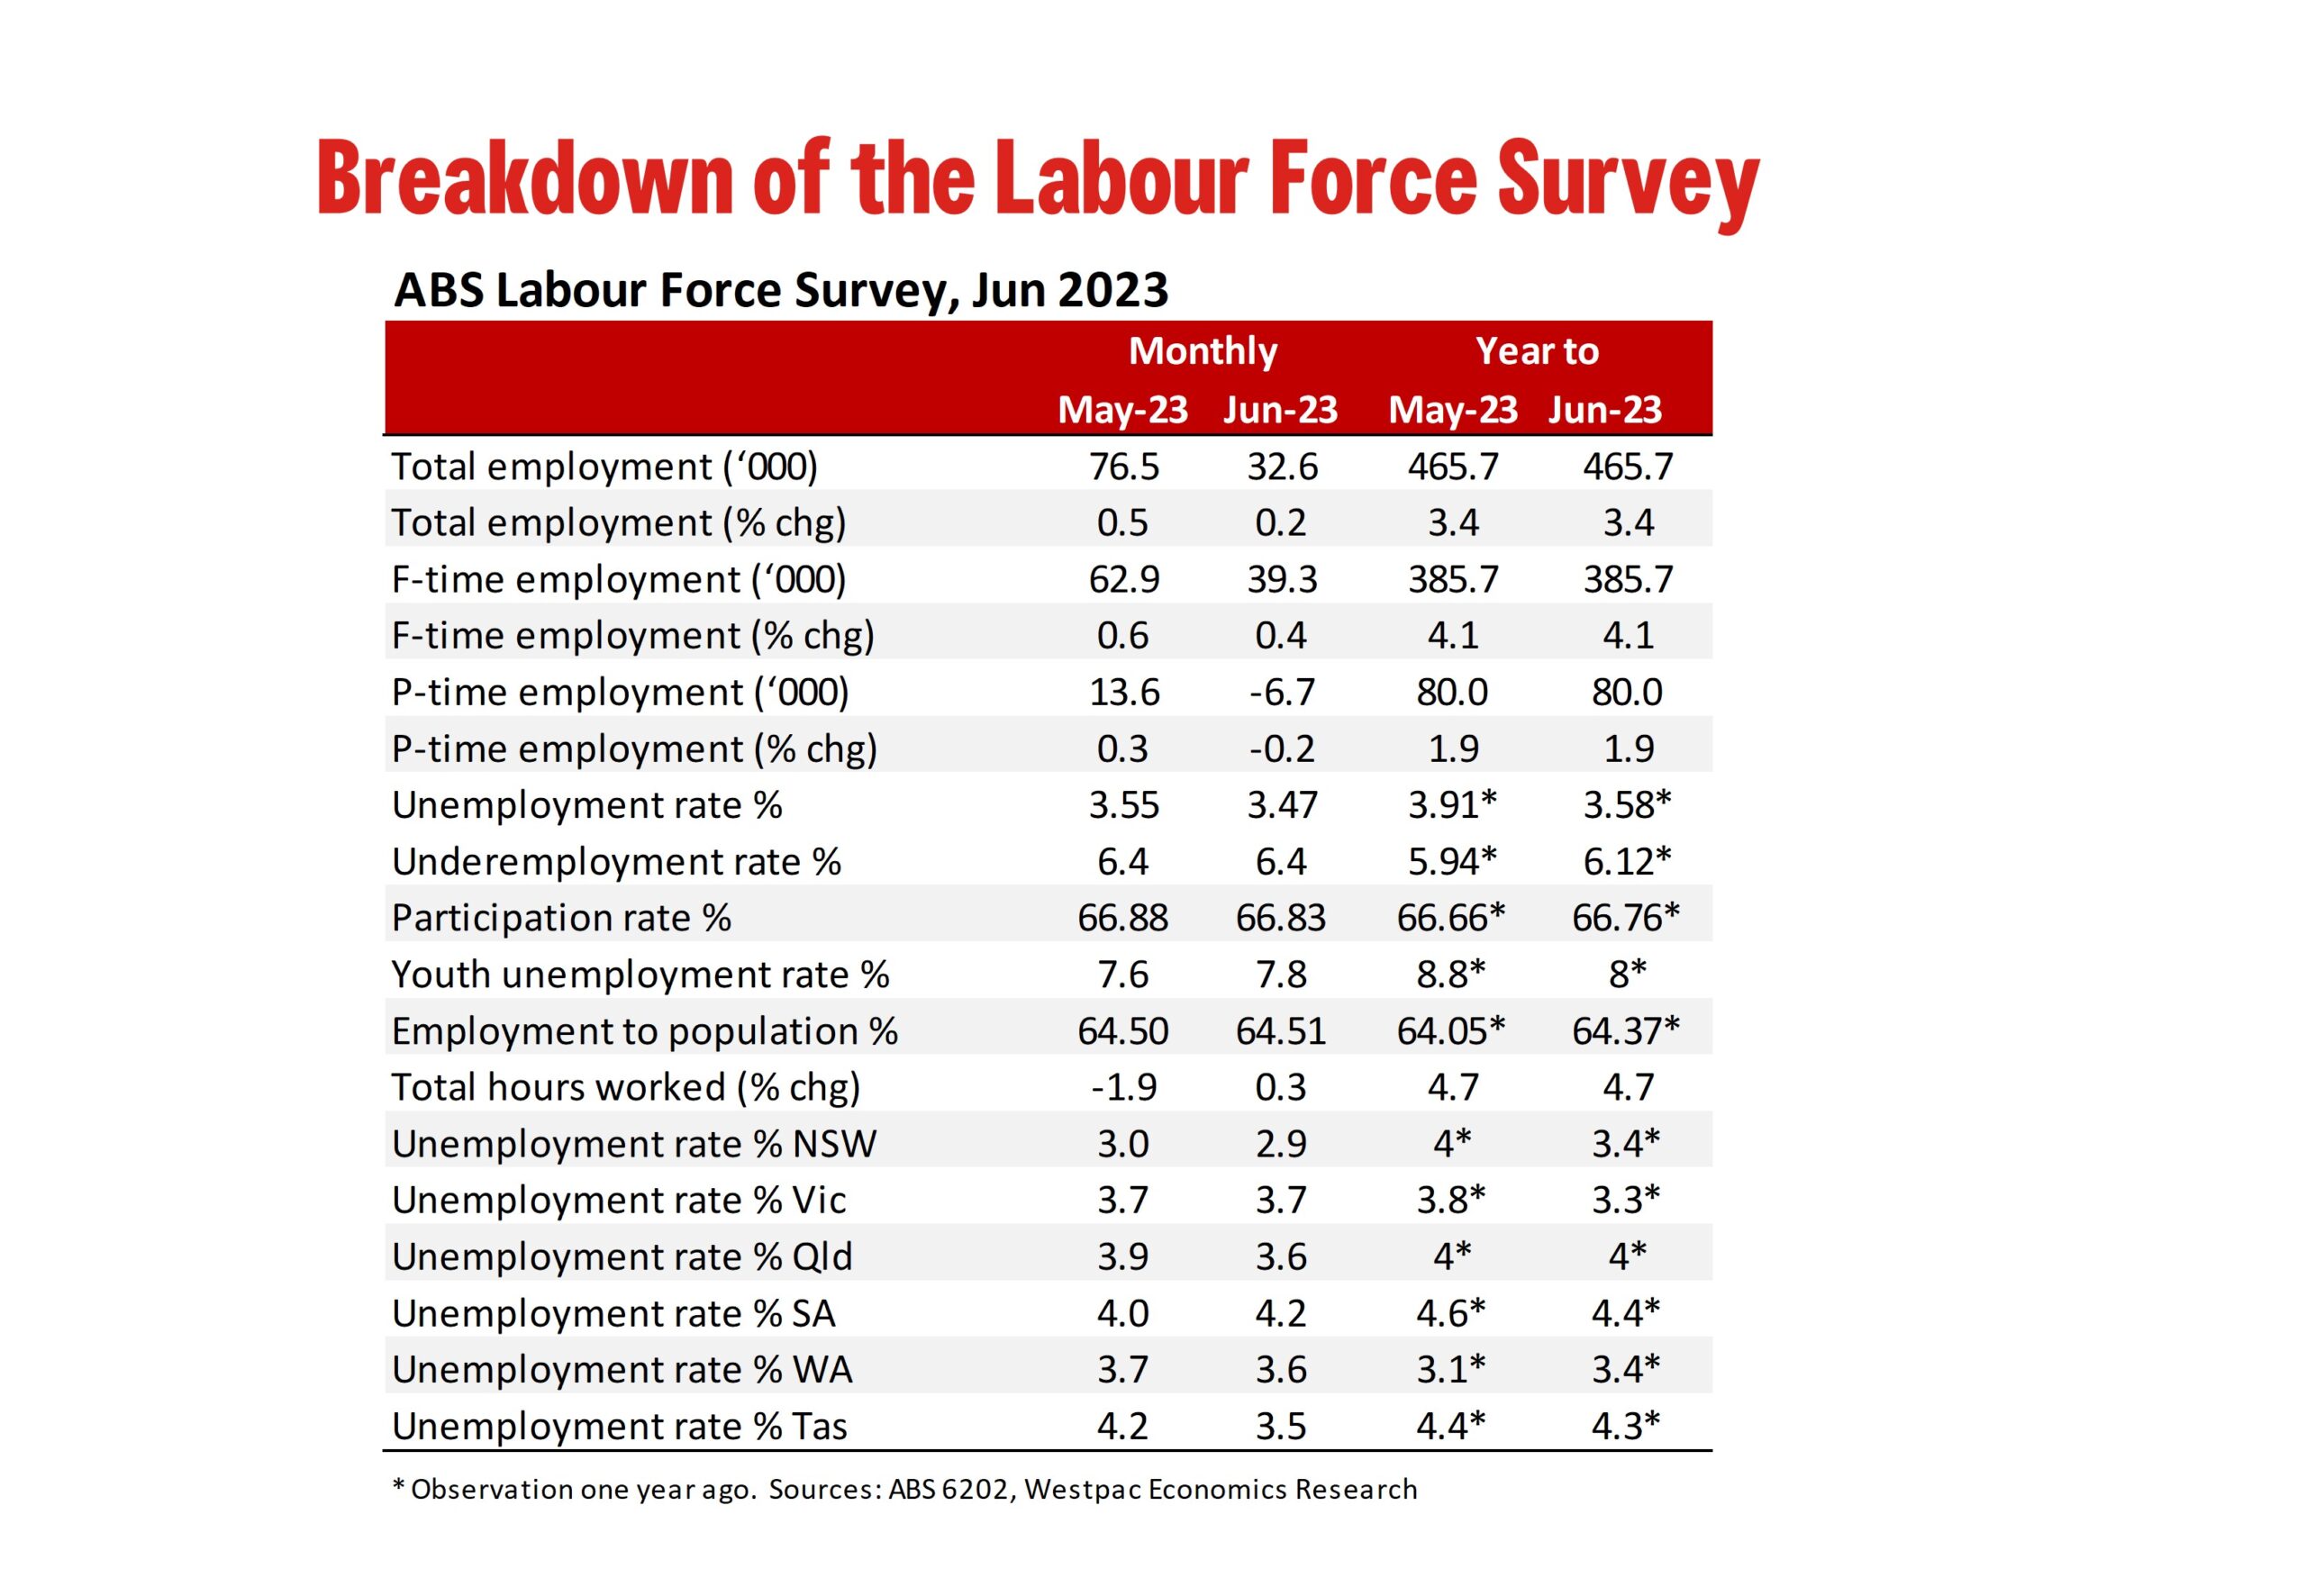
Total employment: +32.6k from +76.5k (revised up from +75.9k); unemployment rate: 3.5% from 3.5% (revised down from 3.6%); participation rate: 66.8% from 66.9%.
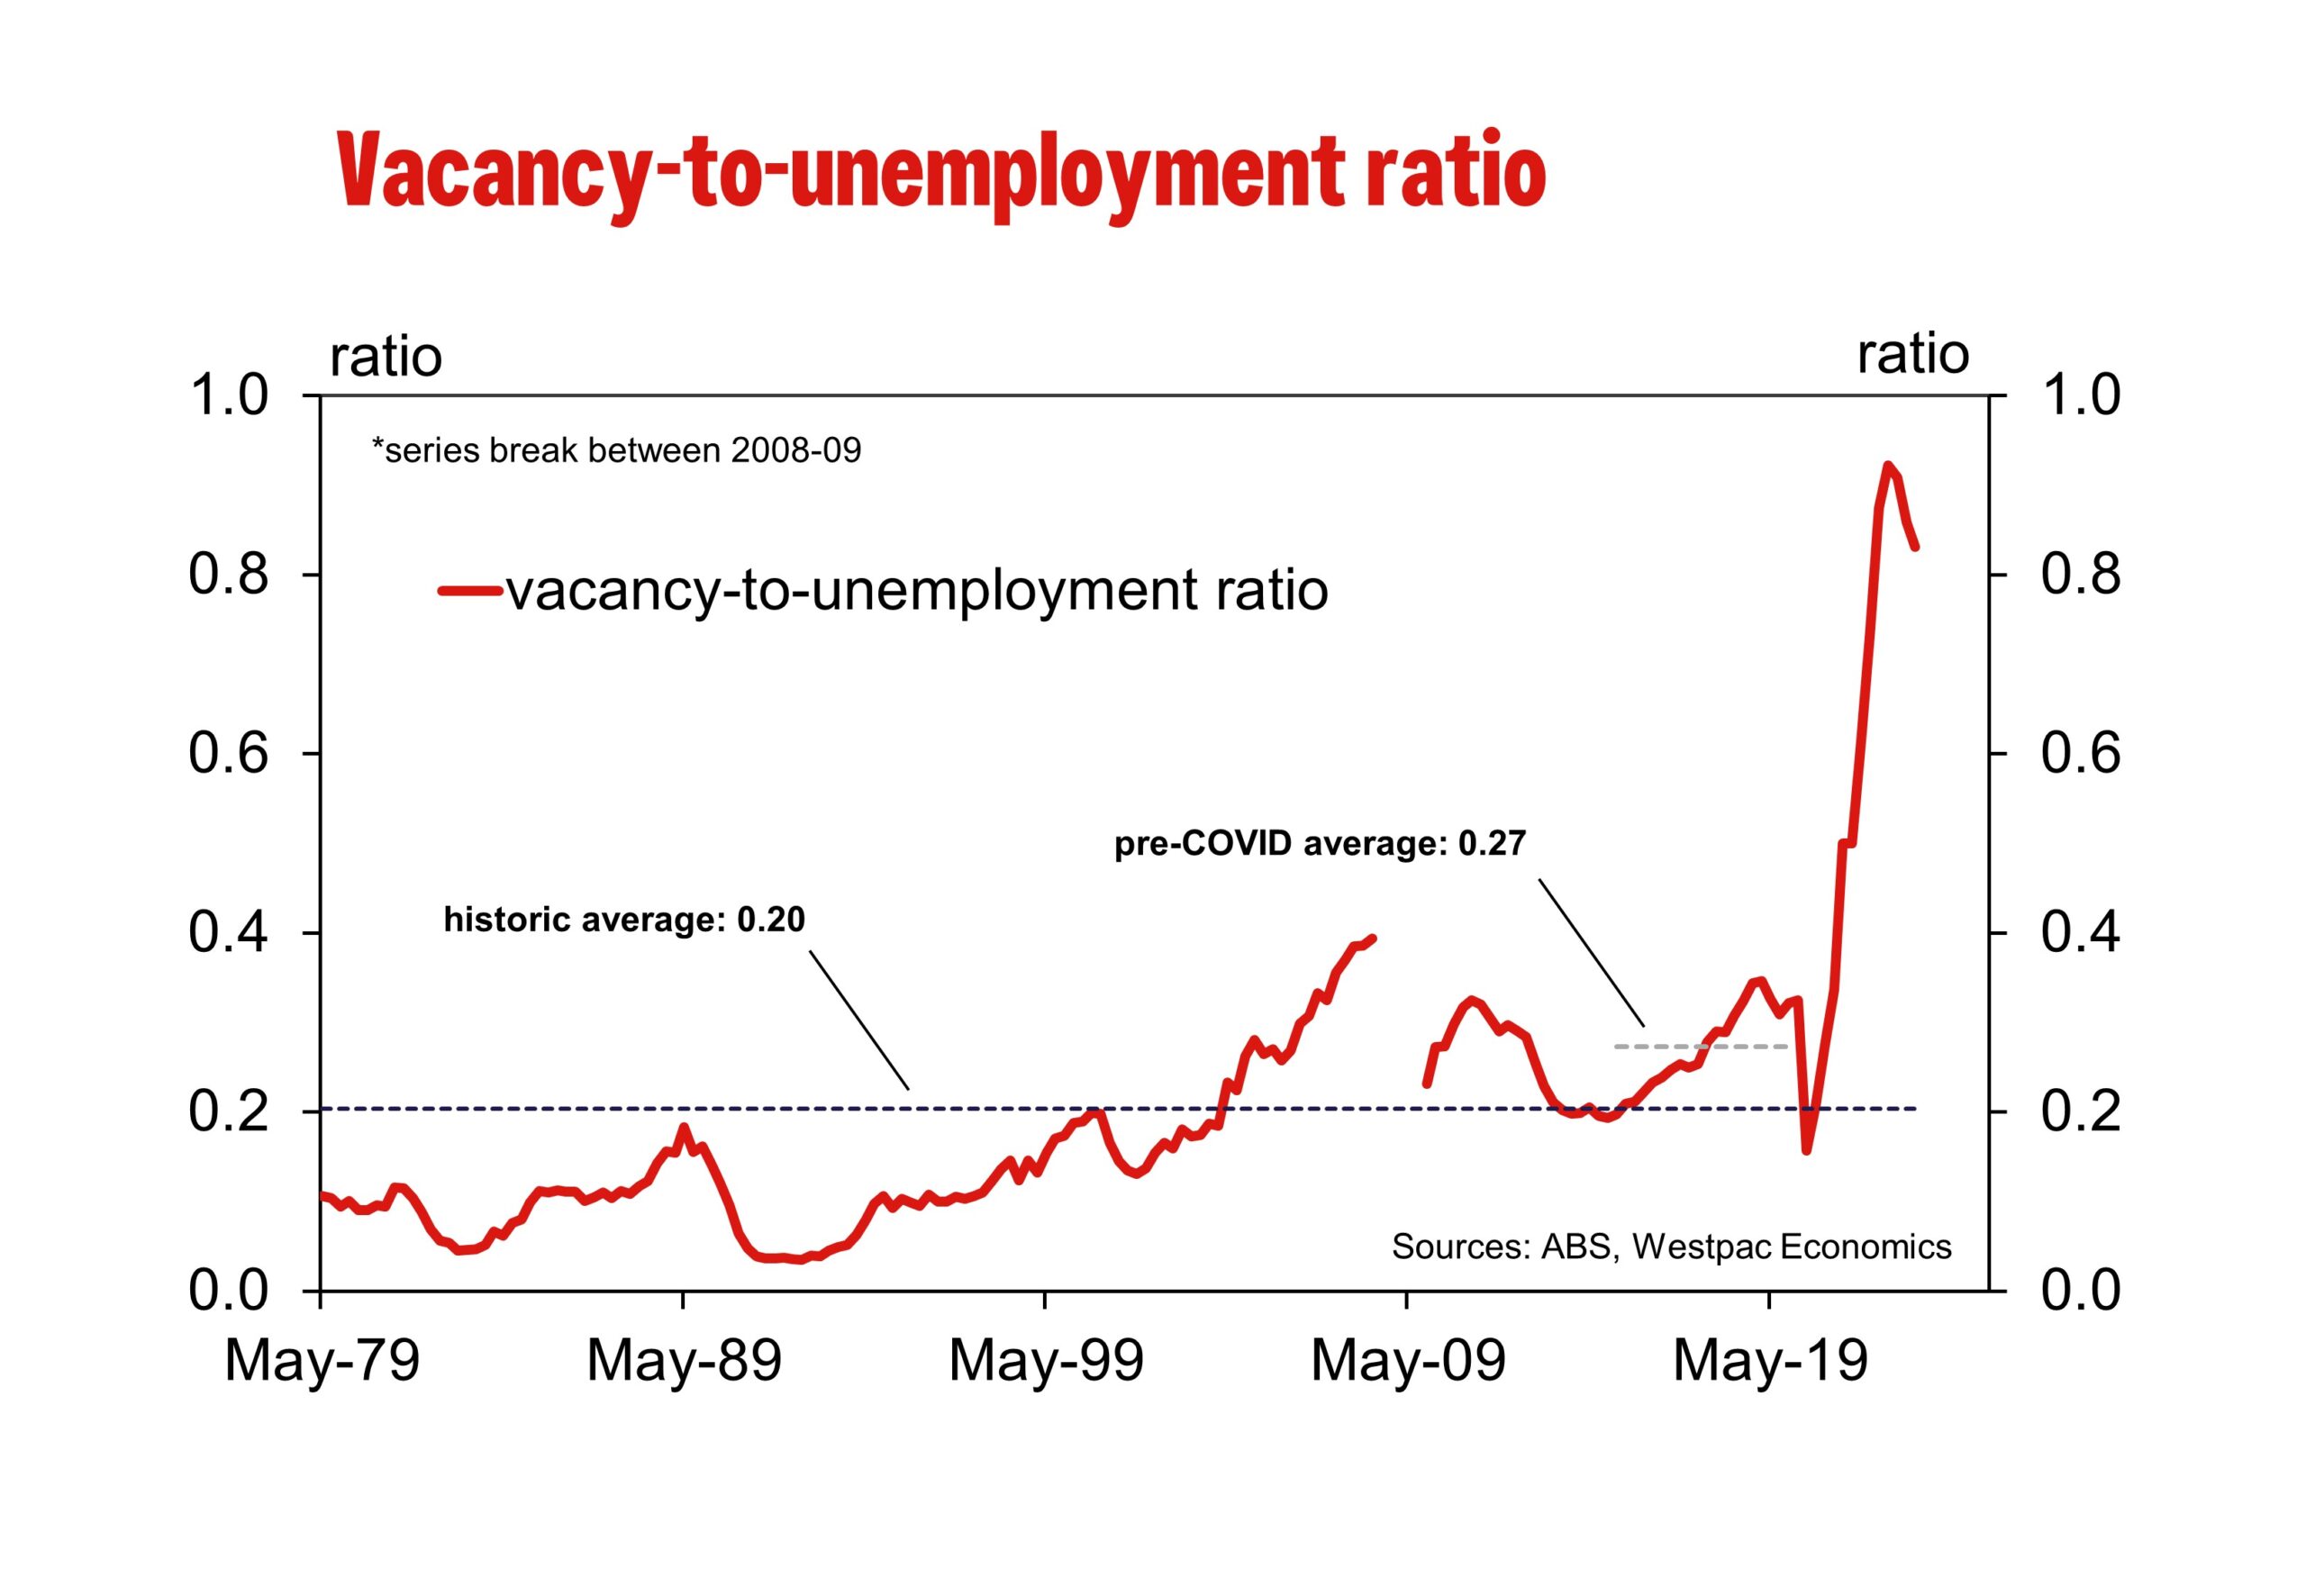
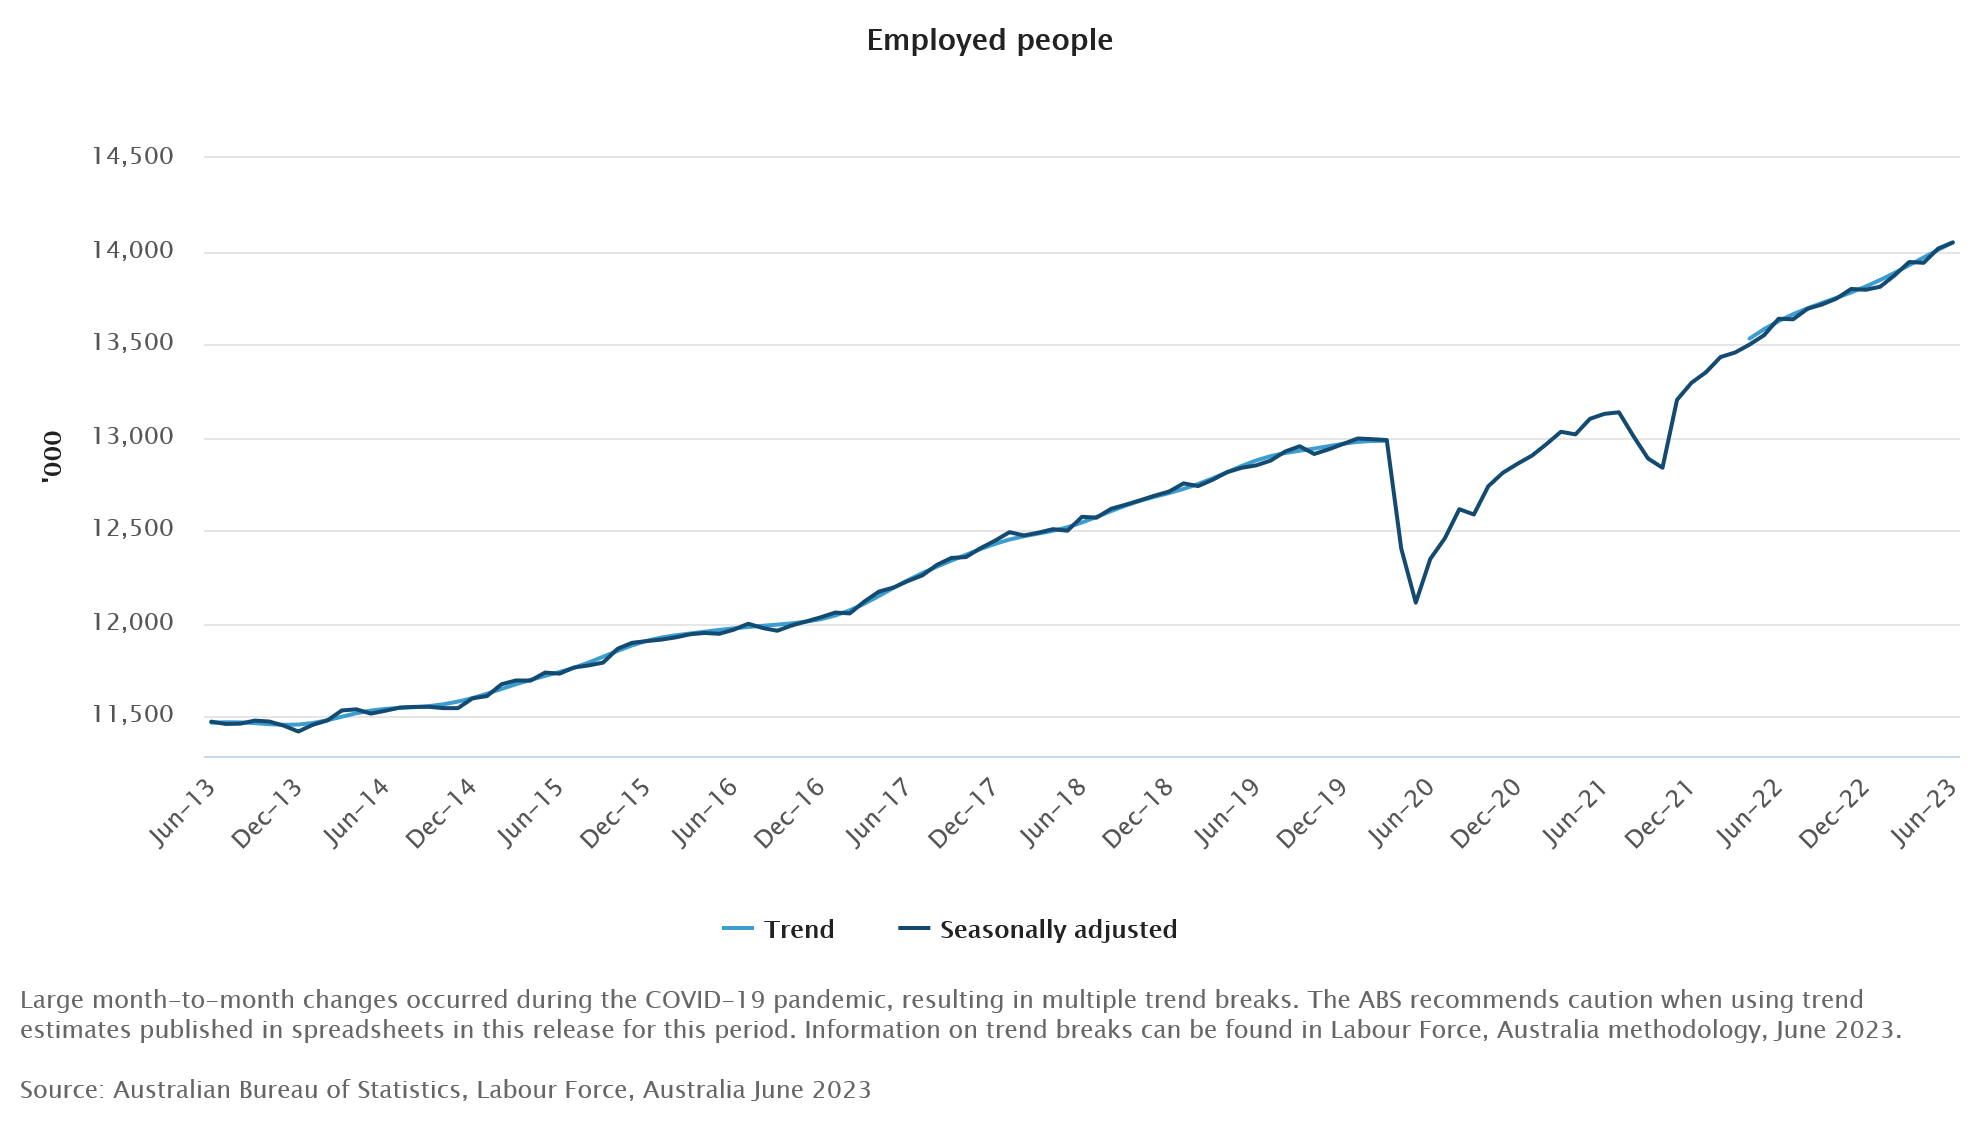
In June, employment gained 32.6k, or 0.2%, slightly higher than Westpac’s forecast for a +25k lift, but well above the market median forecast for a more modest +15k increase. Over the first half of 2023 the pace of employment growth has held up to a remarkable degree, the three-month average change still above +40k/mth. This is much higher than the pace seen over the second half of 2022 (+26k/mth), and almost exactly on par with the pace seen over last year as a whole (+42k).
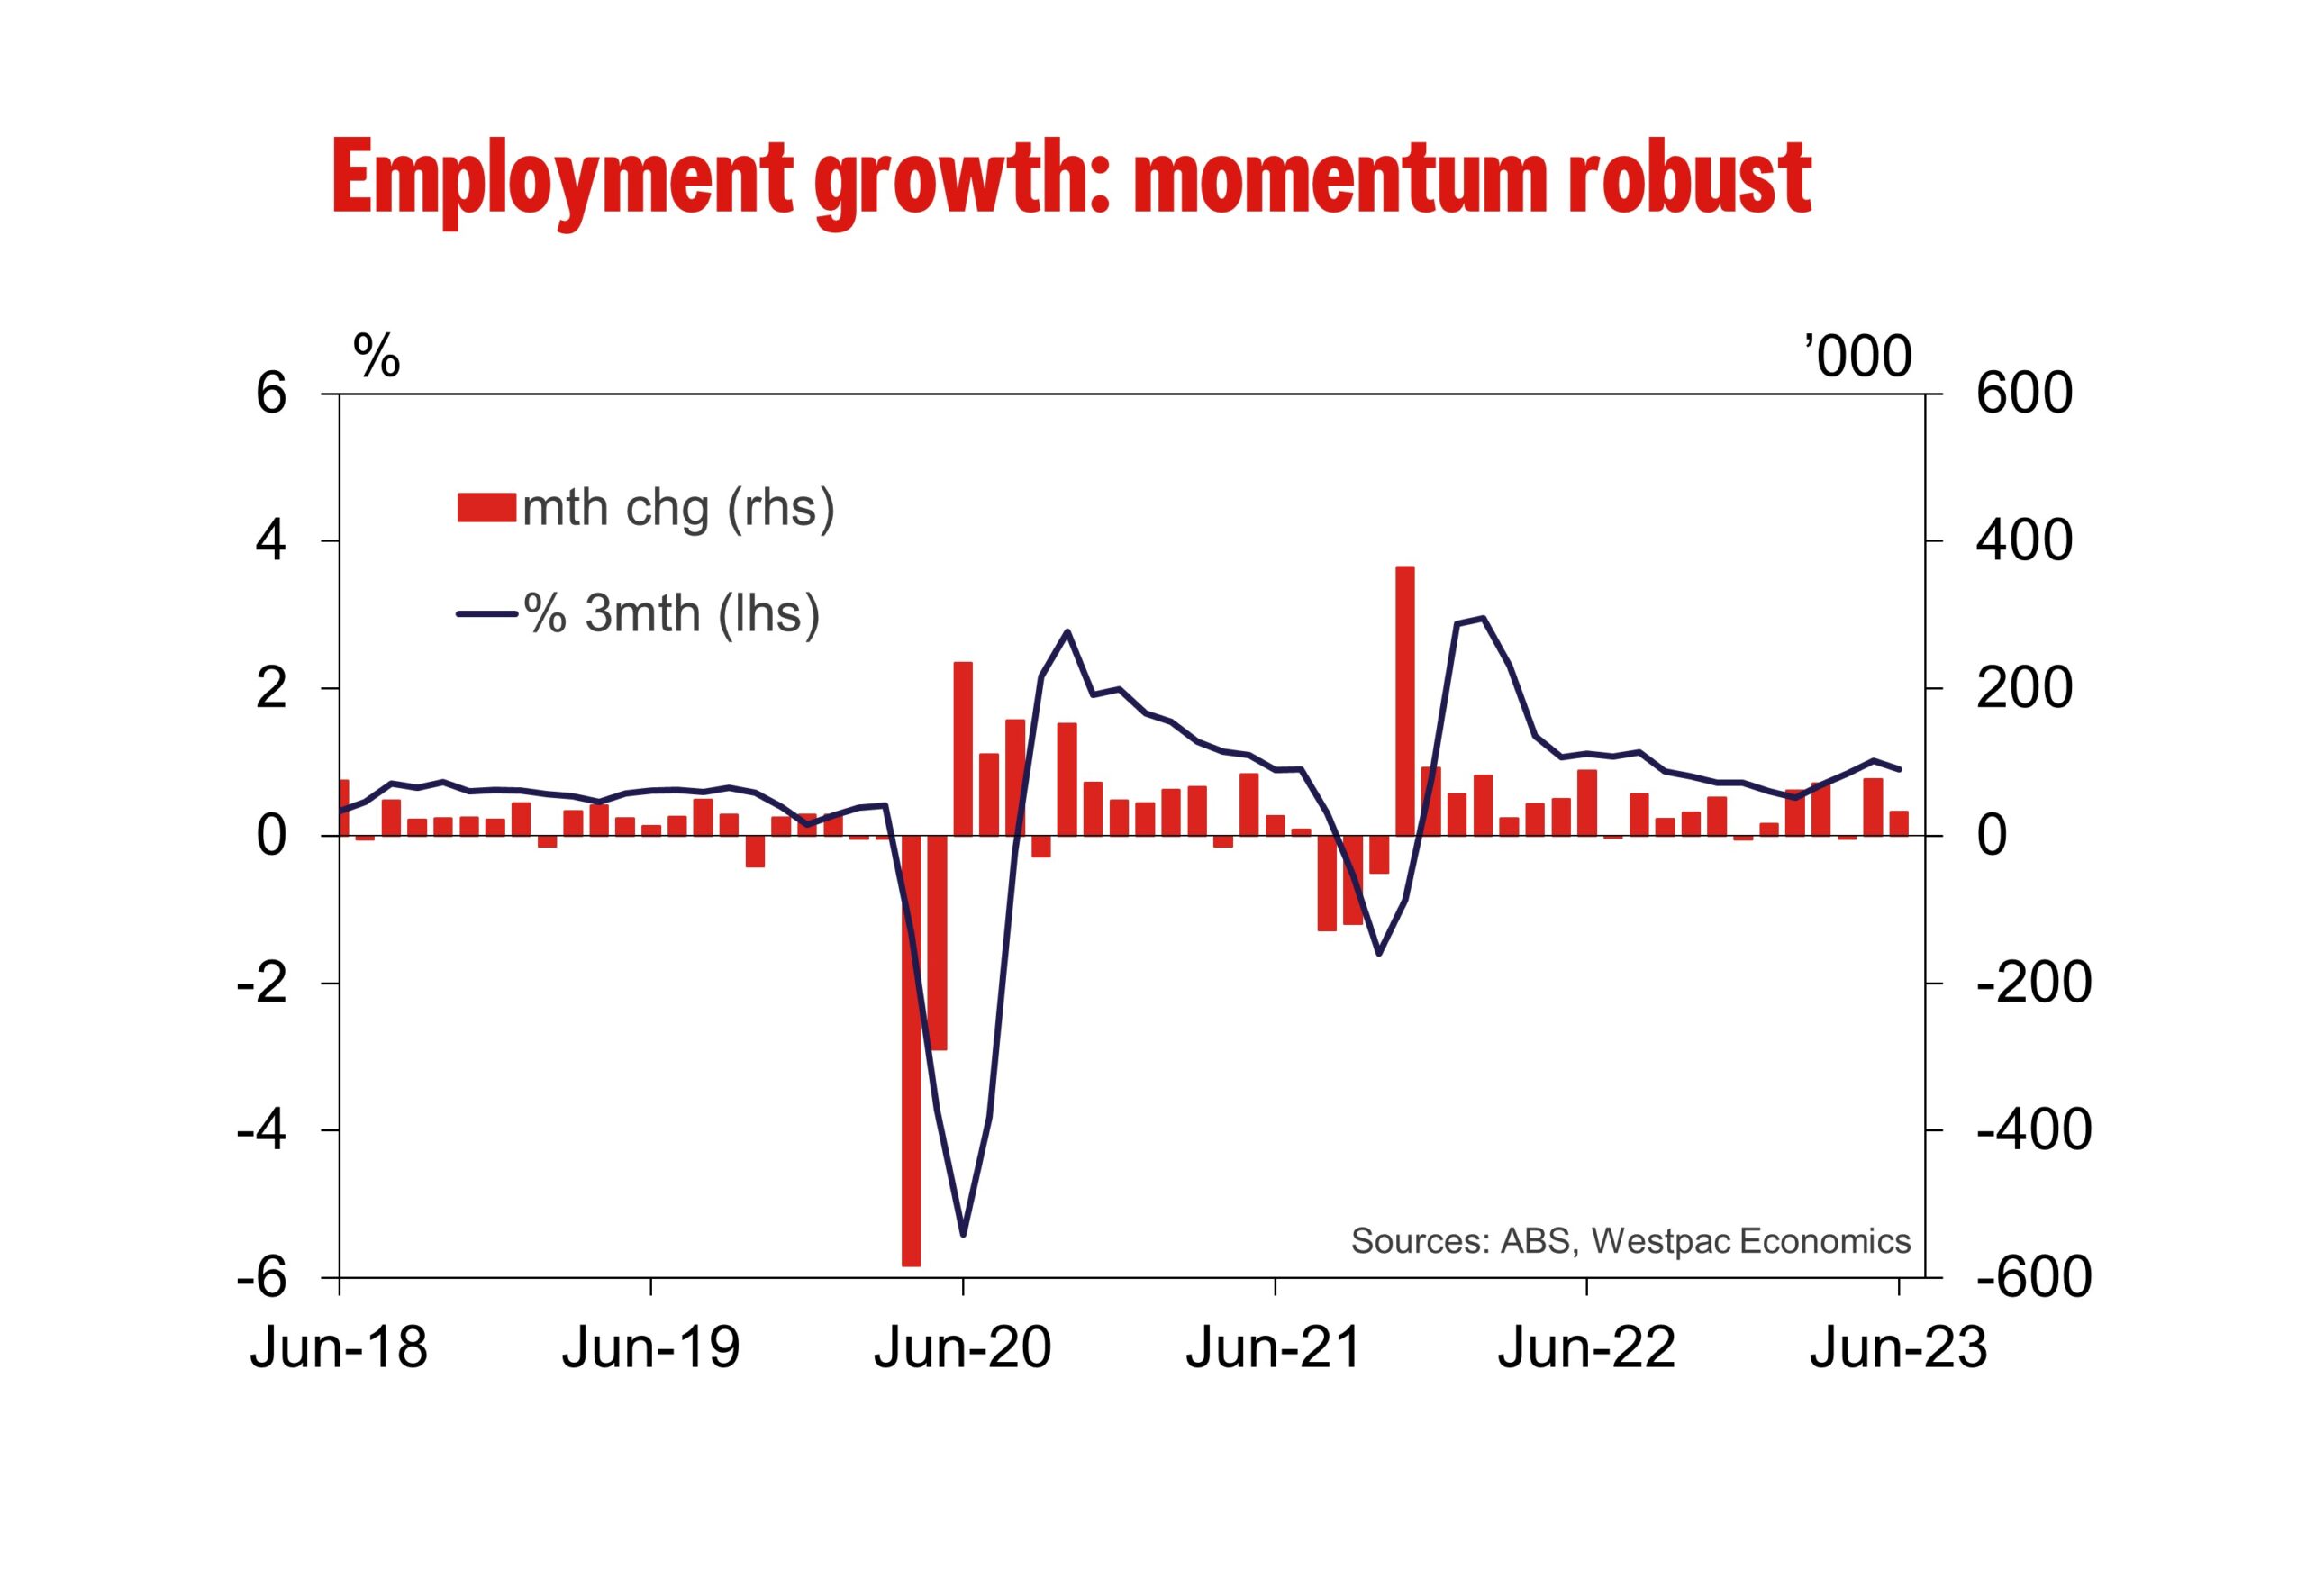
While the pace of employment growth has shown very few signs of letting up, this has not compromised the quality of jobs growth being seen. Around 86% of new jobs over the last six months have been for full-time work as opposed to part-time work, full-time having risen +218.4k year-to-date compared to the +35.9k year-to-date gain for part-time.
This is not wholly different to the dynamics seen during the earlier stages of employment’s recovery from COVID-19, but it stands out in contrast to the pre-pandemic years, when full-time employment constituted only a slighter majority of jobs growth (~60%).
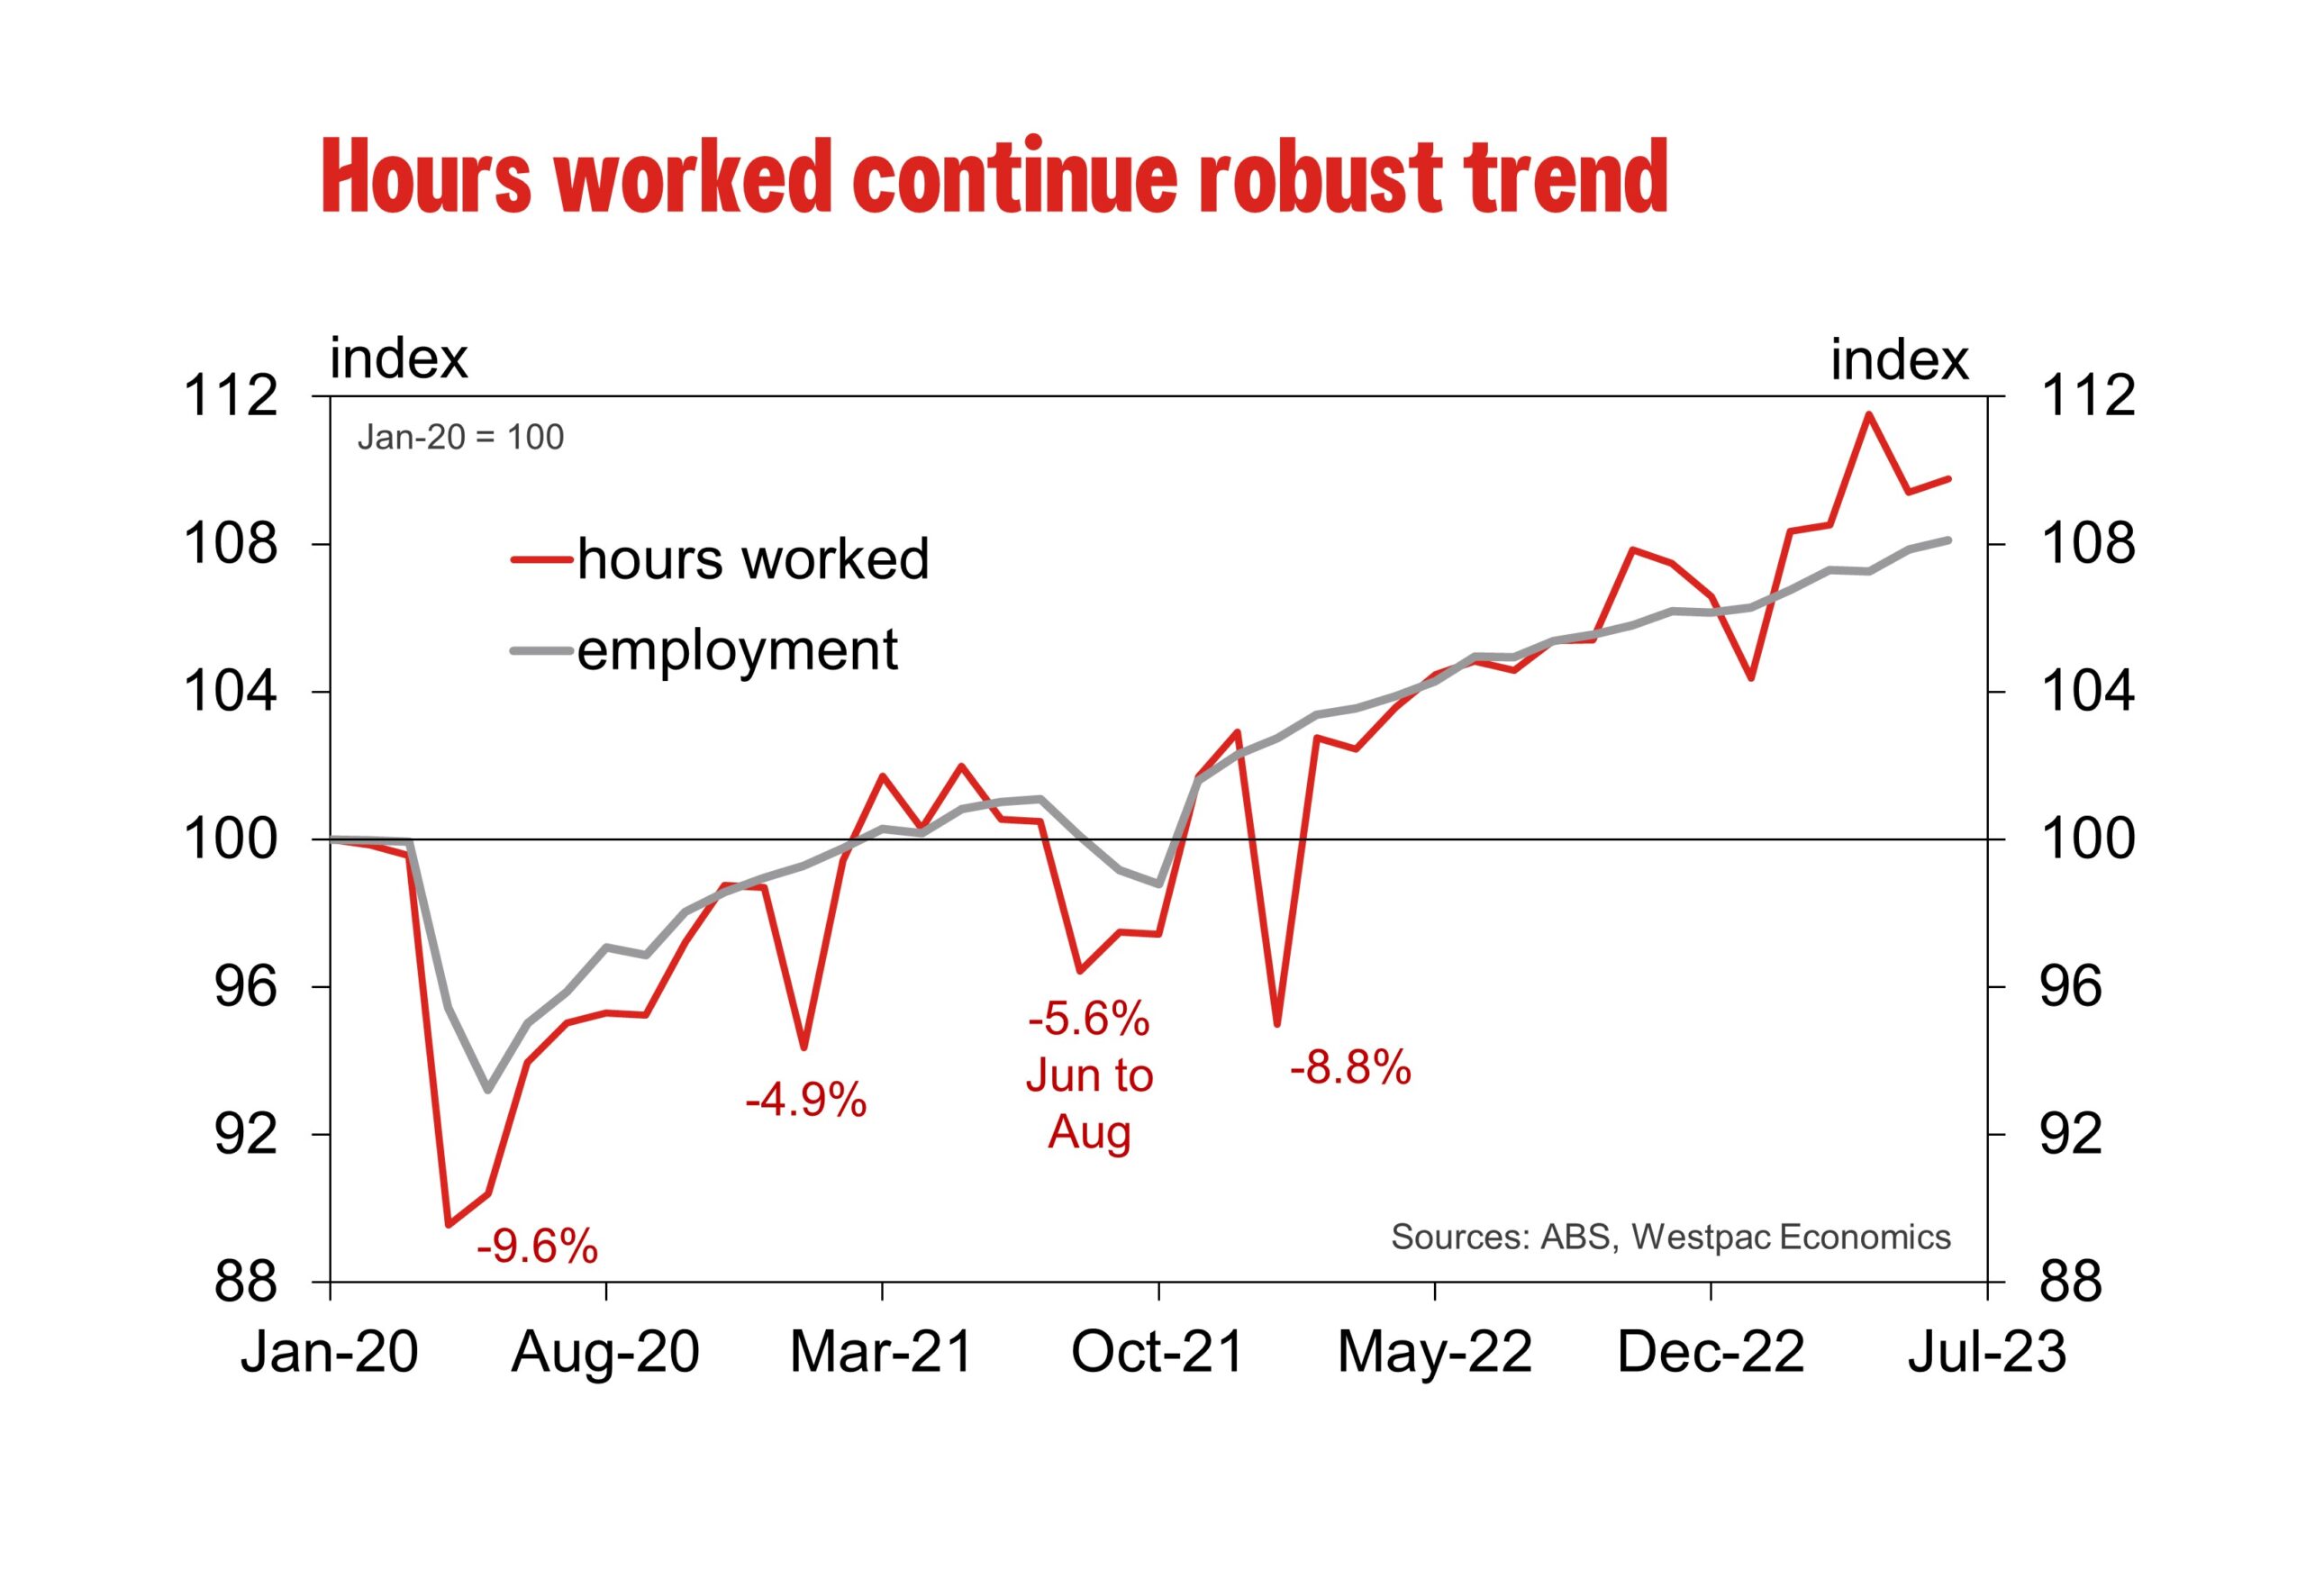
Emphasising this point further, seasonally adjusted hours worked remains in a strong up-trend, once again exceeding the growth in employment with a 0.3% lift in June. Having risen 3.0% year-to-date, the gains in hours worked is well above what observed over the same period last year (1.9%).
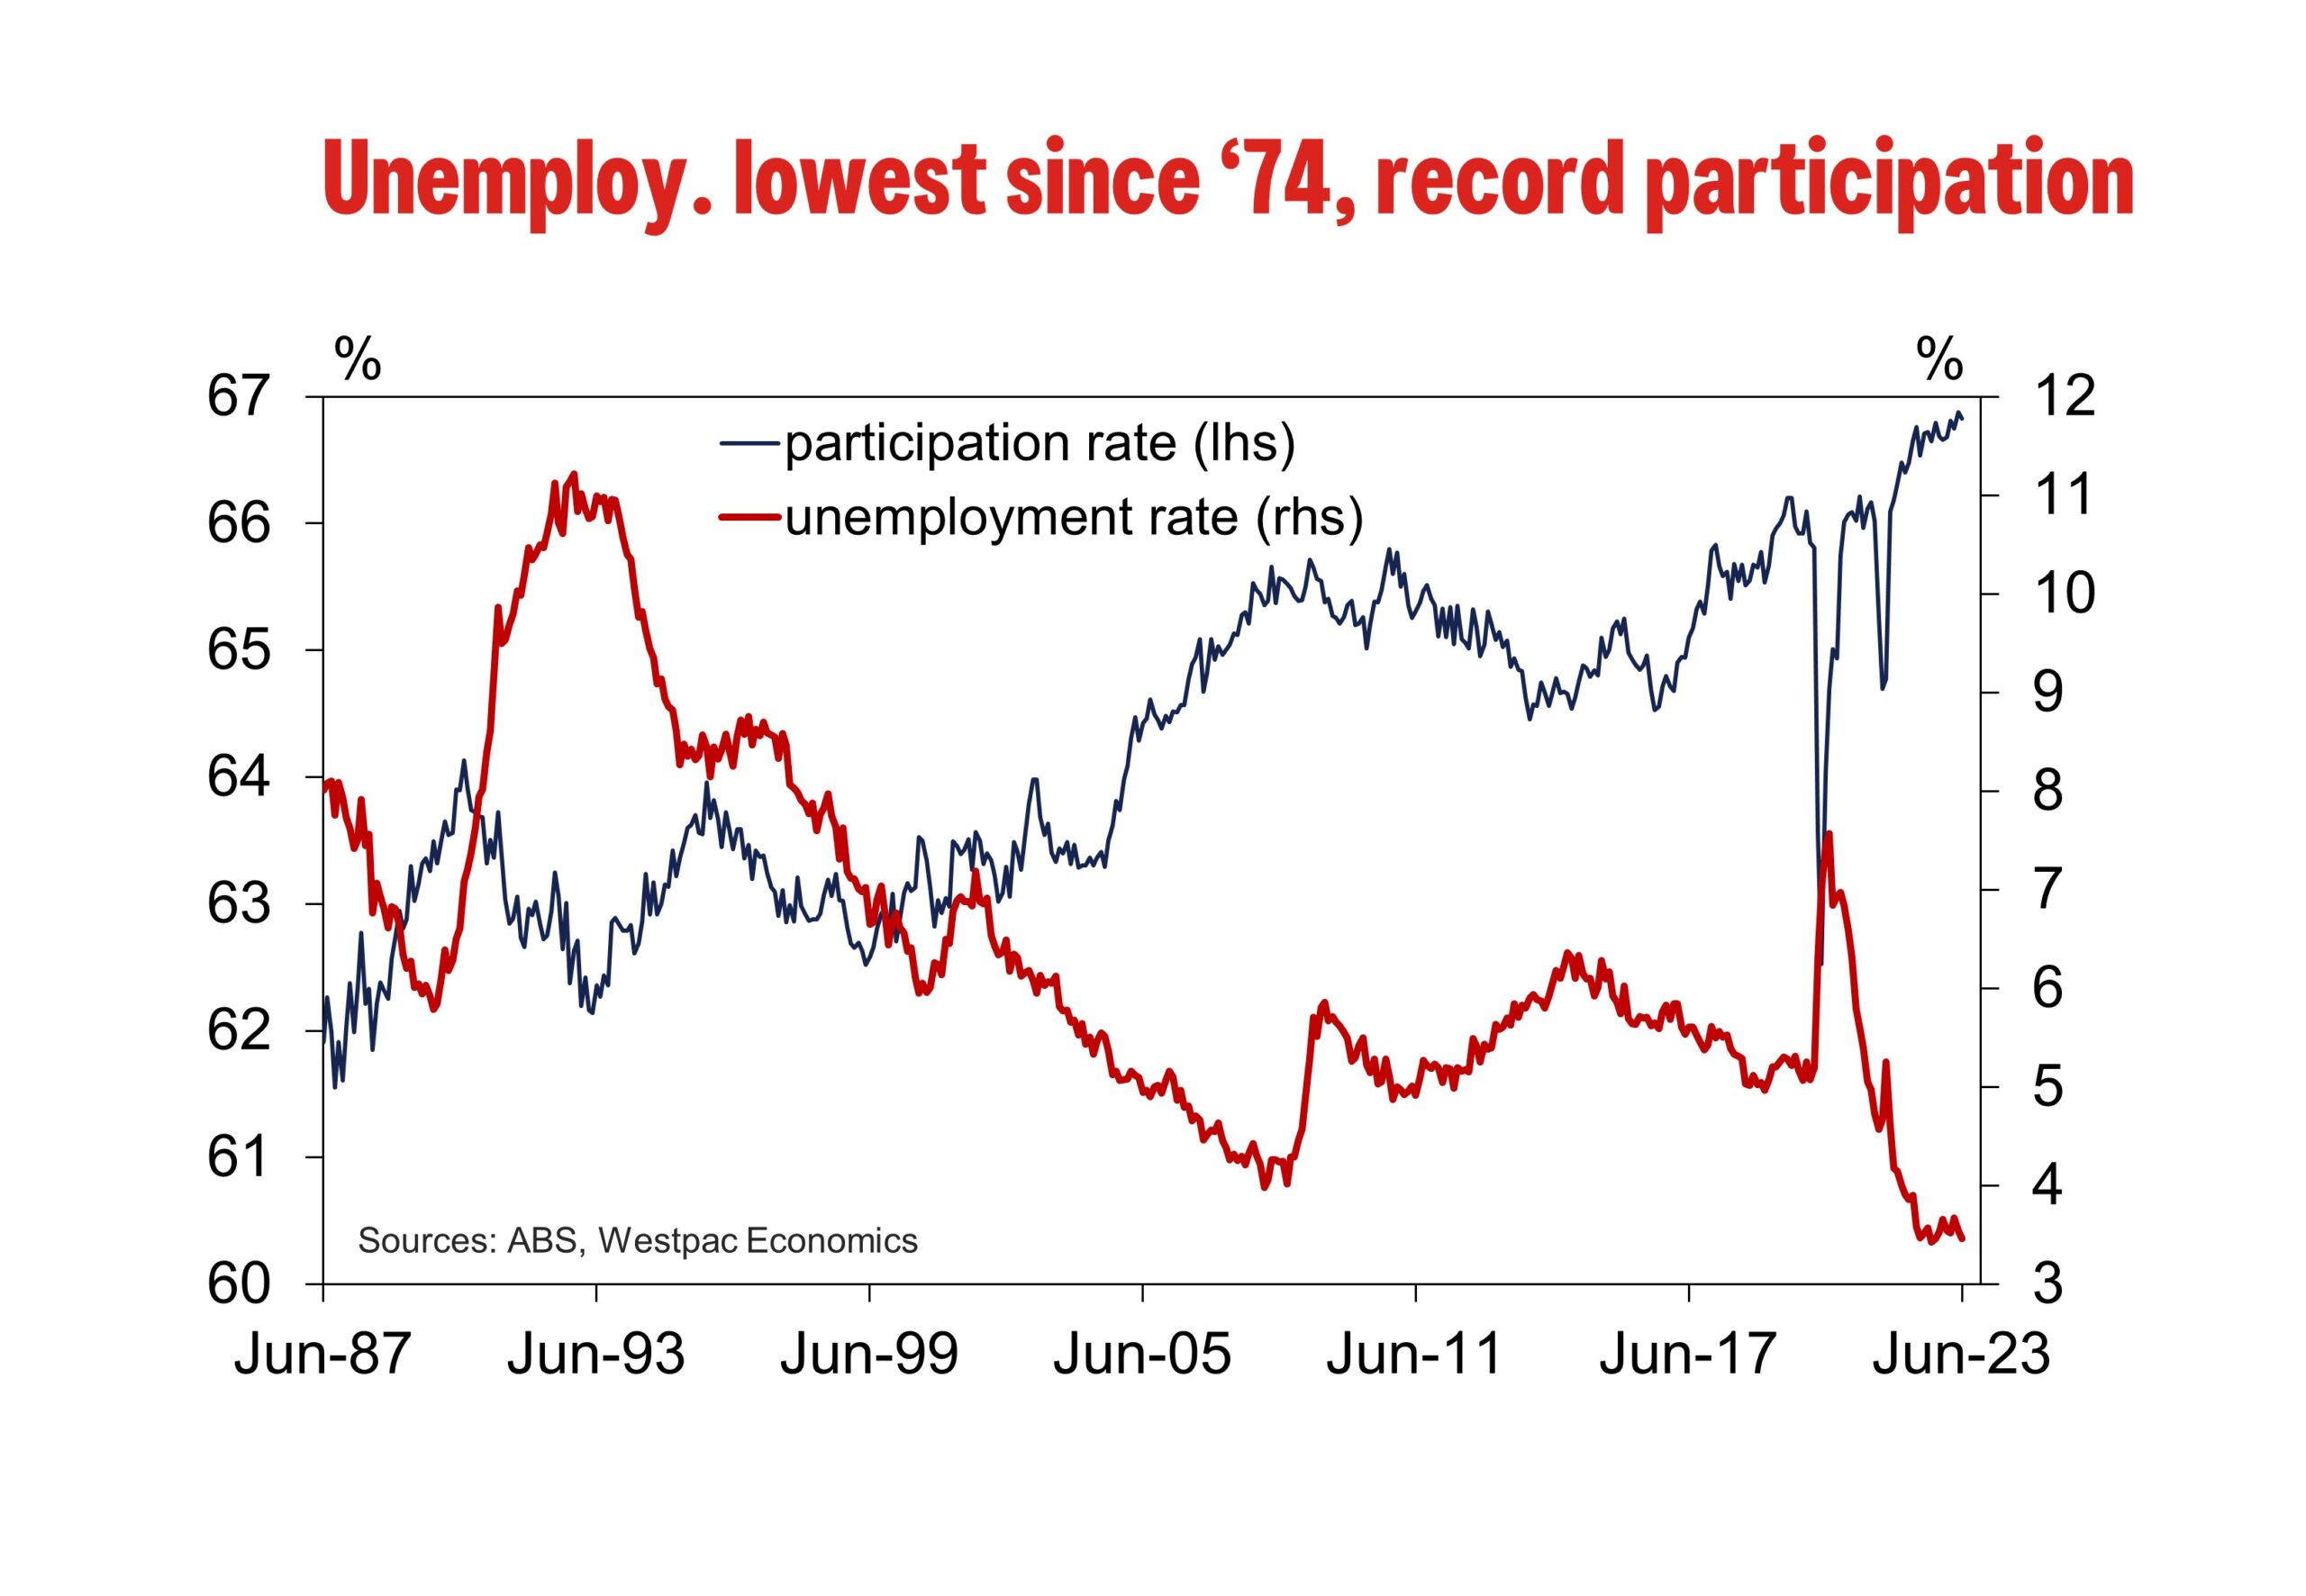
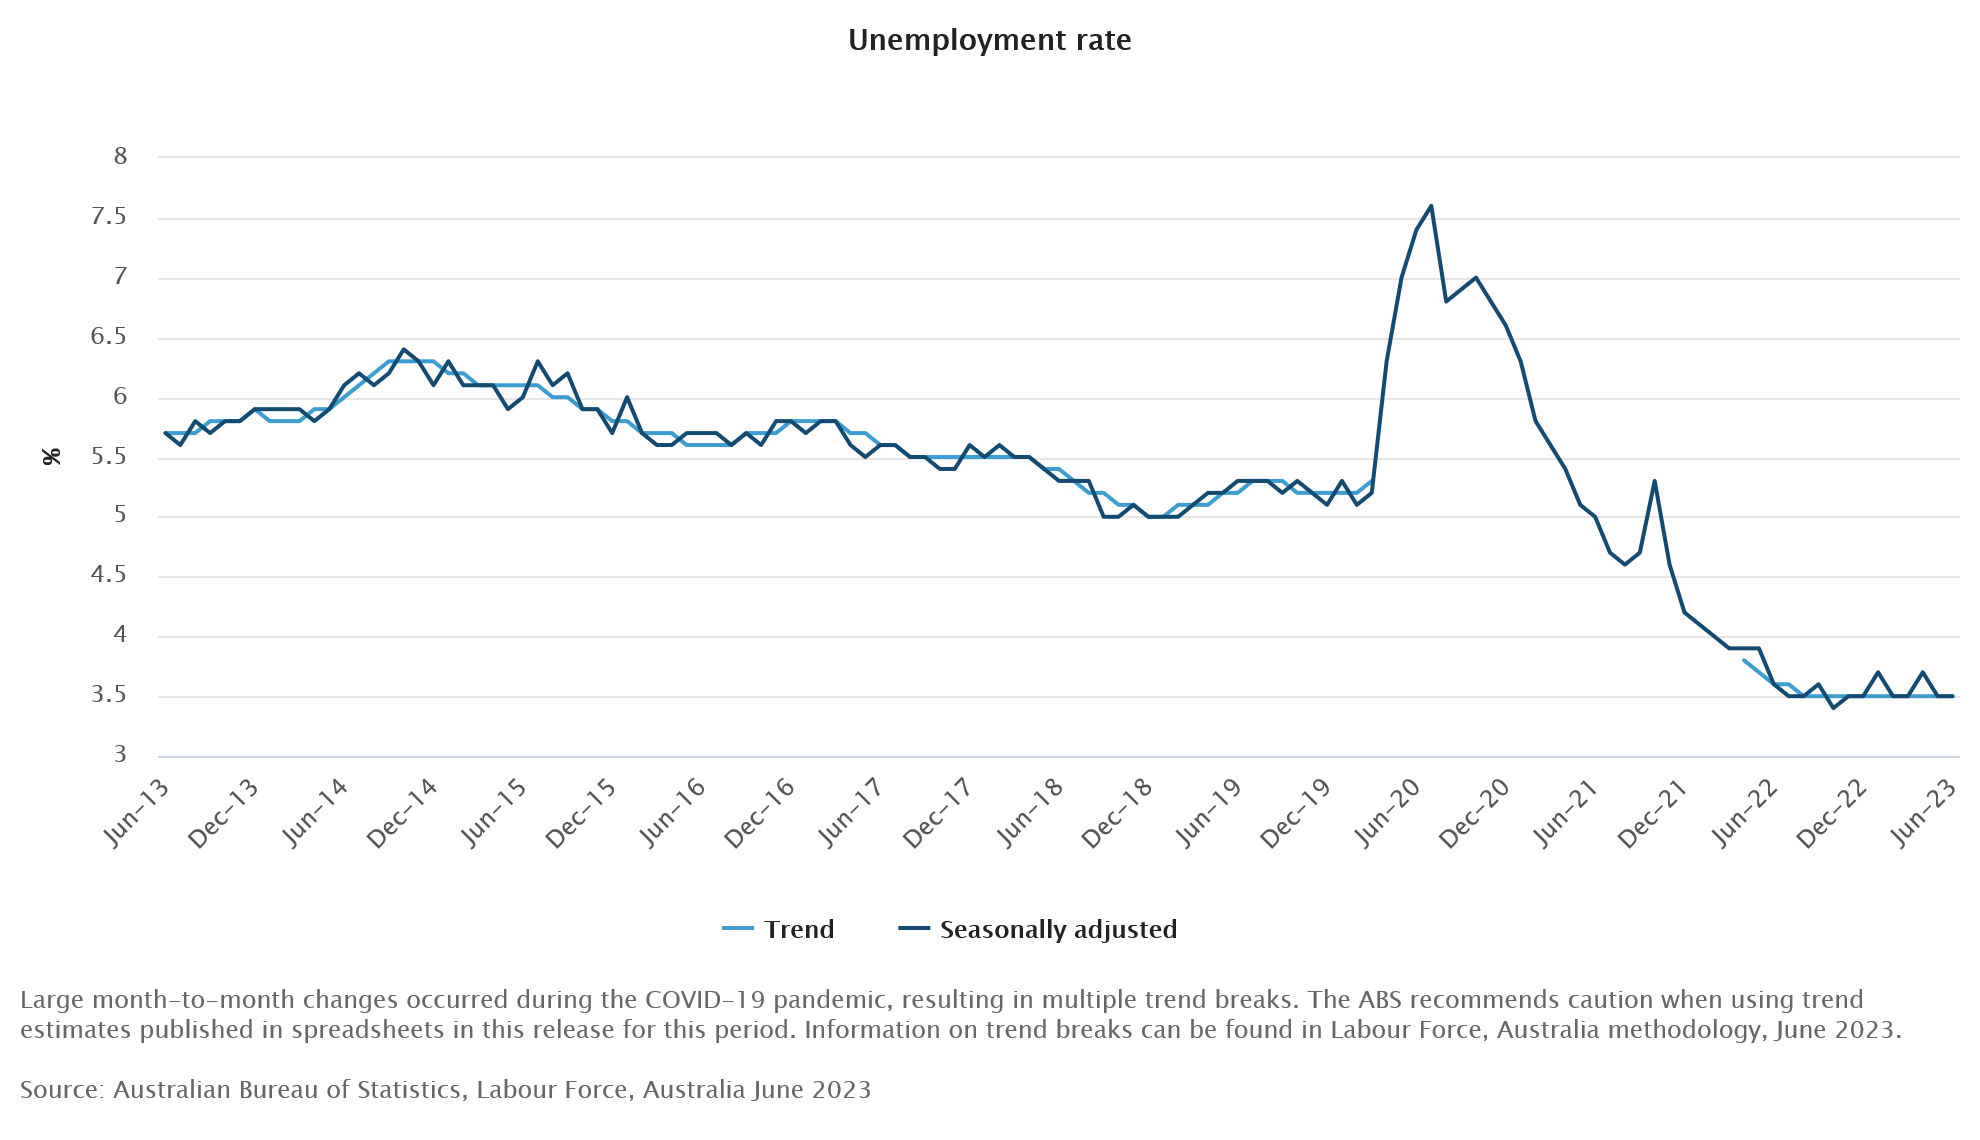
The employment-to-population ratio, after having reached a fresh record high in May, managed to nudge even slightly higher in June, albeit holding flat to one decimal place at 64.5%. The participation rate eased only slightly from its historic high in May, from 66.9% to 66.8%, seeing the labour force grow by a solid 21.8k in June. With employment also lifting strongly during the month, the unemployment rate held near fifty-year lows, at 3.5%. In fact, June’s unemployment print is the second-lowest reading in this cycle, only 0.04ppt above the low observed in October 2022.
Other indicators of labour market slack were also in line with this sentiment. The underemployment rate – which measures those who are employed but wish to work more hours – held at 6.4% in June. Benefiting from the fall in unemployment, the underutilisation rate – which combines unemployment and underemployment – fell slightly to 9.9%.
Also worthy of note, the unemployment rate in NSW fell 0.1ppt to a record low of 2.9%. Declines were also seen in Qld (–0.3ppt to 3.6%); WA (–0.1ppt to 3.6%) and Tas (–0.7ppt to 3.5%), while the unemployment rate held flat in Vic (3.7%) and nudged up slightly in SA (+0.2ppt to 4.2%).
Overall, the June Labour Force Survey has provided yet another robust and well-rounded read on the labour market. The tone of the survey at this stage is consistent with our labour market view, with the unemployment rate expected to rise to only 4.0% by the end of this year, given the near-term resilience from labour demand and robust growth in labour supply.
Technical Outlook and Review
DXY:
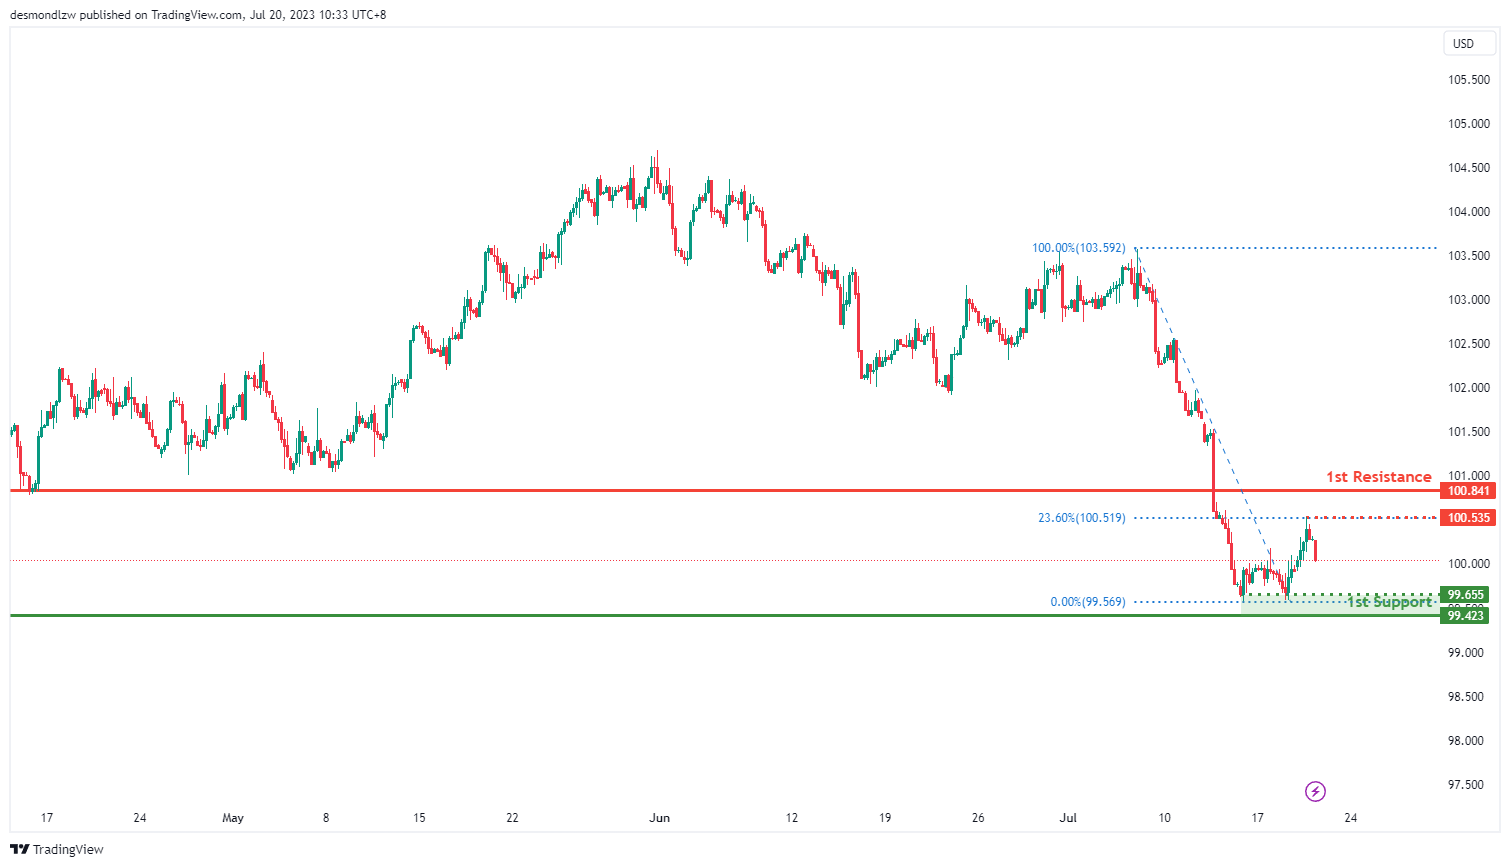
The DXY chart indicates a bearish overall momentum, suggesting a potential continuation of the downward movement towards the 1st support level.
The 1st support at 99.42 is identified as an overlap support, serving as a significant level to watch for potential buying interest. Additionally, there is an intermediate support at 99.65, representing a multi-swing low support.
On the upside, the 1st resistance level at 100.84 is considered a pullback resistance, potentially hindering further upward movement. Furthermore, there is an intermediate resistance at 100.53, recognized as a swing high resistance.
EUR/USD:
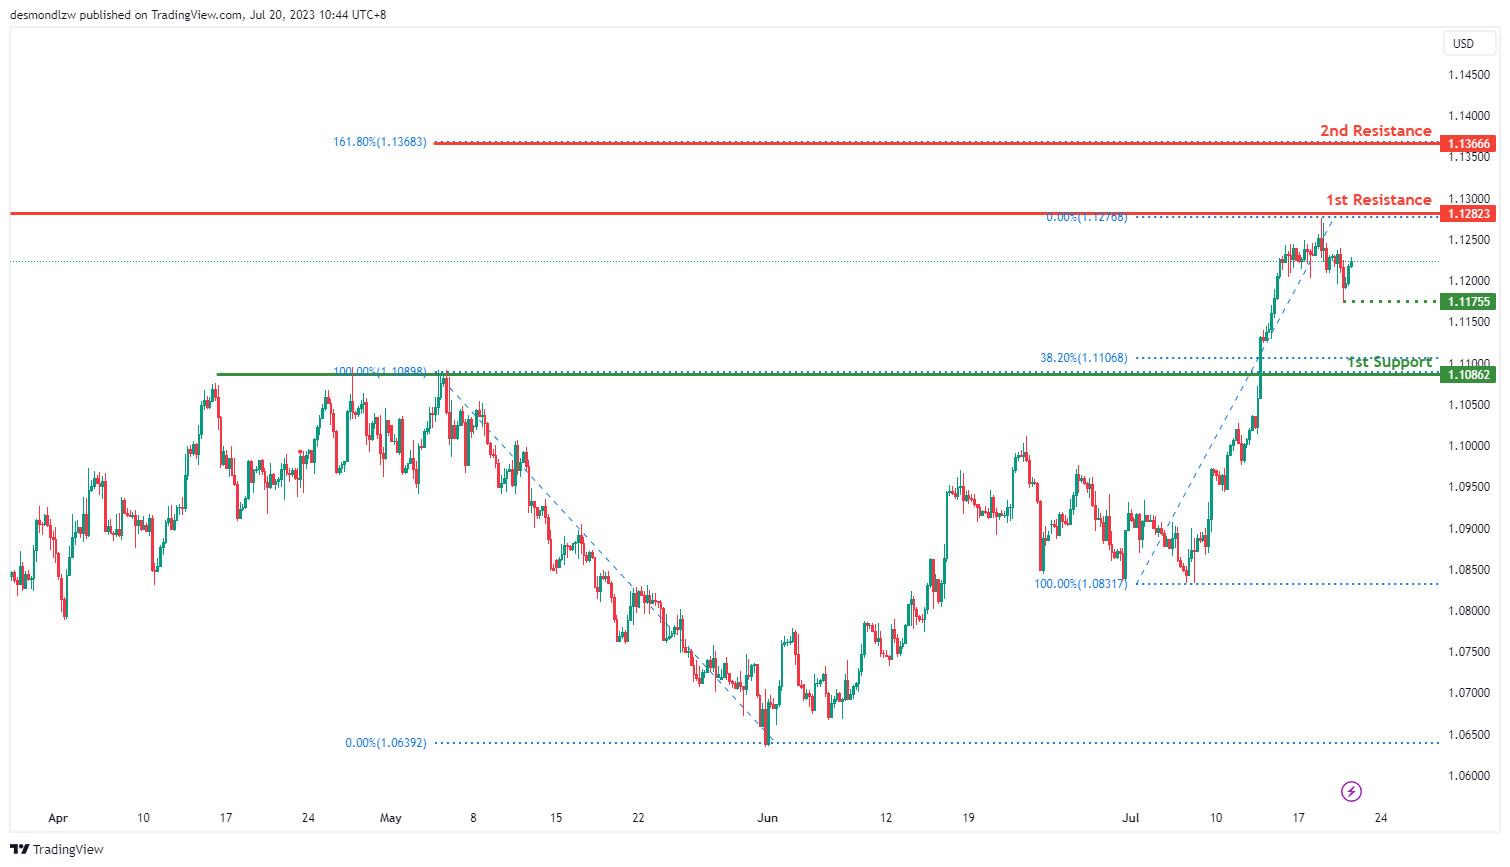
The EUR/USD chart currently exhibits a bearish overall momentum, suggesting a potential continuation of the downward movement towards the 1st support level.
The 1st support level at 1.1086 holds significance as a pullback support, coinciding with the 38.20% Fibonacci retracement level. Additionally, there is an intermediate support level at 1.1175, identified as a swing low support.
Conversely, on the upside, the 1st resistance level at 1.1282 serves as a notable overlap resistance. Furthermore, the 2nd resistance level at 1.1366 aligns with the 161.80% Fibonacci extension, adding to its significance.
EUR/JPY:
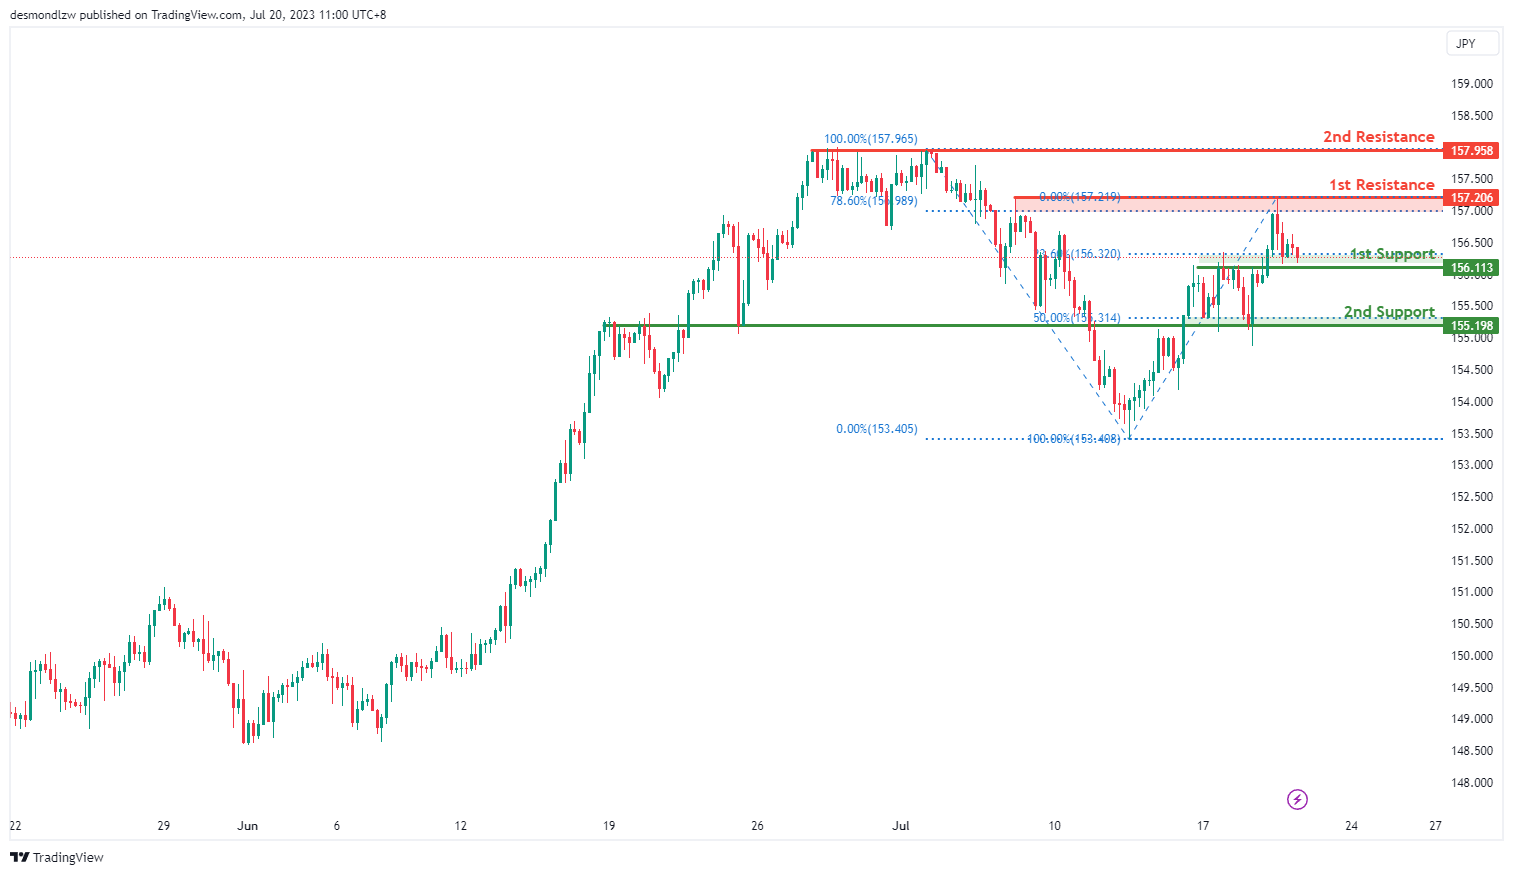
The EUR/JPY chart currently indicates a bullish overall momentum. There is a potential for a bullish bounce off the 1st support level, leading the price towards the 1st resistance.
The 1st support level at 156.11 is identified as a pullback support and aligns with the 23.60% Fibonacci Retracement level. Additionally, the 2nd support level at 155.19 is recognized as an overlap support and coincides with the 61.80% Fibonacci Retracement level.
On the upside, the 1st resistance level at 157.20 represents a multi-swing high resistance. Furthermore, the 2nd resistance level at 157.95 is also identified as a multi-swing high resistance. These resistance levels may pose challenges to further price advancement.
EUR/GBP:
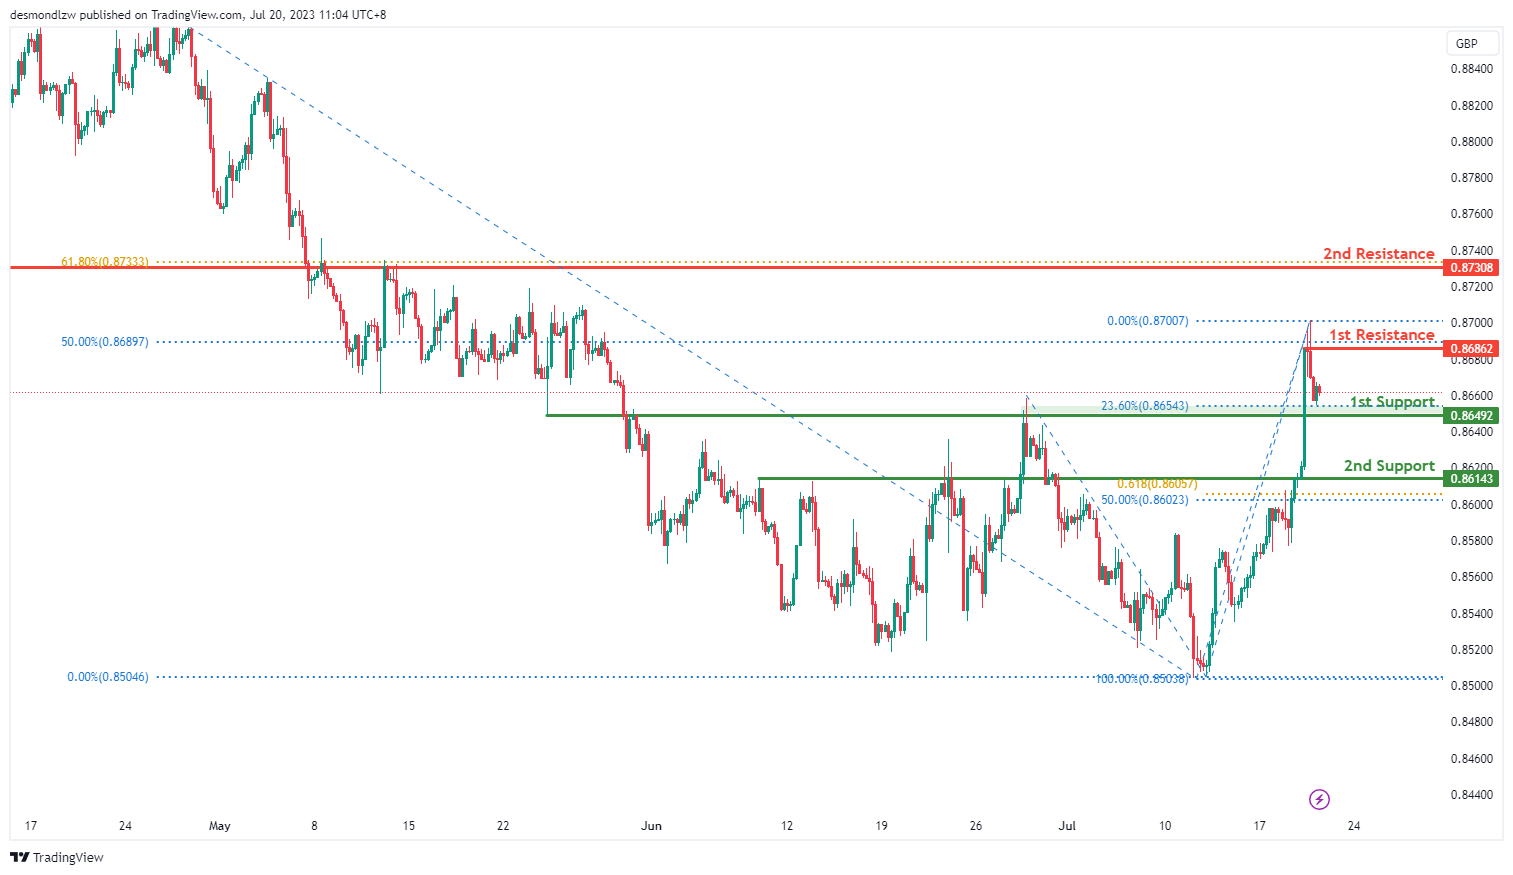
The EUR/GBP chart currently indicates a bullish overall momentum. There is a potential for a bullish bounce off the 1st support level, leading the price towards the 1st resistance.
The 1st support level at 0.8649 is identified as an overlap support and coincides with the 23.60% Fibonacci Retracement level. Additionally, the 2nd support level at 0.8614 is recognized as an overlap support and exhibits Fibonacci confluence with the 61.80% and 50% Fibonacci Retracement levels.
On the upside, the 1st resistance level at 0.8686 represents a swing high resistance and aligns with the 50% Fibonacci Retracement level. Furthermore, the 2nd resistance level at 0.8730 is identified as a multi-swing high resistance and coincides with the 61.80% Fibonacci Retracement level.
GBP/USD:
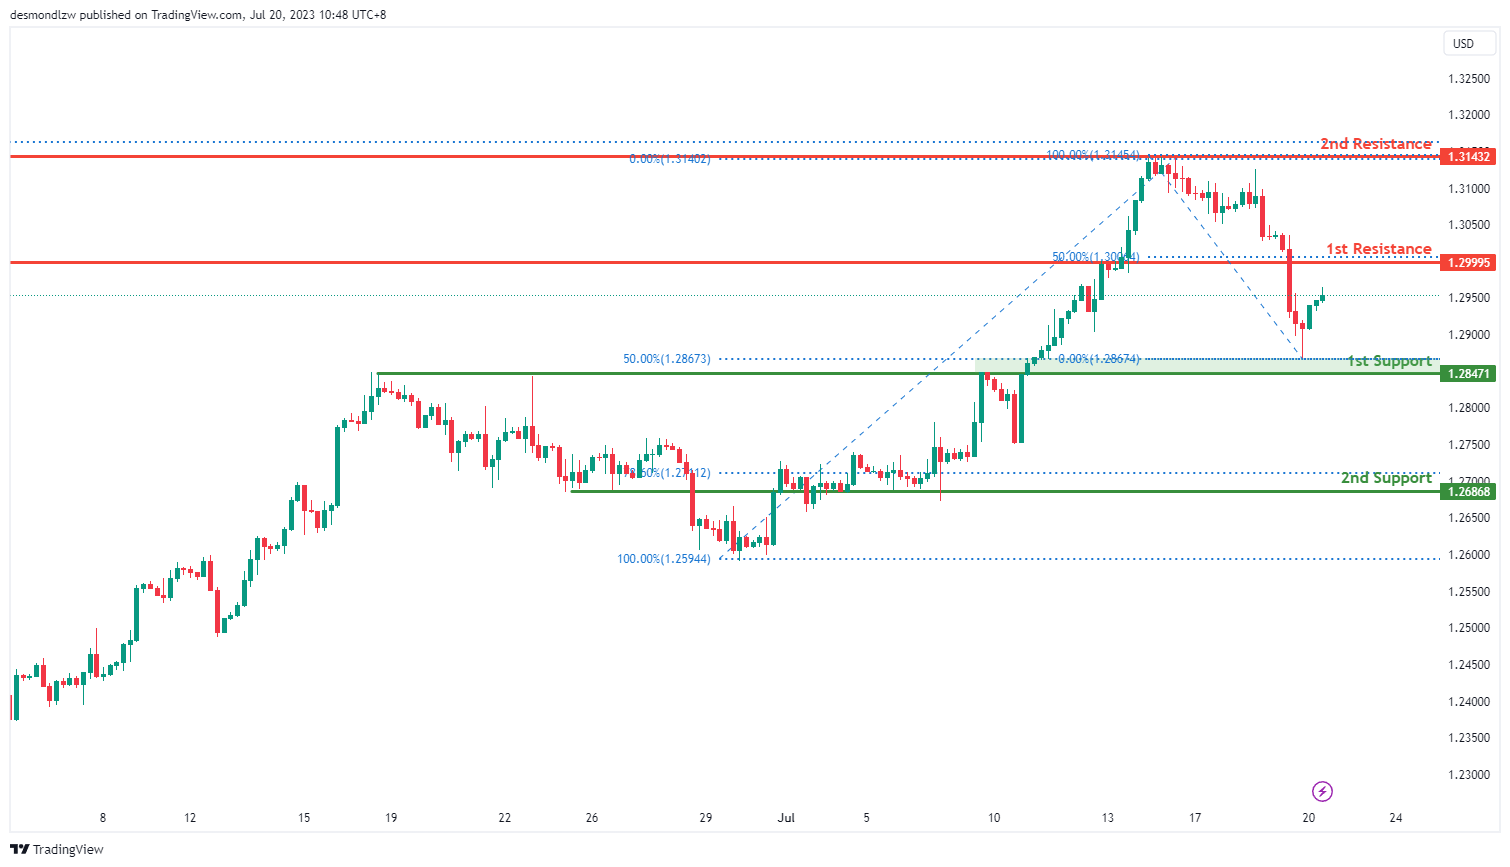
The GBP/USD chart currently demonstrates a bullish overall momentum, indicating the potential for a continuation of the upward movement towards the 1st resistance level.
The 1st support level at 1.2847 is identified as an overlap support, coinciding with the 50% Fibonacci retracement level, thereby providing a strong foundation for potential price bounces. Additionally, the 2nd support level at 1.2686 acts as another overlap support, aligning with the 78.60% Fibonacci retracement level.
On the upside, the 1st resistance level at 1.2999 represents a significant pullback resistance, coinciding with the 50% Fibonacci retracement level. Furthermore, the 2nd resistance level at 1.3143 is characterized as a multi-swing high resistance, adding to its importance.
GBP/JPY:
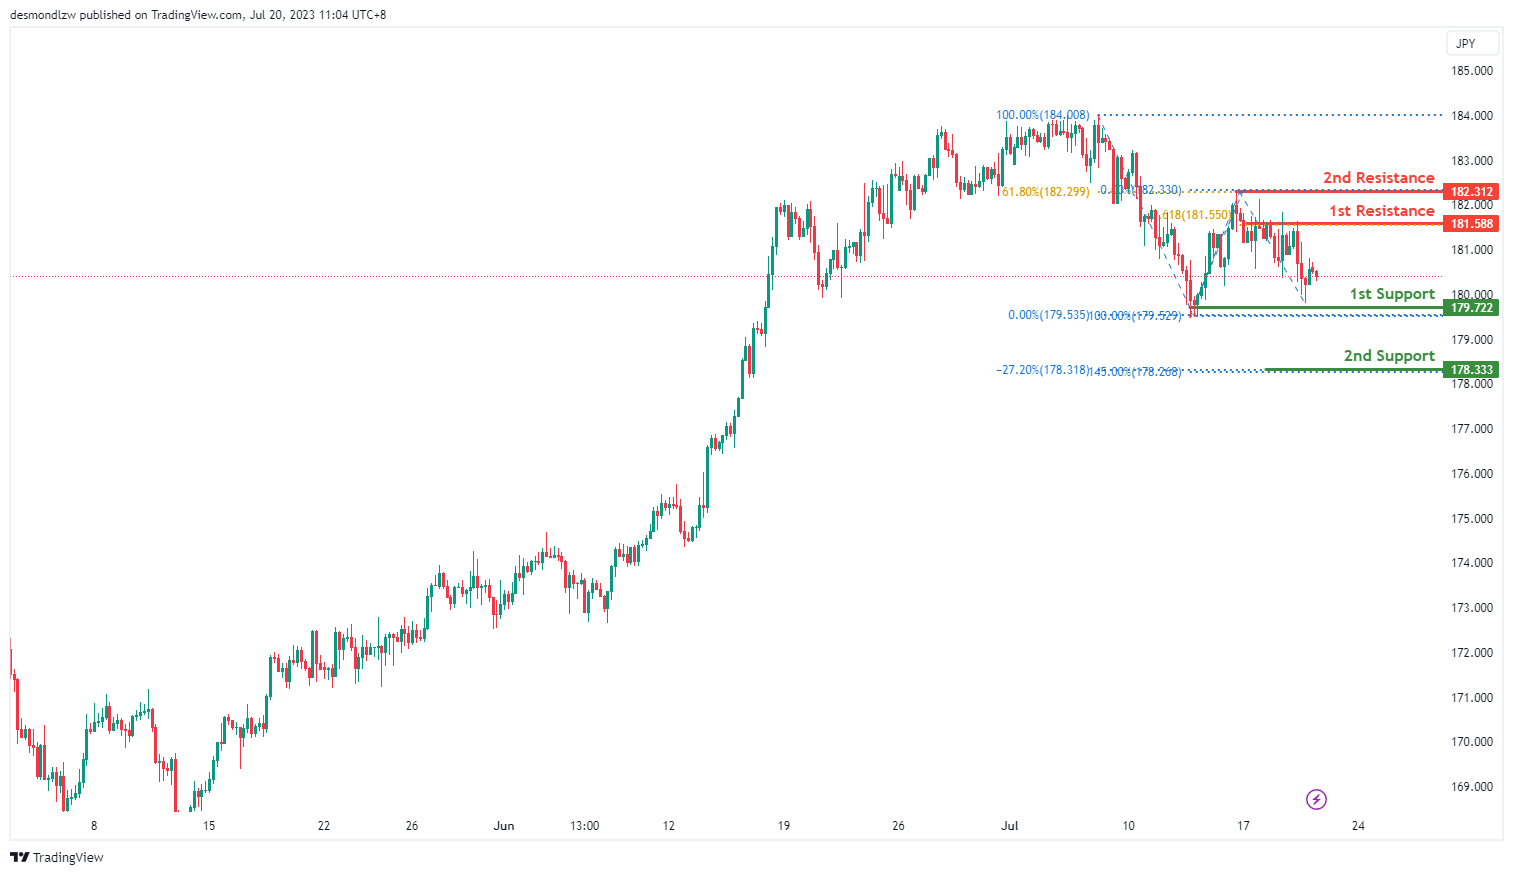
The GBP/JPY chart currently indicates a bearish overall momentum. There is a potential for a bearish continuation towards the first support level.
The first support level at 179.72 is identified as a multi-swing low support, suggesting its significance in providing potential price stability. Additionally, the second support level at 178.33 exhibits Fibonacci confluence with the -27% Fibonacci Expansion and 145.00% Fibonacci Extension, further emphasizing its potential as a support level.
On the upside, the first resistance level at 181.58 represents a multi-swing high resistance and aligns with the 61.80% Fibonacci Projection. Furthermore, the second resistance level at 182.31 is recognized as a swing high resistance and coincides with the 61.80% Fibonacci Retracement.
USD/CHF:
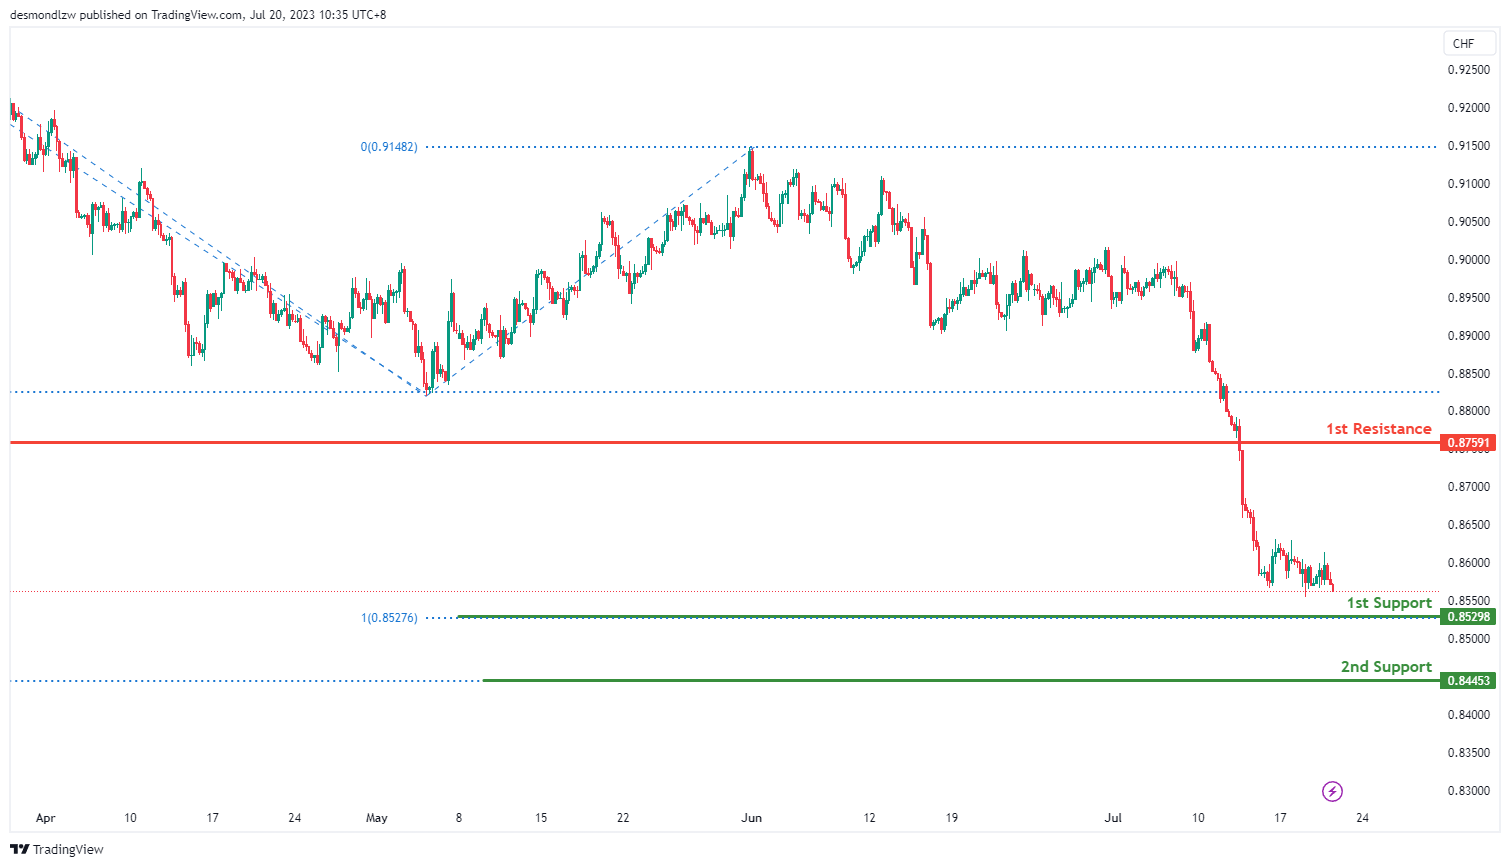
The USD/CHF currency pair currently demonstrates a bearish overall momentum, suggesting the potential for a continuation of the downward movement towards the 1st support level.
The 1st support level at 0.8529 is significant as it aligns with the 100% Fibonacci Projection. This level may act as a strong support zone, attracting buying interest and potentially halting the price decline. Additionally, the 2nd support level at 0.8445 corresponds to the -61.8% Fibonacci Expansion, further reinforcing its significance as a potential area of support.
On the upside, the 1st resistance level at 0.8759 is identified as a pullback resistance, which may impede upward price movement. It is important to monitor price action around this level, as a failure to break above it could maintain the bearish momentum.
USD/JPY:
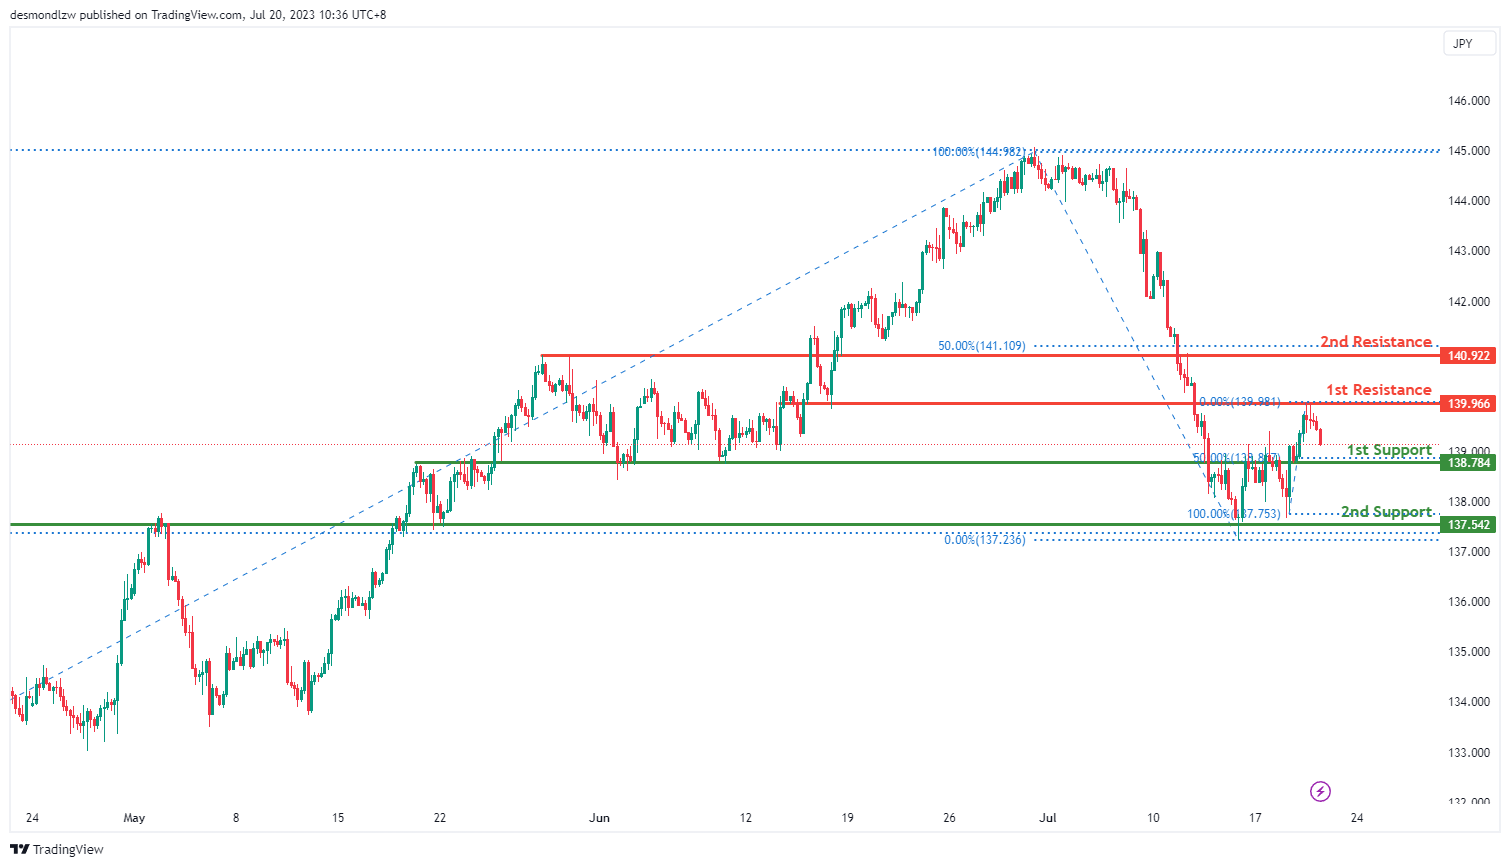
The USD/JPY currency pair currently exhibits a bearish overall momentum, indicating the potential for a continuation of the downward movement towards the 1st support level.
The 1st support level at 138.78 is identified as a pullback support and coincides with the 50% Fibonacci Retracement level. This level is expected to provide a strong foundation for potential price rebounds. Additionally, the 2nd support level at 137.54 acts as an overlap support, further reinforcing its significance in providing potential price support.
On the upside, the 1st resistance level at 139.96 is characterized as an overlap resistance, which could pose a barrier to upward price movement. Furthermore, the 2nd resistance level at 140.92 also acts as an overlap resistance, adding to its importance in limiting the potential upward movement.
USD/CAD:
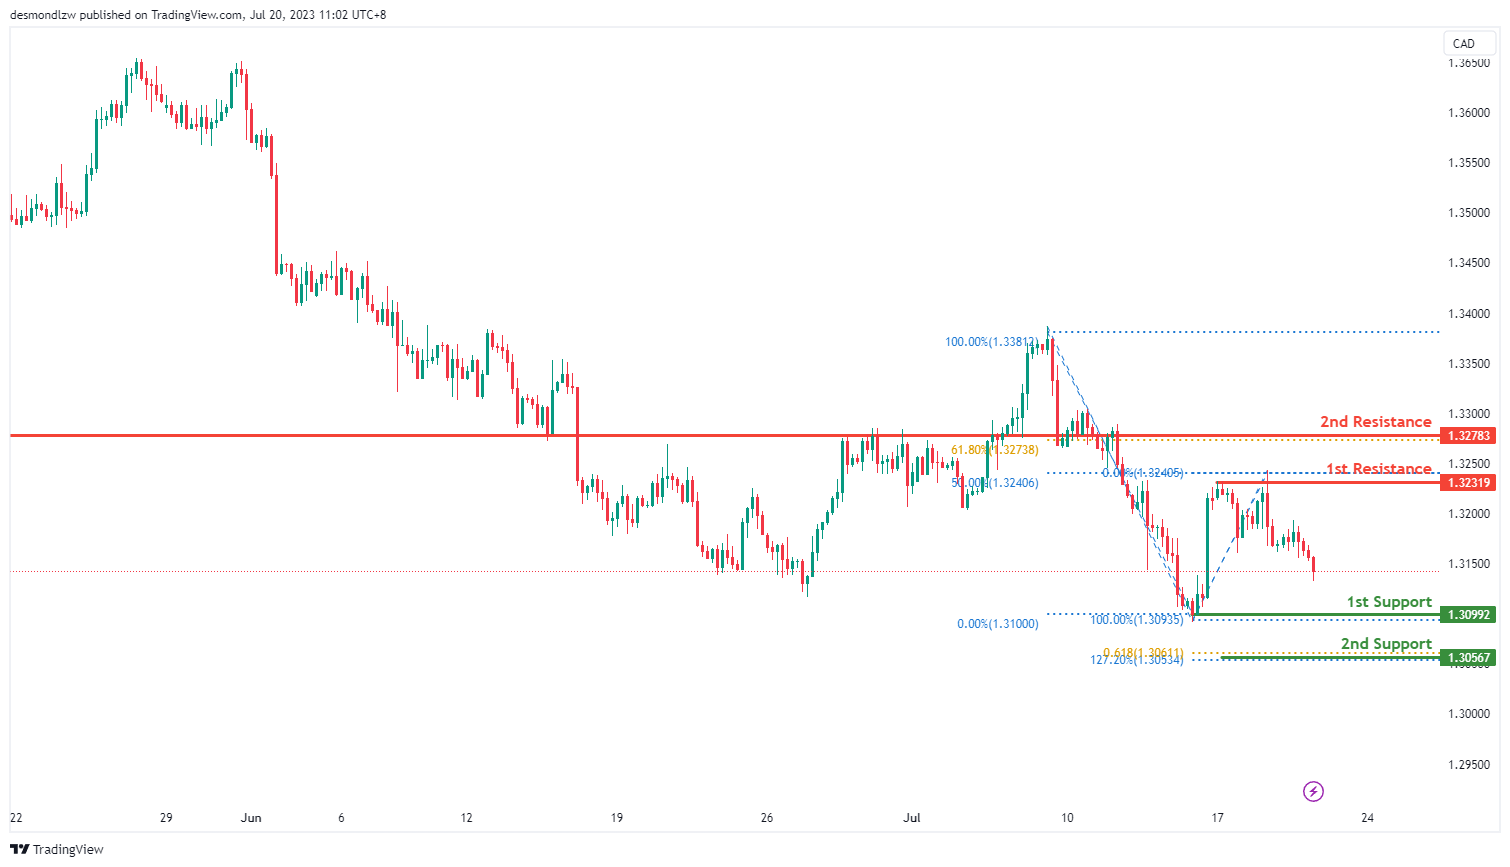
The USD/CAD pair is currently showing a strong bearish trend with high confidence, suggesting a potential continuation of the bearish momentum towards the 1st support level.
The 1st line of support is at 1.3099, acting as a swing low support that could potentially halt the bearish movement. Should the price decline further, the 2nd support level at 1.3057, identified as a support level that corresponds to a Fibonacci confluence at the 61.8% projection and 127.2% extension levels, could serve as a robust barrier against further price drop.
On the flip side, if the trend reverses, the 1st resistance at 1.3232, a multi-swing high resistance and the 50% Fibonacci retracement level, could challenge the price advancement. A further upward movement could meet the 2nd resistance level at 1.3278, a pullback resistance coinciding with the 61.8% Fibonacci retracement, potentially impeding further price ascension.
AUD/USD:
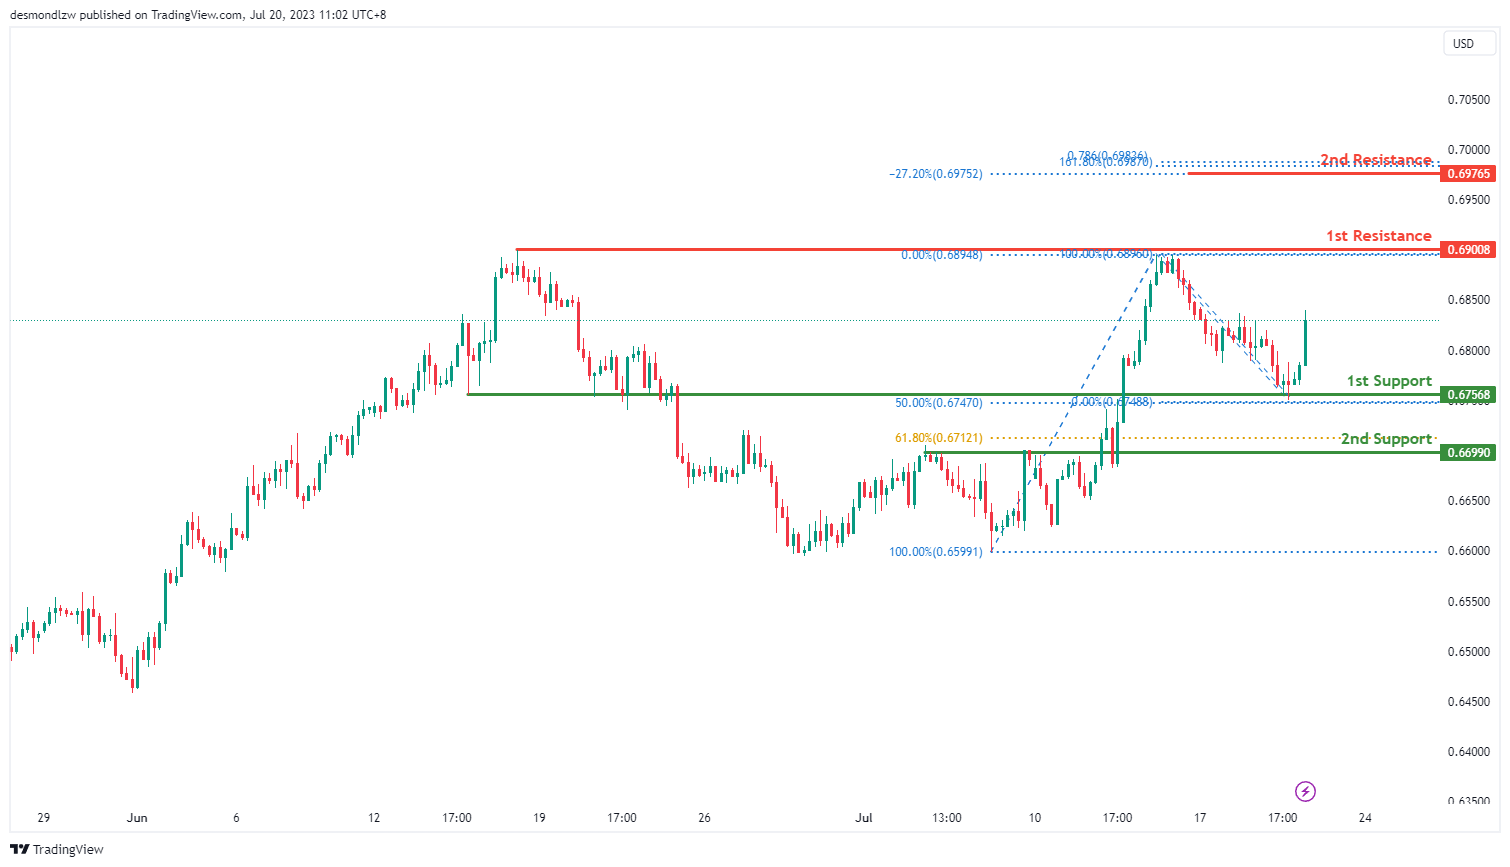
The AUD/USD pair currently displays a strong bullish trend with high confidence, suggesting a potential continuation of this upward momentum towards the 1st resistance level.
The 1st line of support is at 0.6757, recognized as an overlap support and aligning with the 50% Fibonacci retracement level. This could potentially halt any bearish retracement. If the price descends further, the 2nd support level at 0.6699, another overlap support coinciding with the 61.8% Fibonacci retracement, could serve as a significant rebound zone.
Conversely, if the bullish trend continues, the price may face resistance at the 1st level of 0.6901, identified as an overlap resistance. A further upward trend might encounter the 2nd resistance level at 0.6977, a resistance level which corresponds with a Fibonacci confluence at the 78.6% projection, 161.8% extension and -27% expansion levels. This could potentially hinder the price’s upward movement.
NZD/USD
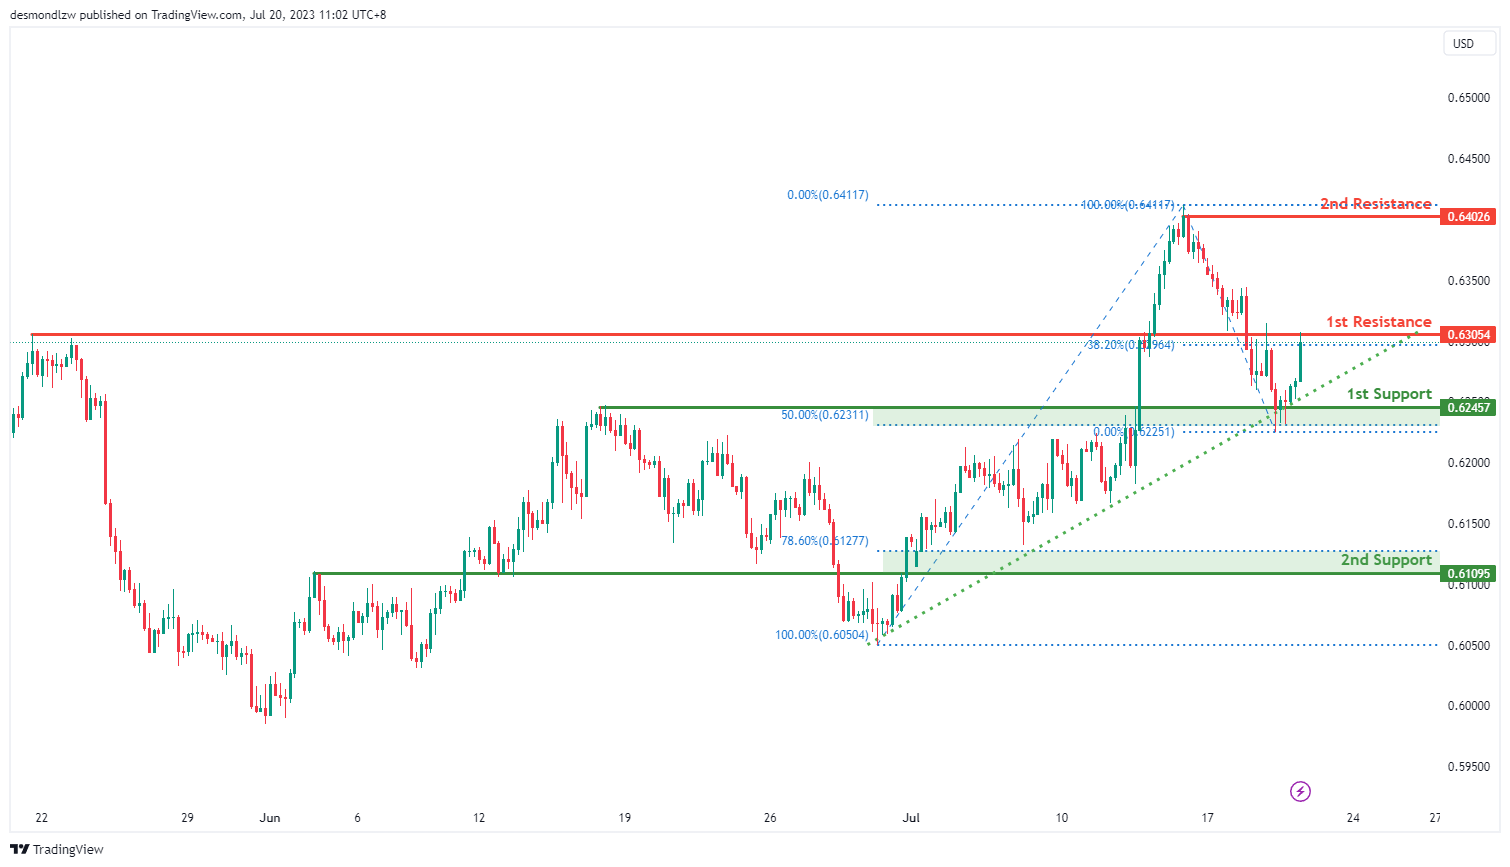
The NZD/USD pair is showing a strong bullish trend with high confidence, primarily due to the price being above a significant ascending trend line, which suggests a potential continuation of the bullish momentum.
If the price starts to retract, the 1st support level is at 0.6246, which is an overlap support coinciding with the 50% Fibonacci retracement level, providing a potential floor for the price. If the price falls further, the 2nd support level at 0.6109, another overlap support and also the 78.6% Fibonacci retracement level, could halt further decline.
However, if the bullish momentum continues, the price could face resistance at 0.6305, an overlap resistance level that aligns with the 38.2% Fibonacci retracement. If the price continues to climb and surpasses this level, the next challenge could come from the 2nd resistance level at 0.6403, which is a swing high resistance. These resistance levels could potentially halt the price’s upward movement.
DJ30:
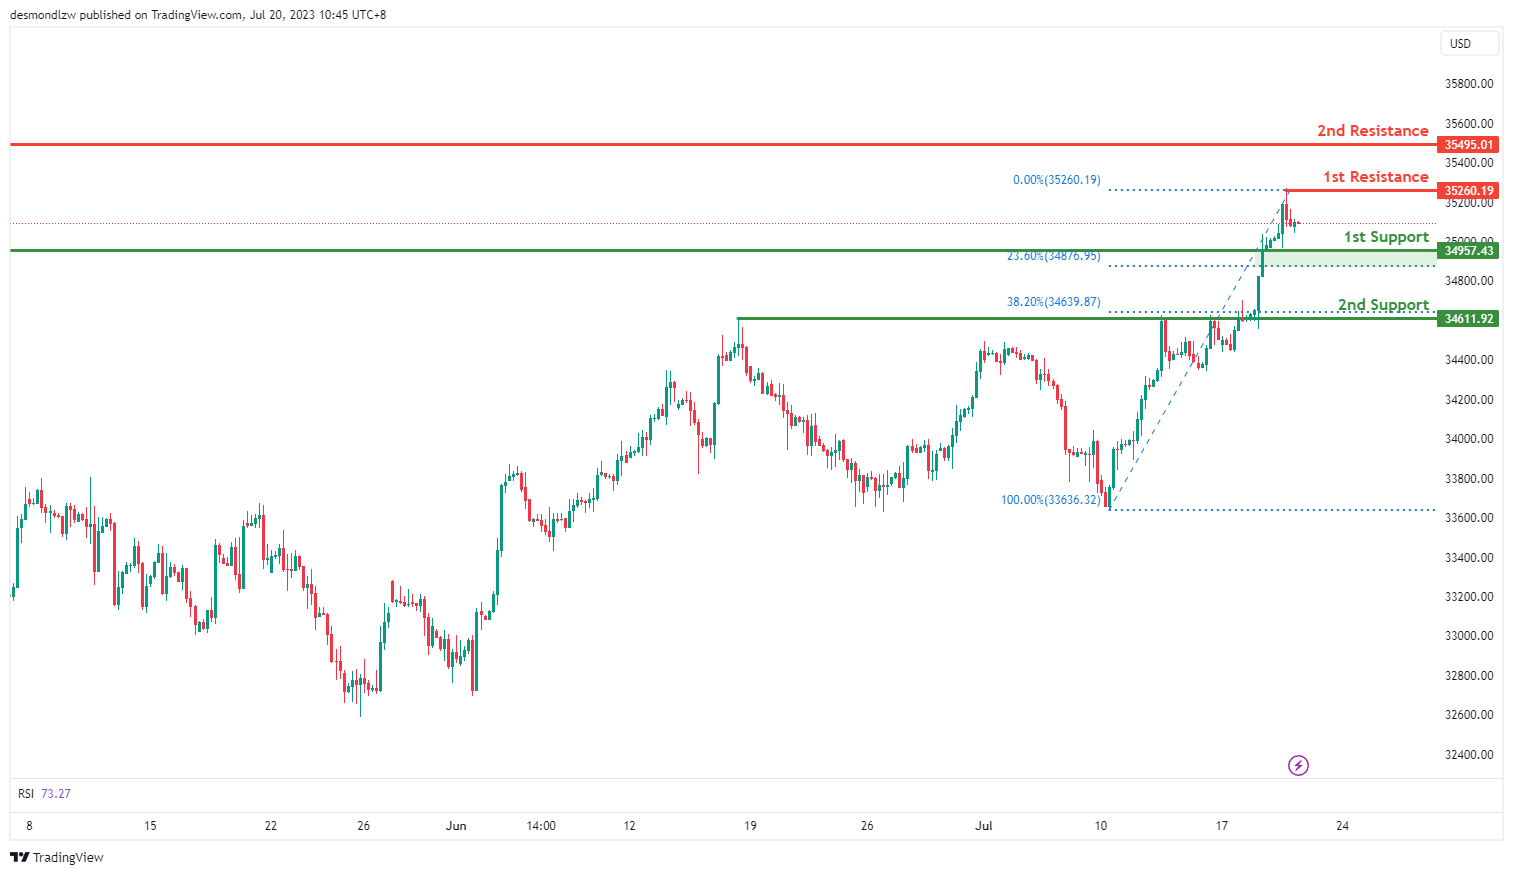
The DJ30 (Dow Jones Industrial Average) chart currently exhibits a bullish overall momentum. There is a potential for a bullish bounce off the 1st support level, followed by a potential upward movement towards the 1st resistance level.
The 1st support level at 34,957.43 is identified as a pullback support and aligns with the 23.60% Fibonacci Retracement level. Additionally, the 2nd support level at 34,611.92 acts as a pullback support and coincides with the 38.20% Fibonacci Retracement level.
On the upside, the 1st resistance level at 35,260.19 represents a swing high resistance. If the price breaks above this level, it could further advance towards the 2nd resistance level at 35,495.01, which is also identified as a swing high resistance. These resistance levels may pose challenges to further price advancement.
GER30:
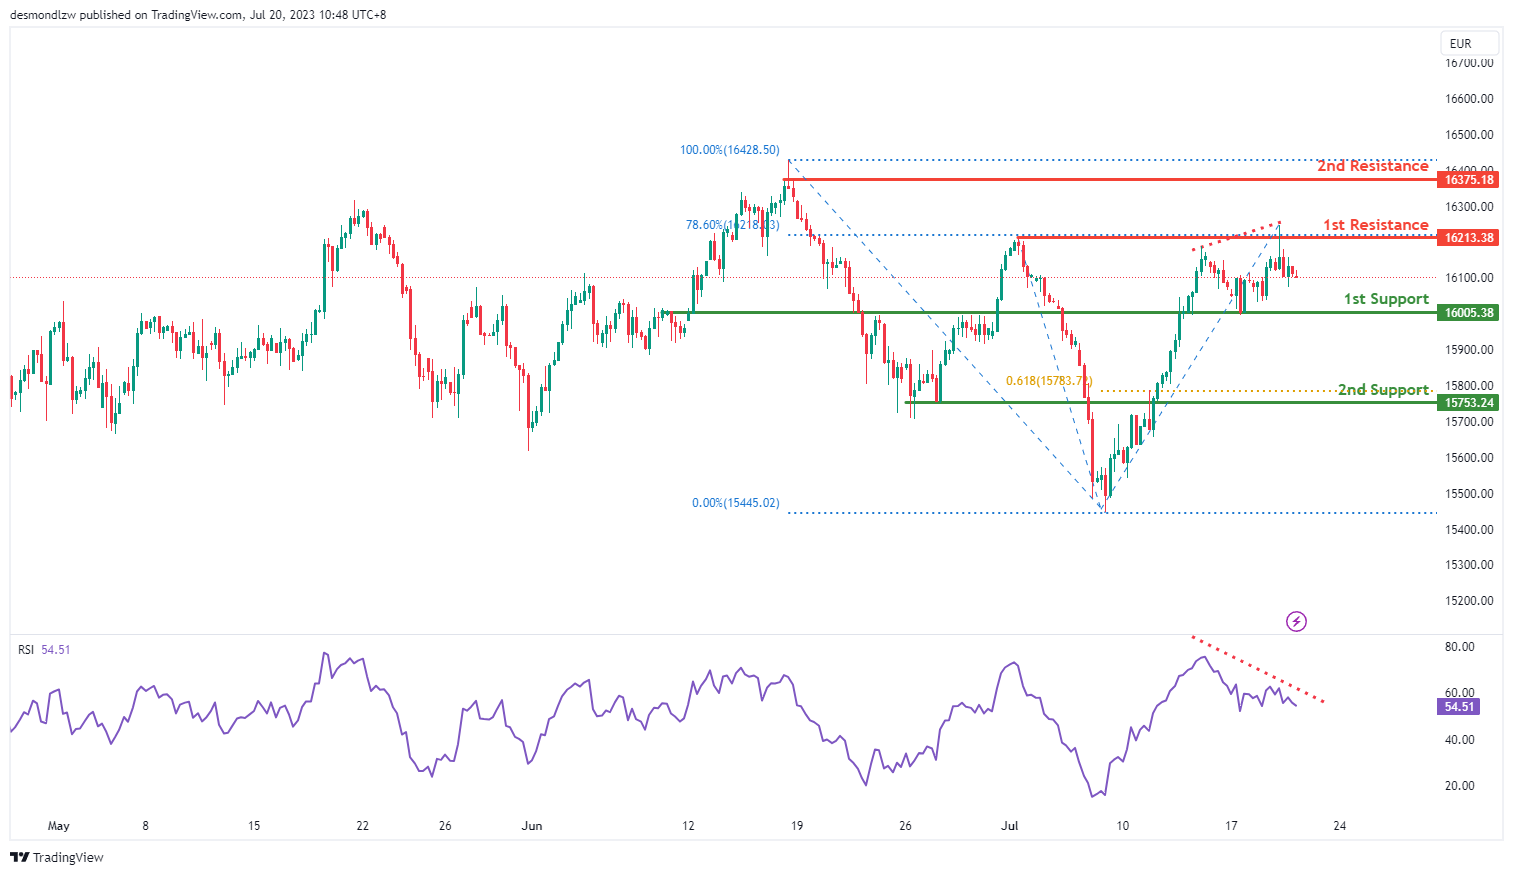
The GER30 (DAX) chart currently indicates a bearish overall momentum. There is a potential for a bearish continuation towards the 1st support level.
The 1st support level at 16,005.38 is identified as an overlap support and coincides with the 23.60% Fibonacci Retracement level. Additionally, the 2nd support level at 15,753.24 acts as an overlap support and aligns with the 61.80% Fibonacci Projection level.
On the upside, the 1st resistance level at 16,213.38 represents a multi-swing high resistance and coincides with the 78.60% Fibonacci Retracement level. Furthermore, the 2nd resistance level at 16,375.18 is identified as a swing high resistance. These resistance levels may limit further price advancement.
The Relative Strength Index (RSI) is displaying bearish divergence versus price, indicating a potential rapid decline in price. This further supports the bearish outlook for the GER30 chart.
US500
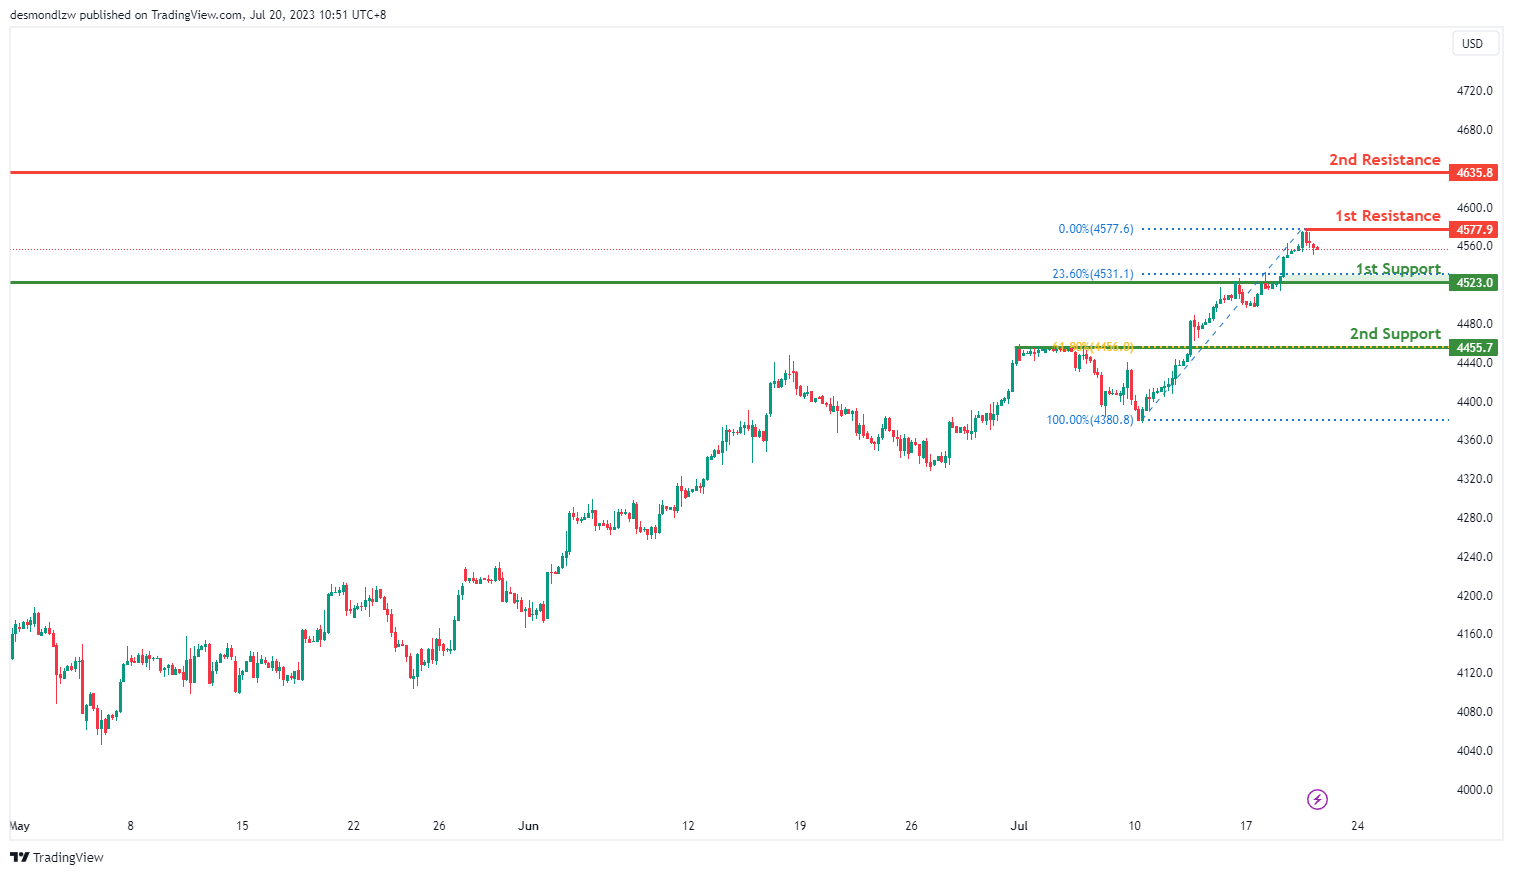
The US500 (S&P 500) chart currently demonstrates a bearish overall momentum. There is a potential for a bearish continuation towards the 1st support level.
The 1st support level at 4523.0 is identified as a pullback support and coincides with the 23.60% Fibonacci Retracement level. Additionally, the 2nd support level at 4455.7 acts as an overlap support and aligns with the 61.80% Fibonacci Retracement level.
On the upside, the 1st resistance level at 4577.9 represents a swing high resistance. Furthermore, the 2nd resistance level at 4635.8 is also identified as a swing high resistance. These resistance levels may impede further price advancement.
BTC/USD:
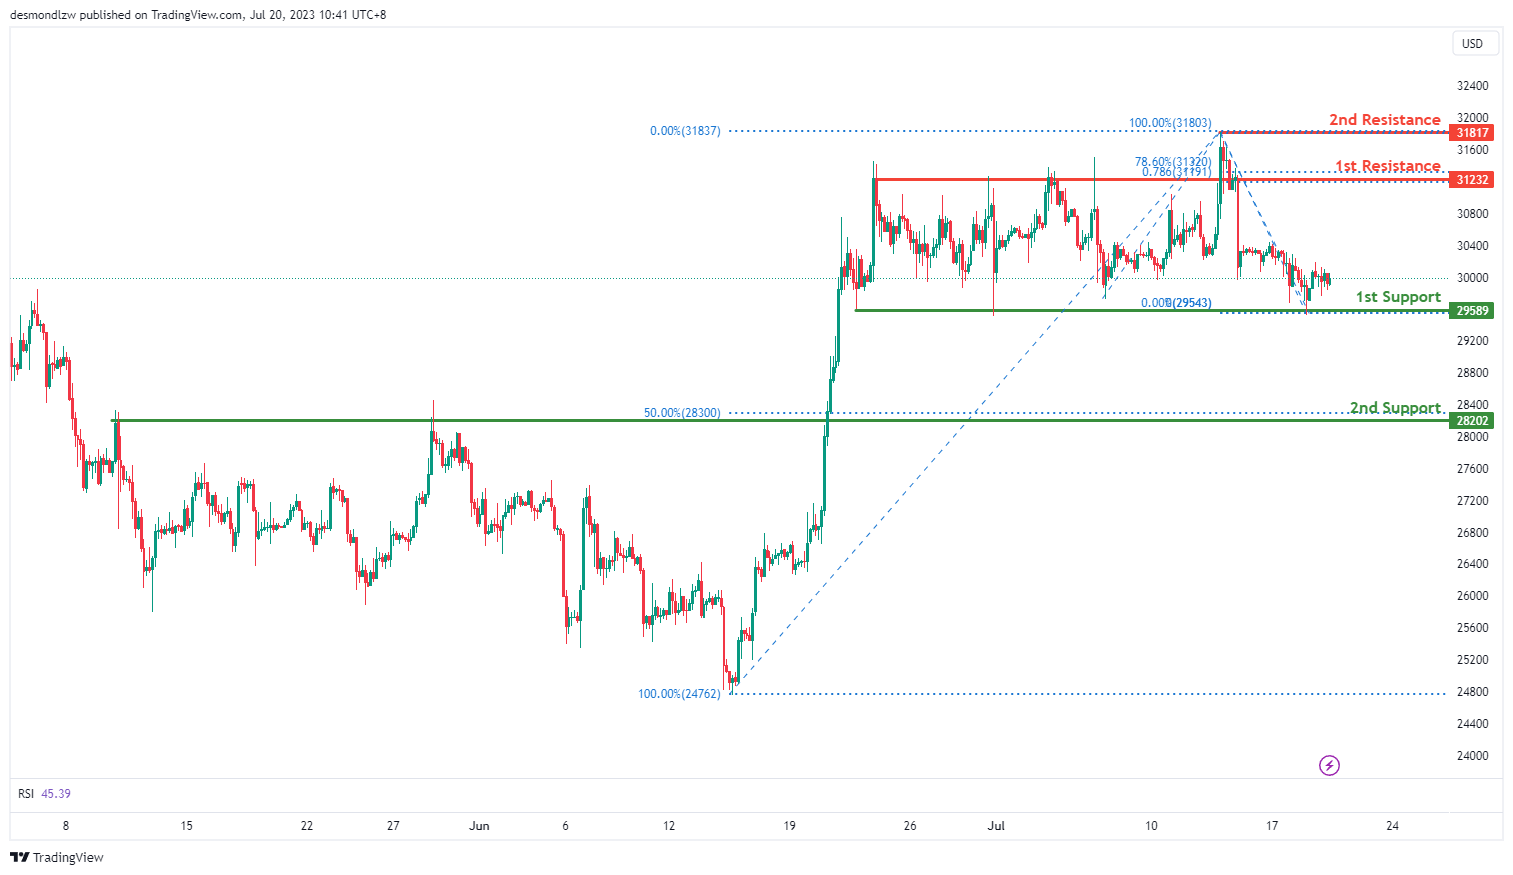
The BTC/USD chart currently indicates a bullish overall momentum. There is a potential for a bullish continuation towards the first resistance level.
The first support level at 29,589 is identified as a multi-swing low support, indicating its significance in providing potential price stability. Additionally, the second support level at 28,202 is considered a pullback support, coinciding with the 50% Fibonacci Retracement.
On the upside, the first resistance level at 31,232 represents an overlap resistance and exhibits Fibonacci confluence with the 78.60% Fibonacci Projection and 78.60% Fibonacci Retracement, suggesting its importance as a potential barrier. Furthermore, the second resistance level at 31,817 is recognized as a swing high resistance.
ETH/USD:
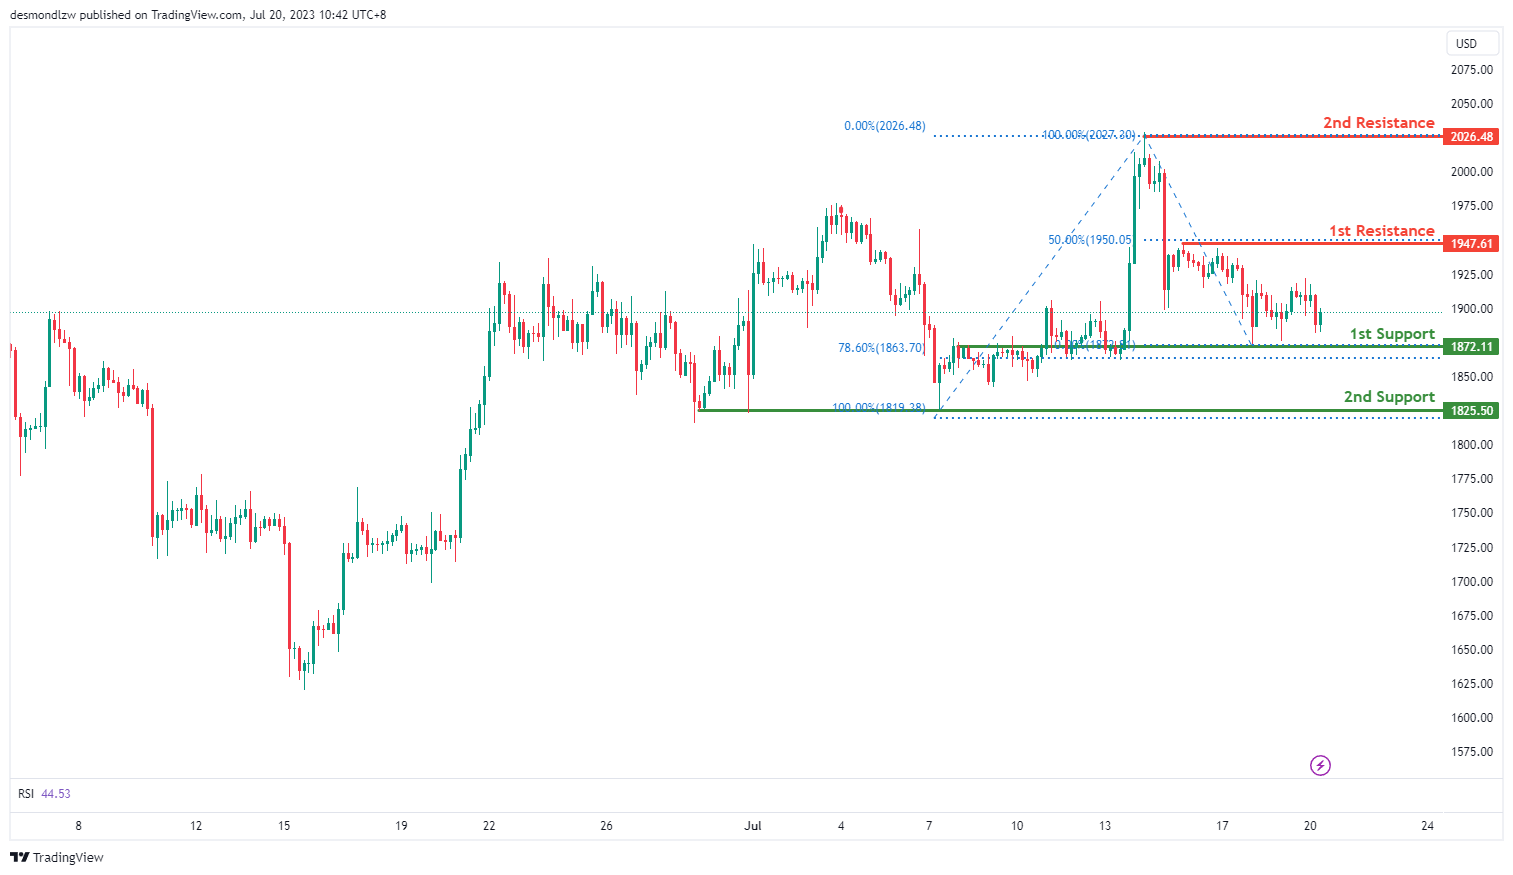
The ETH/USD chart demonstrates a bullish momentum, indicating the potential for a bullish continuation towards the 1st resistance level.
The 1st support level at 1872.11 is considered good due to its status as an overlap support and aligning with the 78.60% Fibonacci Retracement level. Additionally, the 2nd support at 1825.50 acts as a multi-swing low support.
On the upside, the 1st resistance level at 1947.61 represents a multi-swing high resistance and coincides with the 50% Fibonacci Retracement level. Furthermore, the 2nd resistance at 2026.48 is identified as a swing high resistance.
WTI/USD:
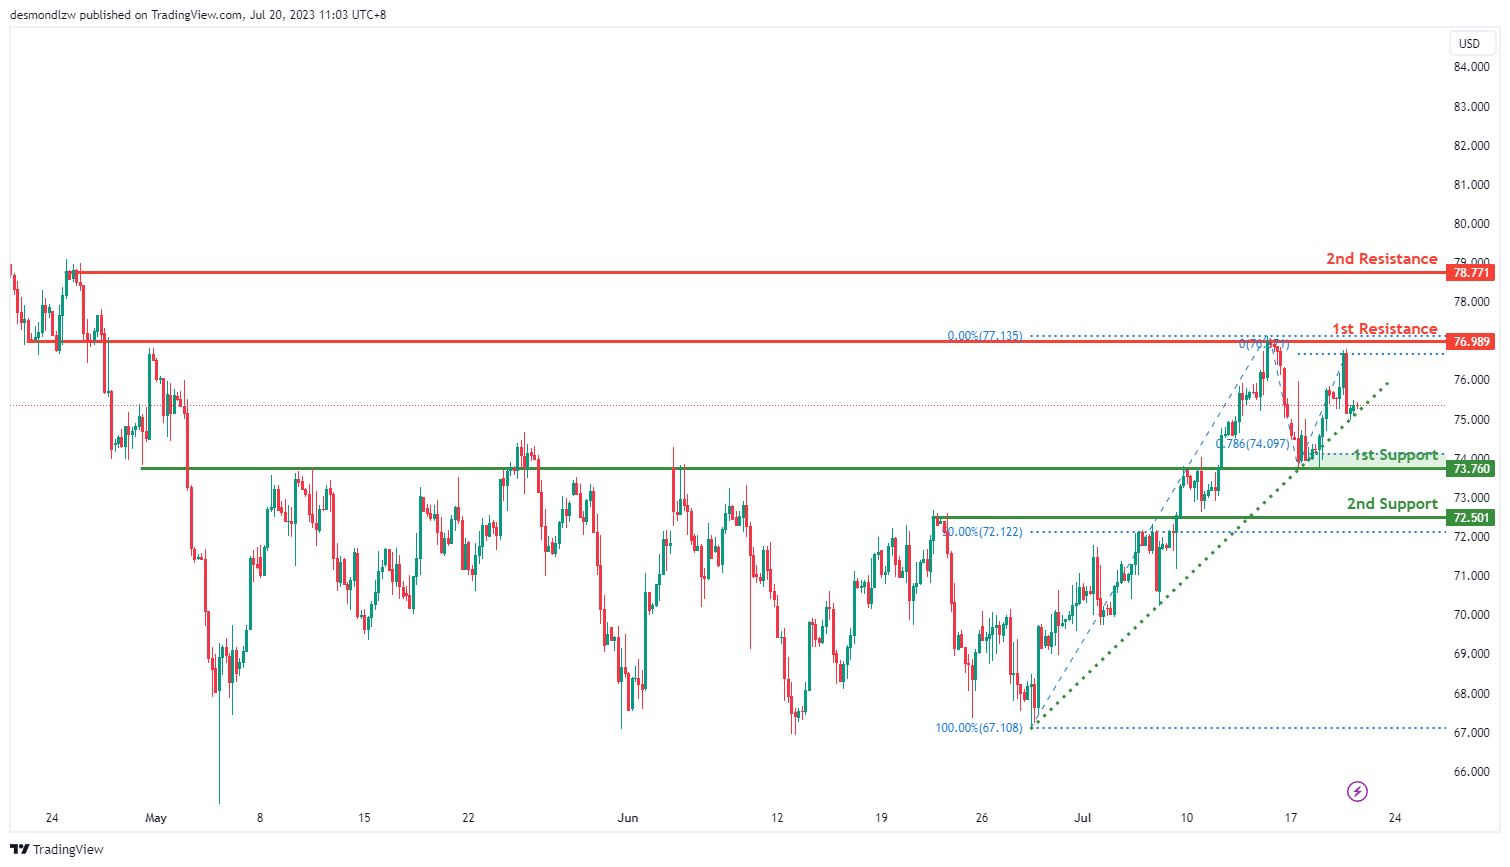
The WTI/USD chart currently shows a weak bullish momentum with low confidence. It is suggested that the price could potentially drop to the 1st support in the short term before bouncing back and rising towards the 1st resistance level.
The 1st support level is at 73.76, which has been identified as an overlap support. This could potentially provide a rebound point for the price in the event of a further decline.
The 2nd support level is at 72.50, recognized as an overlap support and also coincides with the 50% Fibonacci retracement level. This adds significance to the level as a potential barrier to further price declines.
On the flip side, if the price reverses its course and begins to climb, it may face resistance at 76.99, which is identified as an overlap resistance. This could potentially hinder the price’s upward movement.
A further rise in price might encounter the 2nd resistance at 78.77, another overlap resistance level. This level might act as a barrier to further upward movement.
XAU/USD (GOLD):
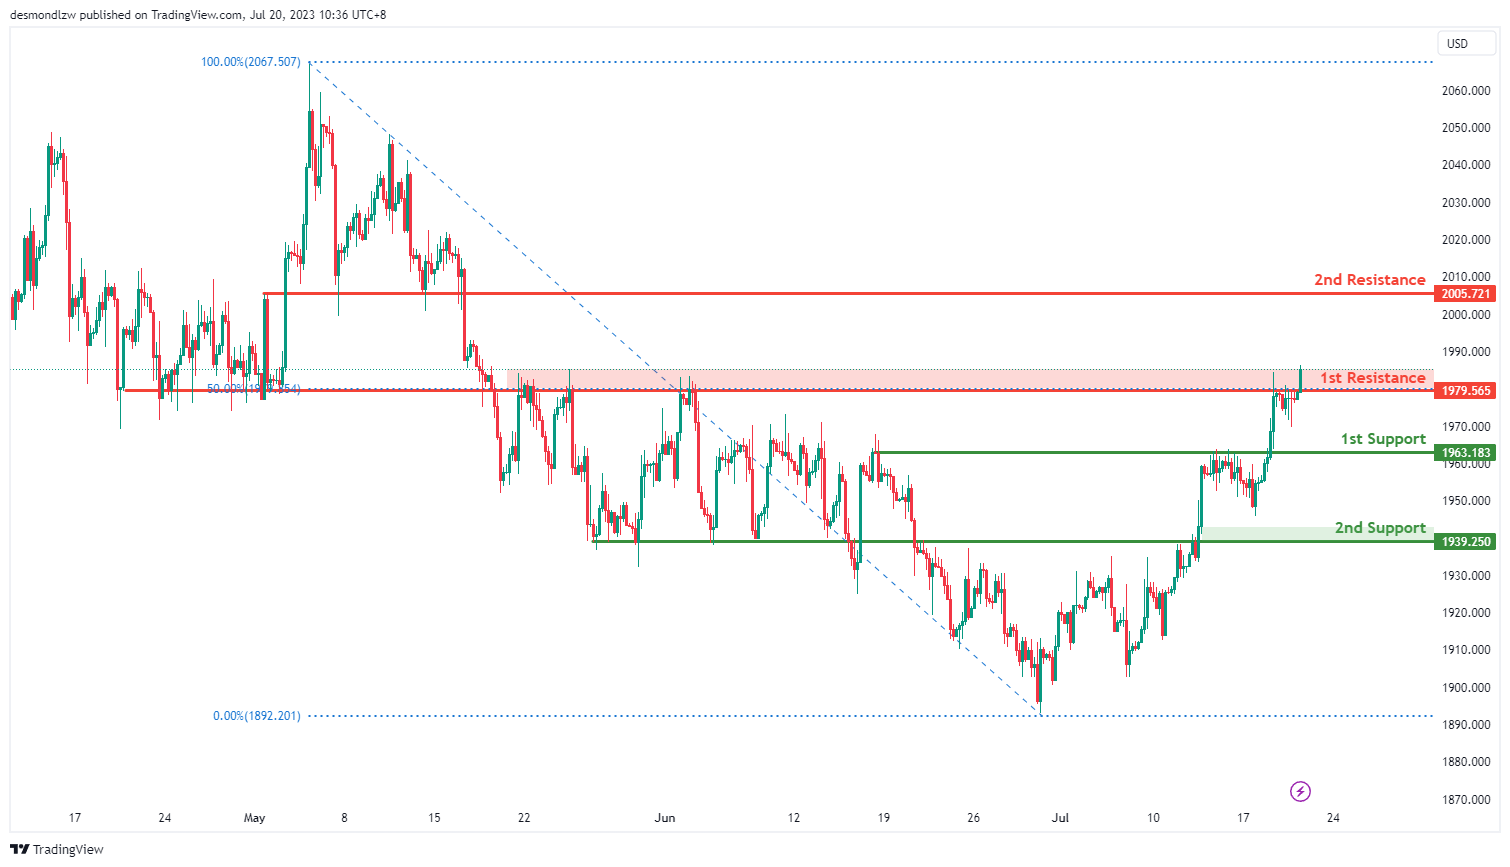
The XAU/USD (Gold) chart currently demonstrates a bullish overall momentum, suggesting the potential for a bullish breakout of the 1st resistance level and a subsequent rise towards the 2nd resistance level.
The 1st support level at 1963.18 is identified as a pullback support, providing a foundation for potential price rebounds. Additionally, the 2nd support level at 1939.25 serves as another pullback support, further reinforcing the bullish outlook.
On the upside, the 1st resistance level at 1979.56 is characterized as an overlap resistance, indicating a potential barrier to upward price movement. However, if the price successfully breaks through this resistance level, it could lead to a bullish surge towards the 2nd resistance level at 2005.72, which is identified as a pullback resistance.
Japan’s export to US up 11.7% yoy in Jun, to EU up 15%, to China down -11%
Japan's exports rose by 1.5% yoy to JPY 8744B in June. The significant rise in exports to US by 11.7% yoy and to EU by 15.0% yoy was offset by the -11.0% yoy decline in exports to China (marking the most significant drop since January).
Rise in US-bound exports was primarily driven by shipments of cars and mining machinery. Meanwhile, dip in exports to China was attributed the decreased shipments of steel, chips, and nonferrous metal, which led to an overall double-digit decline.
Japan's imports contracted by -12.9% yoy to JPY 8701B. The decrease in value of imports is primarily linked to drop in crude, coal, and liquefied natural gas.
As a result, Japan recorded a trade surplus of JPY 43B, the first such instance in nearly two years since July 2021.
In seasonally adjusted term, exports rose 3.3% mom to JPY 8269B. Imports rose 0.5% mom to JPY 8822B. Trade balance reported JPY -553B deficit, versus expectation of JPY -550B.
Australia employment grew 32.6k, but demand met by people working more hours
Australian's June employment data showed persistent tightness in the job markets. The 32.6k growth in employment significantly surpassed expectations of 15.0k. Employment-population ratio remained at record high. Monthly hours worked outpaced employment growth, suggesting that labor demand was met by people working more hours.
Among the 32.6k job growth, rise of 39.3k full-time employment was offset by a decrease of -6.7k in part-time roles. Unemployment rate remained steady at 3.5%, below expectation of 3.6%. Participation rate dipped slightly from 66.9% to 66.8%. Monthly hours worked rose 0.3% mom, faster than growth in employment at 0.2% mom.
Bjorn Jarvis, ABS head of labour statistics, stated: "The rise in employment in June saw the employment-to-population ratio remain at a record high 64.5 per cent, reflecting a tight labour market in which employment has recently increased in line with population growth."
He further emphasized that the current labour market is stronger than it was prior to the pandemic. Jarvis elaborated, "In addition to there being over a million more employed people than before the pandemic, a much higher share of the population is employed. In June 2023, 64.5 per cent of people 15 years or older were employed, an increase of 2.1 percentage points since March 2020."
Jarvis also highlighted the ongoing demand for labour, saying: "The strength in hours worked since late 2022, relative to employment growth, shows the demand for labour is continuing to be met, to some extent, by people working more hours."
BoE Ramsden: CPI inflation remains much too high
BoE Deputy Governor Dave Ramsden said yesterday, "CPI inflation has begun to fall significantly but remains much too high. The Monetary Policy Committee has consistently stressed that monetary policy decisions will address the risk of more persistent strength in domestic wage and price settling."
He went on to warn, "If there is evidence of more persistent pressures, then further tightening in monetary policy would be required."
Ramsden also mentioned BoE's efforts in reducing its holdings of gilts and corporate bonds, which he expects to decrease by a total of GBP 100B by October. However, he pointed out that the central bank has almost completely run off its portfolio of corporate debt, possibly paving way for it to sell more government bonds.
In light of these factors, Ramsden stated, "These factors support a carefully considered increase in the pace of reduction in the stock of gilts in the 12 months ahead." However, he also stressed caution, noting, "I emphasize careful — like the MPC, I want Quantitative Tightening (QT) to set a gradual and predictable pace for unwind and to let it operate in the background, after all."
NZD/USD Attempts Fresh Increase But Faces Hurdles
Key Highlights
- NZD/USD is moving higher from the 0.6225 zone.
- It broke a major bearish trend line with resistance near 0.6275 on the 4-hour chart.
- EUR/USD is holding gains above the 1.1150 support.
- GBP/USD corrected lower sharply from the 1.3140 zone.
NZD/USD Technical Analysis
The New Zealand Dollar found support near 0.6225 against the US Dollar. NZD/USD started a decent increase and broke the 0.6250 resistance.
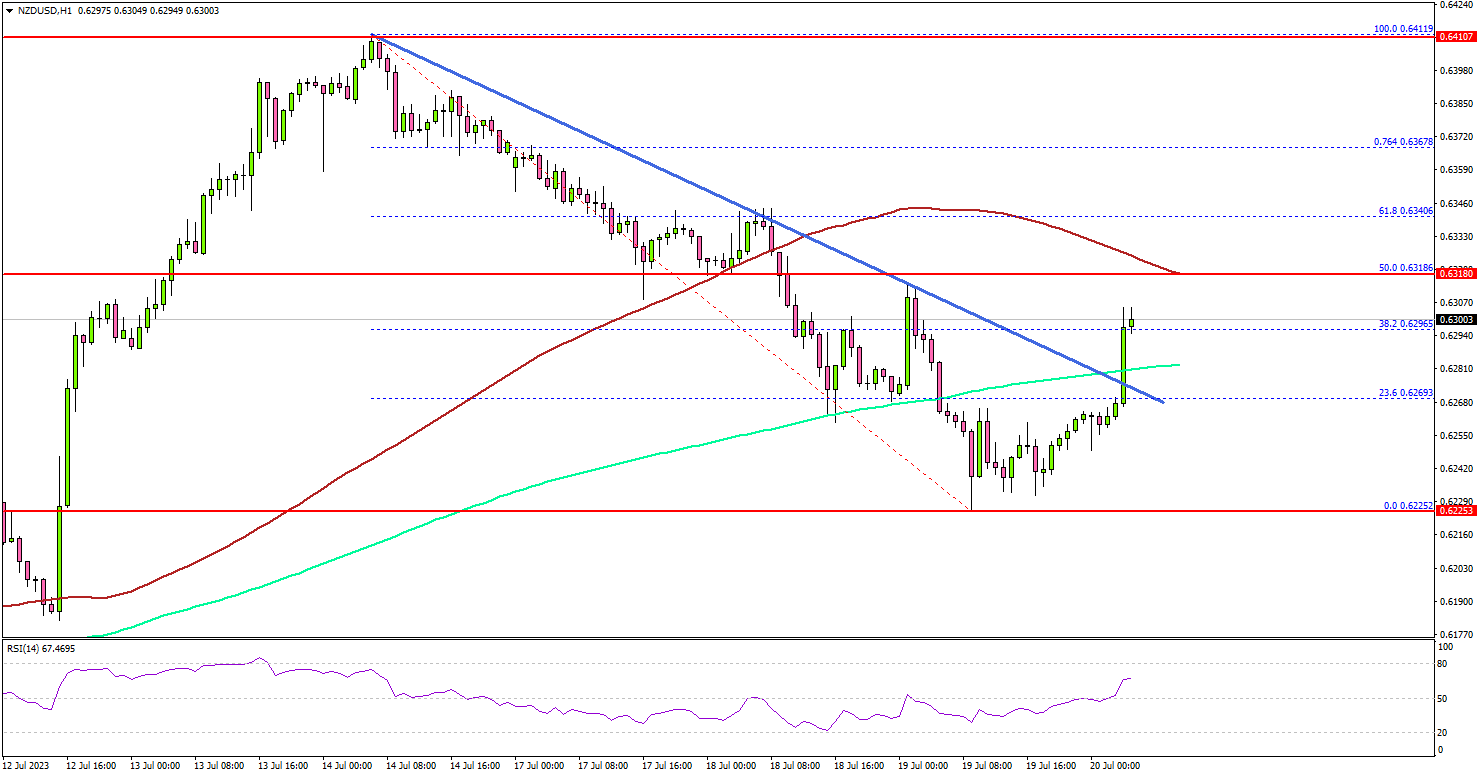
Looking at the 4-hour chart, the pair broke a major bearish trend line with resistance. There was a move above the 23.6% Fib retracement level of the downward move from the 0.6411 swing high to the 0.6225 low.
The pair is now trading above 0.6280 and the 200 simple moving average (green, 4 hours). It is facing resistance near the 0.6320 level and the 100 simple moving average (red, 4 hours).
The 50% Fib retracement level of the downward move from the 0.6411 swing high to the 0.6225 low is also near the 0.6320 zone. The next major resistance is near 0.6340. If there is a move above the 0.6340 resistance, the pair could rise toward 0.6380.
Any more gains might send the pair toward the 0.6410 resistance zone in the near term. Immediate support is near the 0.6280 level.
The next major support is seen near the 0.6225 level, below which there could be a drop to 0.6200. Any more losses might send the pair toward the 0.6150 support zone.
Looking at EUR/USD, the pair is now consolidating gains above 1.1150 and might attempt another increase in the near term.
Economic Releases
- US Existing Home Sales for June 2023 (MoM) - Forecast -0.1%, versus +0.2% previous.
- US Initial Jobless Claims - Forecast 242K, versus 237K previous.
Gold – Eyeing Another Move Above $2,000 as Inflation Outlook Improves?
- Progress on inflation driving gold’s gains
- UK becomes the latest to make significant improvements
- $2,000 a major psychological level
Gold broke higher again on Tuesday after briefly paring gains late last week and early this.
Lower yields and a weaker dollar are continuing to boost its appeal on the back of some more promising inflation data and lower interest rate expectations.
That inflation data has been both widespread, from the US to the eurozone and now the UK, and at both the headline and core levels, which is what’s offering so much hope.
Will lower inflation help gold to recapture $2,000?
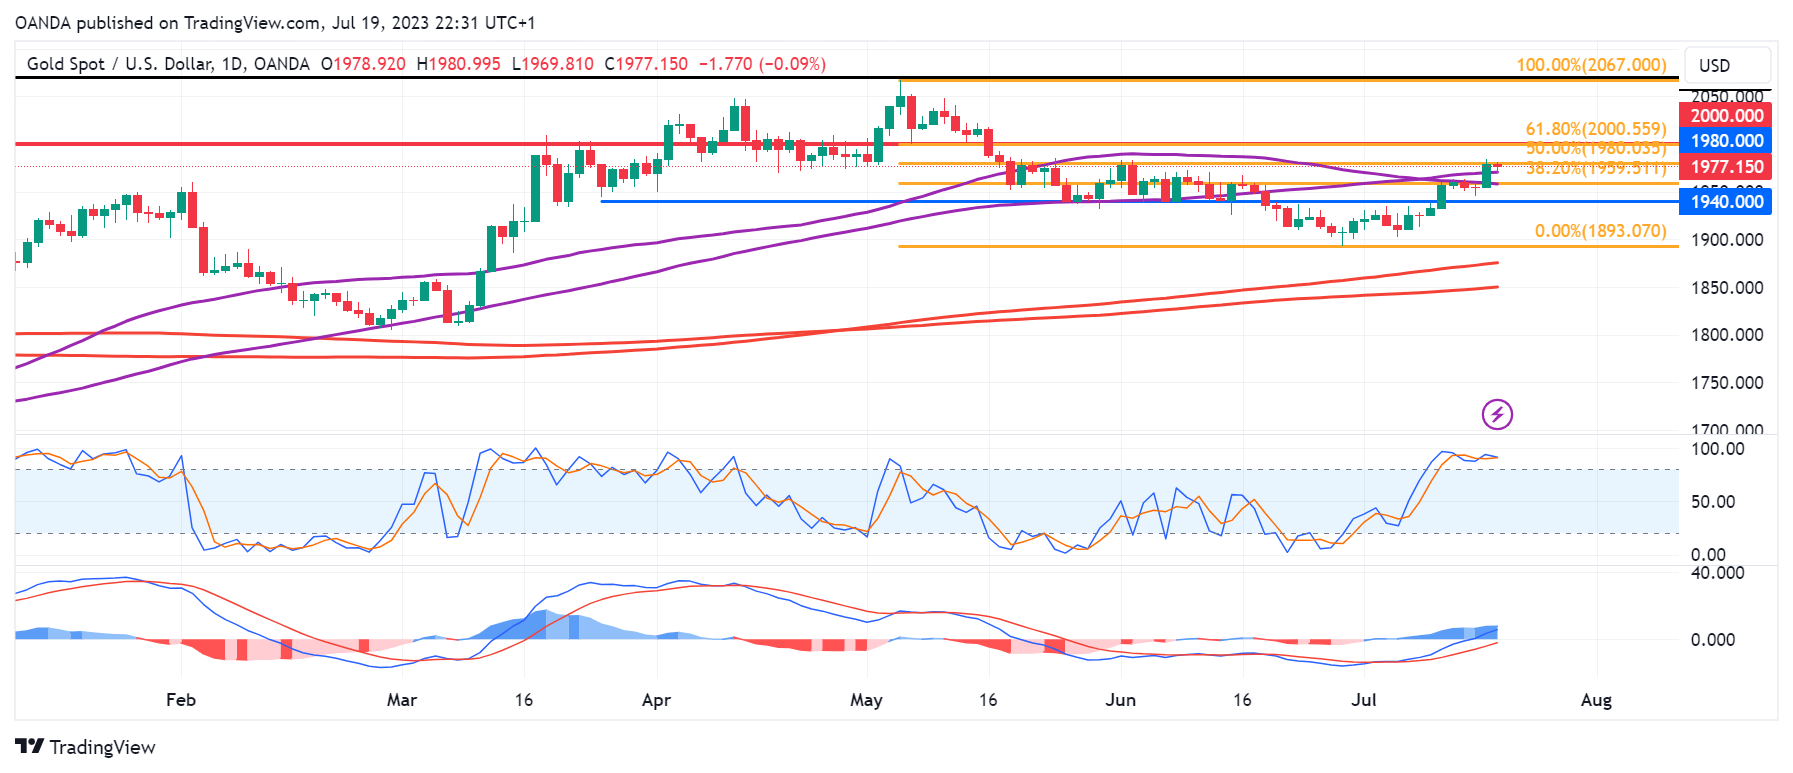
The yellow metal broke above $1,960 yesterday before running into some resistance around $1,980.
XAUUSD Daily
Source – OANDA on Trading View
A break above here could see it close in on $2,000 which is the next major barrier to the upside. A break of this may indicate traders have turned bullish on gold after two months of declines as up until now, it may have simply been experiencing a correction of recent declines.
Below, $1,940 still looks key, being a level that’s triggered so much support and resistance over the last four months. A break below could be perceived to be bearish and a sign that the move in July was in fact a correction and nothing more.
At this point, $1,900 could be key, with the 200/233-day simple moving average band below that a potential area of interest.
Nasdaq (NQ) Pullback Should Continue to Find Support
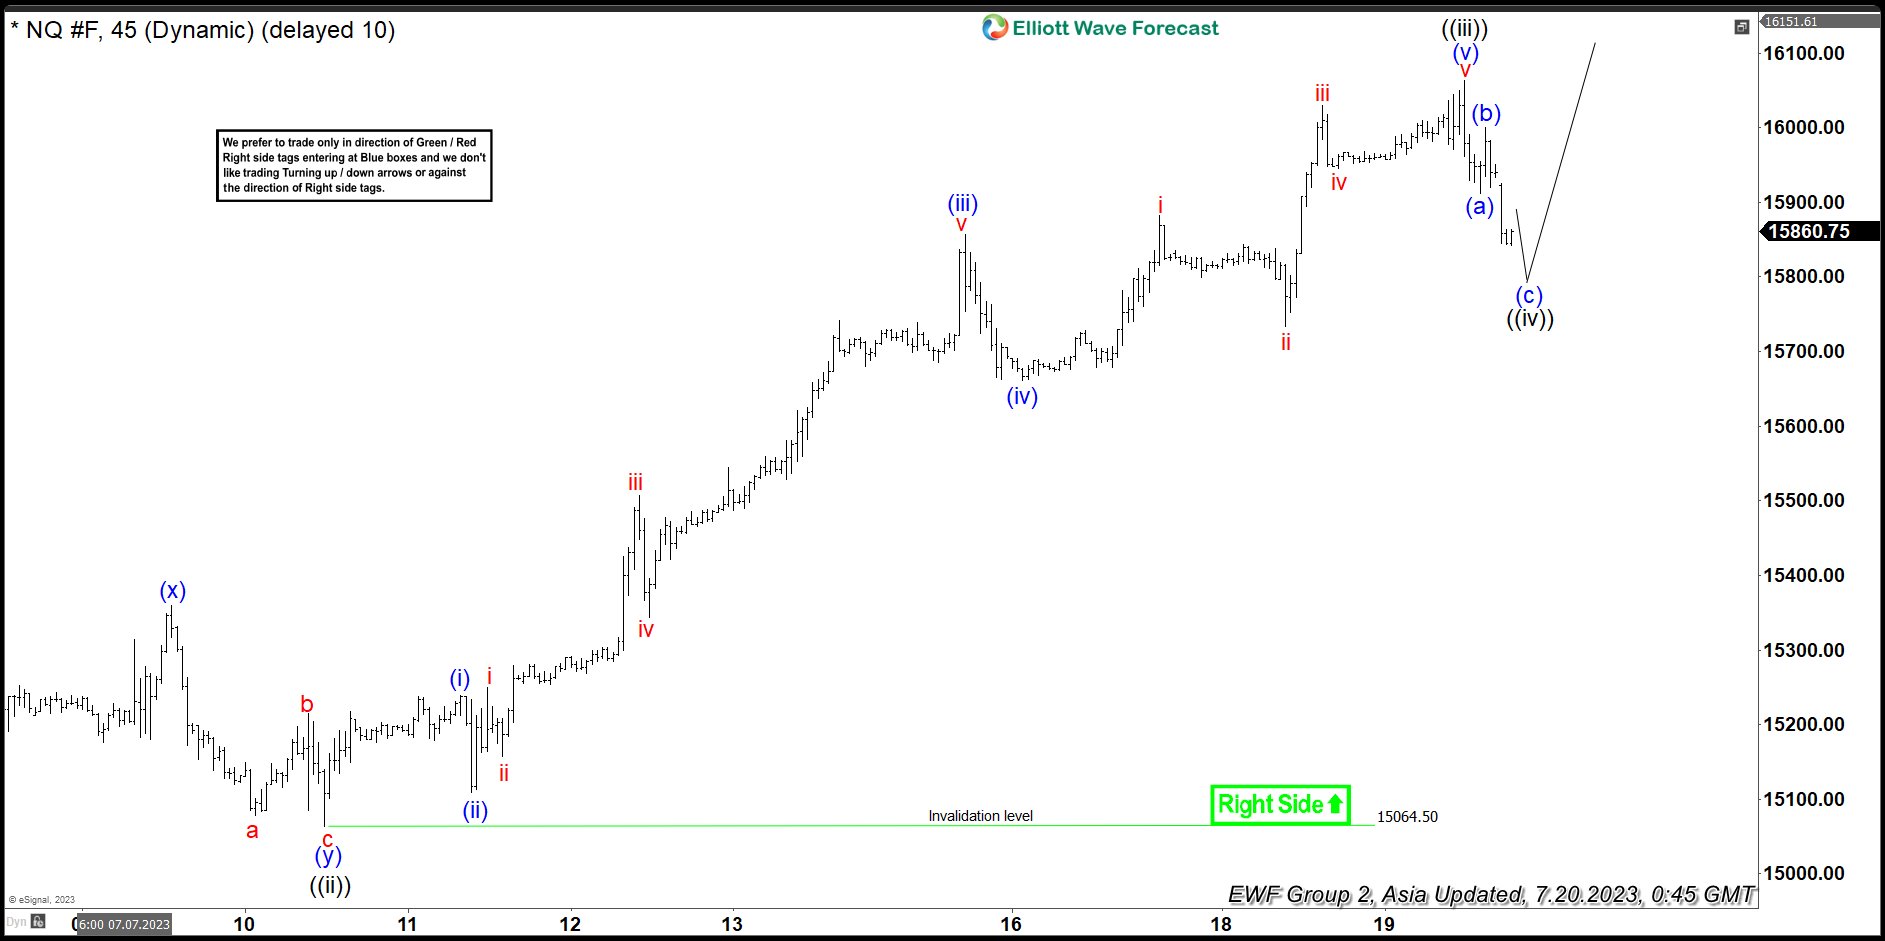
Short Term Elliott Wave View in Nasdaq (NQ) suggests the rally from 6.27.2023 low is in progress as a 5 waves impulse Elliott Wave structure. Up from 6.27.2023 low, wave ((i)) ended at 15432 and wave ((ii)) pullback ended at 15064.5. Internal subdivision of wave ((ii)) unfolded as a double three structure. Down from wave ((i)), wave (w) ended at 15111.5, wave (x) ended at 15359.75 and wave (y) lower ended at 15064.5. This completed wave ((ii)) in higher degree. The Index has resumed higher in wave ((iii)).
Up from wave ((ii)), wave (i) ended at 15239.75 and pullback in wave (ii) ended at 15109.50. The Index resumes higher in wave (iii) towards 15857.25 and dips in wave (iv) ended at 15661.50. Final leg higher wave (v) ended at 16062.75 which completed wave ((iii)). Pullback in wave ((iv)) is in progress as a zigzag structure. Down from wave ((iii)), wave (a) ended at 15911.25 and wave (b) ended at 16000. Expect wave (c) of ((iv)) to end soon. The Index should then resume higher in wave ((v)) to complete cycle from 6.7.2023 low. Near term, as far as pivot at 15064.5 low stays intact, expect pullback to find support in 3, 7, or 11 swing for further upside.
Nasdaq (NQ) 45 Minutes Elliott Wave Chart
NQ Elliott Wave Video
https://www.youtube.com/watch?v=dmXvUwtn7_o
USDJPY Wave Analysis
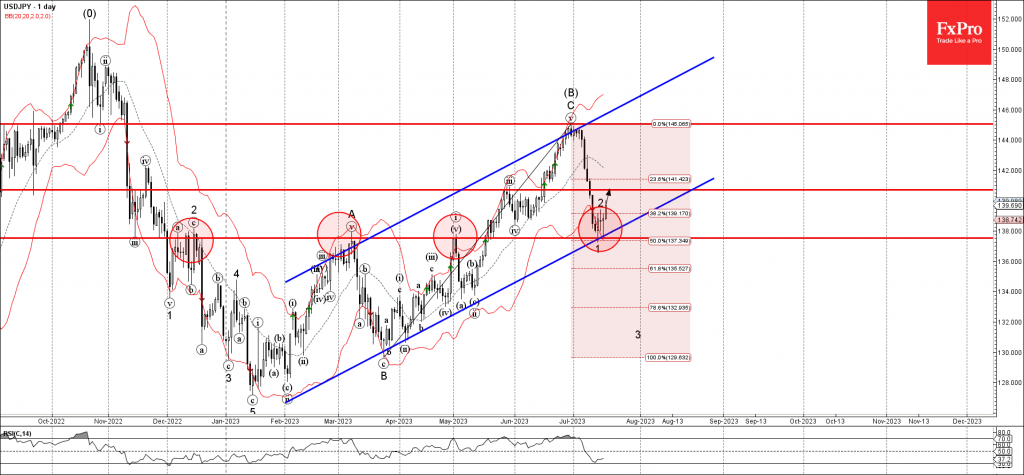
- USDJPY reversed from support level 137.50
- Likely to rise to resistance level 140.70
USDJPY currency pair previously reversed up from the key support level 137.50, former monthly high from March and May, strengthened by the lower daily Bollinger Band and by the support trendline of the daily up channel from February.
The upward reversal from the support level 137.50 started the active short-term correction 2.
Given the active mid-term uptrend, USDJPY currency pair can be expected to rise further toward the next resistance level 140.70.
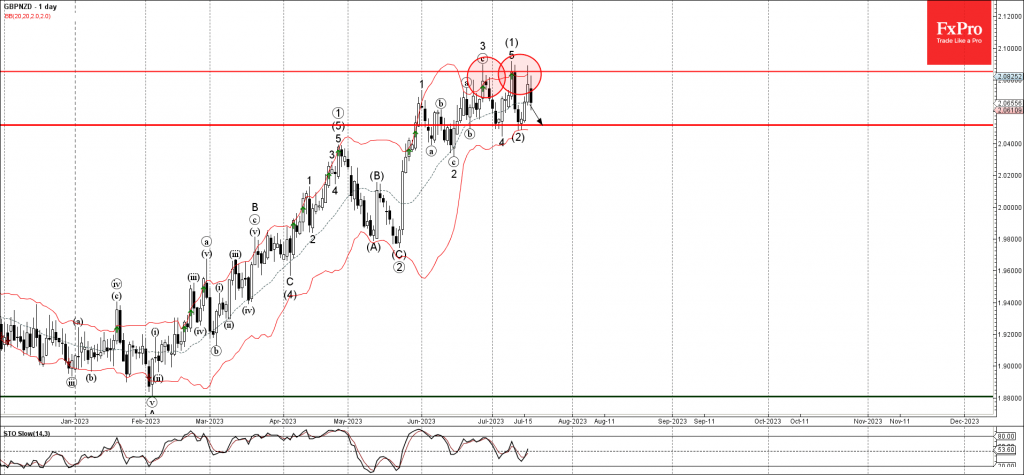
GBPNZD Wave Analysis
- GBPNZD reversed from key resistance level 2.0855
- Likely to fall to support level 2.0500
GBPNZD currency pair recently reversed down from the key resistance level 2.0855, intersecting with the upper daily Bollinger Band.
The downward reversal from the resistance level 2.0855 stopped the intermediate impulse wave (3) from the middle of this month.
Given the strength of the resistance level 2.0855, GBPNZD currency pair can be expected to fall further toward the next support level 2.0500 (low of the previous corrections 4 and (2)).