

Sample Category Title
Sterling Takes a Tumble as Inflation Falls
- UK inflation eases more than expected
- British pound tumbles close to 1%
Pound slides as UK inflation lower than expected
The British pound is sharply lower on Wednesday. In the European session, GBP/USD is trading at 1.2916, down 0.92%. The pound’s fall was driven by Wednesday’s UK inflation report, which showed that CPI fell to 7.9% in June, down from 8.7% in May. This marked the lowest inflation level since February 2022. The decline was driven by lower prices for food and motor fuel. Core CPI declined slightly, from 7.1% to 6.9%.
Investors gave the positive inflation two thumbs up, with the markets now expecting the cash rate to peak around 6%, compared to 6.5% earlier in July. The markets have revised lower expectations for a 0.50% hike from the BoE in August to about one in two – prior to the inflation report, a 0.50% increase was almost fully priced in. As well, the yield on two-year gilts fell more than 20 basis points to 4.86% after the inflation report.
The Bank of England has a rough time with inflation, which remains high despite the BoE’s aggressive tightening cycle. The BoE desperately needed a positive inflation report and will also be encouraged by services inflation, a key gauge of domestic inflation, which fell to 7.2% in June, down from 7.4% in May.
Inflation is moving in the right direction, albeit slowly. The BoE’s target of 2% remains far away and core inflation has been persistently high. The BoE will likely need to continue raising rates in the coming months in order to bring inflation closer to target. The UK boasts the record for the highest inflation rate in the G-7 and the government has set its sights on pushing inflation lower to 5%.
GBP/USD Technical
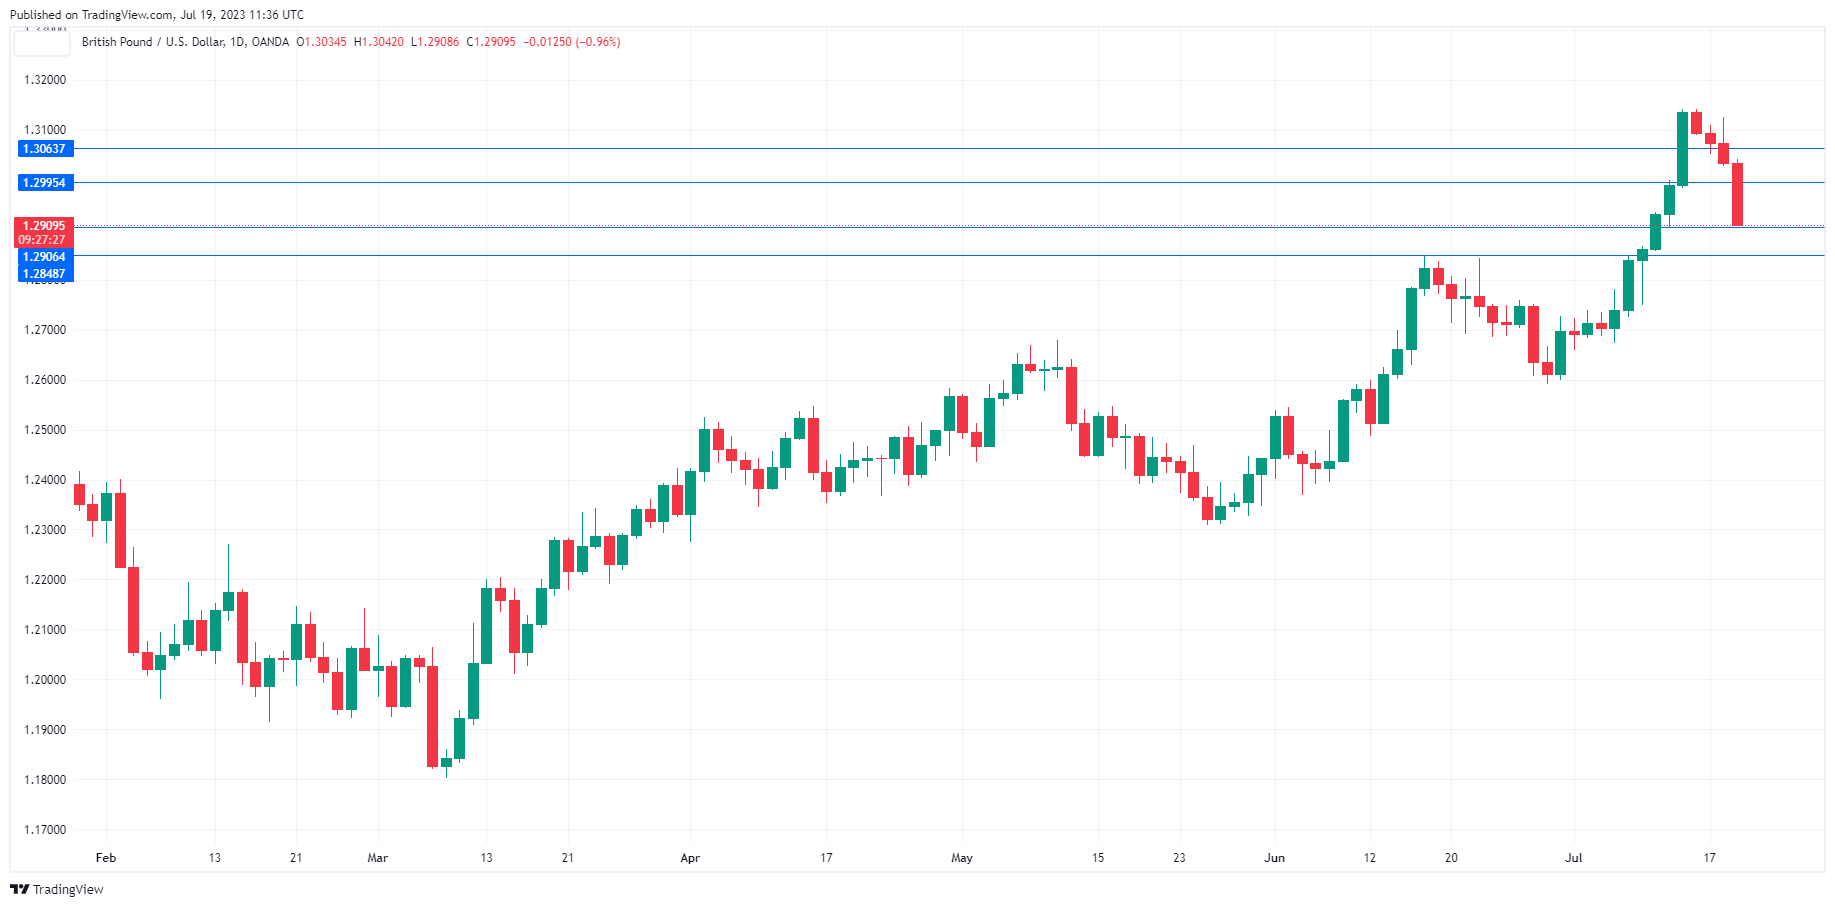
- GBP/USD has support at 1.2995 and 1.2906
- There is resistance at 1.3077 and 1.3116
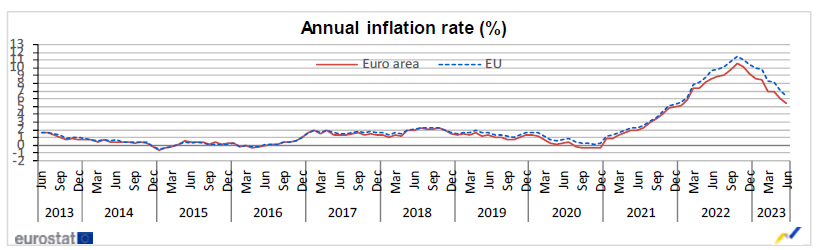
Eurozone CPI finalized at 5.5% in Jun, core CPI at 5.5%
Eurozone CPI was finalized at 5.5% yoy in June, down from May's 6.1% yoy. Core CPI (excluding energy, food, alcohol & tobacco) was finalized at 5.5% yoy, up from May's 5.3% yoy.
The highest contribution to annual Eurozone inflation rate came from food, alcohol & tobacco (+2.35%), followed by services (+2.31%), non-energy industrial goods (+1.42%) and energy (-0.57%).
EU CPI was finalized at 6.4% yoy, down from May's 7.1% yoy. The lowest annual rates were registered in Luxembourg (1.0%), Belgium and Spain (both 1.6%). The highest annual rates were recorded in Hungary (19.9%), Slovakia (11.3%) and Czechia (11.2%). Compared with May, annual inflation fell in twenty-five Member States, remained stable in one and rose in one.
EUR/USD Aims More Upsides, USD/CHF Turns Red
EUR/USD started a strong increase above the 1.1150 resistance. USD/CHF is showing bearish signs below the 0.8650 resistance zone.
Important Takeaways for EUR/USD and USD/CHF Analysis Today
- The Euro gained pace against the US Dollar after it broke the 1.1150 resistance.
- There is a major bullish trend line forming with support near 1.1225 on the hourly chart of EUR/USD at FXOpen.
- USD/CHF is consolidating losses below the 0.8650 resistance.
- There is a key bearish trend line forming with resistance near 0.8590 on the hourly chart at FXOpen.
EUR/USD Technical Analysis
On the hourly chart of EUR/USD at FXOpen, the pair started a strong increase and was able to settle above the 1.1150 resistance zone. The Euro even broke above 1.1200 to move into a bullish zone against the US Dollar.
Finally, it tested the 1.1275 zone. A high is formed near 1.1275 and the pair is now correcting gains. There was a move below the 23.6% Fib retracement level of the upward wave from the 1.1130 swing low to the 1.1275 high.
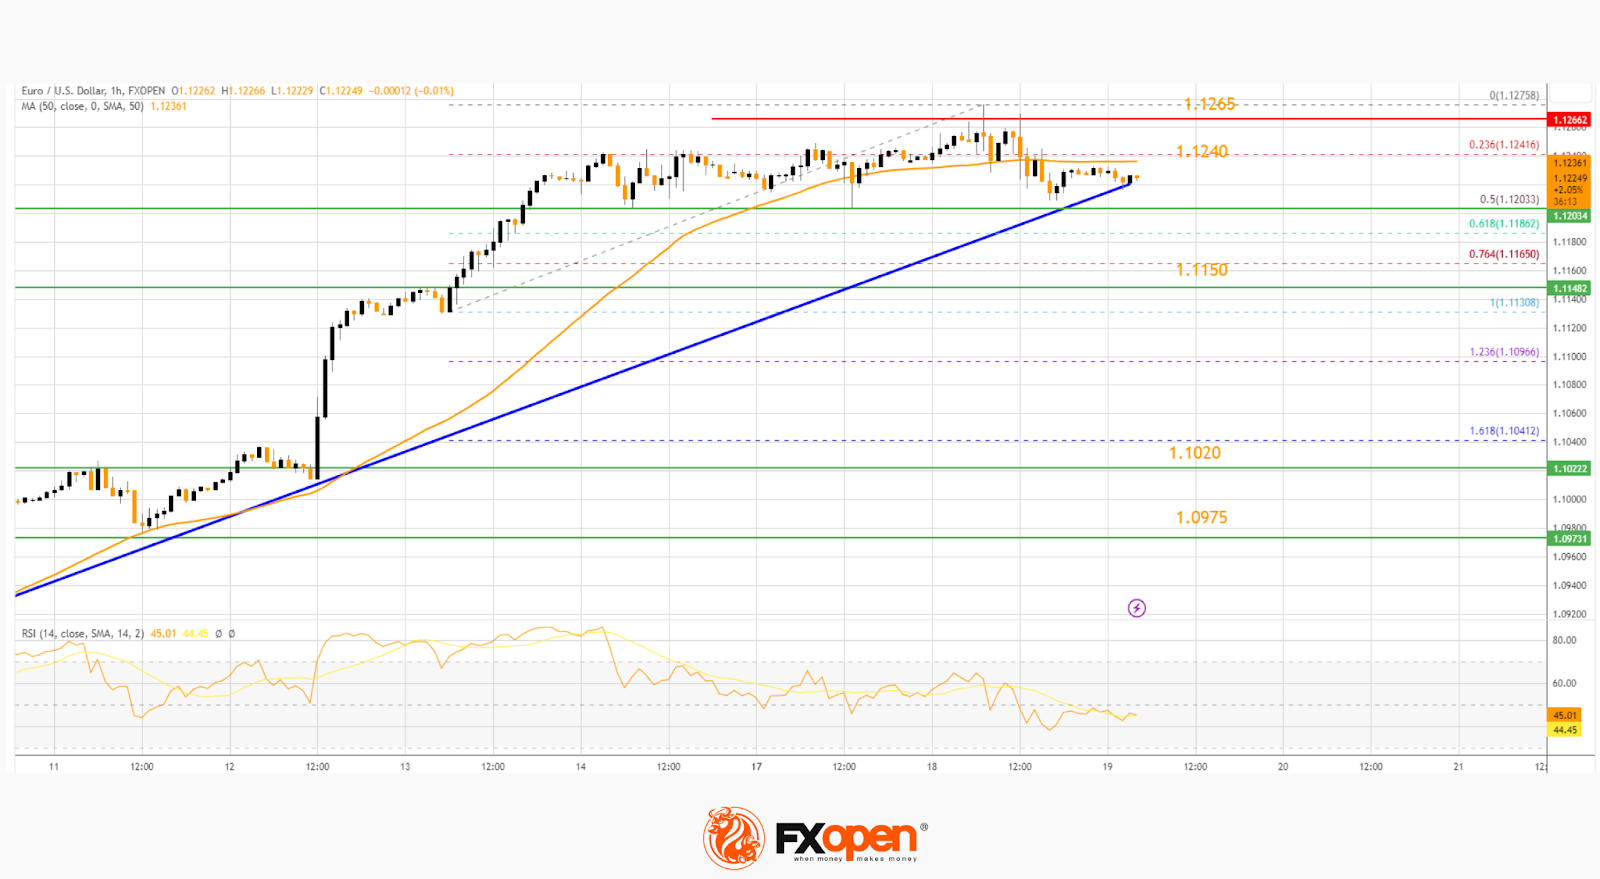
The pair is now trading below the 50-hour simple moving average. However, there is a major bullish trend line forming with support near 1.1225.
The next major support is near the 50% Fib retracement level of the upward wave from the 1.1130 swing low to the 1.1275 high, at 1.2000. A break below the 1.1200 support could send the pair toward the 1.1150 level.
Immediate resistance on the EUR/USD chart is near the 50-hour simple moving average at 1.1240. The first major resistance is near the 1.1265 level.
An upside break above 1.1265 might send the pair toward the 1.1320 level. The next major resistance is near the 1.1365 level. Any more gains might open the doors for a move toward 1.1440.
USD/CHF Technical Analysis
On the hourly chart of USD/CHF at FXOpen, the pair started a major decline from well above 0.8800. The US Dollar gained bearish momentum after it broke the 0.8600 level against the Swiss Franc.
The pair even declined below 0.8650 and tested 0.8570. A low is formed near 0.8569 and the pair is now consolidating losses. On the upside, USD/CHF is now facing resistance near a key bearish trend line at 0.8590.
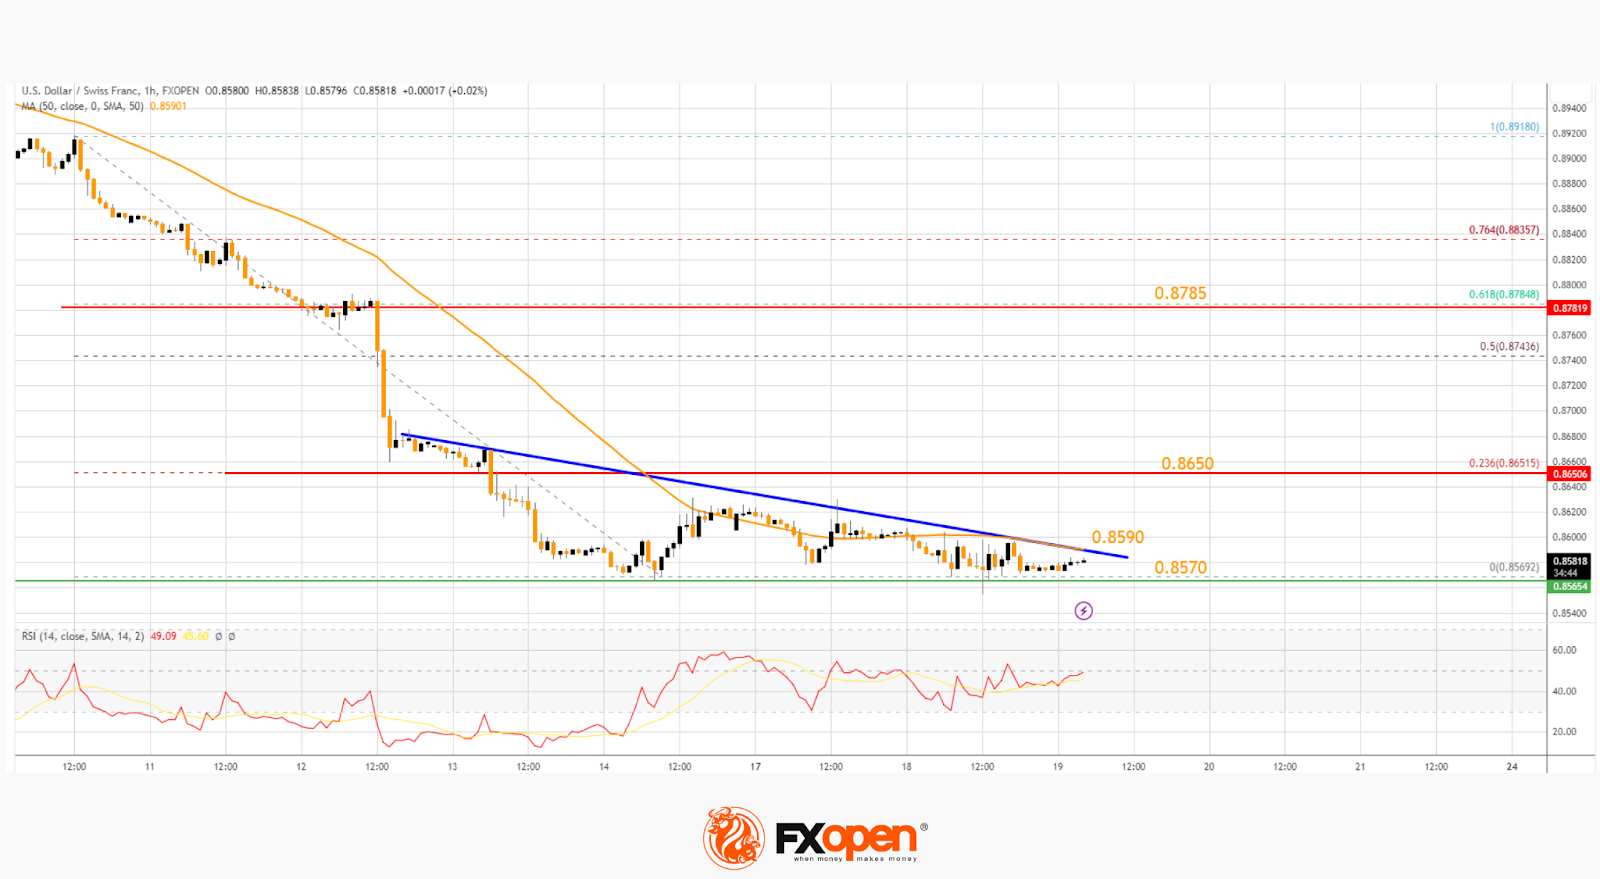
The trend line is near the 50-hour simple moving average. A break above it could send the pair toward the 23.6% Fib retracement level of the downward move from the 0.8918 swing high to the 0.8569 low, at 0.8650.
The next major resistance is near the 0.8785 level. If there is a clear break above the 0.8785 resistance zone, the pair could start another increase. In the stated case, it could even surpass 0.8880.
On the downside, immediate support on the USD/CHF chart is near 0.8570. The first major support is near the 0.8550 level. The next major support is near the 0.8510 level. Any more losses may possibly open the doors for a move toward the 0.8440 level in the coming days.
USD/JPY Technical Analysis
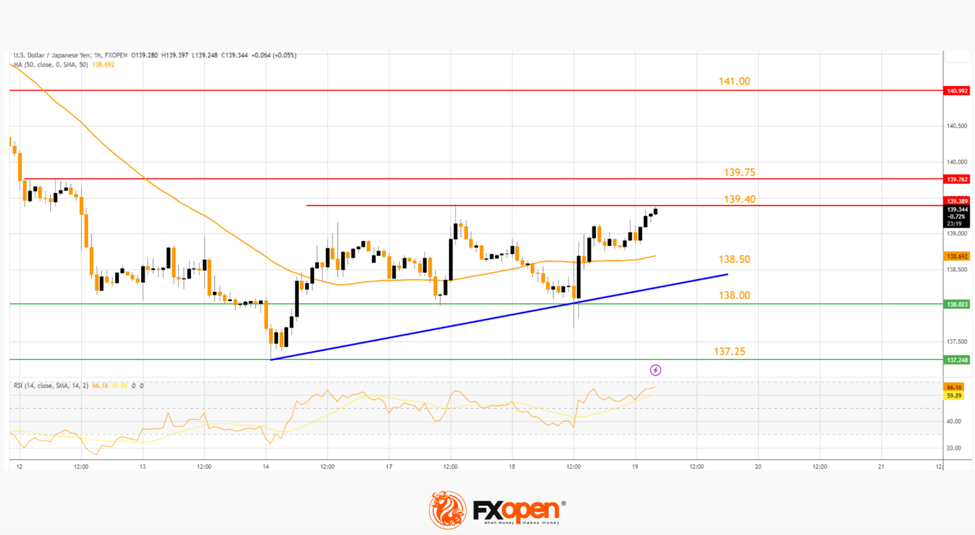
On the hourly chart of USD/JPY at FXOpen, the pair started a fresh increase from the 137.25 support zone. The US Dollar climbed higher above the 138.00 resistance against the Japanese Yen.
The pair is now showing positive signs above the 50-hour simple moving average. Immediate resistance on the upside is near 139.40. The first major resistance is near the 139.75 level, above which the pair might gain bullish momentum.
In the stated case, the pair could rise towards the 141.00 handle. A clear break above 141.00 could push the pair further towards 142.00.
If there is a fresh decline, the pair might find support near the 138.50 level. The next important level is near 138.00, below which there is a risk of a drop toward the 137.25 level.
AUD/USD: Falls to One-Week Low on Fresh Acceleration Lower
Bears regained control on Wednesday after Tuesday’s Doji candle signaled indecision and kept the action temporarily on hold.
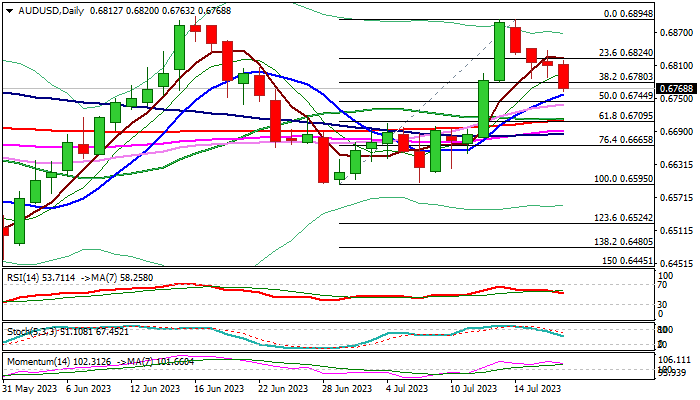
Extension of a pullback from 0.6894 double-top (July 13/14) generated fresh negative signal on break through Fibo support at 0.6780 (38.2% retracement of 0.6595/0.6894 rally), hitting one-week low on 0.65% drop in early European trading.
Close below 0.6894 pivot to keep the downside at risk, as bears pressure rising 10DMA (0.6757) and nearby 50% retracement at 0.6744, violation of which to confirm reversal and unmask the lower boundary of the recent range (0.6595/0.6899).
South-heading 14-d momentum, RSI and stochastic, maintain bearish pressure, though partially offset by daily MA’s still in full bullish setup.
Near-term bias is expected to remain with bears while the action stays below pivotal barriers at 0.6780/88 (broken Fibo 38.2% / July 17/18 spike lows).
Gloomy China’s economic growth outlook weighs on Aussie dollar, while traders await for fresh signals from Australia’s employment report (due early Thursday).
Res: 0.6780; 0.6788; 0.6824; 0.6837.
Sup: 0.6757; 0.6744; 0.6709; 0.6665.
Bitcoin Hits July Low
The crypto community continues to discuss the victory of Ripple Labs in court against the SEC, expecting that the regulator:
- also loses in court against Binance, Coinbase;
- approves Black Rock's Bitcoin ETF application.
Crypto exchanges are resuming trading in the XRP token, and according to media reports, Congressman Richie Torres has appealed to SEC Chairman Gary Gensler to stop attacking cryptocurrencies.
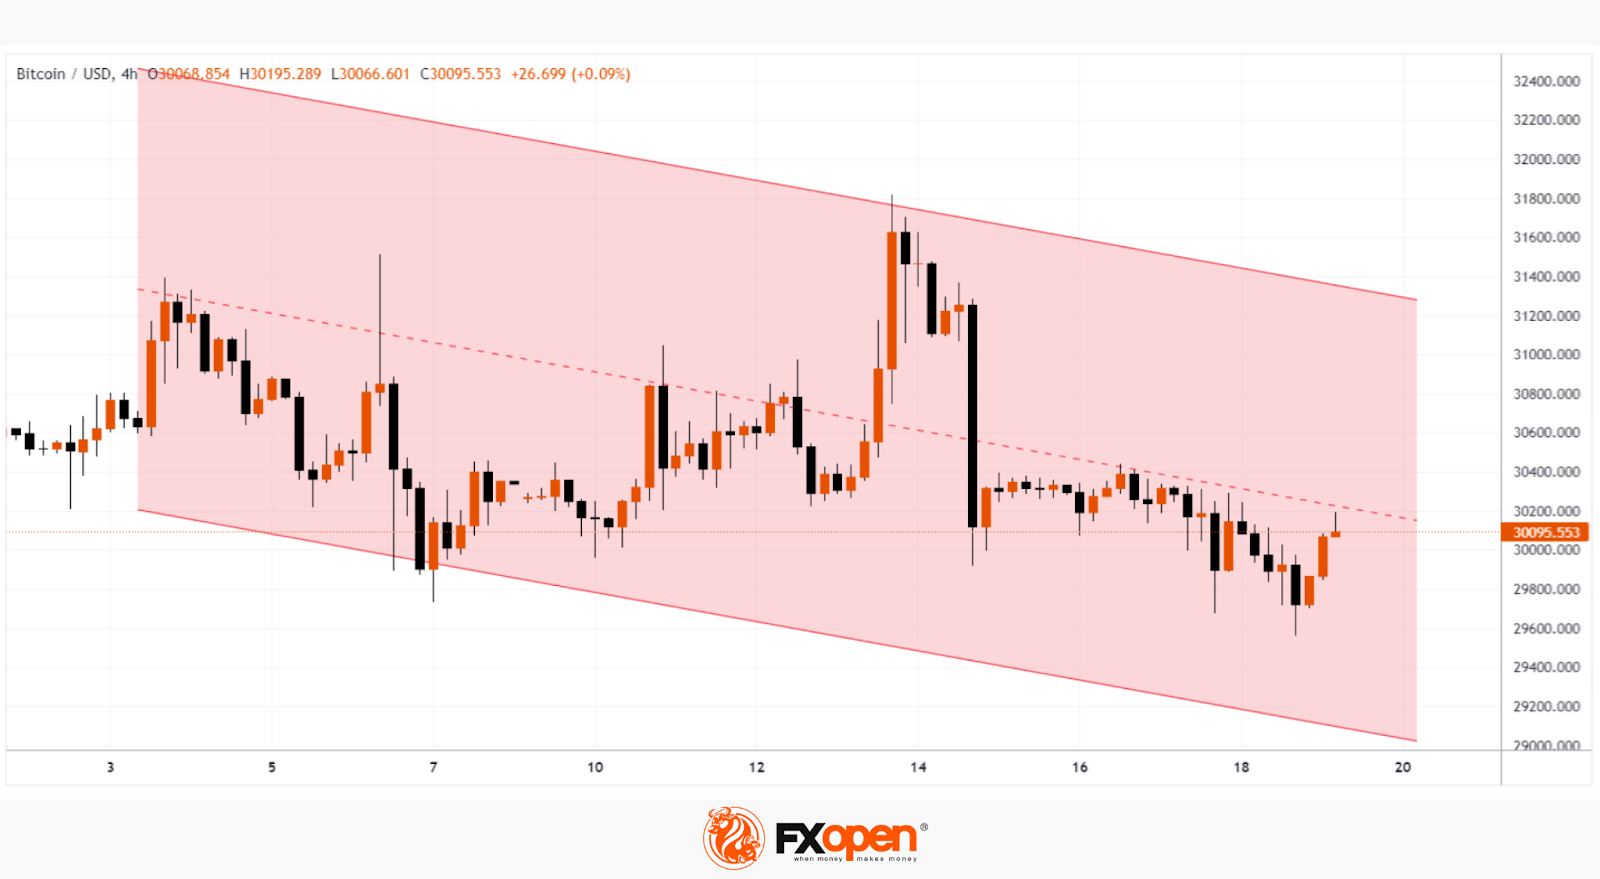
However, the BTC/USD chart does not show the proper bullish mood, having updated the July low yesterday. Moreover, we can see:
- bearish engulfing on July 13-14 on the daily chart — a pattern indicating strong selling pressure at the top of the market;
- slow downward drift after this pattern.
This behaviour of the BTC/USD price may indicate that the bulls cannot take the initiative in the market, despite the positive fundamental background. This should alert those who believe in growth — especially if the price of BTC/USD continues to decline within the channel shown in red.
Gold Consolidates After Posting Fresh 2-Month Peak
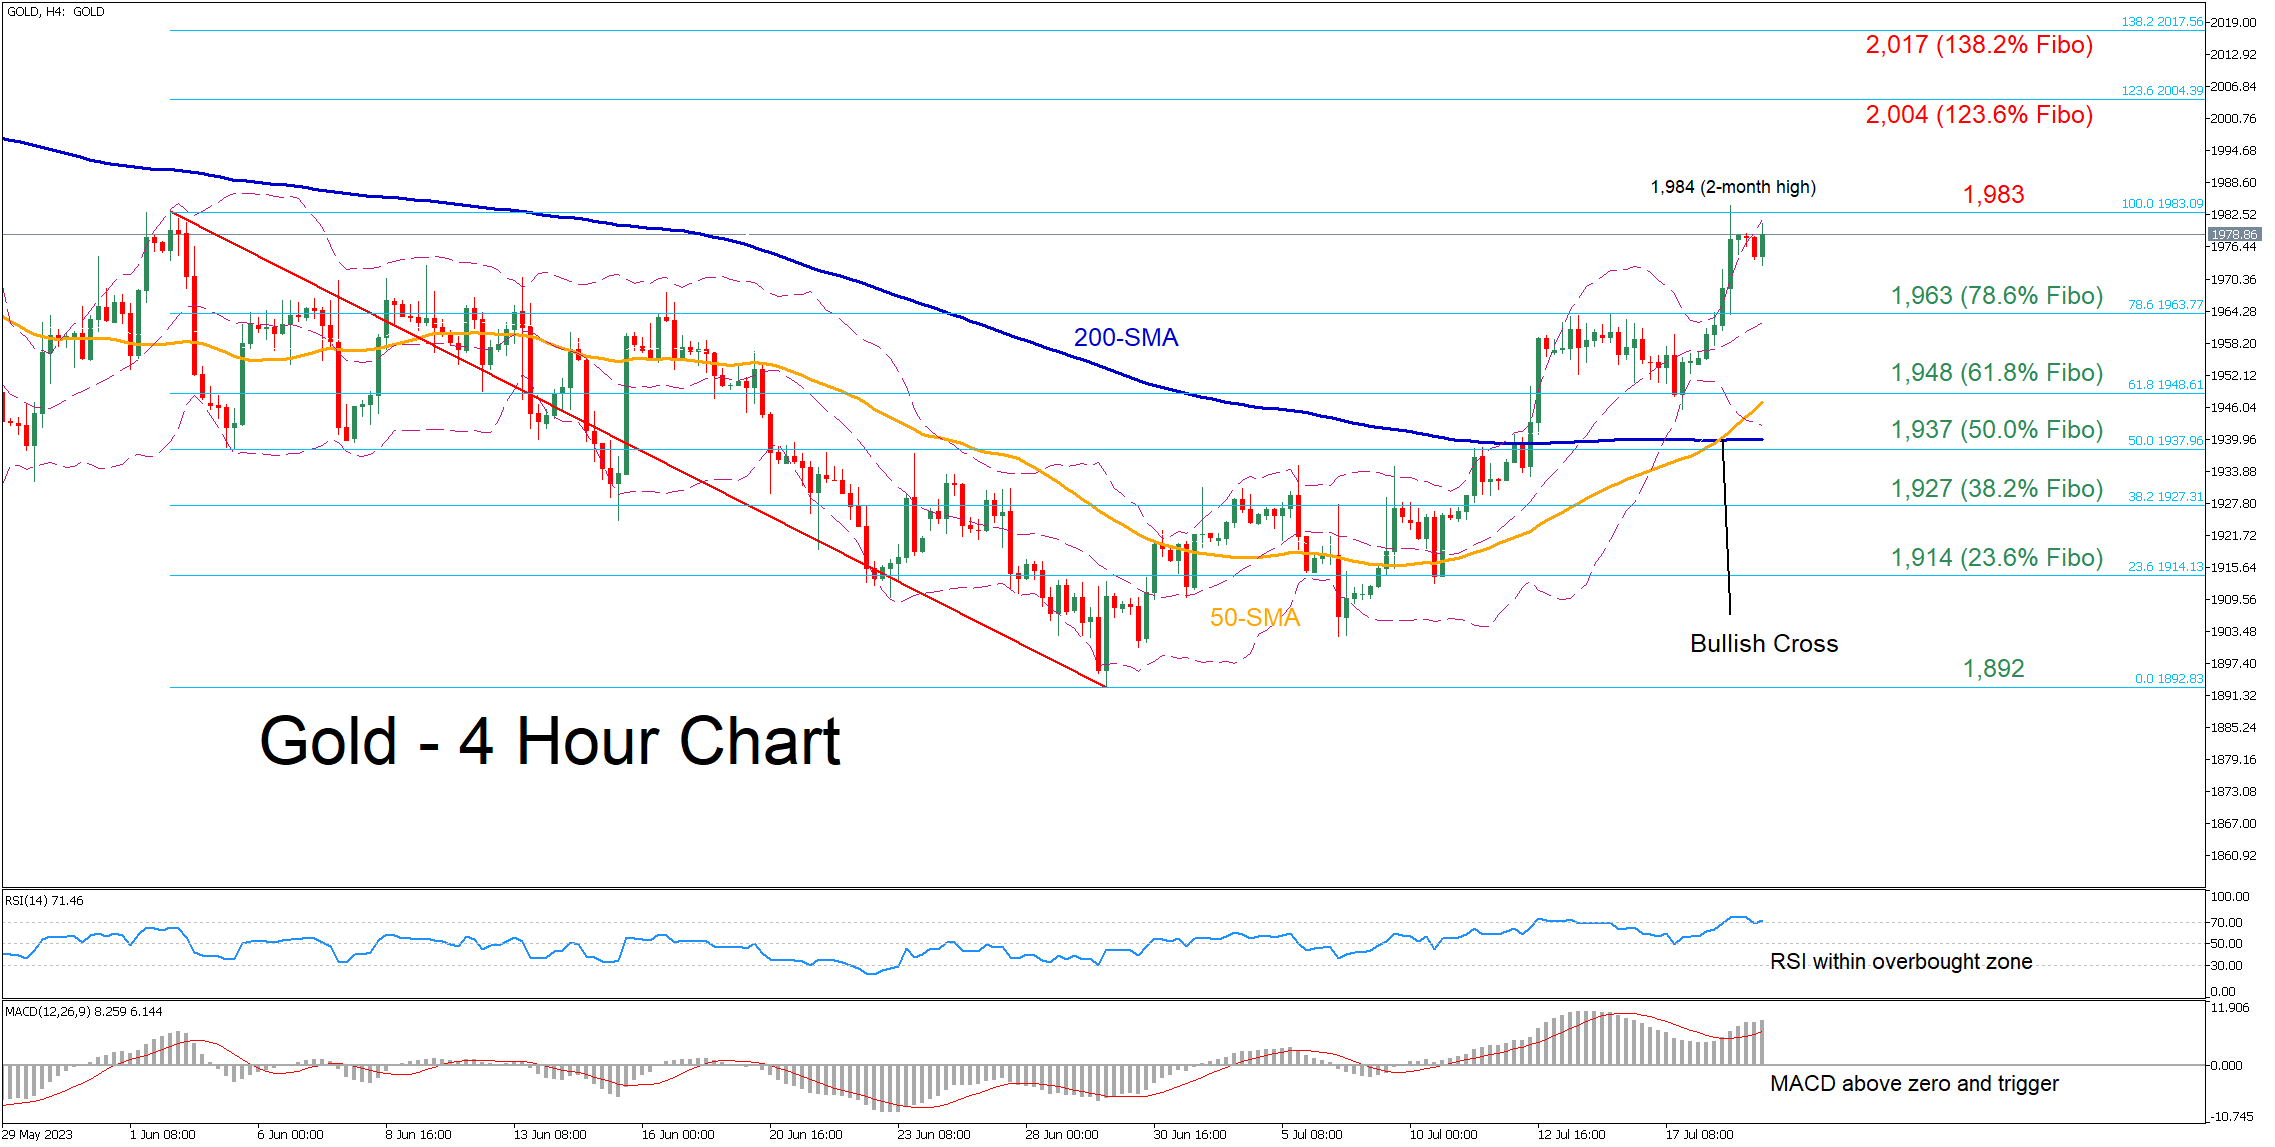
Gold has been in an uptrend since late June when the price found its feet slightly below the 1,900 psychological mark. Even though bullion recently stormed to a fresh two-month high of 1,984, it has been trading sideways for the last few four-hour sessions, appearing unable to extend its rally.
The momentum indicators are endorsing a bullish near-term bias. Specifically, the RSI is holding above its 70-overbought zone, while the MACD is strengthening above both zero and its red signal line. Considering that the price is trading very close to its upper Bollinger Band, it could also be argued that it has reached overbought conditions.
Should bulls try to push the price higher, the recent two-month high of 1,984 could act as the first resistance territory. Breaking above that zone, the price could challenge 2,004, which is the 123.6% Fibonacci extension of the 1,983-1,892 downtrend observed in June. If gold storms higher to post fresh multi-month peaks, the 138.2% Fibo of 2,017 may curb any upside attempts.
On the flipside, bearish actions could send the price to initially test the 78.6% Fibo of 1,963. Even lower, the attention could shift to the 61.8% Fibo of 1,948 before the 50.0% Fibo of 1,937 gets tested. Further declines might then cease at the 38.2% Fibo of 1,927.
In brief, gold has been steadily gaining ground since early July, while the recent completion of a golden cross between the 50-period simple moving average (SMA) and the 200-period SMA could act as an additional tailwind. However, a pullback should not be ruled out as the price has approached overbought conditions.
EURGBP Powers Higher After UK CPI Miss
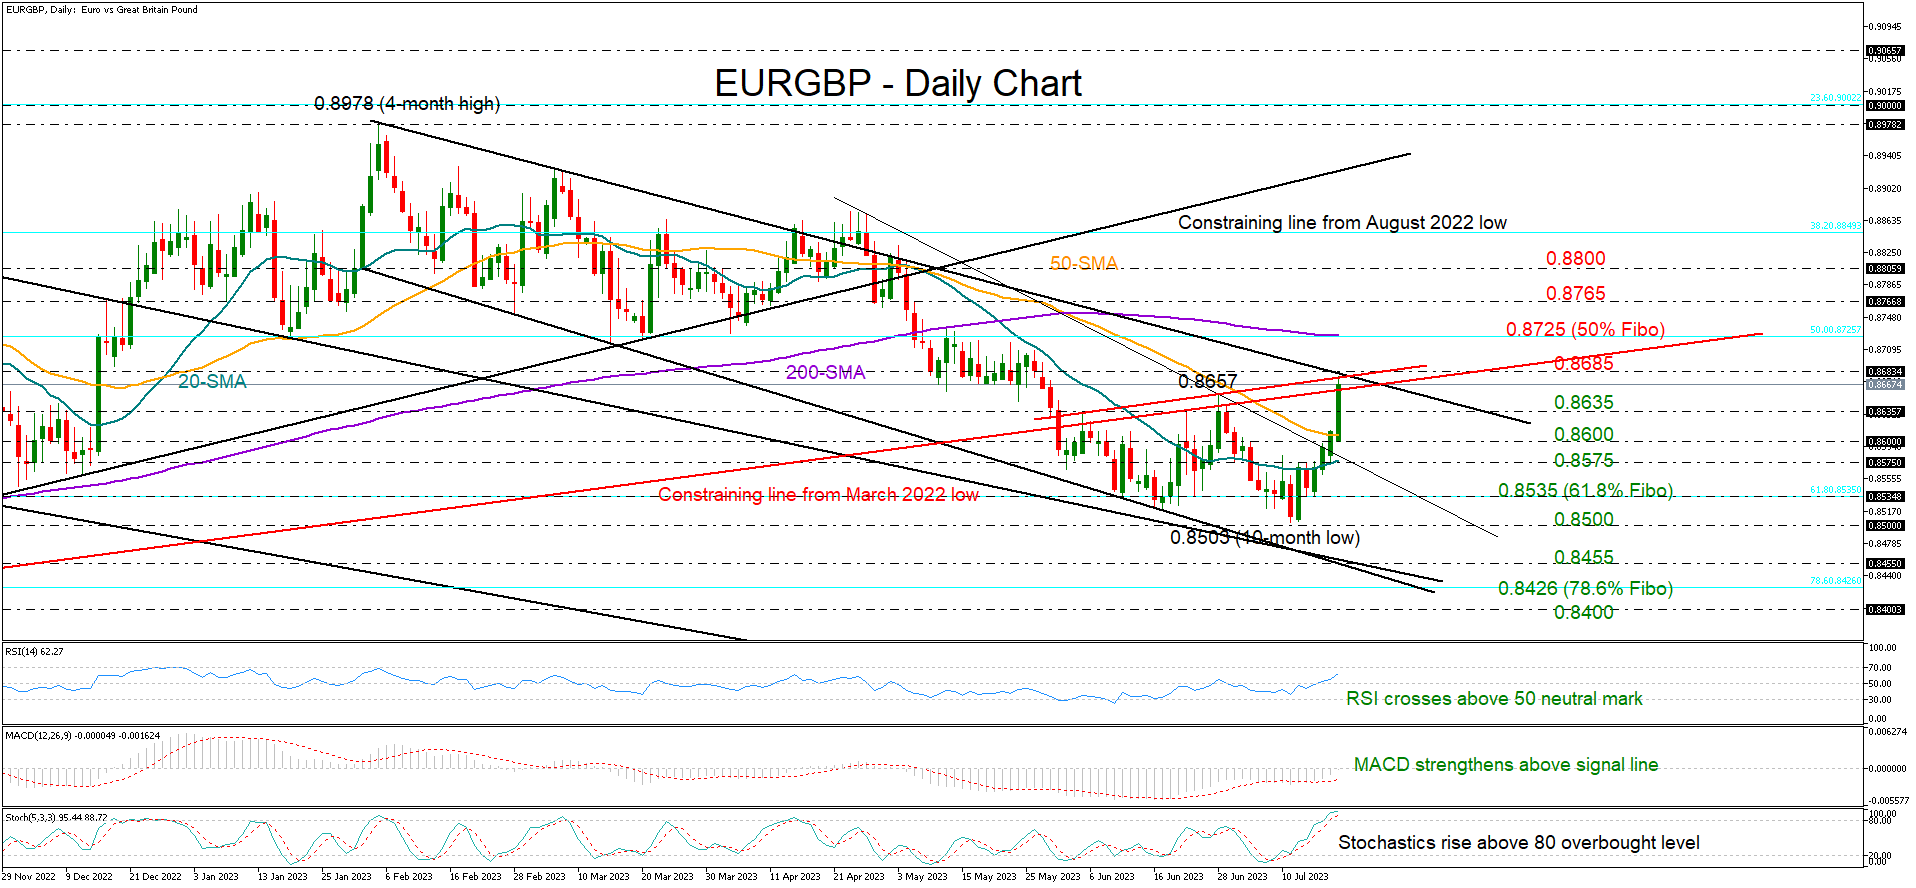
EURGBP experienced a sharp increase from softer-than-expected UK CPI inflation numbers, with the price rising as high as 0.8673 - the fastest daily increase since March 21.
Today’s quick pick up sent the RSI back above its 50 neutral mark and the MACD further above its red signal line and closer to zero. Still, a bullish bias cannot be guaranteed as the stochastic oscillator is already comfortably above its 80 overbought level. Moreover, the price is trading around the the upper boundary of the bearish channel at 0.8483, increasing the risk of a downside reversal.
Even if the pair was about to exit the channel on the upside at 0.8685 and close above the ascending line from March 2022, the 200-day simple moving average (SMA) could still reject any further improvement along with the 50% Fibonacci retracement of the 0.8201-0.9249 upleg at 0.8725. If not, the ascent could stretch till the swing high of 0.8765 and then aim for the 0.8800 psychological mark.
Should selling pressures resurface, pulling the pair below the previous resistance zone of 0.8635, the focus will immediately turn to the 50-day SMA at 0.8608. The 20-day SMA could next appear on the radar at 0.8577, while lower, the 61.8% Fibonacci level of 0.8535 could postpone any declines towards July’s trough of 0.8500. If the 2023 downtrend resumes below the latter point, the next stop could be at the channel’s bottom line at 0.8455.
Summing up, EURGBP has not entered a bullish area yet despite picking up momentum over the past couple of sessions. The pair will need a sustainable upleg above the 200-day SMA to bring new buyers into the market.
GBP/USD: Dips Below 1.30 on Softer than Expected UK Inflation Data
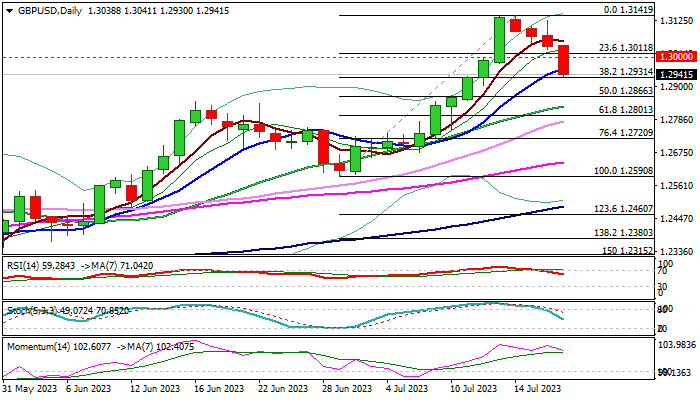
Cable accelerated below 1.30 support in early Wednesday, following softer than expected UK inflation data for June, which should ease pressure on Bank of England to continue its cycle of sharp interest rate raising.
Inflation in Britain fell to 7.9% in June from 8.7% previous May and fell below 8.2% forecast, while core CPI (closely watched by BoE), stripped for volatile food, energy, alcohol and tobacco components, fell to 6.9% last month, from 7.1% in May (the highest in over three decades) and also below consensus at 7.1%.
Better than expected inflation data generated initial signal that strong rise in consumer prices might start to recede and made immediate impact on rate outlook, dropping bets for next month’s hike from 50 to 25 basis points.
The pair extends pullback from new 2023 high (1.3141) into fourth consecutive day and dipped below psychological 1.30 support.
Fresh bearish acceleration cracked next pivotal support at 1.2931 (Fibo 38.2% of 1.2590/1.3141 upleg, reinforced by daily Tenkan-sen), with close below here to boost bearish signal and open way for deeper correction.
Daily studies show fading bullish momentum (although 14- momentum indicator is still deeply in positive territory) and RSI / stochastic in step decline, which add to negative near-term outlook
Bears may take a breather for consolidation, with near-term action to remain biased lower while capped under 1.30 pivot.
Res: 1.3000; 1.3055; 1.3100; 1.3141.
Sup: 1.2931; 1.2866; 1.2830; 1.2801.
A Bipolar World of Stock Market Performances
- US benchmark stock indices continue to maintain global leadership as its cyclical laggards are now playing catch up to the technology-related Magnificent Seven (Apple, Microsoft, Meta, Nvidia, Telsa, Alphabet & Amazon).
- The laggard Dow Jones Industrial Average staged a bullish breakout from a 7-month range consolidation supported by strong performances in financials/banking stocks.
- China’s latest “New Consumption Plan” has failed to spark bullish sentiment in China and Hong Kong benchmark stock indices.
- Another round of yuan weakness may increase the risk of a deflationary spiral in China.
Bullish rotation into the laggards of the US stock market
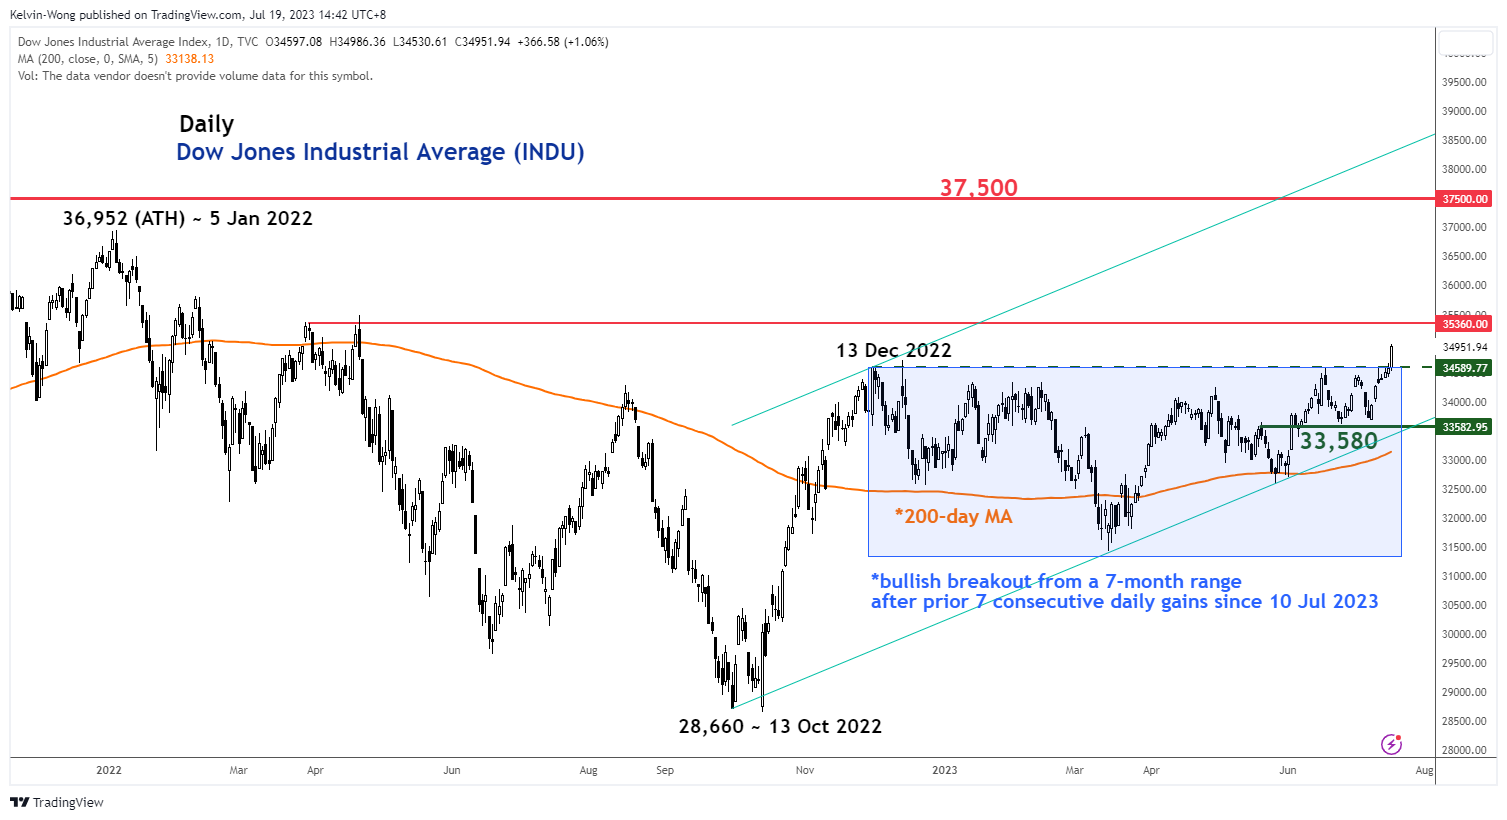
Fig 1: Dow Jones Industrial Average medium-term trend as of 19 Jul 2023 (Source: TradingView, click to enlarge chart)
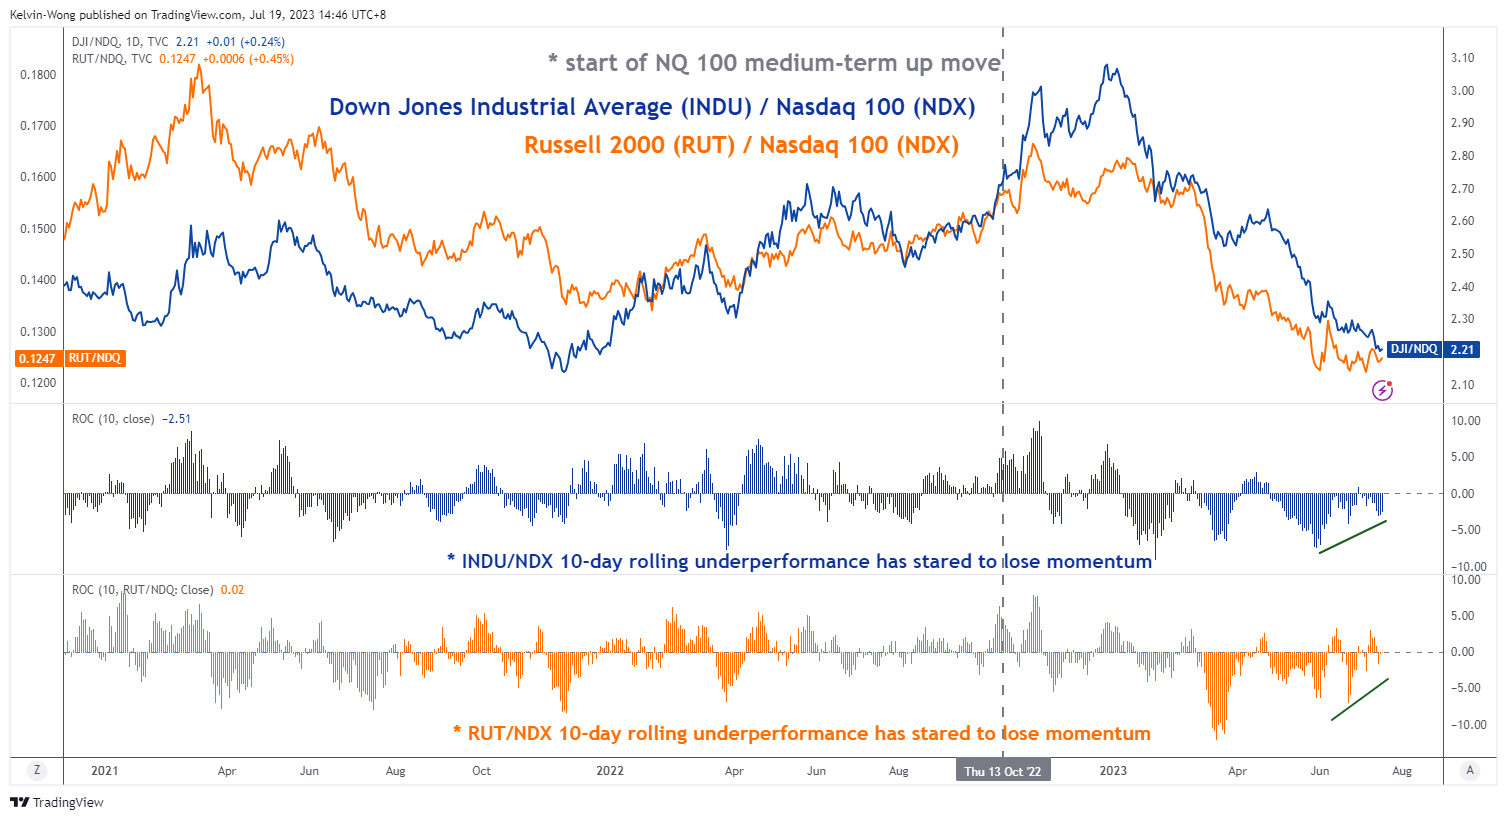
Fig 2: Dow Jones Industrial Average & Russell 2000 relative momentum against Nasdaq 100 as of 19 Jul 2023
(Source: TradingView, click to enlarge chart)
The Dow Jones Industrial Average (INDU) has sparkled back to a bullish tone after it lagged other major US benchmark stock indices such as the Nasdaq 100 and S&P 500 since the start of the ongoing medium-term uptrend phase in place since late October 2022 based on the S&P 500.
At the end of last week, 14 July, the DJIA just notched a meagre 2023 year-to-date return of 4%, around ten times below the top performer, Nasdaq 100 with a gain of 42% and S&P 500 ‘s return of 17% over the same period.
The underperformance of the INDU has been primarily due to a higher combined weightage of its constituents that are concentrated in the financials, banks, and industrials sectors (cyclical stocks) that lagged the information technology sector that commanded a “safe haven” premium after the onset of the US regional banks’ turmoil in mid-March and the rising optimism in generating longer-term productivity gains from Artificial Intelligence (AI).
Yesterday’s better-than-expected Q2 earnings results from two US major banks; Bank of America and Morgan Stanley shrugged off fears of a potential second round of banking crisis due to the US central bank, Fed’s current hawkish rhetoric; “higher interest rates for a longer period”.
Overall, these rosy set of earning results triggered a positive feedback loop into the share prices of other banking/financial stocks that allowed the SPDR S&P Banking exchange-traded fund to rally+3.5% yesterday, 18 July. In turn, the INDU gained by 1.06% and outperformed the high-flying Nasdaq 100 (+0.82%).
Also, yesterday’s positive momentum in the INDU has allowed its price actions to stage a bullish breakout from a seven-month range configuration and closed at a 15-month high of 34,951. From a technical analysis and momentum factor standpoint, these observations are considered positive “significant milestones” that may see further potential gains in the INDU in the coming weeks.
A different story in Asia, spooked by China’s deflationary scare
Yesterday, China policymakers released a “New Consumption Plan” to be implemented jointly by 13 government departments to boost and rejuvenate retail spending after retail sales for June came in worse than expected. The coverage of the consumption plan has so far highlighted only the optics; better access to credit to purchase household products, expand the availability of home-related products to rural areas, and provide cheap renovation services but lacks the details such as the monetary value of these support measures.
The net effect from a behavioural standpoint is bearish sentiment prevails in the short-term for the broad-based China benchmark stock indices and its proxies, the Hang Seng indices. The CSI 300 had shed by -1.5% week-to-date at this time of the writing. The Hang Seng Index, Hang Seng Tech Index, and the Hang Seng China Enterprises Index fared much worst as these indices tumbled by around -3% week-to-date.
Yuan weakness is on the rise again
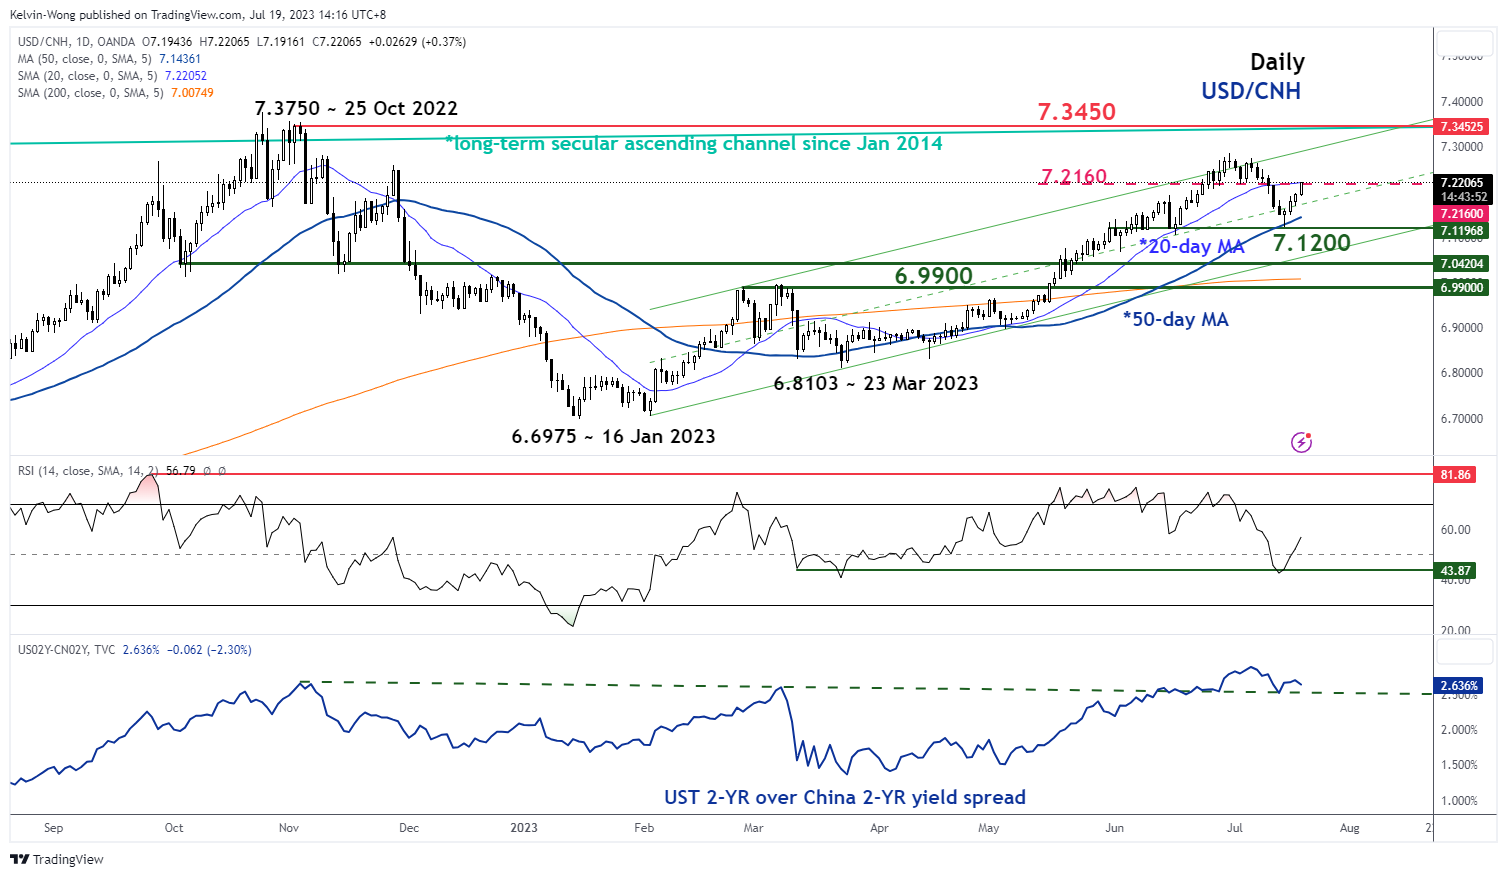
Fig 3: USD/CNH medium-term trend as of 19 Jul 2023 (Source: TradingView, click to enlarge chart)
One of the major catalysts that led to the current weak performances of China-related equities is the revival of the bullish tone seen in the USD/CNH (offshore yuan) despite the stronger-than-expected opening fixing reference level for the onshore yuan (CNY) against the US dollar today by China central bank, PBoC; 7.1486 versus consensus of 7.1798 per US dollar.
Last week’s decline of the USD/CNH has managed to find support at the upward-sloping 50-day moving average at 7.1200 supported by a positive momentum reading seen in the daily RSI oscillator. In addition, the 2-year yield premium of the US Treasury over the China sovereign bond managed to tick higher since last Thursday, 13 July which reinforces further potential yuan weakness.
A clearance above 7.2160 (also the 20-day moving average) may add further impetus for USD/CNH to see the next key resistance at 7.3450 which in turn may spark further weakness in China-related equities.
Also, further yuan weakness is likely to put more financial burden on the current offshore bonds payment obligations of Chinese property developers where the property industry still faces a credit crunch issue due to a weak internal demand environment.
Brewing financial stress of major Chinese property developers is on the rise again, prices of their onshore dollar bonds tumbled significantly in the last two days; in light of a trading halt announcement made by Sino-Ocean Group in a local note that is due to mature in two weeks, and Dalian Wanda Group issued a warning to its creditors of a funding shortfall for a bond that is due for redemption on 23 July.
Hence, the failure to negate the current negative sentiment in the China stock market may further reinforce a negative feedback loop into the real economy which in turn increases the risk of a deflationary spiral.