

Sample Category Title
GBP/USD Daily Outlook
Daily Pivots: (S1) 1.3000; (P) 1.3063; (R1) 1.3098; More...
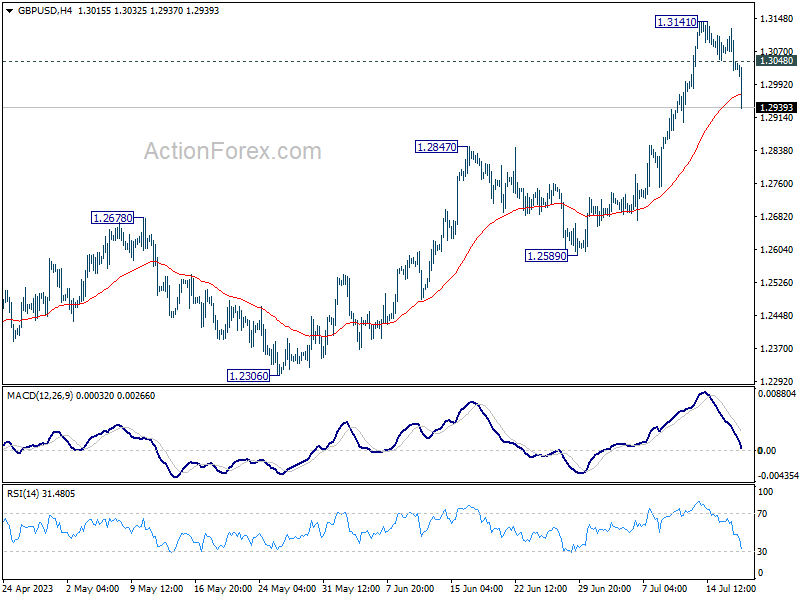
GBP/USD's pull back from 1.3141 accelerates lower today and deeper decline could be seen. But near term outlook will stay bullish as long as 1.2847 resistance turned support holds. On the upside, above 1.3048 minor resistance will turn bias back to the upside for retesting 1.3141 high. Nevertheless, decisive break of 1.2847 will argue that larger correction is underway and target 1.2589 support next.
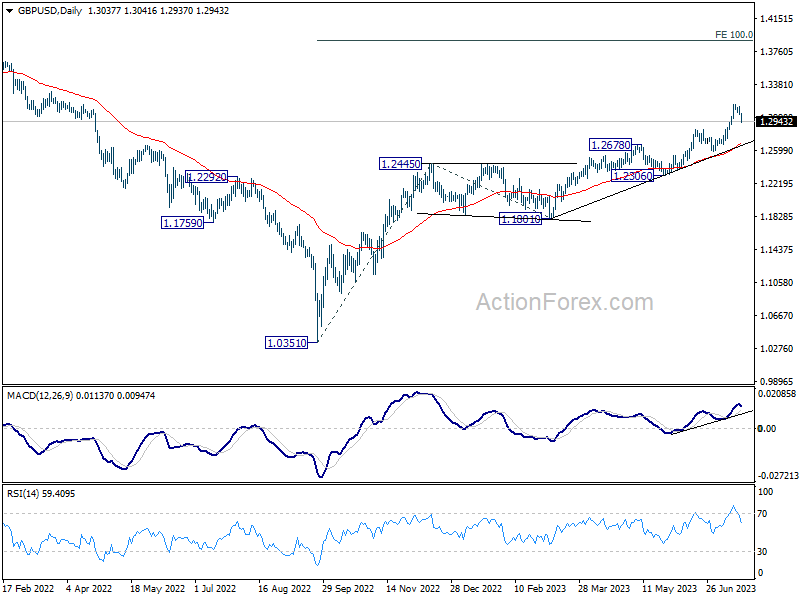
In the bigger picture, rise from 1.0351 medium term bottom (2022 low) is in progress. Next target is 100% projection of 1.0351 to 1.2445 from 1.1801 at 1.3895. Break there will target 1.4248 key long term resistance (2021 high) next. This will now remain the favored case as long as 1.2678 resistance turned support holds.
EUR/USD Daily Outlook
Daily Pivots: (S1) 1.1199; (P) 1.1238; (R1) 1.1266; More...
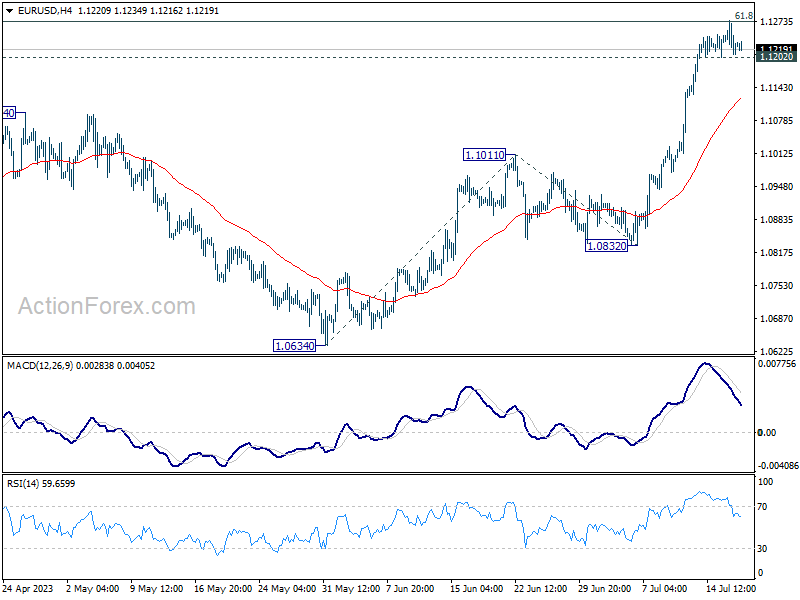
Intraday bias in EUR/USD is turned neutral again first. On the downside, break of 1.1202 minor support will indicate rejection by 1.1273 fibonacci level. Intraday bias will be back on the downside for deeper pull back to 55 4H EMA (now at 1.1119) and possibly below. Nevertheless, sustained break of 1.1273 will extend larger up trend to 161.8% projection of 1.0634 to 1.1011 from 1.0832 at 1.1442 next.
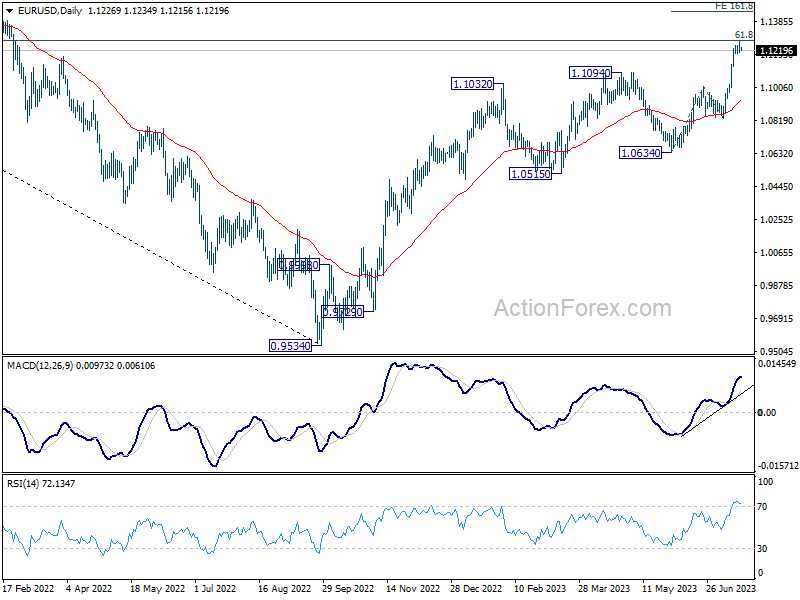
In the bigger picture, as rise from 0.9534 extends, focus is now on 61.8% retracement of 1.2348 (2021 high) to 0.9534 at 1.1273. Sustained break there will solidify the case of bullish trend reversal and target 1.2348 resistance next. Meanwhile, outlook will continue to stay bullish as long as 1.0832 support holds, even in case of deep pull back.
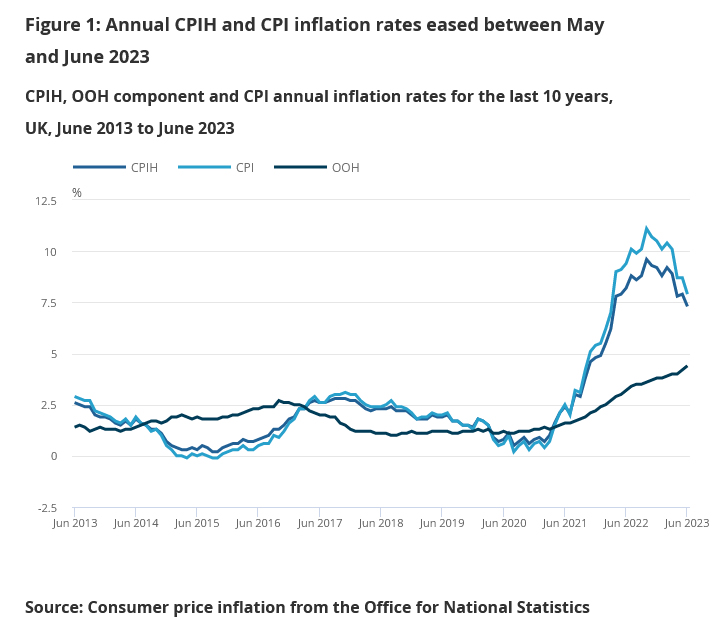
UK CPI eased to 7.9% in Jun, core CPI down to 6.9%, both below expectations
UK CPI slowed from 8.7% yoy to 7.9% yoy in June, below expectation of 8.2% yoy. Core CPI (excluding energy, food, alcohol and tobacco) slowed from 7.1% yoy to 6.9% yoy, below expectation of staying unchanged at 7.1% yoy.
CPI goods slowed from 9.7% yoy to 8.5% yoy. CPI services also eased from 7.4% yoy to 7.2% yoy.
On a monthly basis, CPI rose just 0.1% mom, down from May's 0.7% mom. Falling prices for motor fuel led to the largest downward contribution to the monthly change.
USD/CHF Daily Outlook
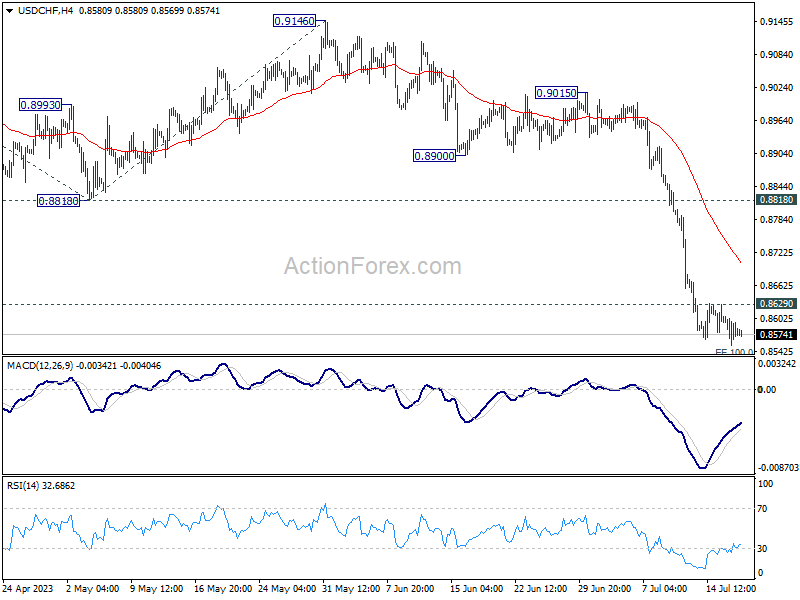
Daily Pivots: (S1) 0.8552; (P) 0.8580; (R1) 0.8604; More...
Further decline could still be seen in USD/CHF. But based on loss of downside momentum as seen in 4H MACD, some support could be seen from 100% projection of 0.9439 to 0.8818 from 0.9146 at 0.8525 to bring rebound. Break of 0.8629 minor resistance will turn bias to the downside for 55 4H EMA (now at 0.8704) and above.
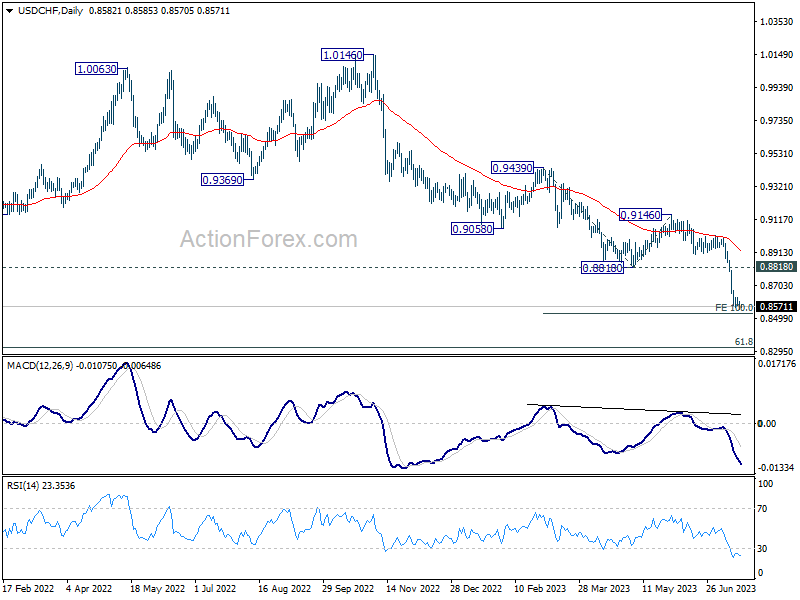
In the bigger picture, the break of 0.8756 (2021 low) indicates break out from the long term range pattern. For now, medium term outlook will stay bearish as long as 0.9146 resistance holds. Further fall would be seen to 61.8% retracement of 0.7065 (2011 low) to 1.0342 (2016 high) at 0.8317 next.
USD/JPY Daily Outlook
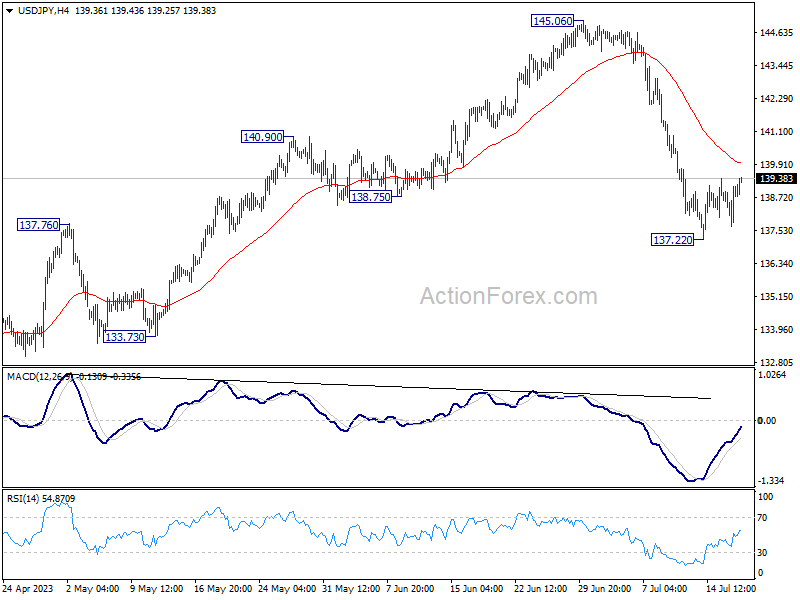
Daily Pivots: (S1) 137.99; (P) 138.57; (R1) 139.41; More...
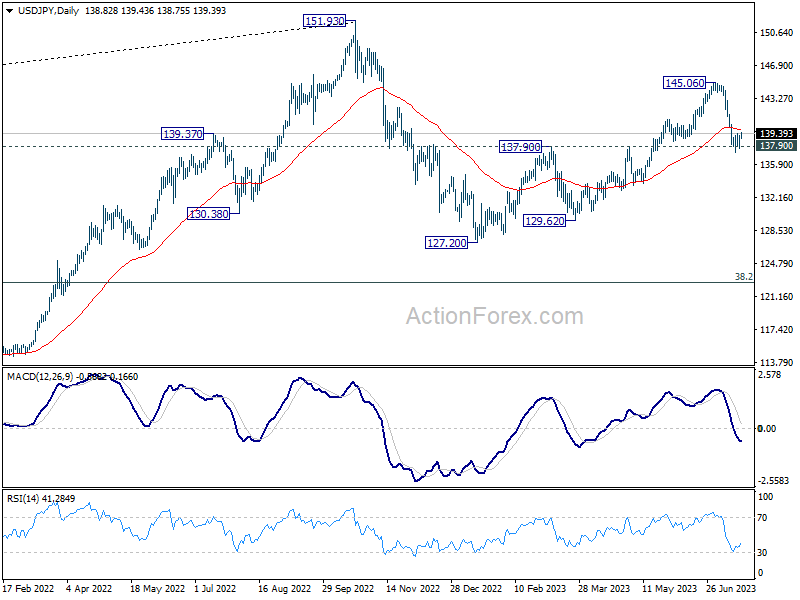
No change in USD/JPY's outlook as consolidation from 137.22 is extending. Intraday bias stays neutral for the moment. While further recovery might be seen, upside should be limited by 55 4H EMA (now at 139.96) and bring another decline. Break of 137.22 and sustained trading below 137.90 resistance turned support will confirm the larger bearish case, and target 127.20 and below.
In the bigger picture, fall from 145.06 is seen as the third leg of the corrective pattern from 151.93 (2022 high). Sustained break of 137.90 resistance turned support should confirm this case and target 127.20 (2023 low) and below. For now, this will remain the favored case as long as 145.06 resistance holds, even in case of strong rebound.
AUD/USD Daily Report
Daily Pivots: (S1) 0.6788; (P) 0.6813; (R1) 0.6836; More...
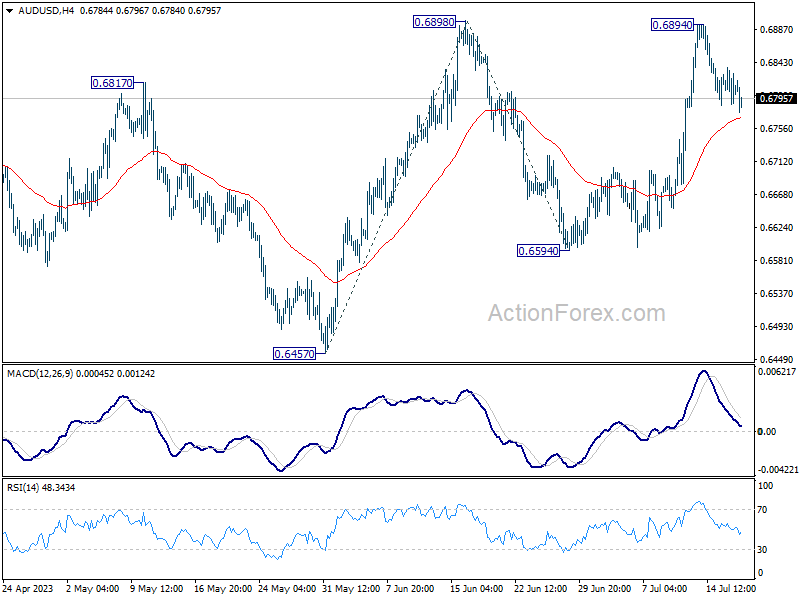
Outlook in AUD/USD is unchanged and intraday bias remains neutral. On the upside, decisive break of 0.6898 resistance will firstly confirm resumption of rise from 0.6457. Secondly, that should also confirm completion of the fall from 0.7156 at 0.6457. Next target will be 100% projection of 0.6457 to 0.6898 from 0.6594 at 0.7035, and then 0.7156 resistance.
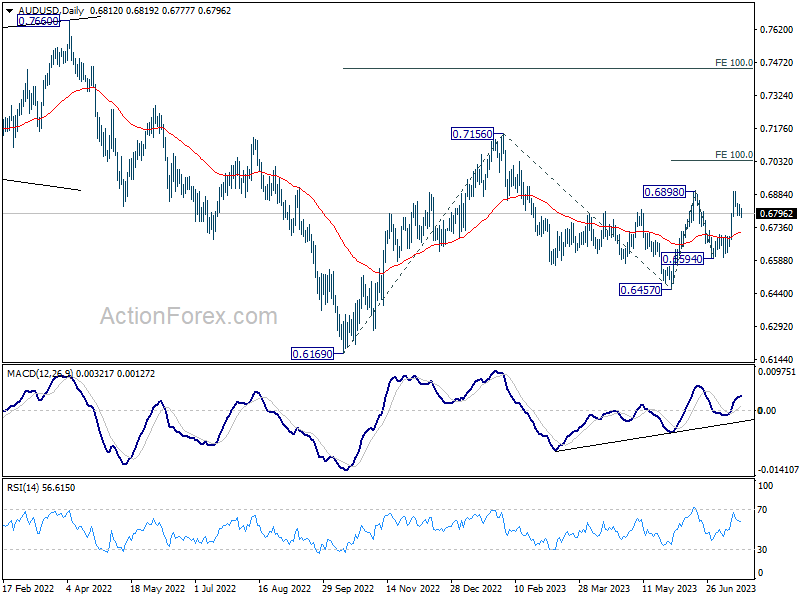
In the bigger picture, price actions from 0.7156 are seen as a correction to the rebound from 0.6169 (2022 low). Break of 0.6898 resistance will argue that rise from 0.6169 is ready to resume through 0.7156. Next target will be 100% projection of 0.6169 to 0.7156 from 0.6457 at 0.7444. For now, this will be the favored case as long as 55 D EMA (now at 0.6703) holds.
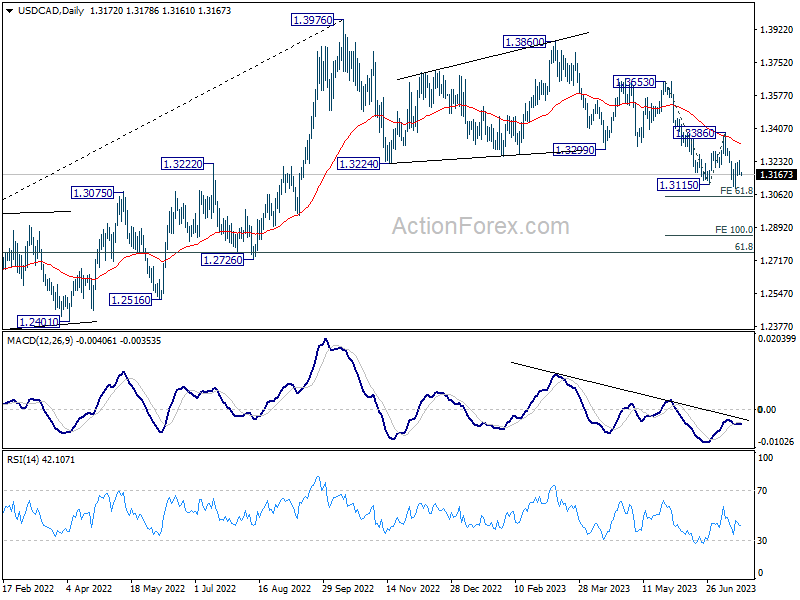
USD/CAD Daily Outlook
Daily Pivots: (S1) 1.3142; (P) 1.3193; (R1) 1.3218; More....
Intraday bias in USD/CAD remains neutral as range trading continues. With 1.3386 resistance intact, outlook stays bearish. On the downside, break of 1.3091 will larger decline to 61.8% projection of 1.3653 to 1.3115 from 1.3386 at 1.3054. However, firm break of 1.3386 will indicate near term reversal and turn outlook bullish.
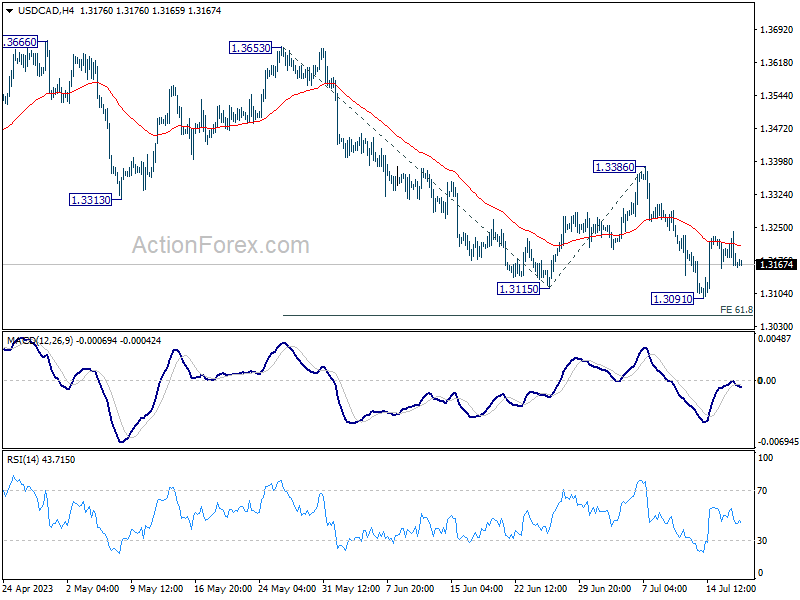
In the bigger picture, price actions from 1.3976 are viewed as a correction to up trend from 1.2005 (2021 low) only. But even so, deeper decline is expected as long as 1.3386 resistance holds. Further fall could be seen to 61.8% retracement of 1.2005 to 1.3976 at 1.2758. Meanwhile, break of 1.3386 will be a sign that the correction has completed and bring stronger rally back to retest 1.3976.
Technical Outlook and Review
DXY:
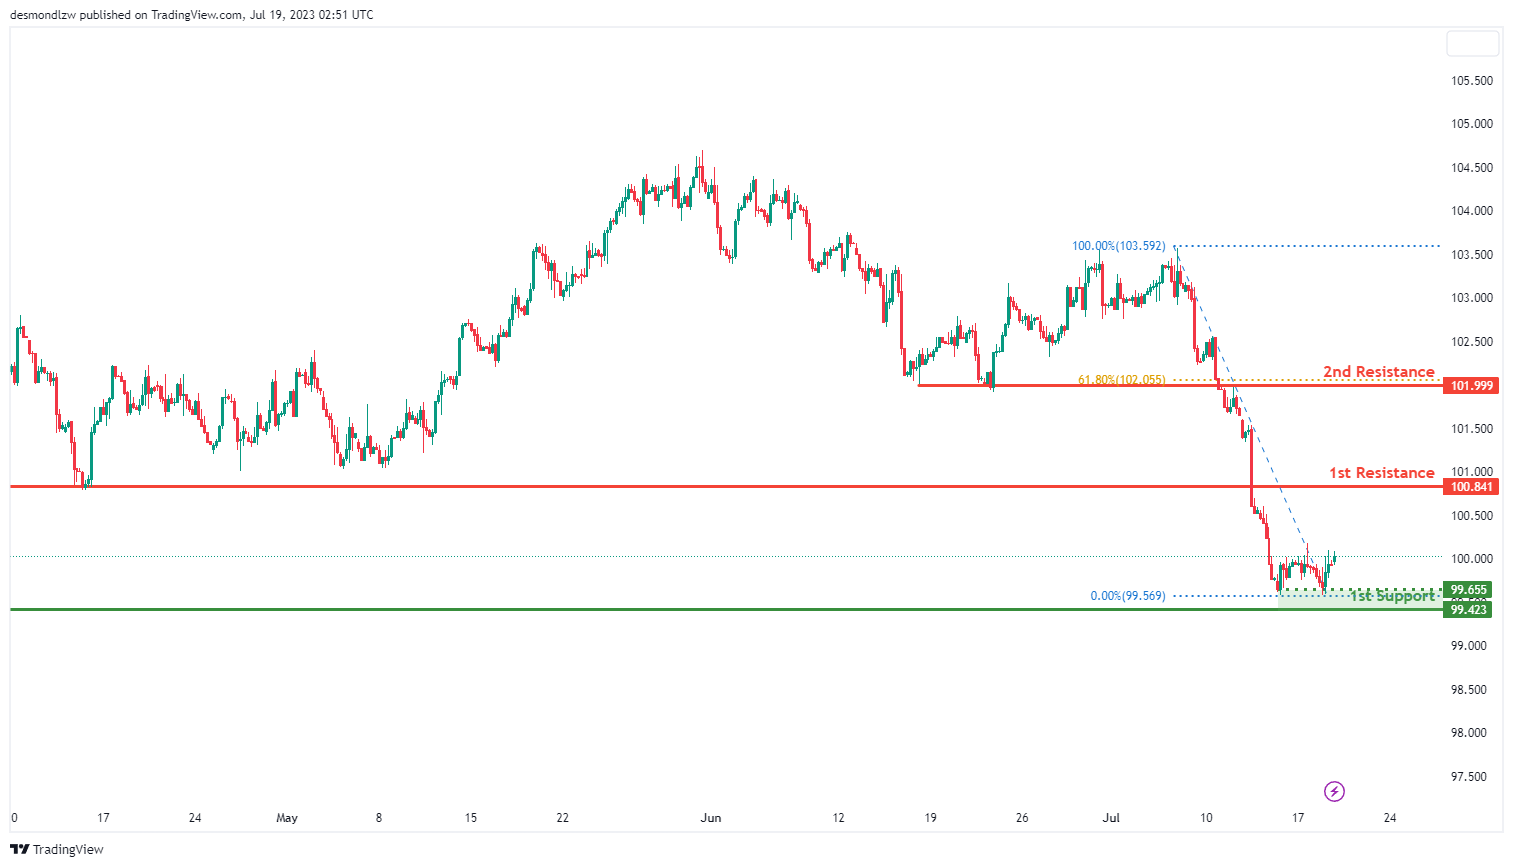
The dollar index (DXY) chart is currently exhibiting a bullish momentum, suggesting that the price could potentially make a bullish continuation towards the 1st resistance.
The intermediate support level is at 99.66 and is identified as a multi-swing low support. This level may halt any short-term downtrend.
The 1st support level is found at 99.42, recognized as an overlap support. This could potentially provide a rebound point in case of a further downward move.
If the price maintains its bullish trajectory, it could face resistance at 100.84, which is considered an overlap resistance. This might pose a challenge to the upward price movement.
A further rise in price might meet the 2nd resistance at 101.99. This level is considered an overlap resistance and also aligns with the 61.80% Fibonacci retracement level, adding to its significance as a potential turning point.
EUR/USD:
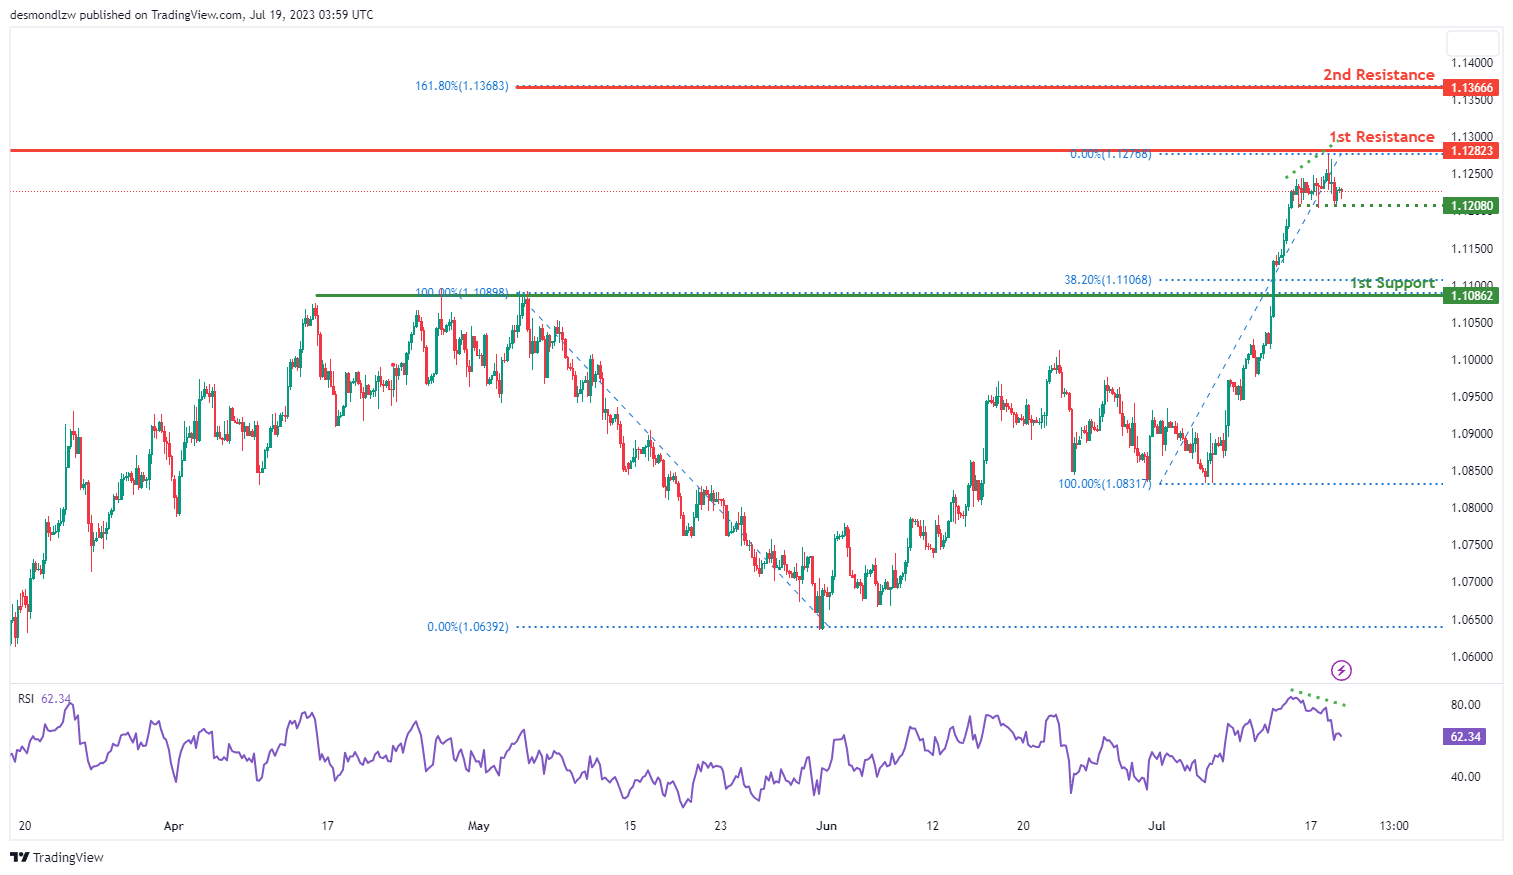
The EUR/USD chart currently demonstrates bearish momentum, indicating a potential continuation of the downward movement. There is a possibility for a bearish reaction off the 1st resistance level, leading to a drop towards the 1st support.
The 1st support at 1.1088 is considered a pullback support and coincides with the 38.20% Fibonacci Retracement level. Additionally, there is an intermediate support at 1.1208, which serves as a multi-swing low support.
On the upside, the 1st resistance level at 1.1282 is identified as an overlap resistance. Furthermore, the 2nd resistance at 1.1366 aligns with the 161.80% Fibonacci Retracement level.
Additionally, the RSI is displaying bearish divergence versus the price, indicating a likelihood of a rapid decline in price
EUR/JPY:
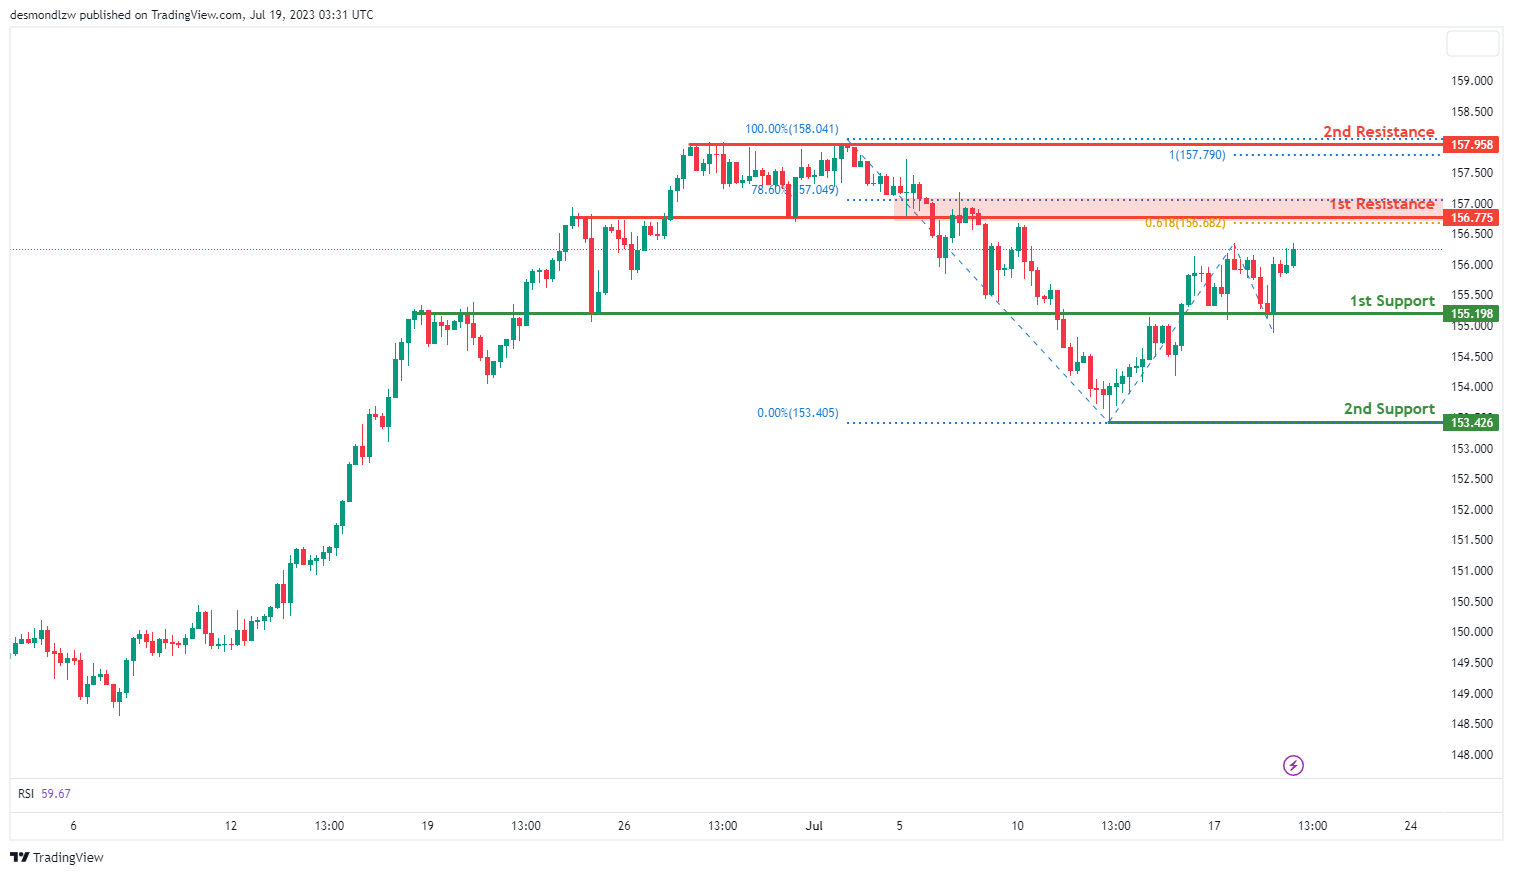
The EUR/JPY chart currently shows a bullish overall momentum, indicating a potential for a bullish continuation towards the 1st resistance level.
The 1st support level at 155.19 is identified as an overlap support, suggesting a level where buyers may enter the market and provide support to the price. Additionally, the 2nd support level at 153.42 acts as a swing low support, further reinforcing its significance.
On the upside, the 1st resistance level at 156.77 represents a swing high resistance, indicating a level where selling pressure may increase. This resistance level also aligns with a 61.80% Fibonacci Projection and a 78.60% Fibonacci Retracement, indicating Fibonacci confluence and adding to its significance.
Furthermore, the 2nd resistance level at 157.95 is identified as a multi-swing high resistance, and it coincides with a 100% Fibonacci Projection, further reinforcing its potential as a significant barrier to further price advancement.
EUR/GBP:
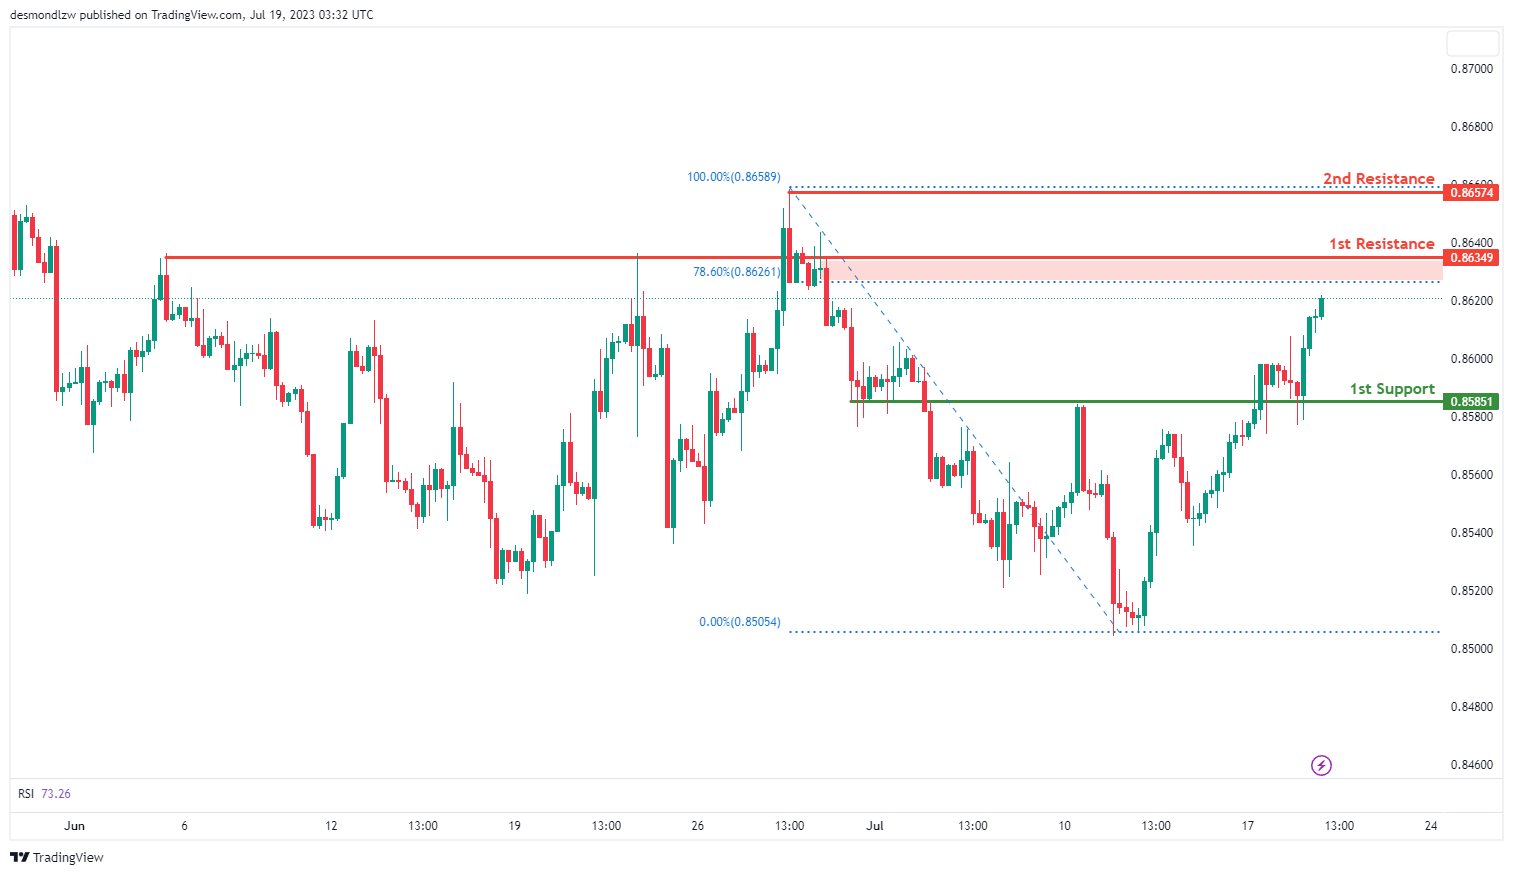
The EUR/GBP chart currently displays a bullish overall momentum, suggesting a potential for a bullish continuation towards the 1st resistance level.
The 1st support level at 0.8585 is identified as an overlap support, indicating a level where buyers may enter the market and provide support to the price.
On the upside, the 1st resistance level at 0.8634 represents an overlap resistance. Additionally, this resistance level aligns with a 78.60% Fibonacci Retracement, further reinforcing its significance as a potential barrier to further price advancement.
Furthermore, the 2nd resistance level at 0.8657 is identified as a swing high resistance, indicating a level where selling pressure may increase, potentially adding to the resistance.
GBP/USD:
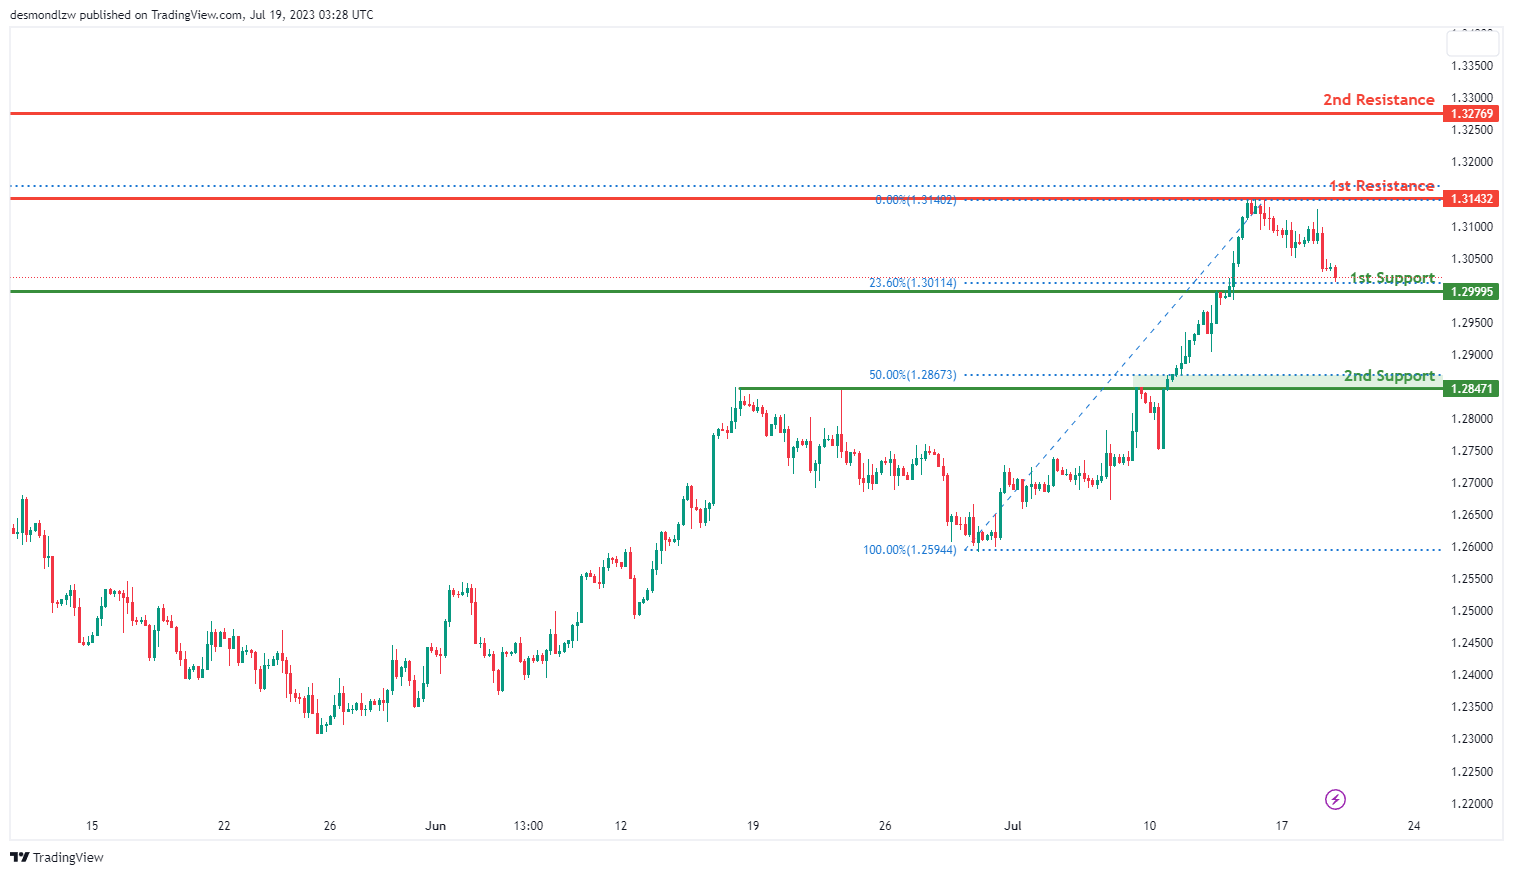
The GBP/USD chart is currently showing bearish momentum, suggesting that the price could continue to fall towards the 1st support level.
The 1st support level is at 1.2999, identified as an overlap support and coincides with the 23.60% Fibonacci retracement level. This level might act as a significant barrier to further price decline.
If the price falls even further, it could meet the 2nd support level at 1.2847, also characterized as an overlap support and aligns with the 50% Fibonacci retracement level. This support level could be a crucial area where buying pressure may outweigh selling pressure, leading to a potential price increase.
However, if the price reverses its bearish trend, it could face resistance at 1.3143, identified as an overlap resistance. A further bullish move could meet resistance at the 2nd level of 1.3277, also an overlap resistance. These resistance levels might hinder upward price movement and could trigger a selling response.
GBP/JPY:
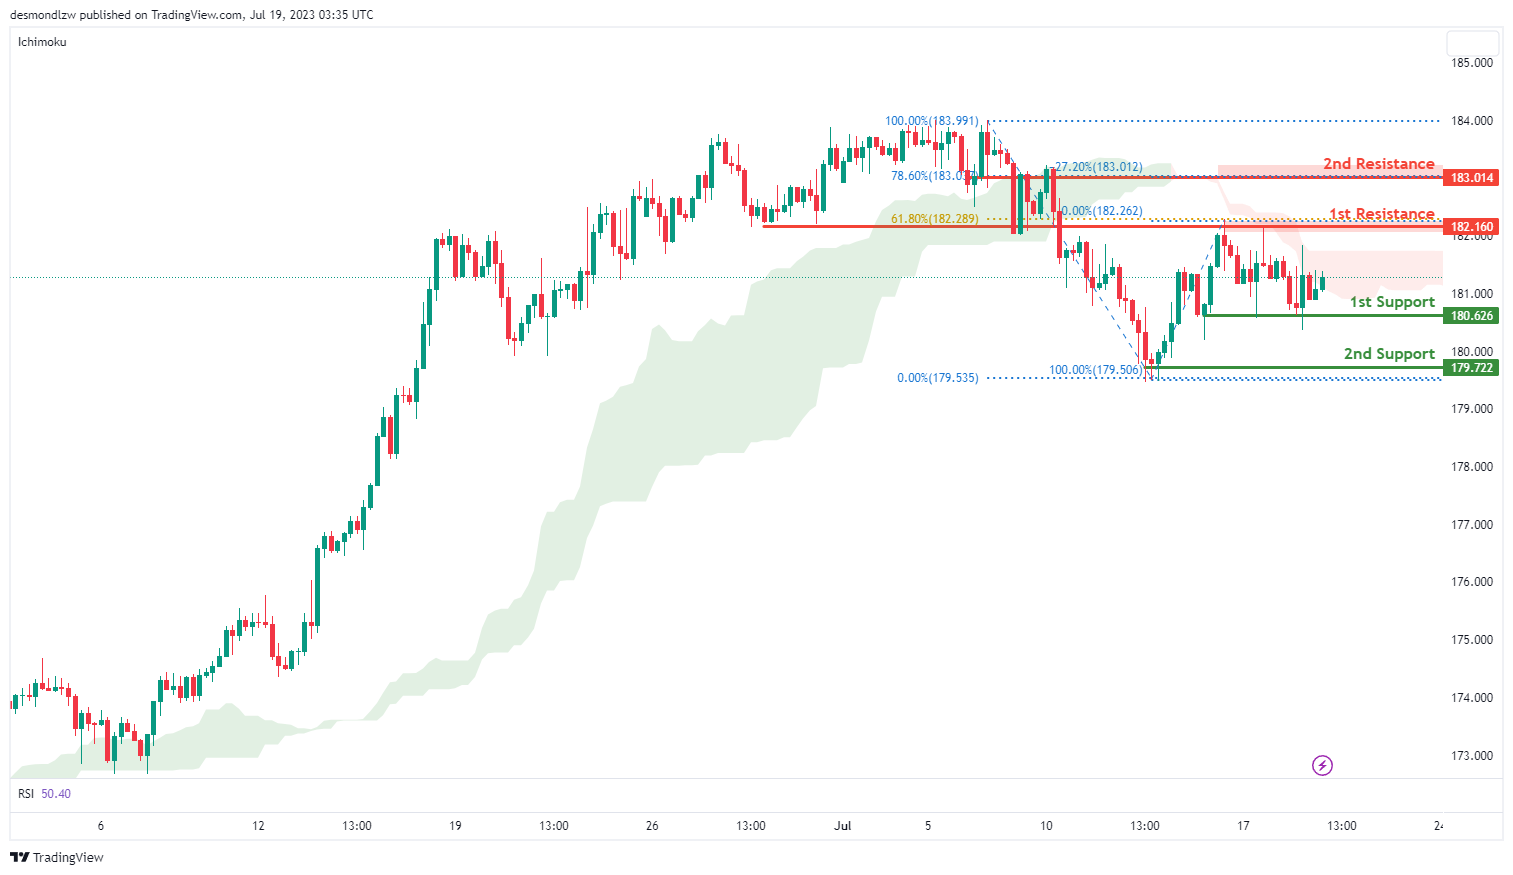
The GBP/JPY chart demonstrates a bearish overall momentum, supported by the fact that the price is below the bearish Ichimoku cloud. This suggests a potential for a bearish continuation towards the 1st support level.
The 1st support at 180.16 is identified as a multi-swing low support, indicating a level where buyers may enter the market and provide support to the price. Additionally, the 2nd support at 179.72 is a swing low support, further reinforcing its significance as a potential level where buying interest could emerge.
On the upside, the 1st resistance at 182.16 represents an overlap resistance and aligns with a 61.80% Fibonacci Retracement. This level may act as a barrier to further price advancement.
Furthermore, the 2nd resistance at 183.01 is identified as an overlap resistance. It also coincides with a 78.60% Fibonacci Retracement and a -27% Fibonacci Expansion, indicating a potential Fibonacci confluence that may add to the resistance.
USD/CHF:
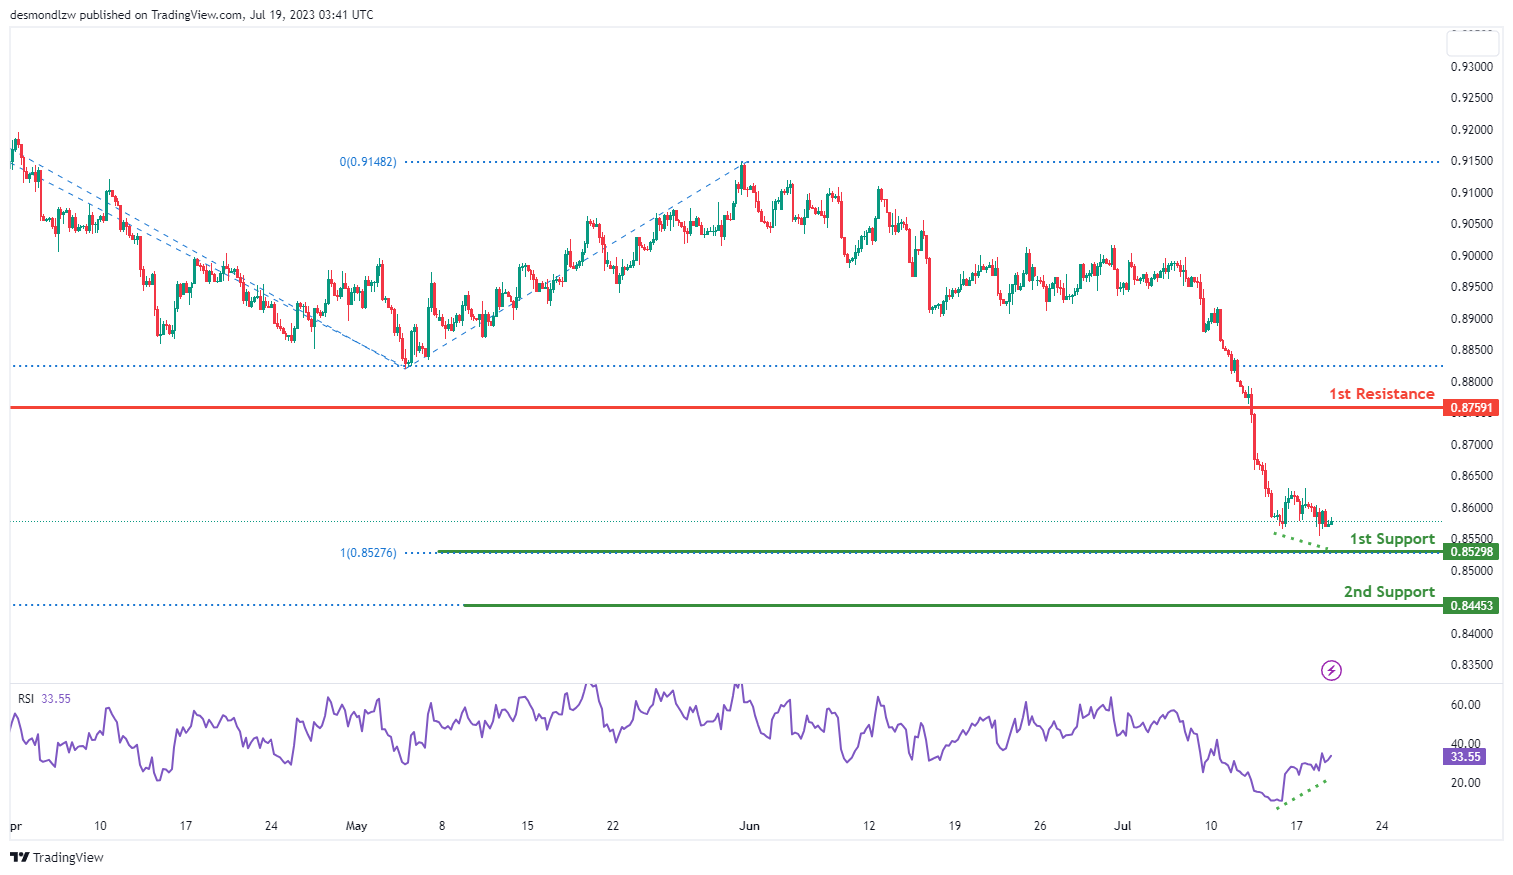
The USD/CHF chart currently indicates a bullish momentum, suggesting a potential for a bullish bounce off the 1st support level and a subsequent move towards the 1st resistance.
The 1st support level at 0.8529 is noteworthy as it aligns with a 100% Fibonacci Projection. This confluence of factors increases the significance of this support level.
Additionally, the 2nd support at 0.8445 is identified as a level that corresponds to a -61.8% Fibonacci Expansion, providing further potential support.
On the upside, the 1st resistance at 0.8759 is classified as a pullback resistance. This resistance level may present a barrier to further price advancement.
USD/JPY:
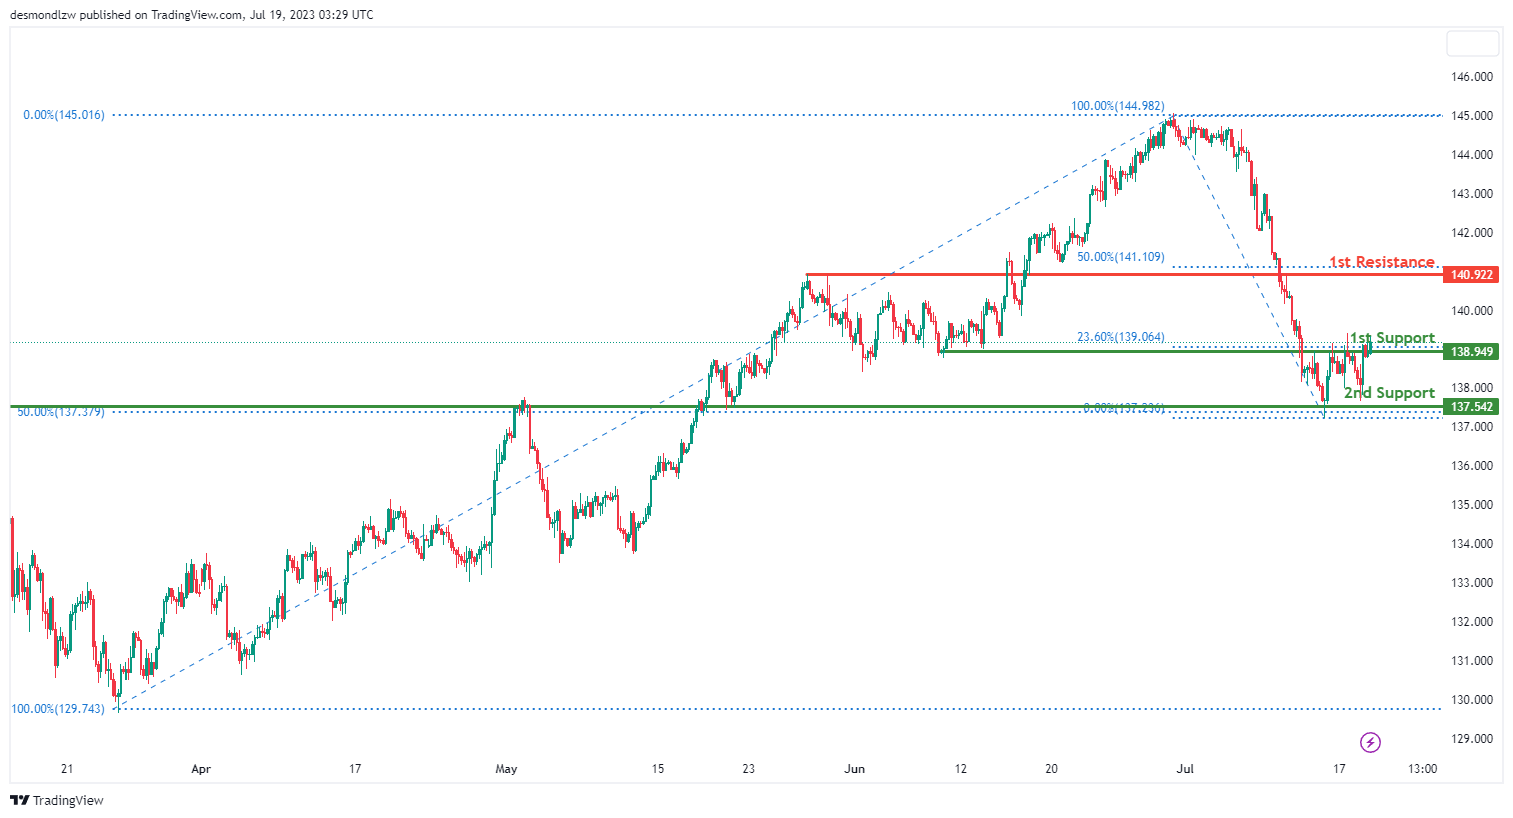
The USD/JPY chart is bullish, indicating a potential continuation of the upward trend towards the 1st resistance level.
At the downside, the 1st support level at 138.95 serves as an overlap support, while the 2nd support level at 137.54 also acts as an overlap support. These levels have the potential to attract buying interest and initiate a rebound.
On the other hand, if the bullish momentum persists, the price may encounter resistance at the 1st resistance level of 140.92. This level coincides with the 50% Fibonacci retracement and is considered an overlap resistance. It may impede further upward movement and trigger selling activity.
USD/CAD:
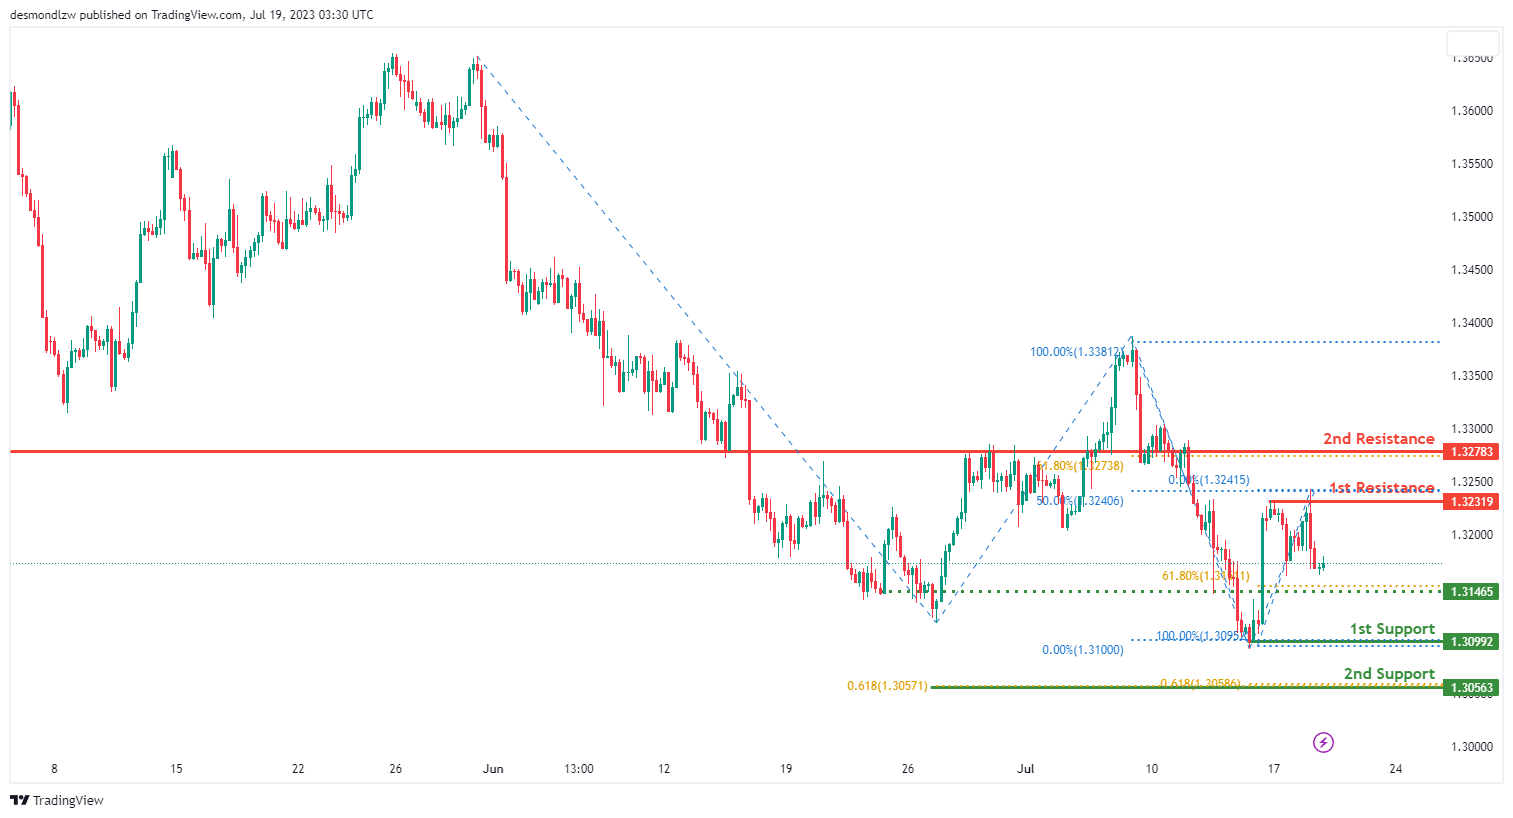
The USD/CAD pair is currently displaying neutral momentum, suggesting price fluctuations between the 1st resistance and 1st support levels.
The 1st support level at 1.3099, a swing low support, could potentially halt any downward movement. If the price drops further, the 2nd support level at 1.3056, marked by a Fibonacci confluence at the 61.80% projection, could provide a strong barrier against further decline.
If the price reverses and climbs, it may encounter resistance at 1.3232, a multi-swing high resistance and the 50% Fibonacci retracement level. A further ascent could meet the 2nd resistance level at 1.3278, a pullback resistance aligning with the 61.8% Fibonacci projection.
Additionally, there’s an intermediate support at 1.3147, a pullback support coinciding with the 61.80% Fibonacci retracement, which could serve as a potential rebound point in a bearish scenario.
AUD/USD:
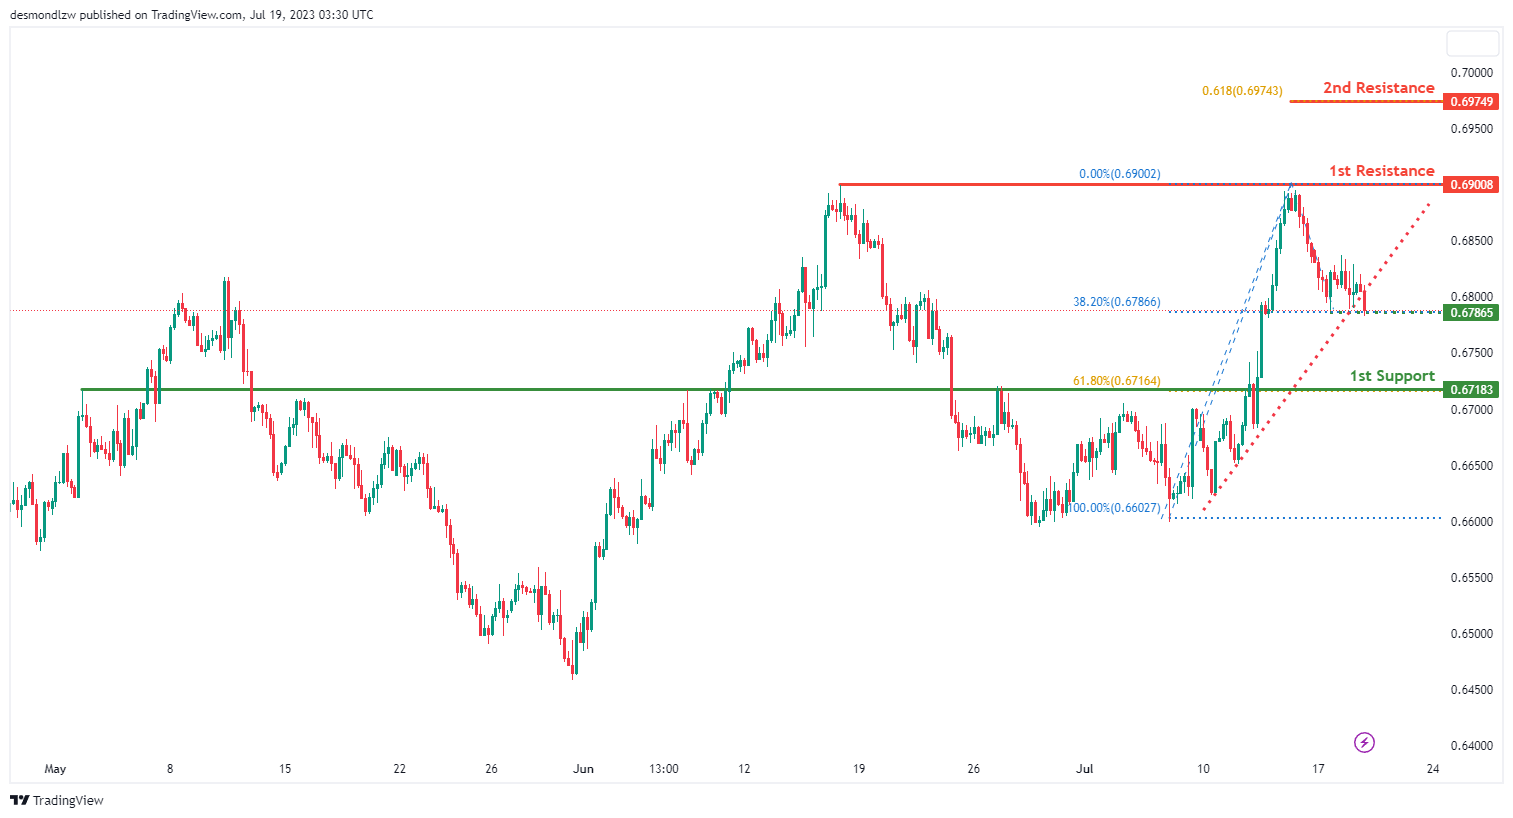
The AUD/USD pair is currently exhibiting bearish momentum after breaking below an ascending support line, which could suggest a continuation of this downward trend towards the 1st support level.
The intermediate support level is at 0.6787, serving as an overlap support and coinciding with the 38.20% Fibonacci retracement level. This level could potentially halt further price decline. If the price drops beyond this point, the 1st support level at 0.6718, also an overlap support, aligns with the 61.80% Fibonacci retracement level and may offer another potential rebound point.
On the contrary, if the price manages to reverse its bearish momentum, it could face resistance at 0.6901, identified as an overlap resistance. Further upward movement may encounter the 2nd resistance level at 0.6975, which is another overlap resistance and coincides with the 61.80% Fibonacci projection. These resistance levels could hinder the price’s progress and potentially stimulate a selling response.
NZD/USD
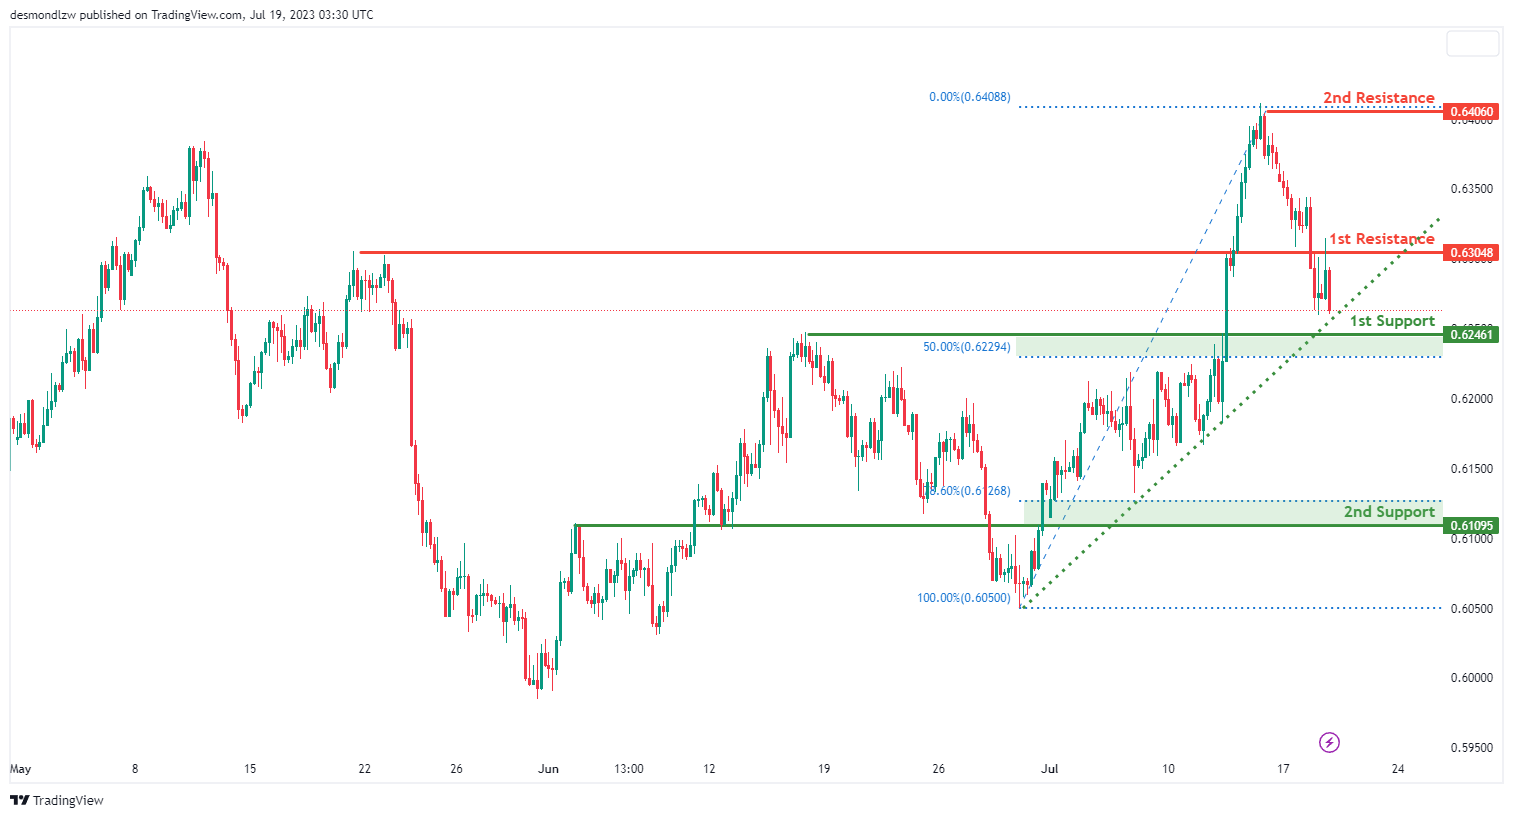
The NZD/USD chart currently exhibits a bullish overall momentum. The price is above a major ascending trend line, indicating the potential for further bullish movement.
There is a possibility for a bullish bounce off the 1st support level at 0.625, which is considered a pullback support and coincides with the 50% Fibonacci Retracement level. Additionally, the 2nd support level at 0.611 acts as an overlap support and aligns with the 78.60% Fibonacci Retracement level.
On the upside, the 1st resistance level at 0.630 represents an overlap resistance. If the price breaks above this level, the next hurdle could be the 2nd resistance level at 0.641, which is identified as a swing high resistance.
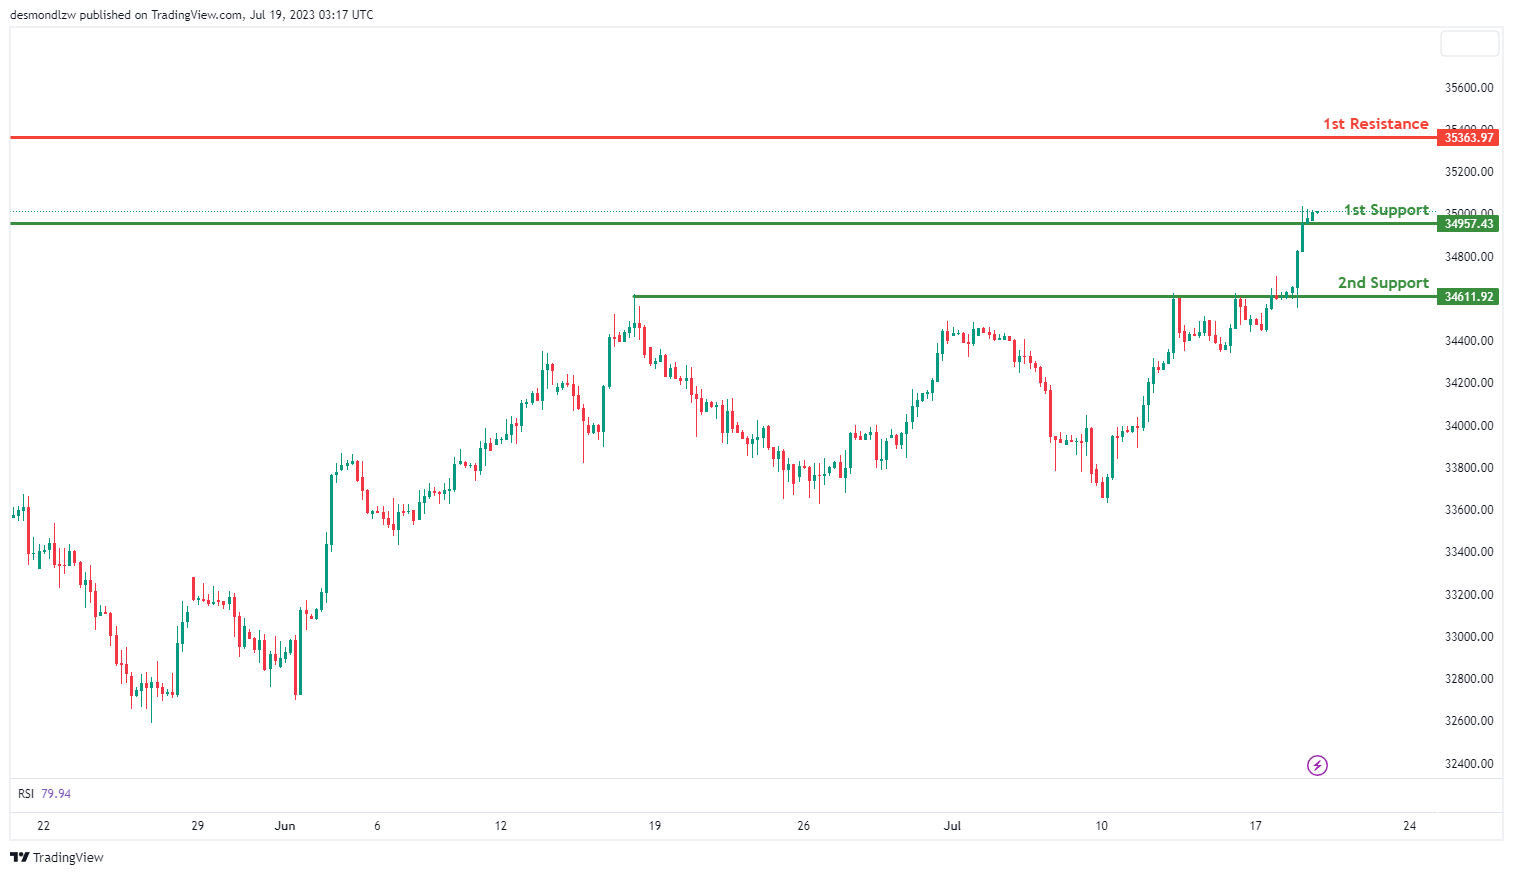
DJ30:
The DJ30 (Dow Jones Industrial Average) chart indicates a bullish overall momentum, suggesting the potential for a bullish bounce off the 1st support level and a subsequent move towards the 1st resistance level.
The 1st support level at 34957.43 is identified as a pullback support, potentially providing a bounce for the price. Additionally, the 2nd support at 34611.92 acts as an overlap support, further reinforcing its significance.
On the upside, the 1st resistance level at 35363.97 represents an overlap resistance, potentially posing a challenge for the price’s upward movement.
GER30:
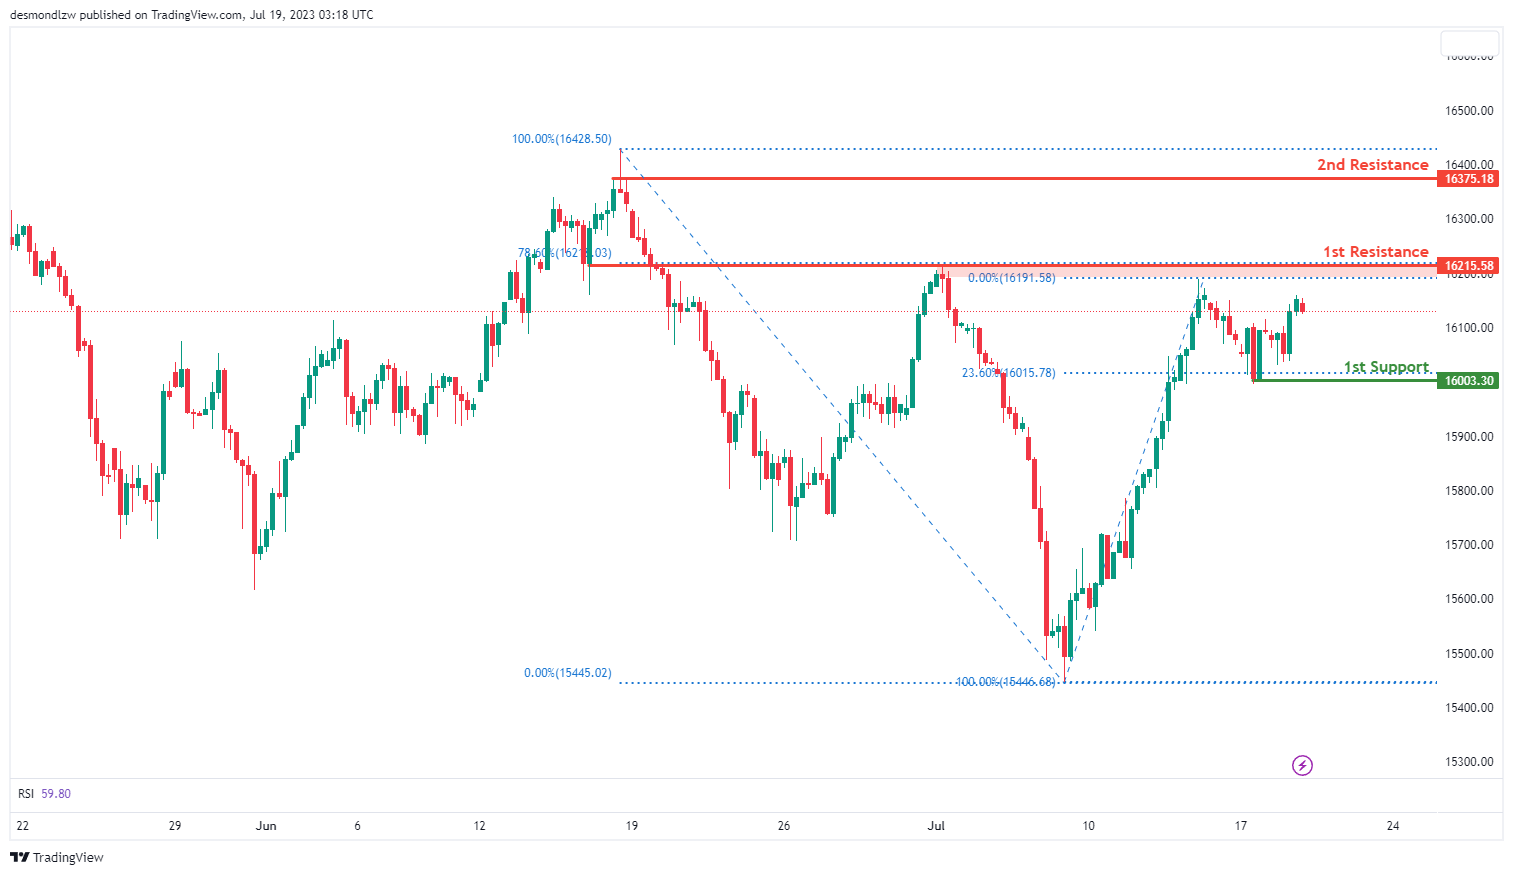
The GER30 (DAX) chart indicates a bullish overall momentum, suggesting the potential for a bullish continuation towards the 1st resistance level.
The 1st support level at 16003.30 is identified as a swing low support, and it coincides with a 23.60% Fibonacci retracement level, providing a strong foundation for potential price support.
On the upside, the 1st resistance level at 16215.58 represents an overlap resistance and aligns with a 78.60% Fibonacci retracement level. This level is expected to pose a significant barrier to further price advancement. Furthermore, the 2nd resistance level at 16375.18 acts as a swing high resistance, further strengthening the potential resistance zone.
US500
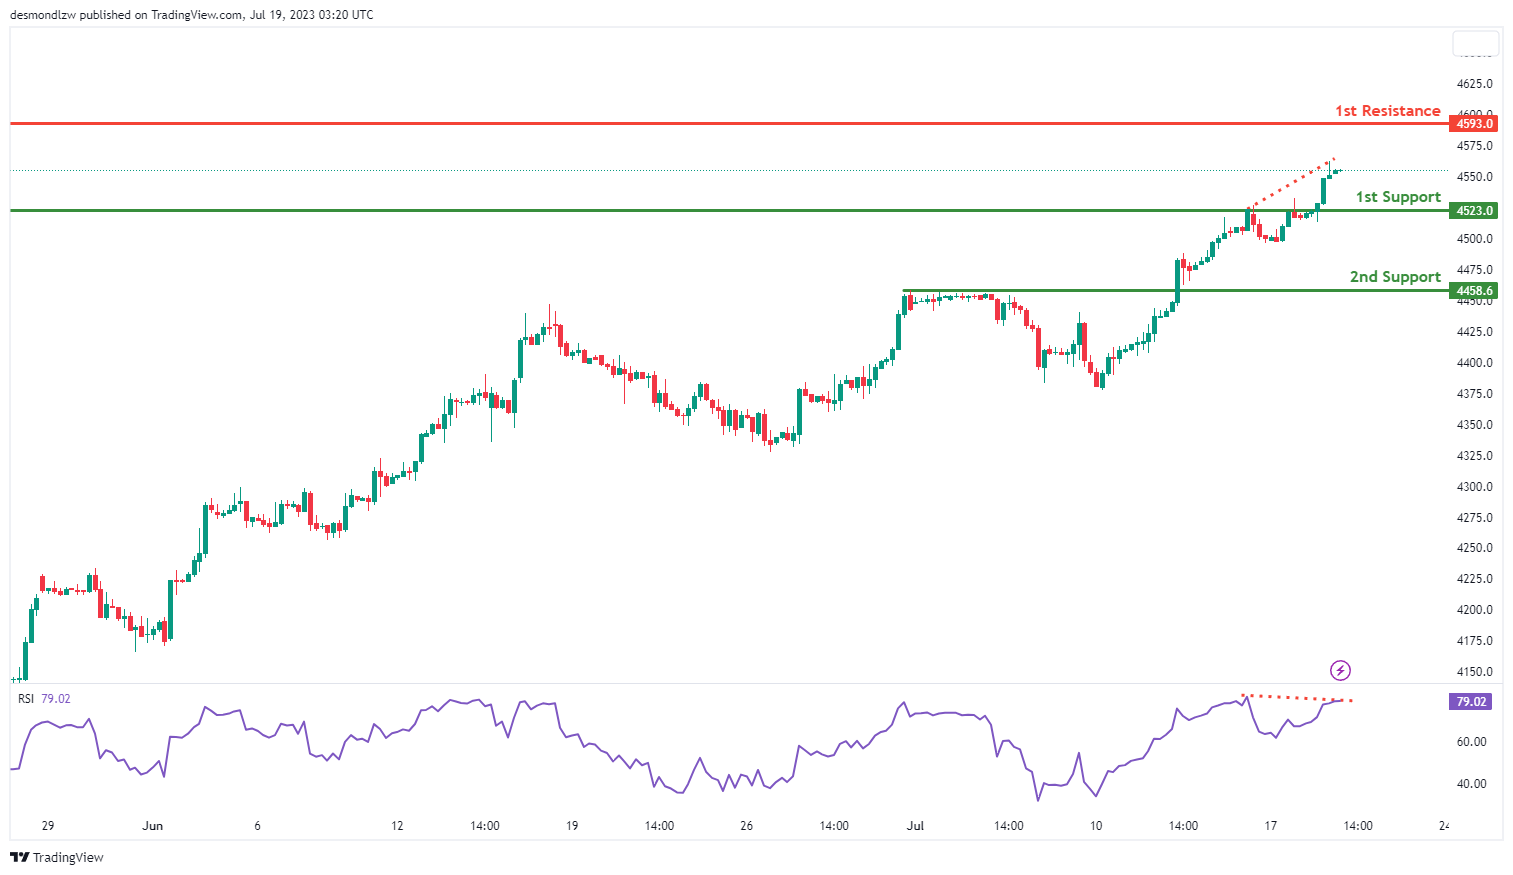
The US500 (S&P 500) chart currently exhibits a bearish overall momentum, suggesting a potential rise towards the 1st resistance level in the short term before reversing off it and dropping towards the 1st support level.
The 1st support level at 4523.0 is identified as a pullback support, indicating a level where buyers may step in and provide price stability. Additionally, the 2nd support level at 4458.6 also acts as a pullback support, further reinforcing its significance.
On the upside, the 1st resistance level at 4593.0 represents a swing high resistance, indicating a level where selling pressure might intensify and potentially stall further upward movement.
Furthermore, the Relative Strength Index (RSI) is displaying bearish divergence versus price, suggesting that a reversal might occur soon. This could further support the bearish scenario.
BTC/USD:
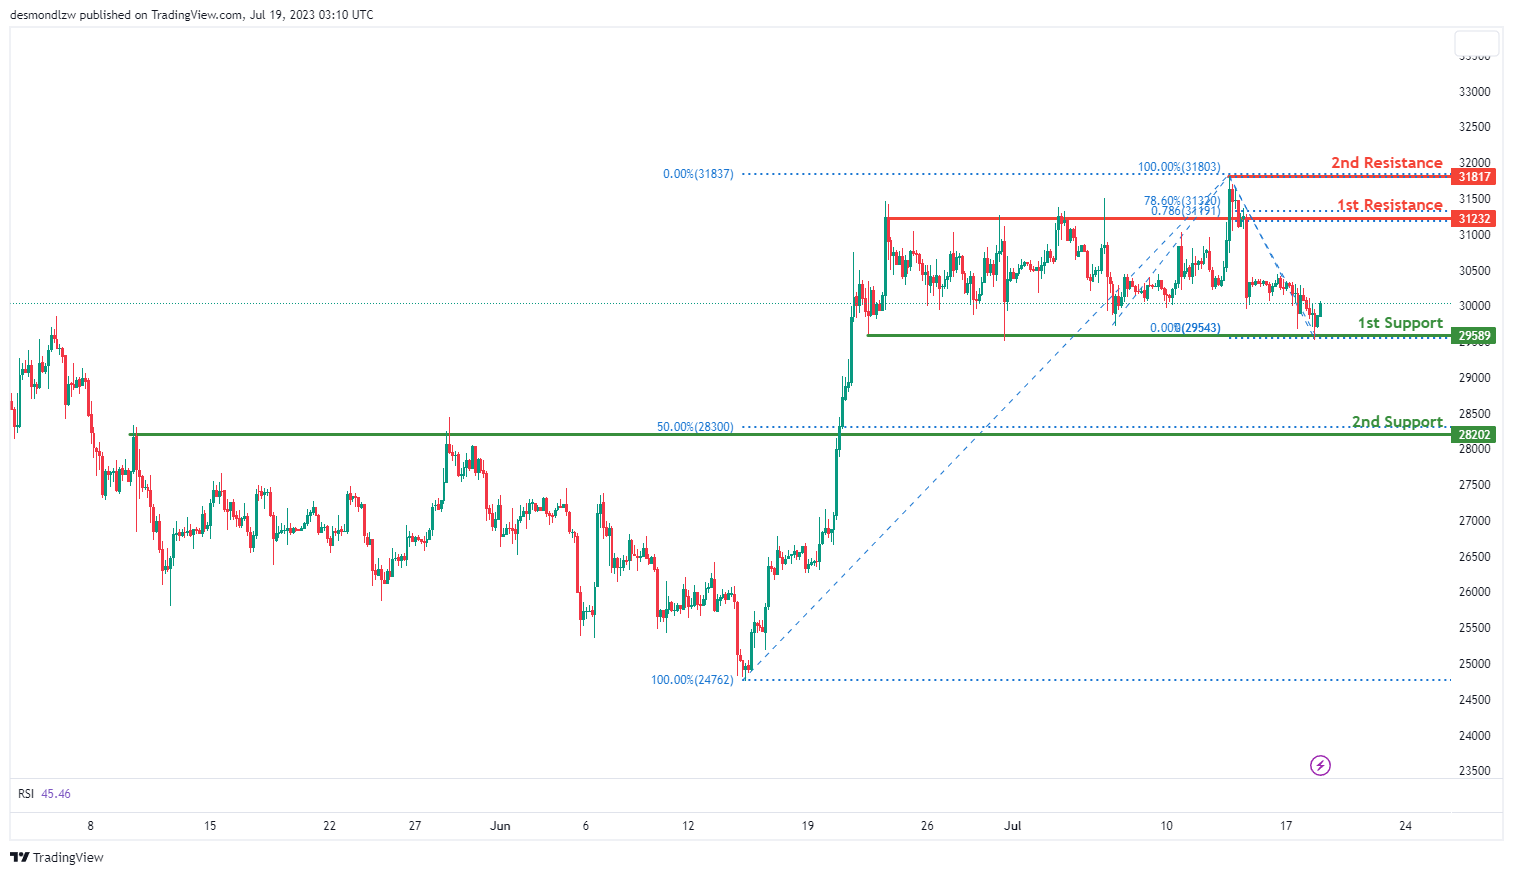
The BTC/USD chart currently exhibits a bullish trend, with the potential for a bullish bounce off the 1st support level at 29589, characterized by its multi-swing low support, and moving towards the 1st resistance.
The 2nd support level is located at 28202, offering a pullback support and aligning with the 50% Fibonacci retracement level, signifying its potential as a strong buying area.
On the upside, the 1st resistance level is identified at 31232. This level presents an overlap resistance and corresponds with the 78.60% Fibonacci retracement, suggesting it could act as a significant barrier to further price increases.
Further upward, the 2nd resistance level is set at 31817, recognized as a swing high resistance, indicating another point where the market could face selling pressure and potentially reverse.
ETH/USD:
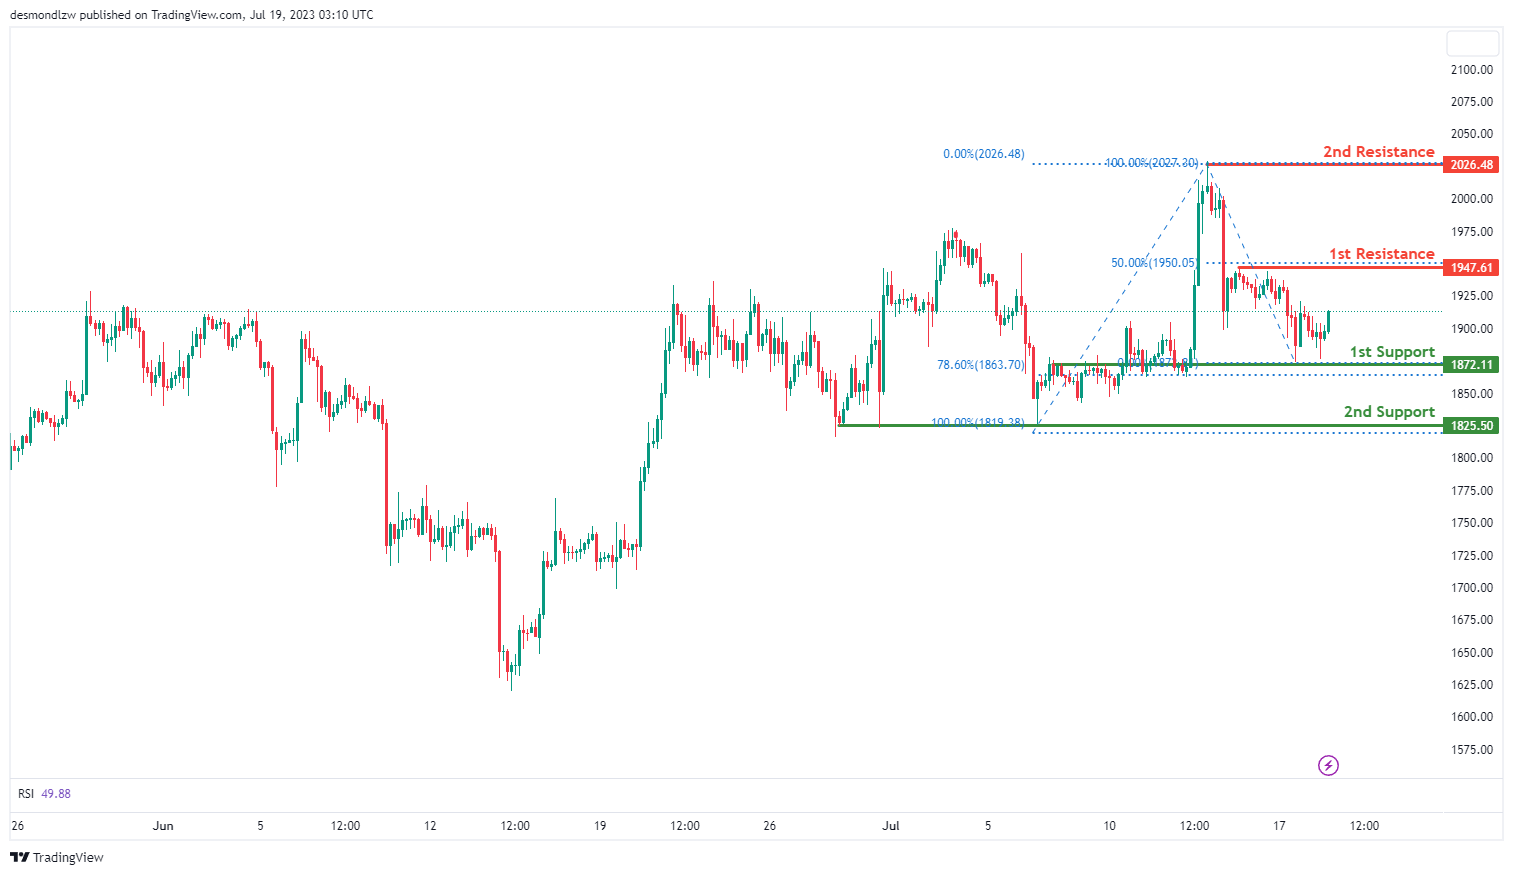
The ETH/USD chart demonstrates a bullish momentum, indicating the potential for a bullish continuation towards the 1st resistance level.
The 1st support level at 1872.11 is considered good due to its status as an overlap support and aligning with the 78.60% Fibonacci Retracement level. Additionally, the 2nd support at 1825.50 acts as a multi-swing low support.
On the upside, the 1st resistance level at 1947.61 represents a multi-swing high resistance and coincides with the 50% Fibonacci Retracement level. Furthermore, the 2nd resistance at 2026.48 is identified as a swing high resistance.
WTI/USD:
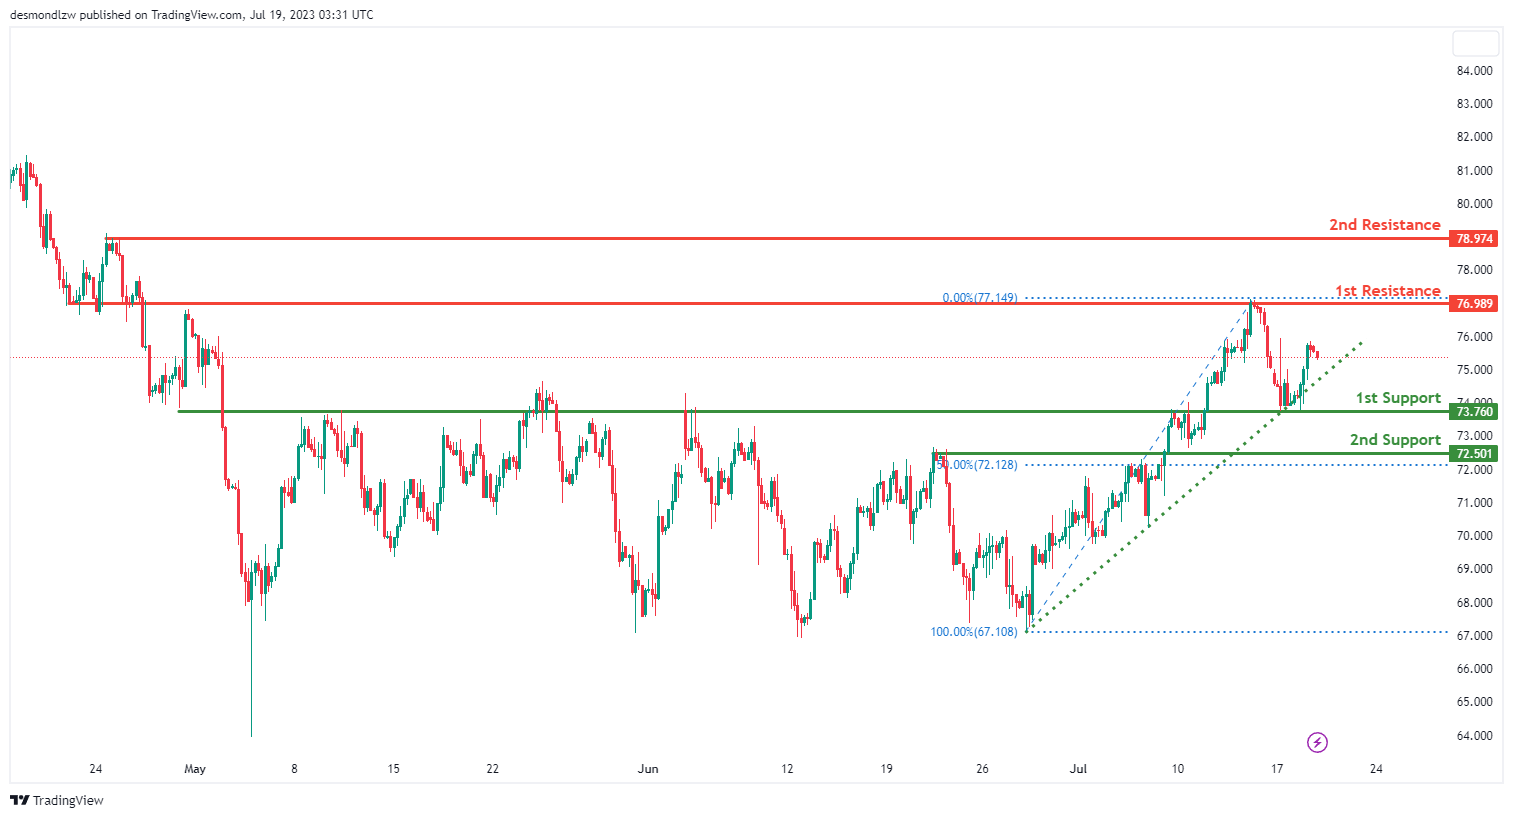
The WTI/USD chart currently shows a weak bullish momentum with low confidence. It is suggested that the price could potentially drop to the 1st support in the short term before bouncing back and rising towards the 1st resistance level.
The 1st support level is at 73.76, which has been identified as an overlap support. This could potentially provide a rebound point for the price in the event of a further decline.
The 2nd support level is at 72.50, recognized as an overlap support and also coincides with the 50% Fibonacci retracement level. This adds significance to the level as a potential barrier to further price declines.
On the flip side, if the price reverses its course and begins to climb, it may face resistance at 76.98, which is identified as an overlap resistance. This could potentially hinder the price’s upward movement.
A further rise in price might encounter the 2nd resistance at 78.97, another overlap resistance level. This level might act as a barrier to further upward movement.
XAU/USD (GOLD):
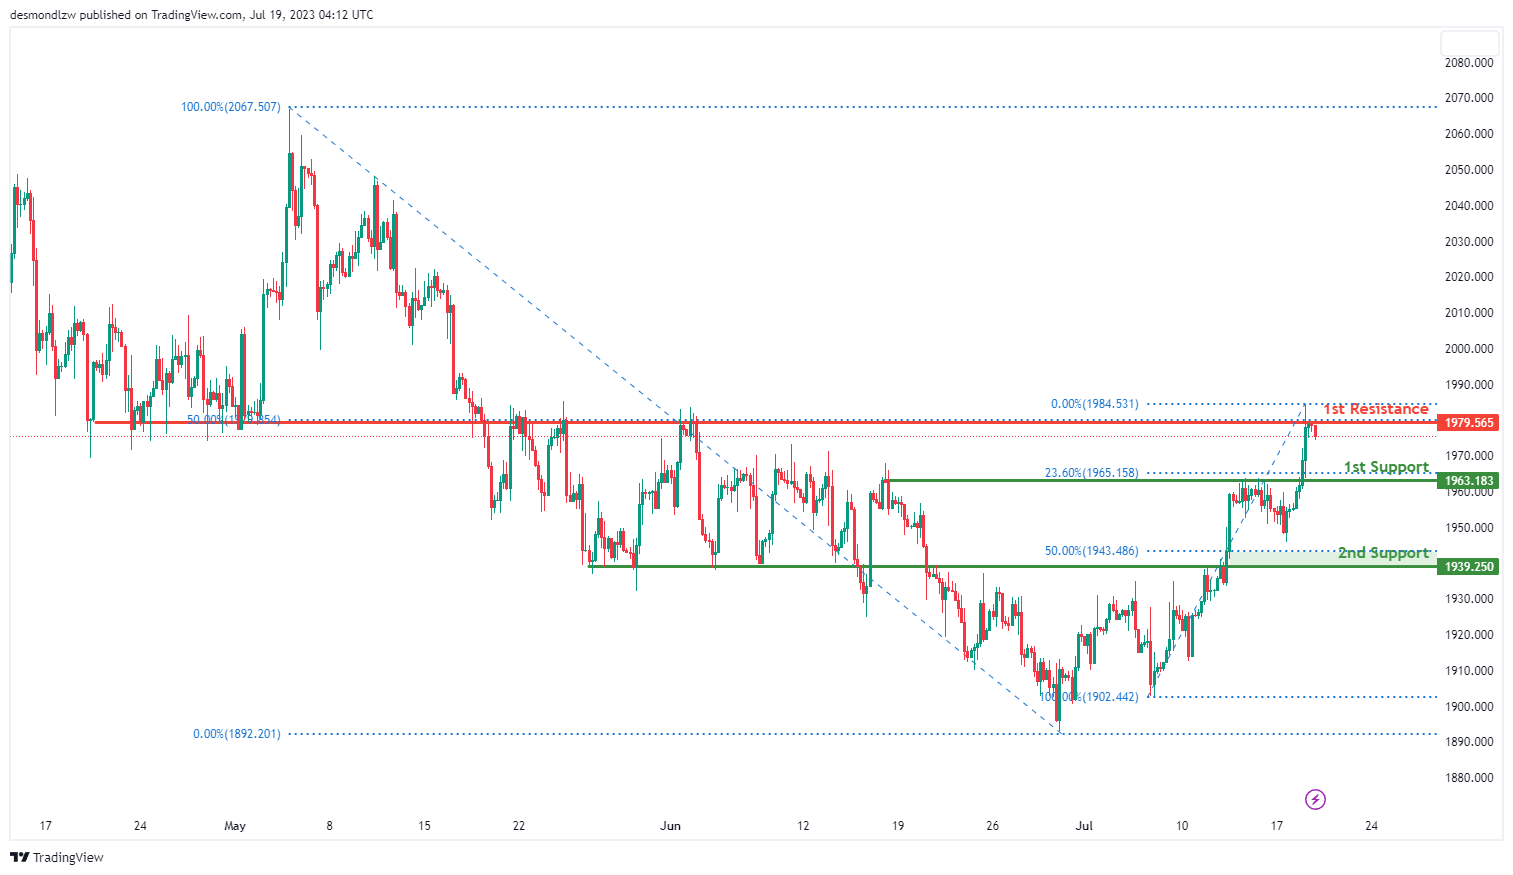
Gold (XAU/USD) currently shows a bearish momentum, suggesting that the price could potentially continue its downward trend towards the 1st support level.
The 1st support level is at 1963.18, recognized as an overlap support and coinciding with the 23.60% Fibonacci retracement level. This could provide a bounce back point for the price if it continues to decline.
The 2nd support level is at 1939.25, identified as an overlap support and also coinciding with the 50% Fibonacci retracement level. This further reinforces the level as a significant potential barrier against further price declines.
On the other hand, if the price reverses its course and begins to climb, it could face resistance at 1979.57. This level is identified as an overlap resistance and also aligns with the 50% Fibonacci retracement level, which could potentially hinder the price’s upward movement.
Australia leading index records 11th consecutive negative month
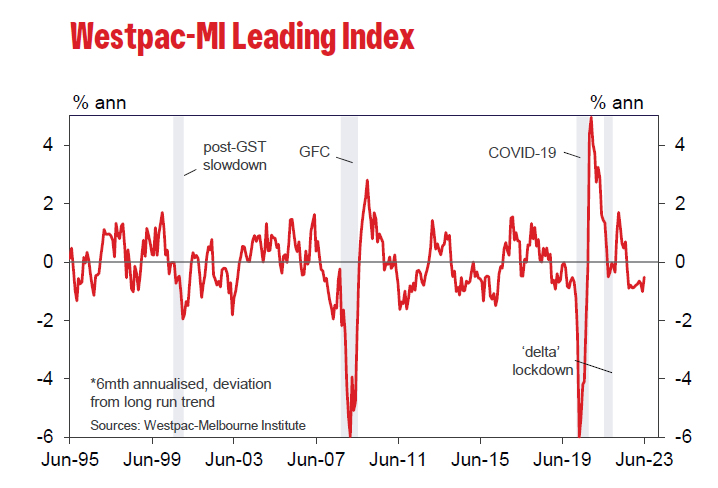
Australia's Westpac Leading Index rose to -0.51% in June from -1.01% in May, marking the eleventh consecutive negative print. This trend indicates that the Australian economy is likely to operate below its potential trend over the six to nine months outlook.
In light of these results, Westpac maintains a modest forecast for Australian economic growth. It expects modest expansion of 0.3% over the year to June 2024, with contraction in consumer spending of -0.2%.
Commenting on the upcoming RBA meeting on August 1, Westpac anticipates a 25 bps hike in interest rate. It noted, "By the August meeting we expect that the Board will be dealing with an inflation read still above 6%; an unemployment rate registering nearly 1ppt below the Board's current estimate of full employment; and the recent report from the national accounts showing unit labour costs growing at 7.9% over the year."
NZ First Impressions Consumers Price Index June Quarter 2023
Consumer prices rose 1.1% in the June quarter and are up 6.0% over the past year. The result was close to our own forecast and the RBNZ expectations. The underlying details were firm.
Consumers Price Index, June quarter 2023
Quarterly change: +1.1% (prev: +1.2%)
- Westpac: +0.9%, RBNZ (May MPS): +1.1%
- Median market f/c: +0.9%, range +0.8% to +1.2%
Annual change: +6.0% (prev: +6.7%)
- Westpac: +5.9%, RBNZ: +6.1%, Market f/c: +5.9%
Key points
- New Zealand consumer prices rose 1.1% in the June quarter, with prices up 6.0% over the past year.
- Today’s result close to our own forecast and the RBNZ expectations.
- Inflation has slowed from the eye-watering rates of over 7% that we saw last year.
- However, while inflation is ‘lower’, it is not ‘low’ by any stretch of the imagination. Importantly, measures of core inflation are continuing to run at rates of around 6%, and some have actually picked up in the June quarter. That points to lingering strength in underlying price pressures.
- Similarly, domestic inflation (aka. non-tradables inflation) remains elevated at 6.6%.
- Those simmering underlying price pressures mean that inflation is unlikely to return within the RBNZ’s target band any time soon.
Details
The 1.1% rise in prices over the June quarter was related to large price swings in some specific areas.
- Food prices were again the major factor that has pushed overall household living costs higher. Food prices rose by 2.2% over the June quarter and are up a massive 12% over the past year.
- Housing costs have also continued to be key contributors to overall inflation. Housing rents rose by an average of 1.1% over the past three months and are up a solid 4.2% over the past year. Rents are the largest single component of the CPI, and they have been rising at a rapid pace for over a year now.
- In addition, the cost of purchasing a new dwelling is continuing to climb, rising by 1.1% over the quarter. But while that was a solid rise, it’s much more moderate than the oversized increases we saw over the past few years when low interest rates and shortages of materials saw construction costs surging.
- Providing some offset to those increases was the fall in petrol prices, with prices at the pump dropping by around 1.5% over the June quarter.
Looking at the change in prices over the past twelve months, annual inflation has slowed to 6.0%, down from 6.7% at the start of this year and a peak of 7.3% last year. Nevertheless, inflation remains uncomfortably high.
- The fall in the annual inflation rate is almost entirely due to petrol prices, which are 15% lower than this time last year.
- Also contributing to the easing in the annual inflation rate, we’re now seeing more moderate increases in construction costs as building activity has slowed and earlier supply chain pressures have eased. Those conditions have seen annual construction cost inflation more than halving from over 18% last year to 7.8% now.
But while there have been some large swings in some specific prices, the bigger focus for the RBNZ is the longer-term trend in prices. On this front, most measures of core inflation (which smooth through the quarter-to-quarter swings in prices and track the underlying trend in inflation) are continuing to track at levels of around 6% – well outside the RBNZ’s 1% to 3% target band.
Notably, several core measures have pushed higher over the past few months, highlighting the continued strength in pricing pressures.
Looking across the broad product groups, domestic (aka. non-tradable) prices were up 1.3% in the June quarter and have risen by 6.6% over the past year. The RBNZ pays particular attention to non-tradables inflation given its close connection to the strength of domestic economic conditions. The central bank had forecast non-tradable prices to rise 1.0% over the quarter, and 6.3% in the year to June. Non-tradables inflation is lingering at high levels, and has only nudged back slightly in the 18 months since the RBNZ began raising the OCR.
Prices for imported goods (sometimes referred to as tradables) rose by 0.8% over the past three months and are up 5.3% over the past year. That’s a further stepdown from the rates we saw last year. However, that’s mostly due to the fall in fuel prices. Other tradable prices are up 8.4% over the past 12 months.
What does today’s result mean for the RBNZ?
While today’s outturn was in line with the RBNZ’s forecast, we suspect the underlying details of the inflation report were actually firmer than the central bank anticipated. In particular, non-tradables inflation was stronger than the RBNZ expected, and is yet to show material signs of cooling. In fact, excluding building costs, non-tradables inflation picked up to 7.1% in the year to June (vs 6.5% in the year to March), with services prices up 6.1% over the past year.
In its recent policy updates, the RBNZ signalled that it expected to keep the OCR at the current level of 5.50% for some time yet. However, with underlying price and wage pressures remaining firm, the RBNZ still has a rocky road ahead. Inflation looks unlikely to be back within the target band before the latter part of next year.
It’s also a mixed picture on the activity front. We are seeing signs that demand is cooling, including sluggish retail spending. But at the same time, we are seeing signs that the economic cycle may still have some legs (such as the turnaround in net migration, and signs that the housing market may be heating up again).
Putting this all together, we continue to see the risk that the RBNZ will need to raise the OCR again.