Sample Category Title
EUR/USD Price: 17-month Maximum
Last week, the dollar index posted its worst week of 2023 amid news of declining US inflation, which was seen as a motive for easing the Fed's current tight monetary policy. "I think the dollar can stay under selling pressure," Carol Kong, currency strategist at Commonwealth Bank of Australia, told Reuters.
On the other hand, inflation in the Eurozone is not declining as fast. FT writes that some ECB officials consider it necessary to raise the rate several more times after the summer meetings, which supports the euro.
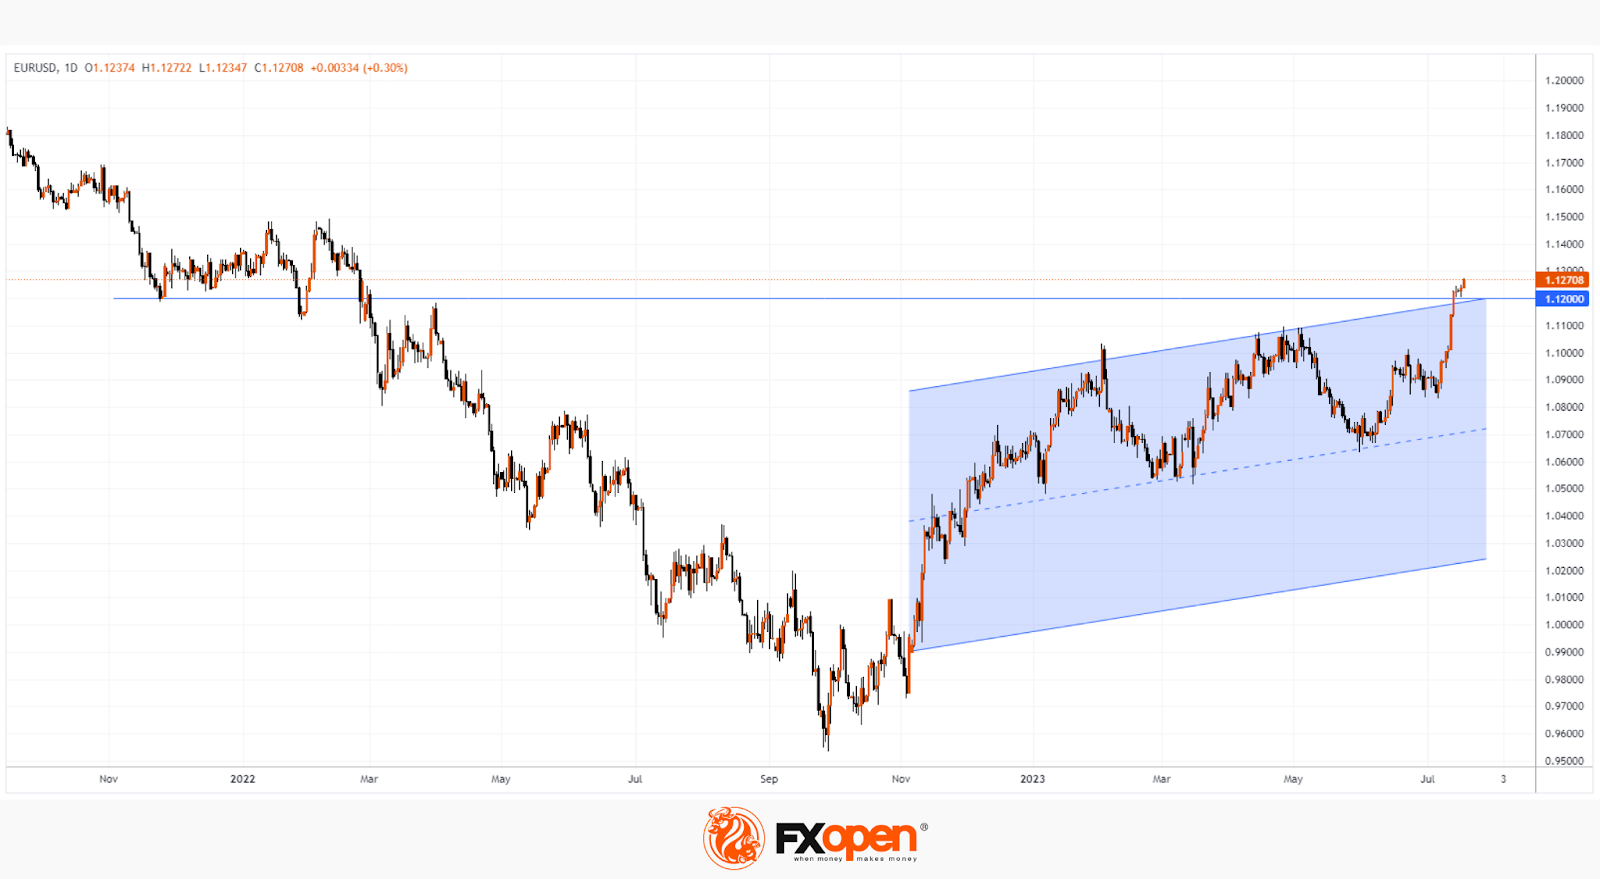
The EUR/USD chart shows demand dominance. At the same time, the price of the euro against the dollar:
- rose above the 1.1200 level for the first time in 17 months. Note that this level has influenced the EUR/USD price dynamics in the past;
- went beyond the upper limit of the ascending channel.
Given these 2 observations, we can assume that the market is in a vulnerable position for a pullback, and the bulls will need to make specific efforts to gain a foothold above 1.1200.
The situation may change in the near future:
- US retail sales data to be released today at 15:30 GMT+3;
- Tomorrow at 12:00 GMT+3 inflation data in the Eurozone will be published.
Aussie Shrugs after RBA Minutes, US Retail Sales Next
- RBA minutes point to close call at July decision
- US retail sales for June expected to climb
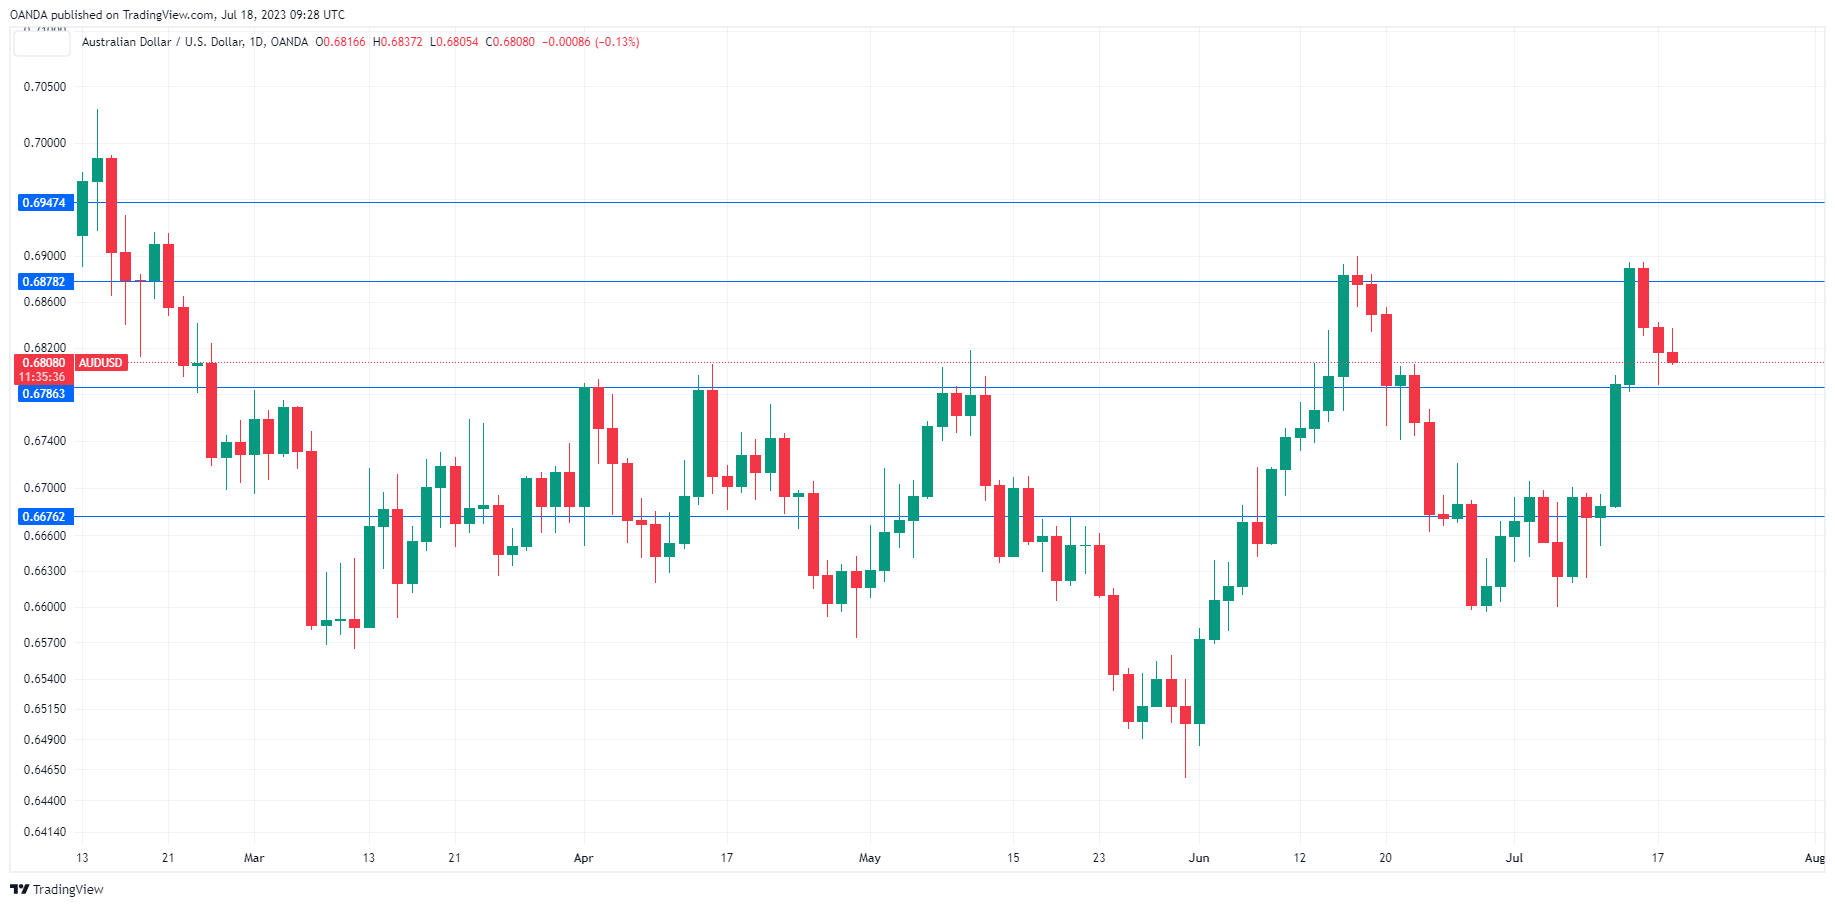
The Australian dollar has edged lower on Tuesday, trading at 0.6807, down 0.14%. We could see some further movement in the North American session when the US releases retail sales.
RBA minutes point to uncertainty about the economy
The RBA minutes didn’t provide much in the way of insights and the Australian dollar barely showed a muted response. Perhaps the most interesting aspect of the minutes was the spelling out of both sides of the argument about whether to raise rates or take a pause. In support of a hike, the minutes noted that wage growth is rising, inflation is falling and the labour market remains tight. The case for a pause relied on inflation remaining high and weaker growth. In the end, policy makers voted to pause since the arguments in favour of holding rates were more compelling.
The minutes stated that monetary policy was “clearly restrictive” at the current rate level but that would not preclude the RBA from further tightening, which would depend on the economy and inflation. The money markets have priced a pause at the August 1st meeting at 75%, according to the ASX RBA rate tracker. At the July meeting, the decision to pause was a close call and that could repeat itself at the August meeting, so I am not as confident in a pause as the money markets.
US retail sales expected to climb
The US releases the June retail sales report, with expectations that consumers remain in a spending mood. The consensus estimate for headline retail sales is 0.5% m/m, up from 0.3%, and the core rate is expected to rise 0.3%, up from 0.1%.
The Federal Reserve is widely expected to raise rates at the July 27th meeting. If retail sales improve as expected, we could see the pricing for a September rate hike – currently, there is only a 14% chance of a rate hike, according to the CME Tool Watch.
AUD/USD Technical
- There is resistance at 0.6878 and 0.6947
- 0.6786 and 0.6676 are providing support
EUR/GBP: Falling Thick Daily Cloud Produces Strong Headwinds to Near-Term Recovery
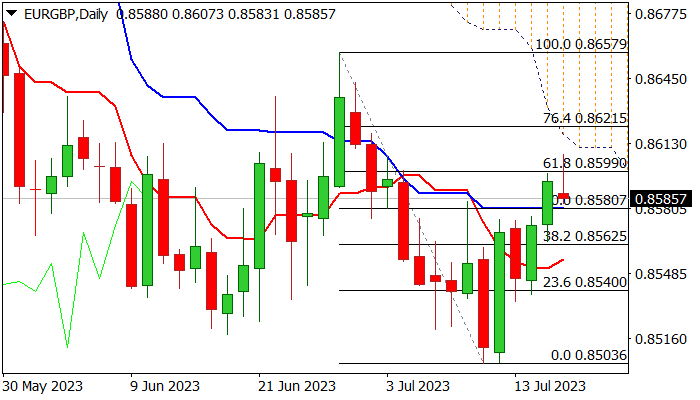
Attempts to extend strong rally of past two days failed at pivotal Fibo barrier at 0.8599 (61.8% of 0.8657/0.8503), as probe above faced strong headwinds from thick falling daily cloud (base of the cloud lays at 0.8610).
Short-lived spike higher is forming a daily candle with long upper shadow, which generates initial signal of possible recovery stall, though needs confirmation in daily close in this shape.
The notion is supported by overbought stochastic and 14-d momentum in negative territory and heading south.
Close below 0.8599 will provide initial negative signal and keep the downside vulnerable, with dip and close below 0.8580 (daily Kijun-sen / broken 50% retracement) to further weaken near-term structure and increase downside risk.
Alternatively, sustained break above 0.8599 pivot to keep bullish bias, but penetration into daily cloud is needed to fully employ bulls for stronger recovery.
Res: 0.8599; 0.8610; 0.8621; 0.8643.
Sup: 0.8580; 0.8562; 0.8540; 0.8518.
ECB Visco: Inflation may come down faster
Talking to Bloomberg TV, ECB Governing Council member Ignazio Visco said, "Since we have also been observing a substantial reduction in energy prices, we have to expect that this will be seen also in underlying inflation in the coming months, certainly by the end of the year."
Visco also suggested the possibility of a quicker pace than initially forecasted by ECB, saying, "The ECB projects that by the end of 2025 there will be 2% — my impression is that it might be faster."
Visco cautioned against the risks associated with making excessive adjustments, stating, "There is a risk of doing too much and I think that we have to be careful about that." However, he also noted the potential risk of doing too little, emphasizing the need for balance and judicious decision-making based on incoming information.
Meanwhile, another Governing Council member Klaas Knot expressed his perspective on potential policy adjustments beyond July. "For July I think it (rate hike) is a necessity, for anything beyond July it would at most be a possibility but by no means a certainty," Knot said. He urged careful monitoring of the data from July onwards, to assess the distribution of risks surrounding the baseline.
EURJPY’s Recovery Attempt Stalls; Signals Mixed
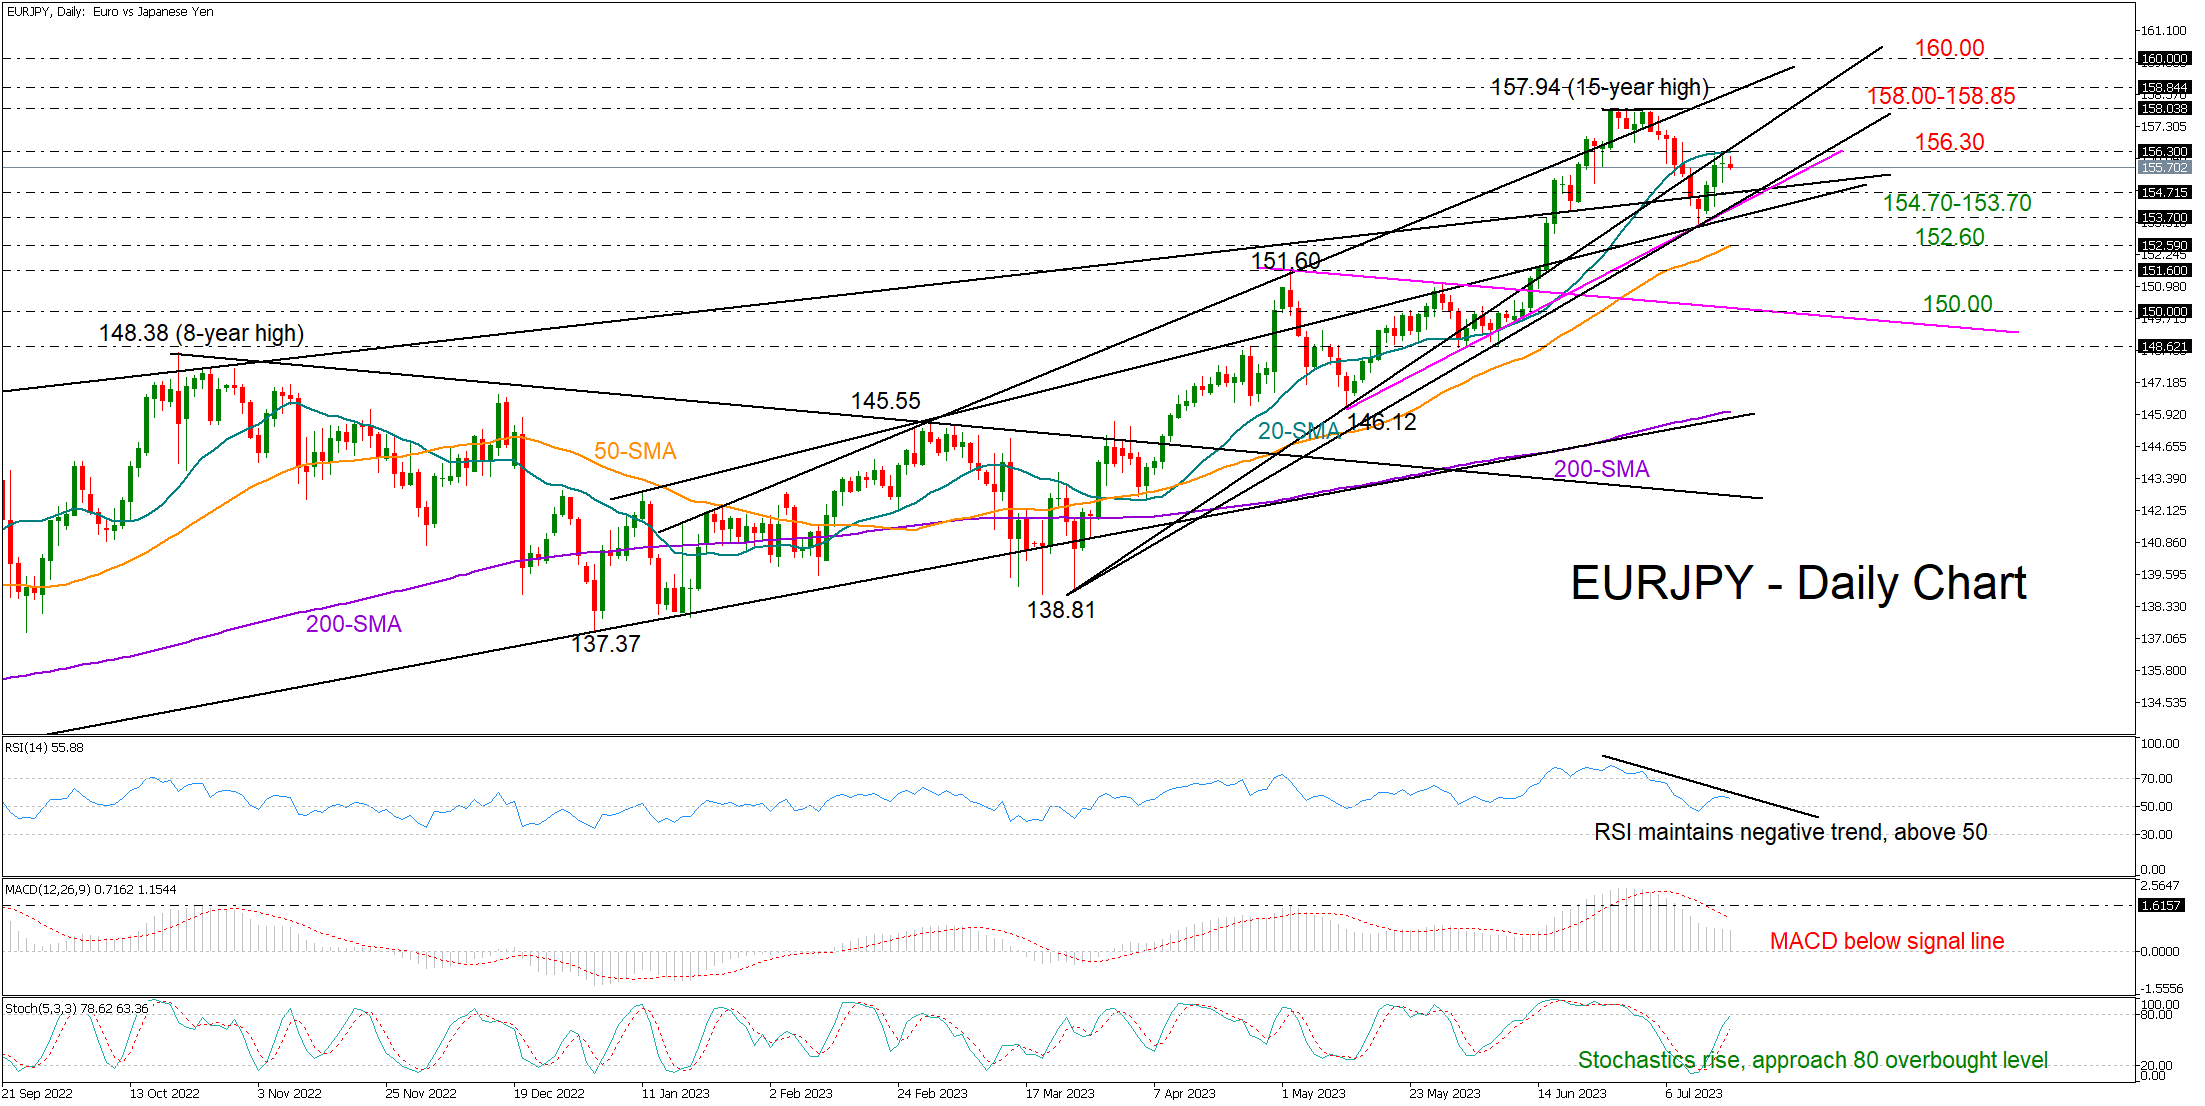
EURJPY opened the week with a doji candlestick slightly lower than the 20-day SMA at 156.30, following its rebound from the March support trendline.
The trendline bounce indicates the positive trend will persist, yet Monday's doji candlestick may bring doubt. In momentum indicators, the RSI is maintaining a negative trajectory despite climbing back above its 50 neutral mark. The MACD is within the positive zone and comfortably below its red signal line, while the stochastic oscillator is nearing its 80 overbought level.
Given the mixed signals, traders may stay on the sidelines unless the price closes above the 20-day SMA and the 156.30 bar or falls below the 154.70 -153.70 trendline area.
In the first case, the price could accelerate towards its 15-year highs and the 158.00 bar. A successful move above the ascending line from January 18 at 158.85 could lift the price towards the 160.00 psychological mark. If this proves an easy obstacle too, the price could chart a new higher high somewhere between 162.50 and 163.00. This is where the bulls faced rejection in August 2008.
In the bearish scenario, where the pair slides below 153.70, the spotlight will fall on the 50-day SMA at 152.60. Should the sell-off stretch below May’s peak of 151.60, the next pivot could take place around the 150.00 round level.
All in all, EURJPY is waiting for its next directional catalyst. A step above 156.30 is expected to strengthen buying forces, while a correction below 153.70 could display early signs of a bearish trend reversal.
GBPUSD Pulls Back from 15-month Peak; Bullish Structure Holds
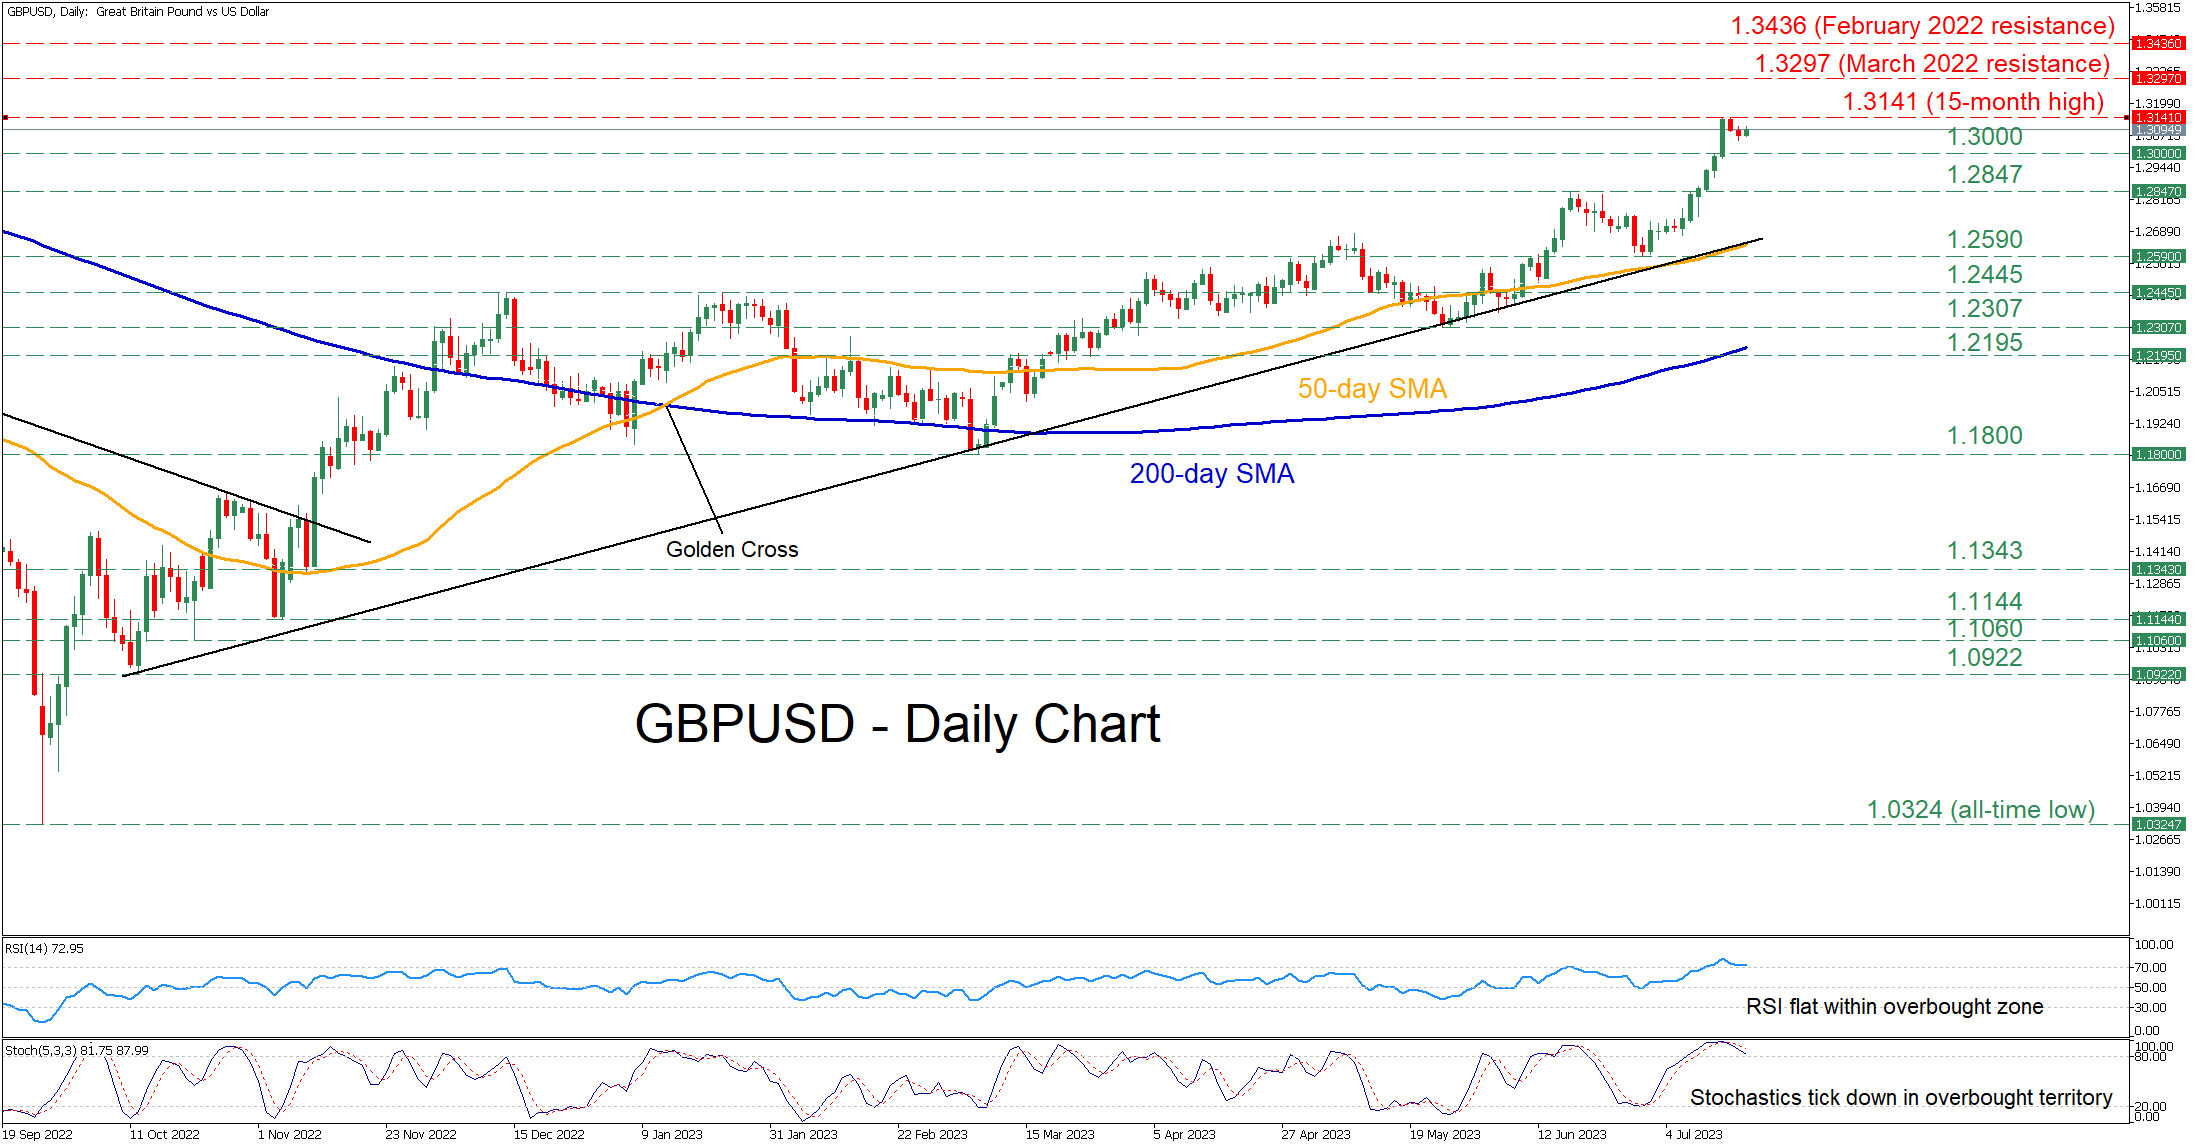
GBPUSD has been in a prolonged uptrend since October 2022 supported by its long-term ascending trendline. Last Friday, the pair stormed to a fresh 15-month high of 1.3141 before paring some gains, but it is still too early to call this a downside correction.
However, the momentum indicators are holding well within their overbought territories, hinting that the recent pullback could extend. Specifically, the stochastic oscillator is negatively charged within its 80-oversold territory, while the RSI remains directionless in overbought conditions.
If the bears manage to push the price lower, the crucial 1.3000 psychological mark could act as the first line of defense. Sliding beneath that floor, the pair may face the previous resistance zone of 1.2847. Should that barricade fail also, the congested region that includes the ascending trendline taken from October 2022 and the 50-day simple moving average (SMA) could cap the pair’s downside before the June support of 1.2590 gets tested.
On the flipside, if the long-term bullish structure extends, the 15-month peak of 1.3141 might be the first hurdle for buyers to clear. Jumping to a fresh higher high, the pair could ascend towards the March 2022 resistance of 1.3297. A violation of the latter may open the door for the February 2022 resistance of 1.3436.
Overall, GBPUSD appears to be ready to experience a healthy correction due to reaching overbought conditions. Nevertheless, it is likely that the pair extends its bullish long-term structure as long as it holds above the ascending trendline.
EUR/AUD Daily Outlook
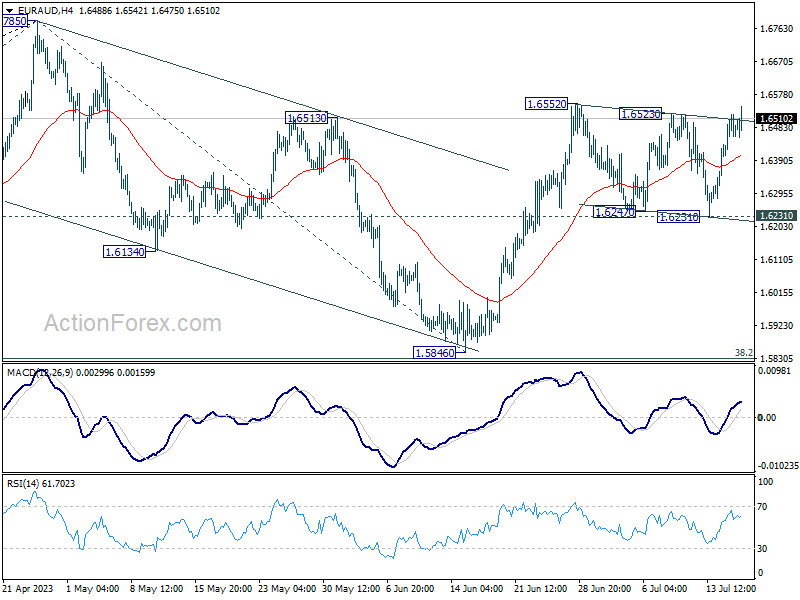
Daily Pivots: (S1) 1.6423; (P) 1.6473; (R1) 1.6538; More...
Immediate focus is now on 1.6552 resistance. As noted before, correction from 1.6785 should have completed with three waves down to 1.5846. On the upside, break of 1.6552 will target a retest on 1.6785 high next. This will remain the favored case as long as 1.6231 support holds, even in case of another dip.
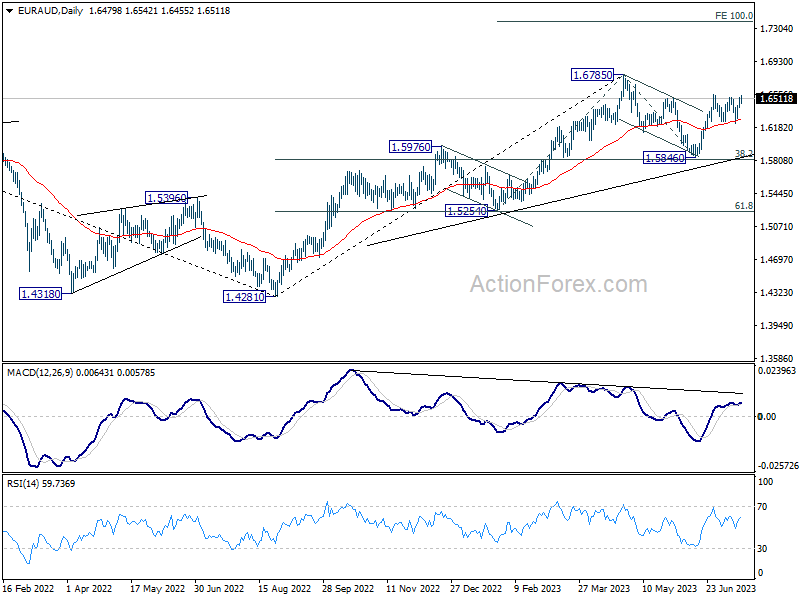
In the bigger picture, with 38.2% retracement of 1.4281 to 1.6785 at 1.5828 intact, rally from 1.4281 is still in progress. Firm break of 1.6785 will confirm rise resumption. Next target is 100% projection of 1.5254 to 1.6785 from 1.5846 at 1.7377. On the other hand, rejection by 1.6785 will extend the corrective pattern with another fall leg. But outlook will stay bullish as long as 1.5828 holds.
EUR/GBP Daily Outlook
Daily Pivots: (S1) 0.8576; (P) 0.8587; (R1) 0.8607; More...
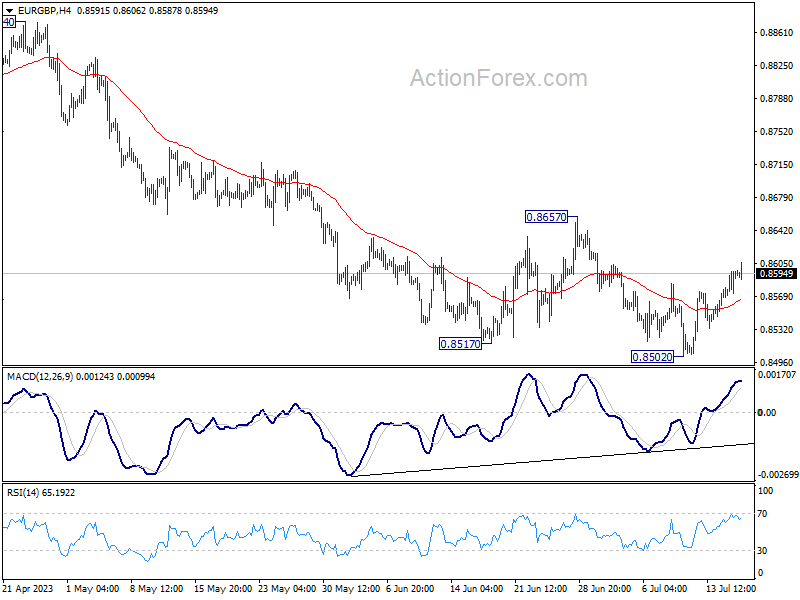
Intraday bias in EUR/GBP stays mildly on the upside at this point. Rebound from 0.8502 would target 0.8657 resistance. Considering bullish convergence condition in 4H and D MACD, firm break of 0.8657 will be a sign of bullish trend reversal. On the downside, break of 0.8502 will resume the whole decline from 0.8977 instead.
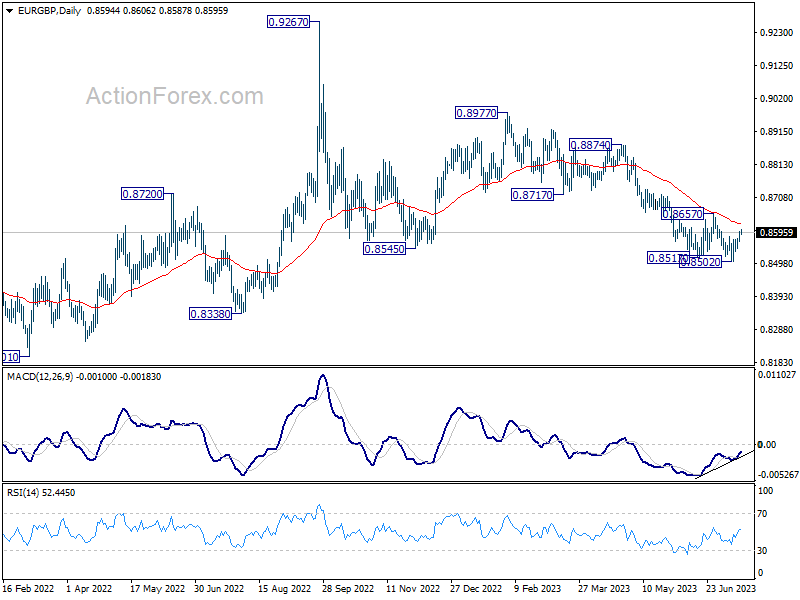
In the bigger picture, the down trend from 0.9267 (2022 high) is still in progress. It's seen as part of the long term range pattern from 0.9499 (2020 high). Deeper fall could be seen towards 0.8201 (2022 low). But strong support should be seen from there to bring reversal. This will now remain the favored case as long as 0.8657 resistance holds.
EUR/JPY Daily Outlook
Daily Pivots: (S1) 155.22; (P) 155.78; (R1) 156.46; More....
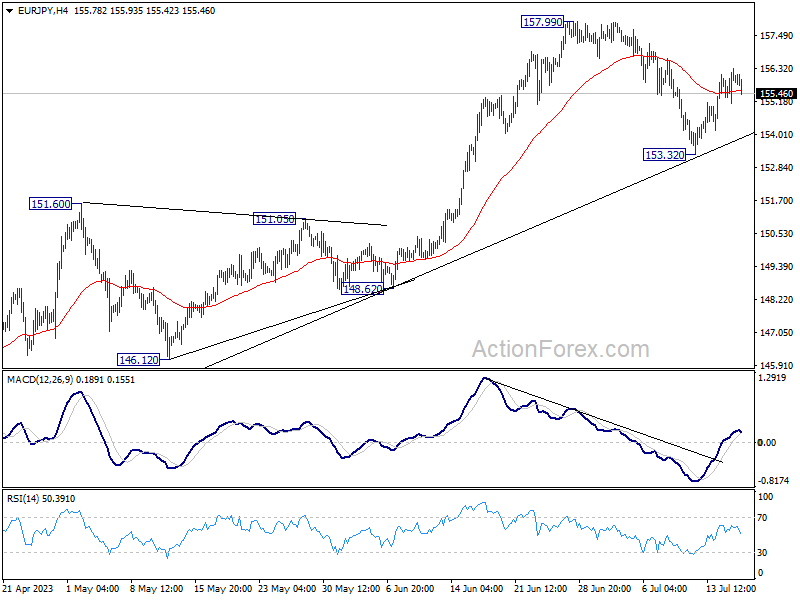
Further rise could still seen in EUR/JPY to retest 157.99 high. Firm break there will resume larger up trend. On the downside, break of 153.32 will extend the pull back from 157.99 to 55 D EMA (now at 152.73) and possibly below.
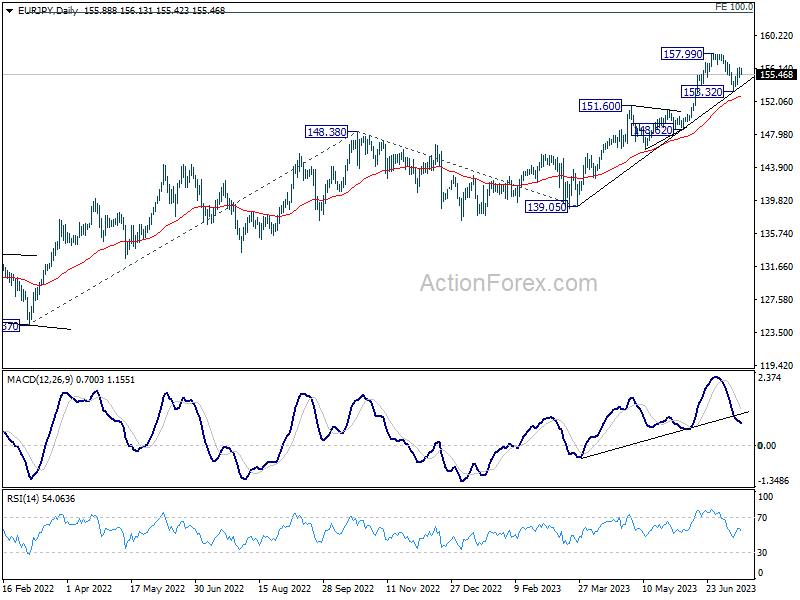
In the bigger picture, as long as 151.60 resistance turned support holds, rise from 114.42 (2020 low) is in progress. On resumption, next target is 100% projection of 124.37 to 148.38 from 138.81 at 162.82. Nevertheless, sustained break of 151.60 will argue that larger correction is already underway.
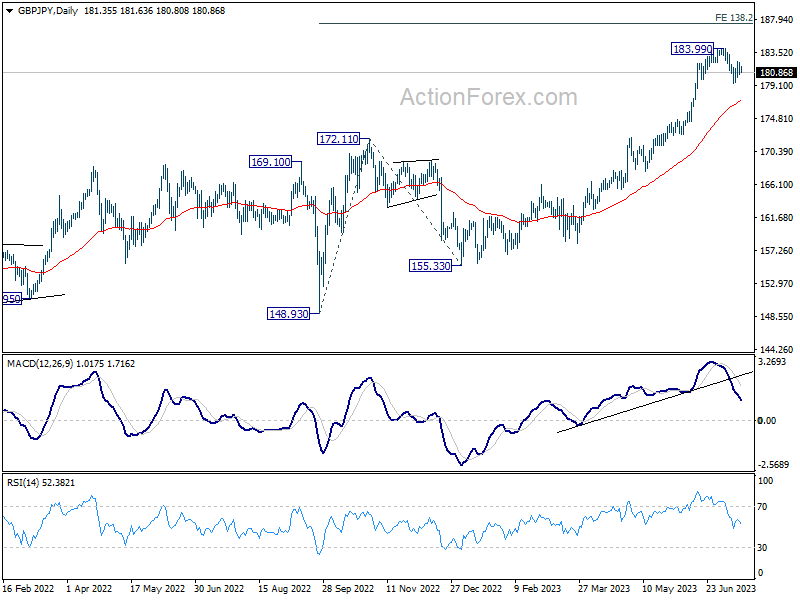
GBP/JPY Daily Outlook
Daily Pivots: (S1) 180.58; (P) 181.36; (R1) 182.15; More...
Intraday bias in GBP/JPY is turned neutral as recovery from 179.45 lost momentum after hitting 55 4H EMA. On the downside, break of 179.45 will resume the correction from 183.90 to 55 D EMA (now at 177.16). On the upside, firm break of 183.99 high will resume larger up trend to 187.36 projection level.
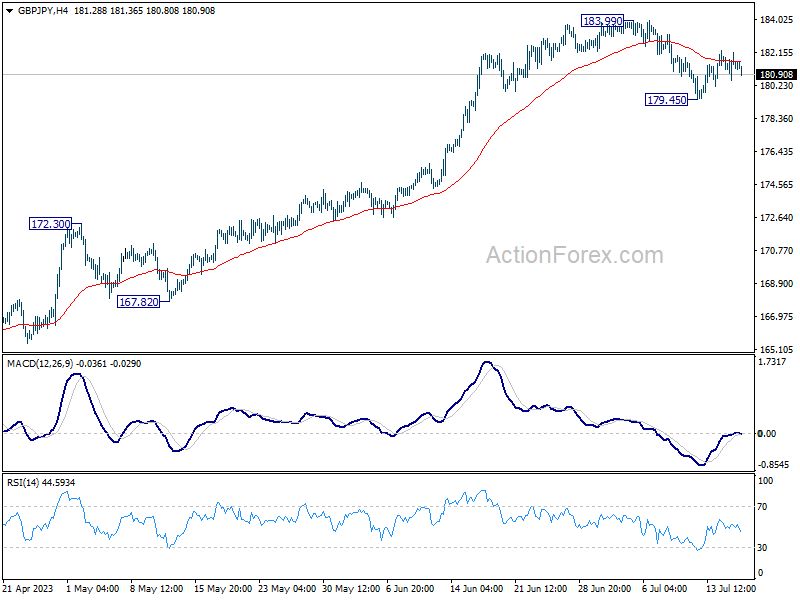
In the bigger picture, as long as 172.11 resistance turned support holds, up trend from 123.94 (2020 low) is expected to continue. On resumption, next target is 138.2% projection of 148.93 to 172.11 from 155.33 at 187.36, and then 195.86 (2015 high). Nevertheless, firm break of 172.11 will argue that larger correction is already underway.