

Sample Category Title
Caution Lingers on China Fears, Earnings Take Centre Stage
Asian shares flashed red on Tuesday as concerns over China’s sluggish economic recovery weighed on sentiment.
The disappointing GDP data published in the previous session along with the hefty losses posted by China’s Evergrande over two years sapped investor confidence in the world’s second-largest economy. Interestingly, European futures are pointing to a flat open, shrugging off the caution from Asia with investors focusing on key economic data and corporate earnings. On Wall Street, the S&P 500 closed at 15-month highs yesterday and could be injected with more volatility as earnings season switches into higher gear. The likes of Bank of America, Morgan Stanley, Goldman Sachs, Netflix, and Tesla among others will announce their quarterly results this week.
In the currency arena, the dollar slightly weakened against other G10 currencies ahead of the U.S. retail sales and industrial production data released later today. Looking at commodities, oil bulls were able to draw strength from Russia’s plans to cut crude exports while gold prices nudged higher, supported by China growth fears and expectations around the Fed ending its rate hike cycle.
Dollar shaky ahead of key US data
The pending U.S. retail sales and industrial production figures could influence monetary policy expectations before the Fed meeting next week. After the June US CPI report cooled more than expected, investors are searching for more signs of inflation slowing in the world’s largest economy. Markets are forecasting retail sales to rise 0.5% in June, marking an increase from 0.3% in the prior month. The industrial production figures are expected to hold steady in June after falling 0.2% in May. Should the incoming US data bring a positive surprise, this could refuel speculation around the Fed keeping interest rates higher for longer.
Commodity spotlight – Gold
Gold flirted around the $1960 level this morning as market players evaluated China’s sluggish growth and speculation around the Fed ending its rate hike campaign.
The precious metal is likely to remain supported by a weaker dollar and subdued Treasury yields ahead of another busy week for financial markets. Fresh volatility could be on the cards for gold over the next few days as investors focus not only on US economic data but corporate earnings which could influence overall sentiment. Should gold experience a clean breakout and solid close above $1960, this may encourage a move towards $1985 and $2000 respectively. But if $1960 proves to be a tough resistance, prices may slip back towards $1940 and $1932.
Energy, Metals Fall, Wheat Rallies
The week started with unpleasant news really. First, the Chinese growth numbers disappointed at yesterday’s open, and sent the metal, energy, and European stocks down. A barrel of American crude fell 1.72% and slipped below the $75pb level, and is still consolidating below this level this morning, the European nat gas prices continue trending lower following an upbeat mood at the start of the summer on expectation that the European nations refilling their reserves for winter would push prices higher. But the disappointing growth numbers and the slowing activity in Europe hammered the positive trend and the prices remained under pressure despite the recent spike in oil prices. Then, Wisdomtree’s industrial metals ETF dropped nearly 2% and Hermes slumped more than 4% below its 50-DMA and to its 100-DMA yesterday on worries that the Chinese costumers, who were the reason why the company announced juicy earnings in the past few quarters. In summary, energy and French luxury goods, and the British FTSE 100 index – full of energy and miners – didn’t react well to the news.
Then, Russia cancelled the grain deal, which allowed the safe passage of around 33 million of crops from Ukraine via Black Sea since last June and wheat futures jumped nearly 3.50% yesterday. While Russia had only half-heartedly agreed to sign a Turkish brokered deal, the latest explosion in the bridge between Russian and Crimea and the Western sanctions that are taking a toll on the Russian exports brought Russia to drop the deal, turning all eyes to Turkish President Erdogan, who said that he will meet Vladimir Putin in August, but given the urging situation he will certainly call him before. There is one thing that could displease Russians though, and it is the fact that Erdogan gave a greenlight for Sweden joining NATO just a couple of days ago. The latter could make another crop deal harder to be sealed. So, all eyes are on Turkish President Erdogan. If he can’t agree on a new deal, the Ukrainian crops must take a pricier detour to reach the international market and that extra cost could discourage farmers to keep supply steady. Lower supply could boost wheat prices and add to food price inflation worries that had just started easing.
US stocks extend rally
But it doesn’t seem to be a concern for the US equities, as despite the morose mood in Asia and Europe yesterday, the S&P500 advanced yet to another high since April 2022, as Nasdaq 100 reached levels last since at the start of last year. The US 2-year yield which consolidates near the 4.70% level on hope that the Federal Reserve’s (Fed) tightening cycle is soon over. And the 7-9% drop expected in S&P500 earnings is nothing compared to a chance that the US economy could avoid a hard landing following the Fed’s steep interest rate hikes. After all, the Fed’s balance sheet only slowly drops, as the Fed’s reverse repo operations tank, which means that the Fed is keeping the market liquidity in a sweet spot as the US Treasury general account is being refilled after the debt limit crisis. And all that liquidity continues to be supportive of stock prices, no matter how fast the Fed increases its interest rates.
Menu du Jour
Anyway, today, Bank of America, Morgan Stanley and Lockheed Martin will be releasing their quarterly earnings. While BoFA and Morgan Stanley’s investment branches may have taken a hit, investors will be looking at how well these banks benefited from rising rates. Lockheed Martin on the other hand will undoubtedly continue outperforming as war and geopolitical tensions only keep rising and increasing the defense budgets around the world.
On the macro calendar, the US retail sales will be in focus today, as the resilience of the US consumer spending is another headache in the Fed’s fight against inflation, and the data could not surprise to the downside. According to Bank of America’s card data, spending in June was down by 0.2% ‘but not out’ and the official numbers are expected to show a slow improvement. A better-than-expected read could fuel inflation expectations and slowdown the US dollar’s selloff but unless we see seriously strong data, any improvement will unlikely to turn the bearish winds around in the medium run.
Technical Outlook and Review
DXY:
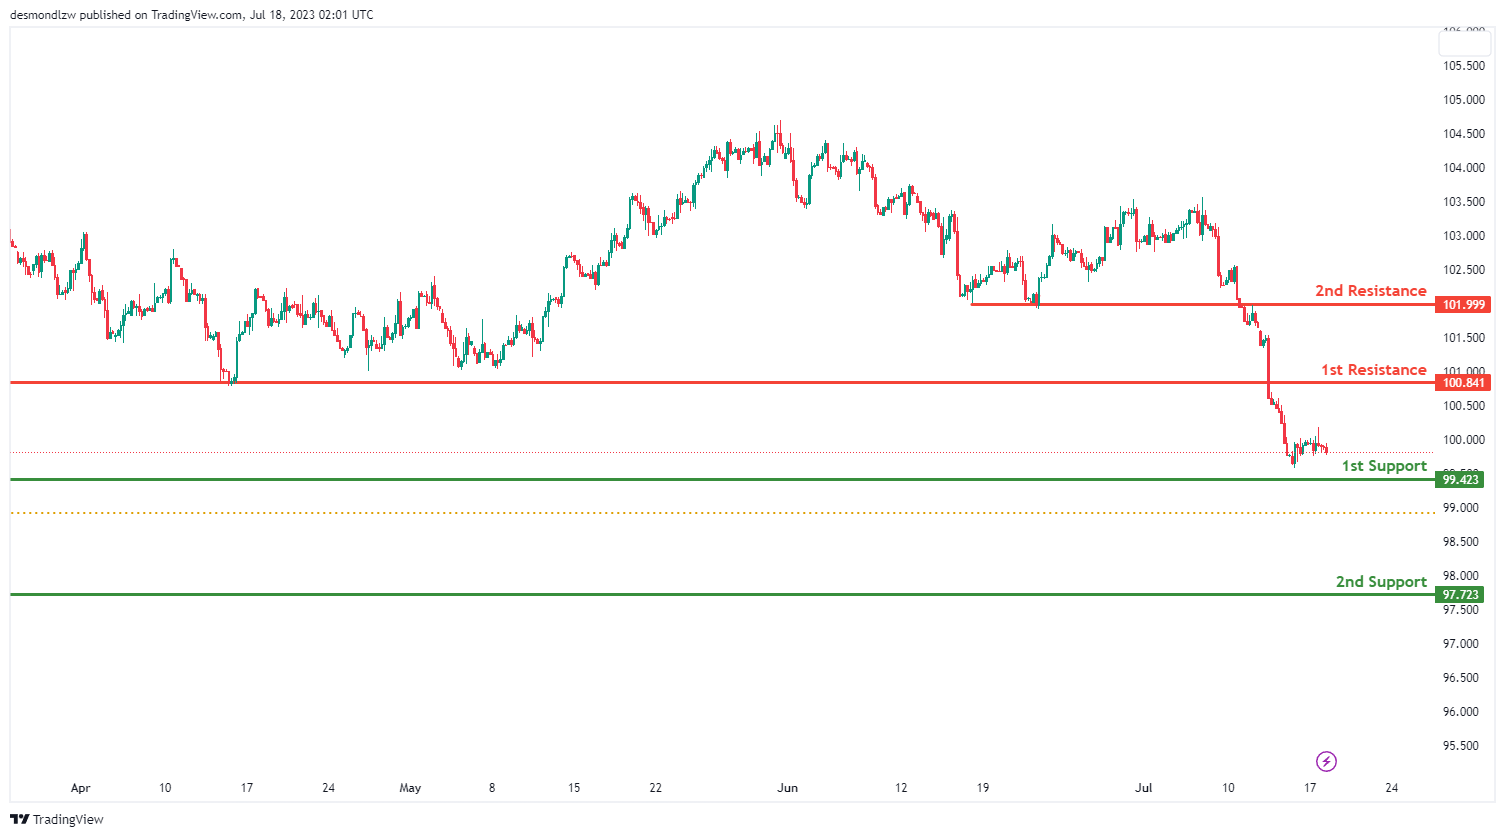
The DXY (US Dollar Index) chart is currently showing a bearish momentum This suggests that the price could potentially continue to descend towards the 1st support level.
The 1st support level is found at 99.42, which is recognized as an overlap support. Should the price break this level, it could continue its bearish trajectory towards the 2nd support level at 97.72, also characterized as an overlap support. These support levels mark important areas where buying interest might outweigh selling pressure, leading to a potential price rebound.
On the other hand, if the price begins to rise, it could face resistance at 100.84, identified as pullback resistance. Further above, the 2nd resistance level is at 101.99, also recognized as an overlap resistance. These resistance levels might act as obstacles to upward price movements and could stimulate a selling response.
EUR/USD:
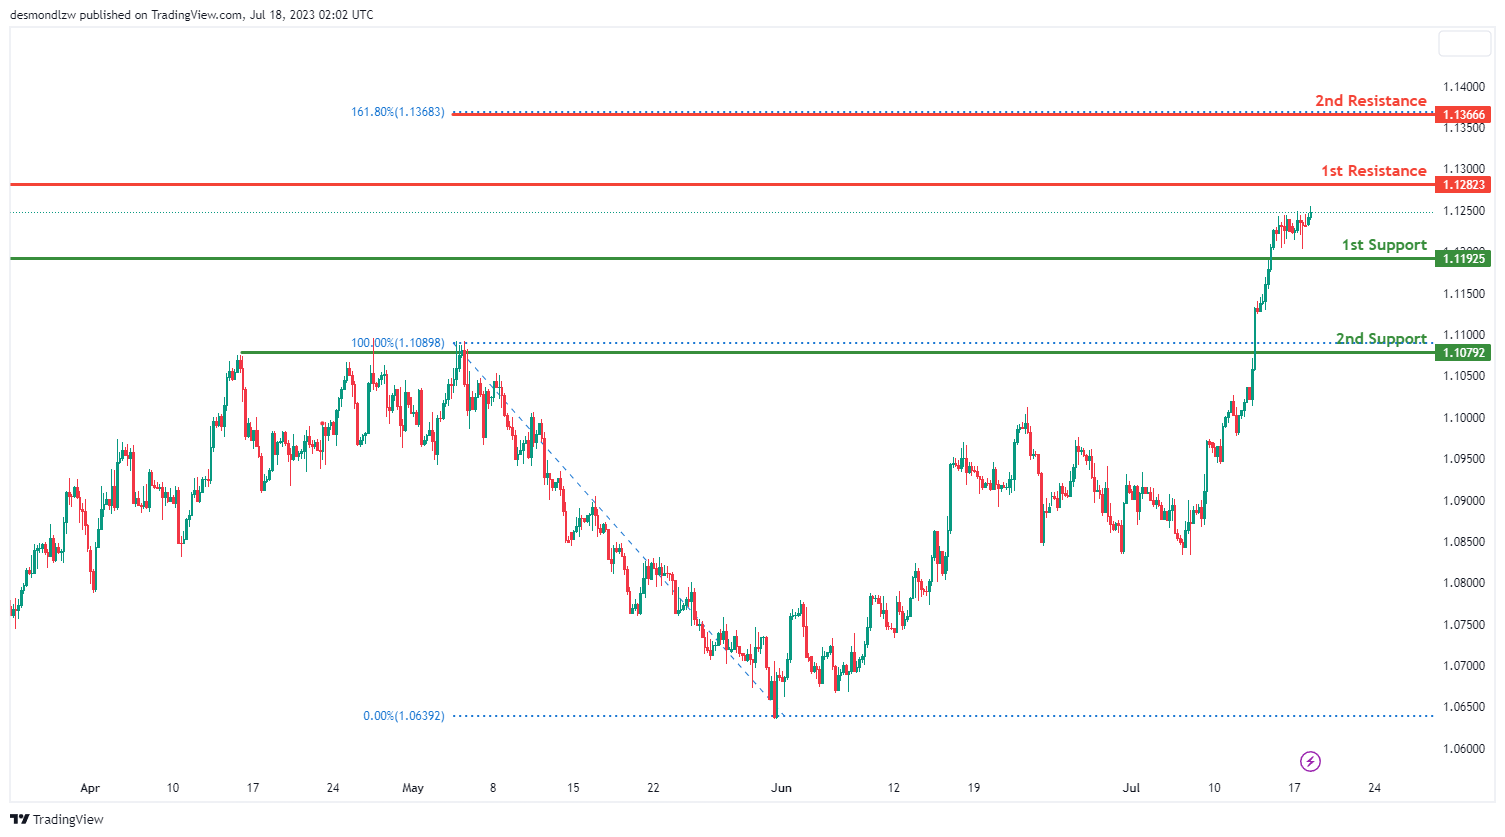
For the EUR/USD instrument, the overall momentum of the chart is bullish. This suggests that the price could potentially continue its upward movement towards the 1st resistance level.
The 1st support level is identified at 1.1192, characterized as a pullback support. If the price retreats, this level could provide a bounce back point. A further drop could lead the price towards the 2nd support level at 1.1079, also classified as pullback support. These support levels mark critical areas where buying interest may outstrip selling pressure, leading to a potential rise in price.
On the other hand, if the price continues its bullish trajectory, it could meet resistance at 1.1282, identified as an overlap resistance. If the price breaks this level, the next hurdle could be the 2nd resistance level at 1.1366. This level corresponds to the 161.80% Fibonacci extension, making it a significant potential turning point. These resistance levels might act as barriers to the price’s upward movement and could stimulate a selling response.
EUR/JPY:
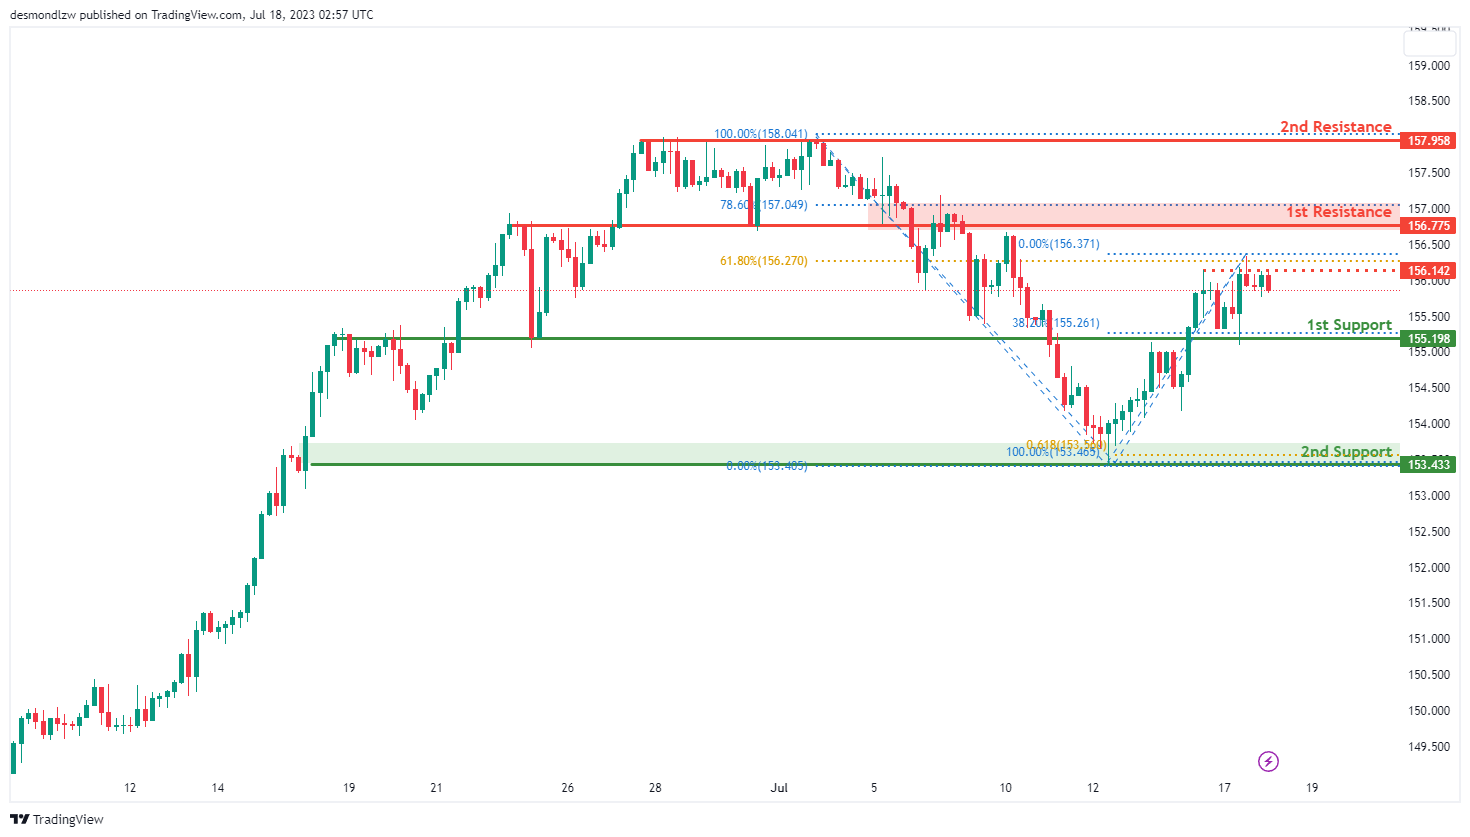
The EUR/JPY instrument is currently showing a bullish overall momentum. Based on the chart analysis, there is a potential for the price to drop further to the first support level in the short term before bouncing from there and rising towards the first resistance.
The first support level at 155.19 is considered good as it provides pullback support and coincides with the 38.20% Fibonacci retracement level. Additionally, the second support at 153.43 is identified as swing low support and aligns with the 61.80% Fibonacci projection level.
On the upside, the first resistance level at 156.77 is seen as an overlap resistance and corresponds to the 78.60% Fibonacci retracement level. The second resistance at 157.95 is identified as a multi-swing high resistance.
Furthermore, an intermediate resistance level at 156.14 is noteworthy as it aligns with the 61.80% Fibonacci retracement level.
EUR/GBP:
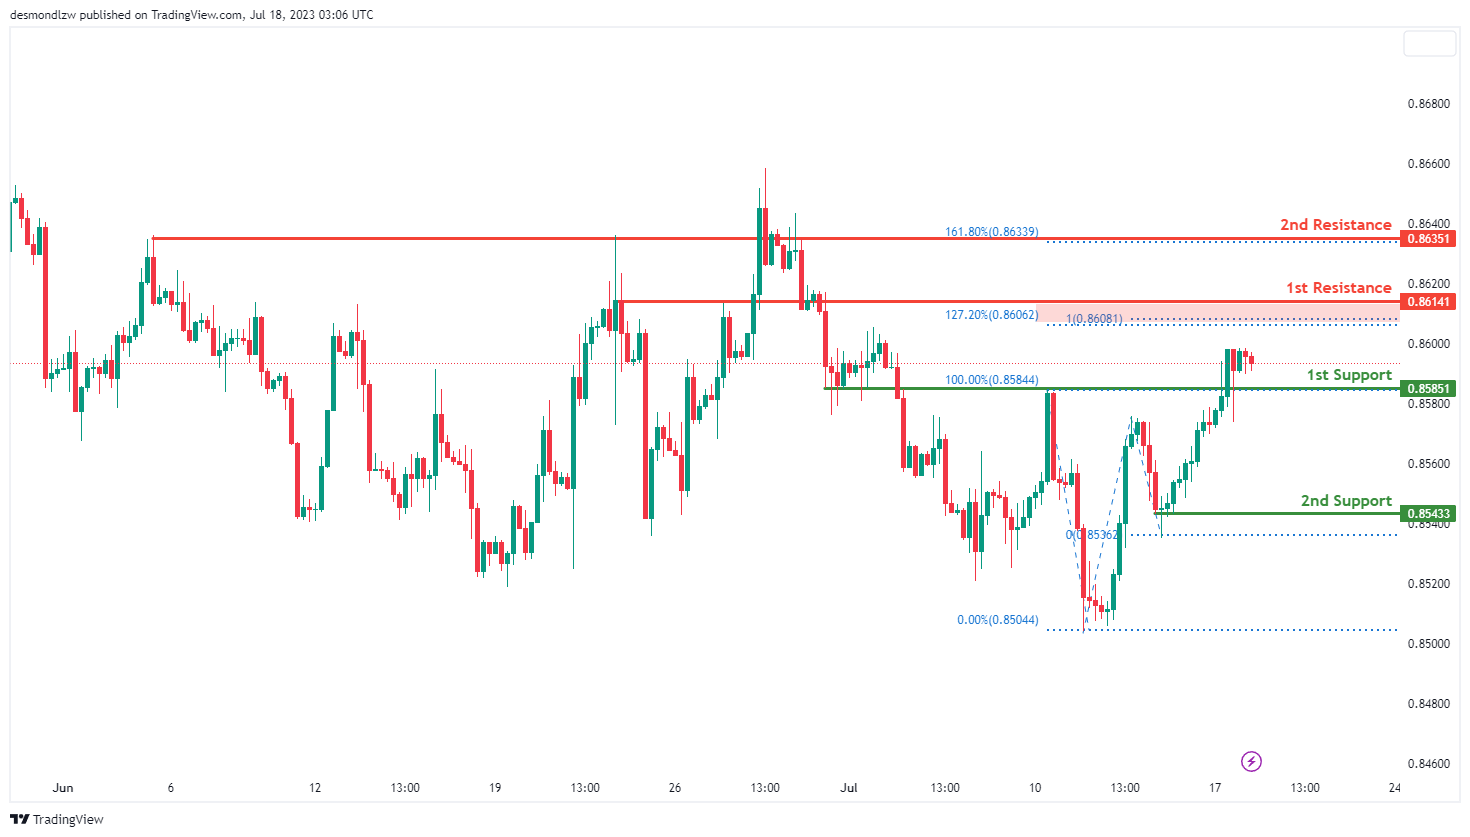
The EUR/GBP instrument is currently demonstrating a bullish overall momentum. Based on the chart analysis, there is a potential for the price to drop further to the first support level in the short term before bouncing from there and rising towards the first resistance.
The first support level at 0.8585 is considered good as it provides pullback support. Additionally, the second support at 0.8543 is identified as swing low support.
On the upside, the first resistance level at 0.8614 is seen as an overlap resistance, and it also aligns with the 127.20% Fibonacci extension and 100% Fibonacci projection levels. The second resistance at 0.8635 is identified as an overlap resistance.
GBP/USD:
The GBP/USD instrument currently exhibits a bullish momentum, implying that the price could continue its upward trajectory towards the 1st resistance level.
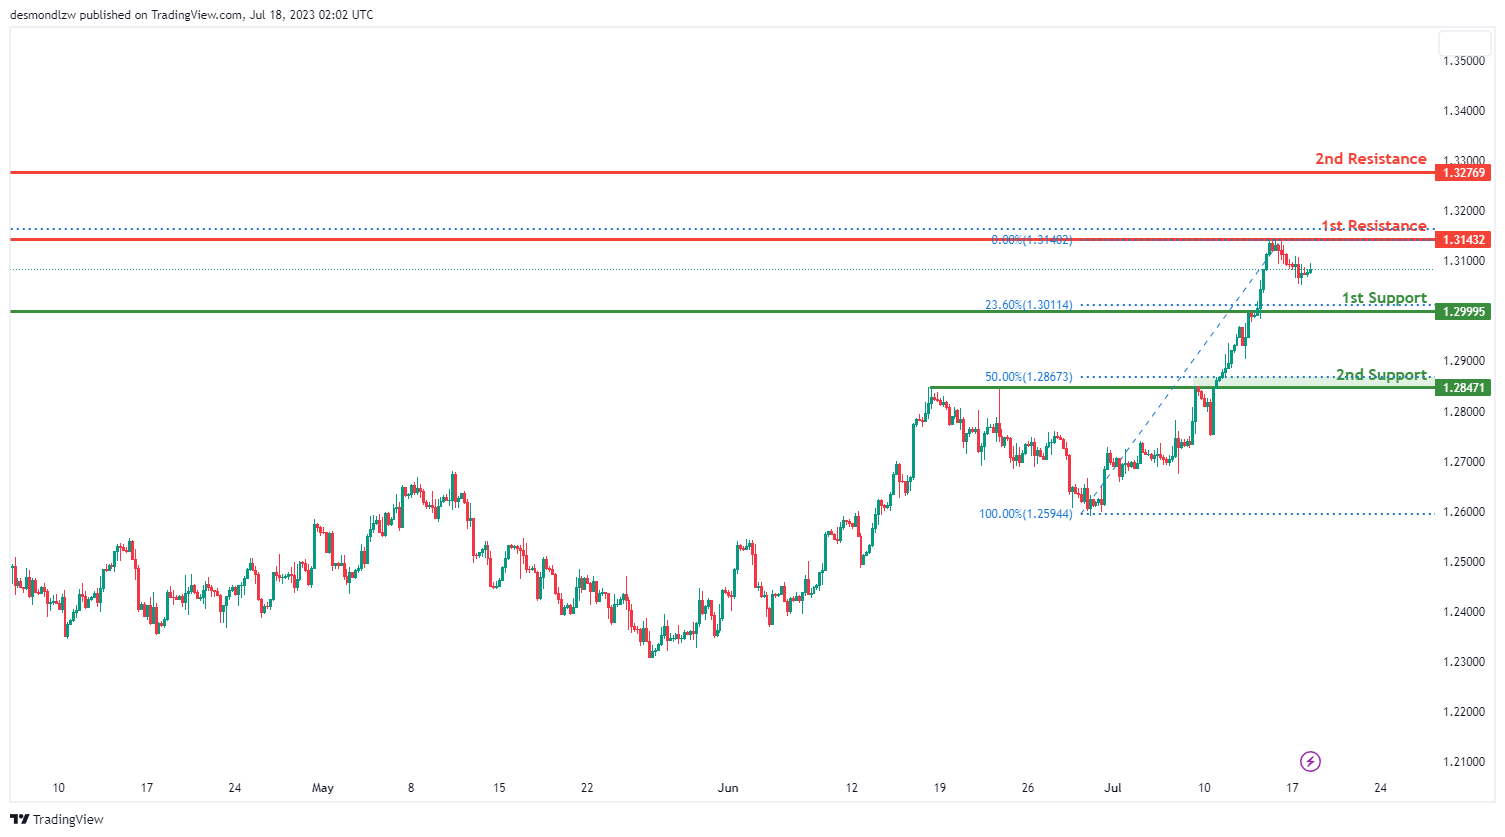
The 1st support level is situated at 1.2999, recognized as a pullback support and also aligns with the 23.60% Fibonacci retracement level. Should the price retreat, this level might provide a rebound point. A further decline could lead the price towards the 2nd support level at 1.2847, which is also considered as pullback support and matches with the 50% Fibonacci retracement level. These support zones are important areas where buying pressure may overpower selling pressure, potentially causing a price increase.
On the flip side, if the price continues its bullish run, it may encounter resistance at 1.3143, identified as a multi-swing high resistance. If the price surpasses this level, the next obstacle could be the 2nd resistance level at 1.3276, distinguished as an overlap resistance. These resistance levels could act as barriers to the price’s advancement and may trigger a selling reaction.
GBP/JPY:
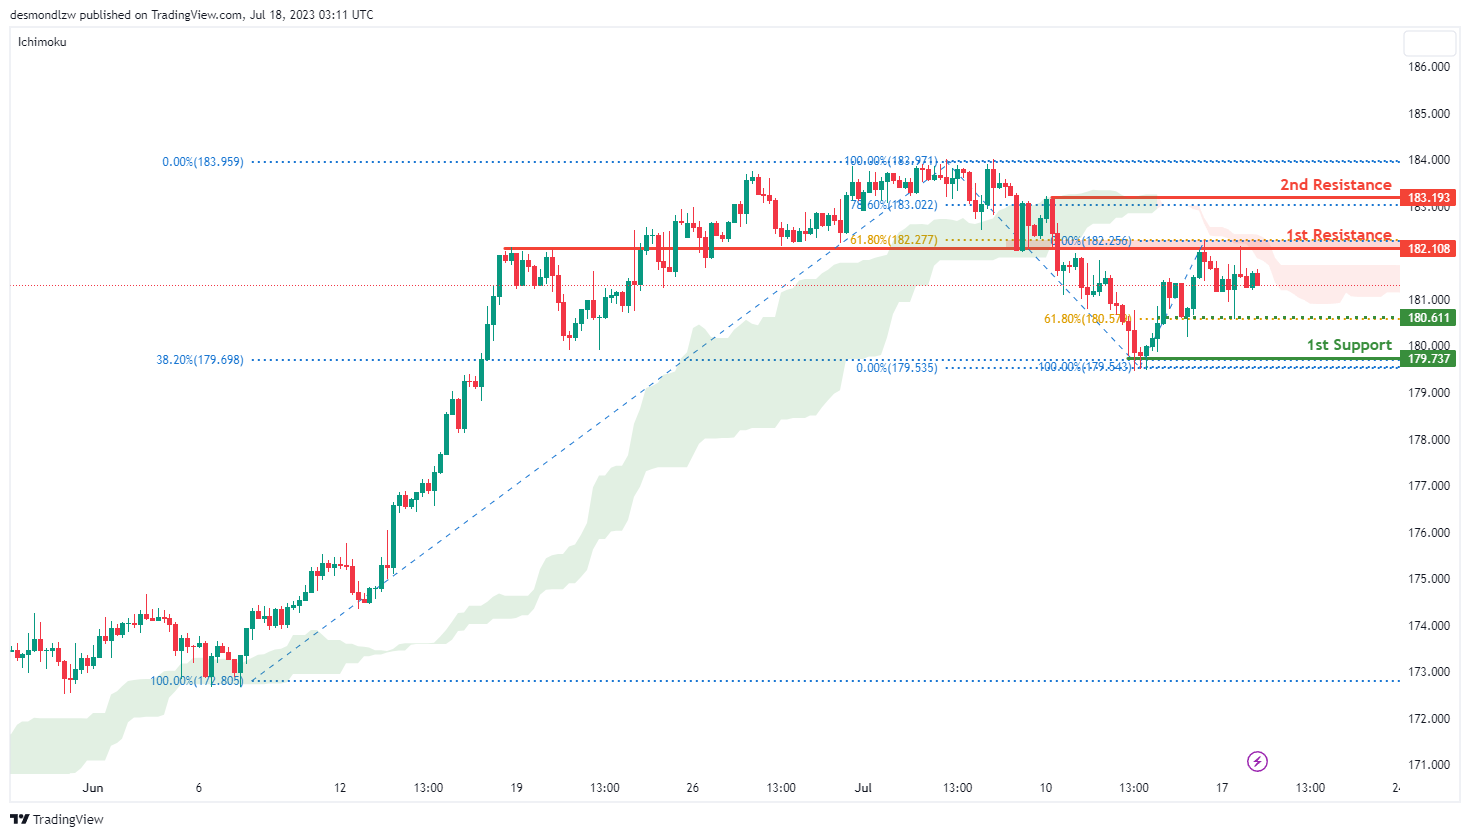
The GBP/JPY instrument is currently experiencing a bearish momentum, and one of the factors contributing to this momentum is that the price is below the bearish Ichimoku cloud. Based on the chart analysis, there is a potential for a bearish continuation towards the first support level.
The first support level at 179.73 is considered good as it provides pullback support and aligns with the 38.20% Fibonacci retracement level. Additionally, the intermediate support at 180.61 is identified as a level that corresponds to the 61.80% Fibonacci retracement.
On the upside, the first resistance level at 182.10 is seen as an overlap resistance and is associated with the 61.80% Fibonacci retracement. The second resistance at 183.19 is identified as a swing high resistance and corresponds to the 78.60% Fibonacci retracement.
USD/CHF:
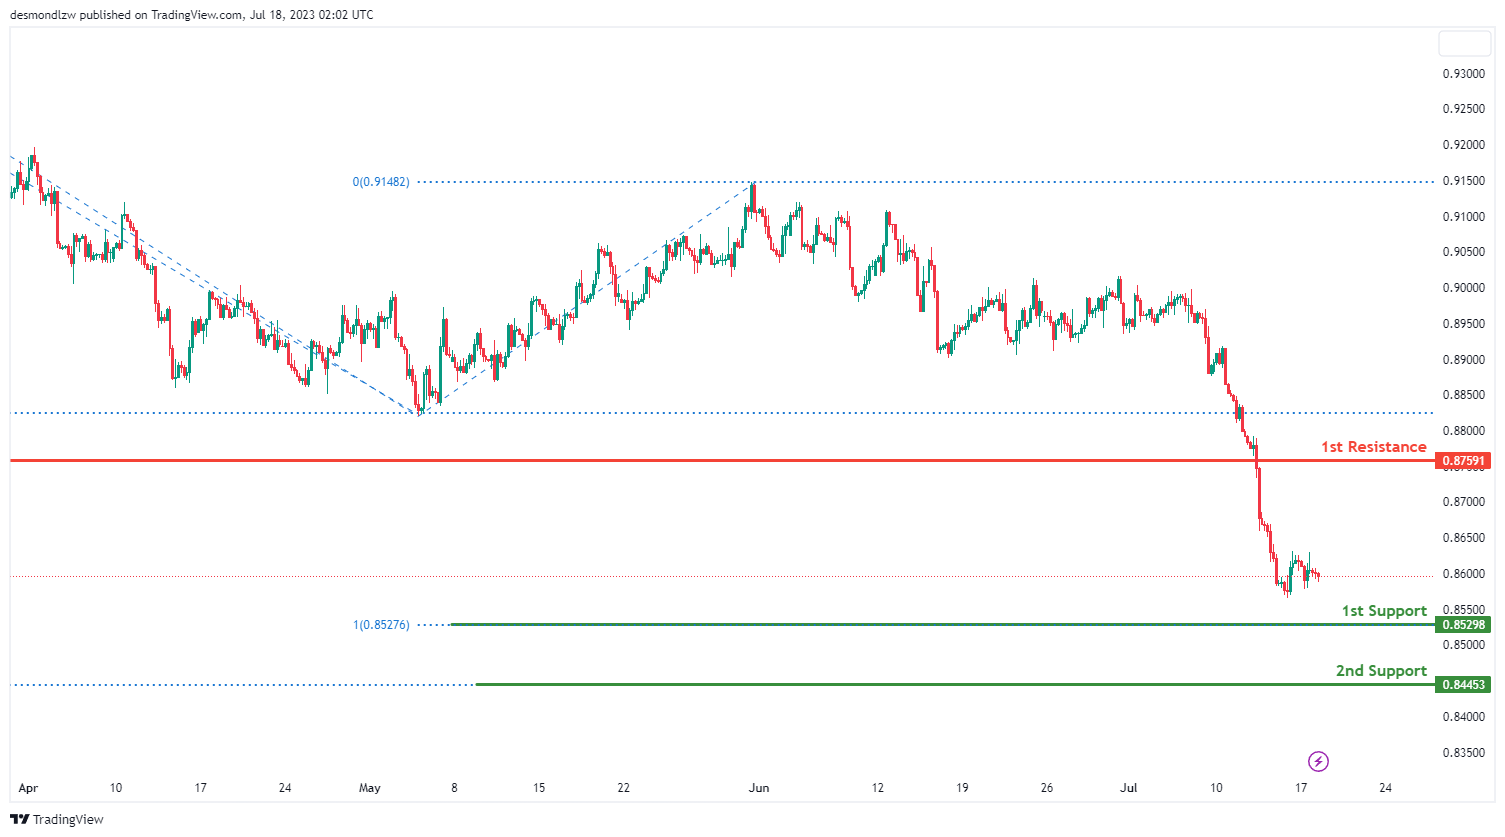
The USD/CHF instrument is currently exhibiting a bearish momentum, indicating that the price could potentially continue its downward movement towards the 1st support level.
The 1st support level is identified at 0.8529 and it aligns with the 100% Fibonacci projection, making it a significant level where the price might experience a bounce. Should this level fail to hold, the price could decline further to the 2nd support level at 0.8445, which corresponds to the -61.8% Fibonacci expansion level. These support levels are crucial areas where buying interest may surpass selling pressure, leading to a potential price increase.
Conversely, if the price reverses its course and starts to ascend, it could face resistance at 0.8759. This level, defined as a pullback resistance, might act as a barrier to the price’s advancement, possibly triggering a selling response. It’s important to closely monitor the price action at these critical levels for potential trading opportunities.
USD/JPY:
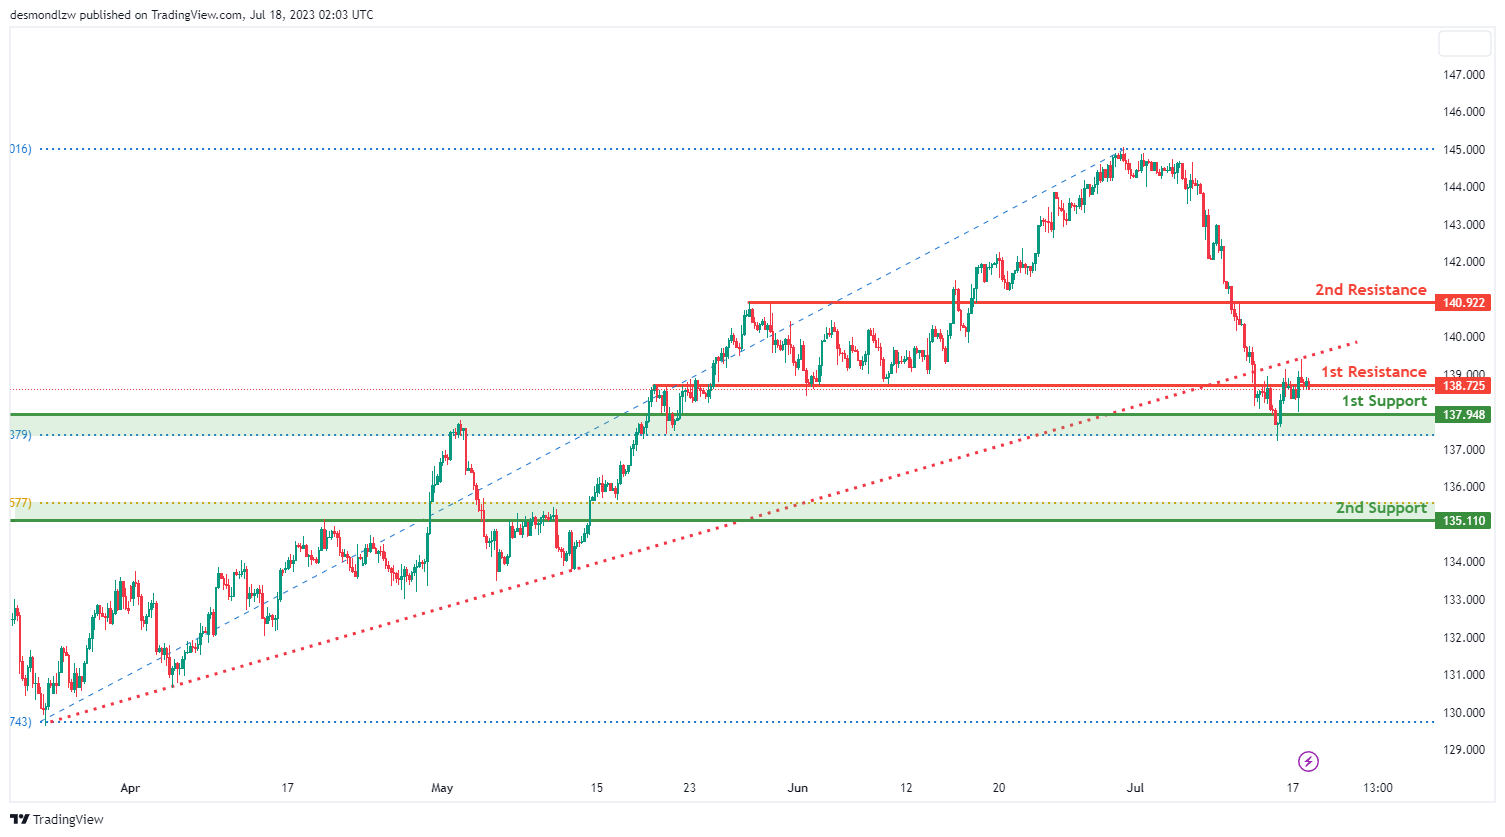
The USD/JPY currency pair currently demonstrates a bearish momentum after breaking below an ascending support line, which could potentially trigger further bearish movement. This suggests that the price could continue its downward trajectory towards the 1st support level.
The 1st support level is at 137.94 and is identified as an overlap support, coinciding with the 50% Fibonacci projection. This creates a potentially significant zone where the price may experience a bounce. If this support level fails to hold, the price could further descend towards the 2nd support level at 135.11, which is another overlap support but this time coinciding with the 61.80% Fibonacci retracement. These support levels are critical areas where buying pressure might exceed selling pressure, leading to a potential upturn in the price.
On the flip side, if the price starts to rise, it could face resistance at 138.72, identified as an overlap resistance. Further upwards, the 2nd resistance level stands at 140.92, also recognized as an overlap resistance. These resistance levels may act as barriers where the price could meet a selling response, potentially halting its upward movement
USD/CAD:
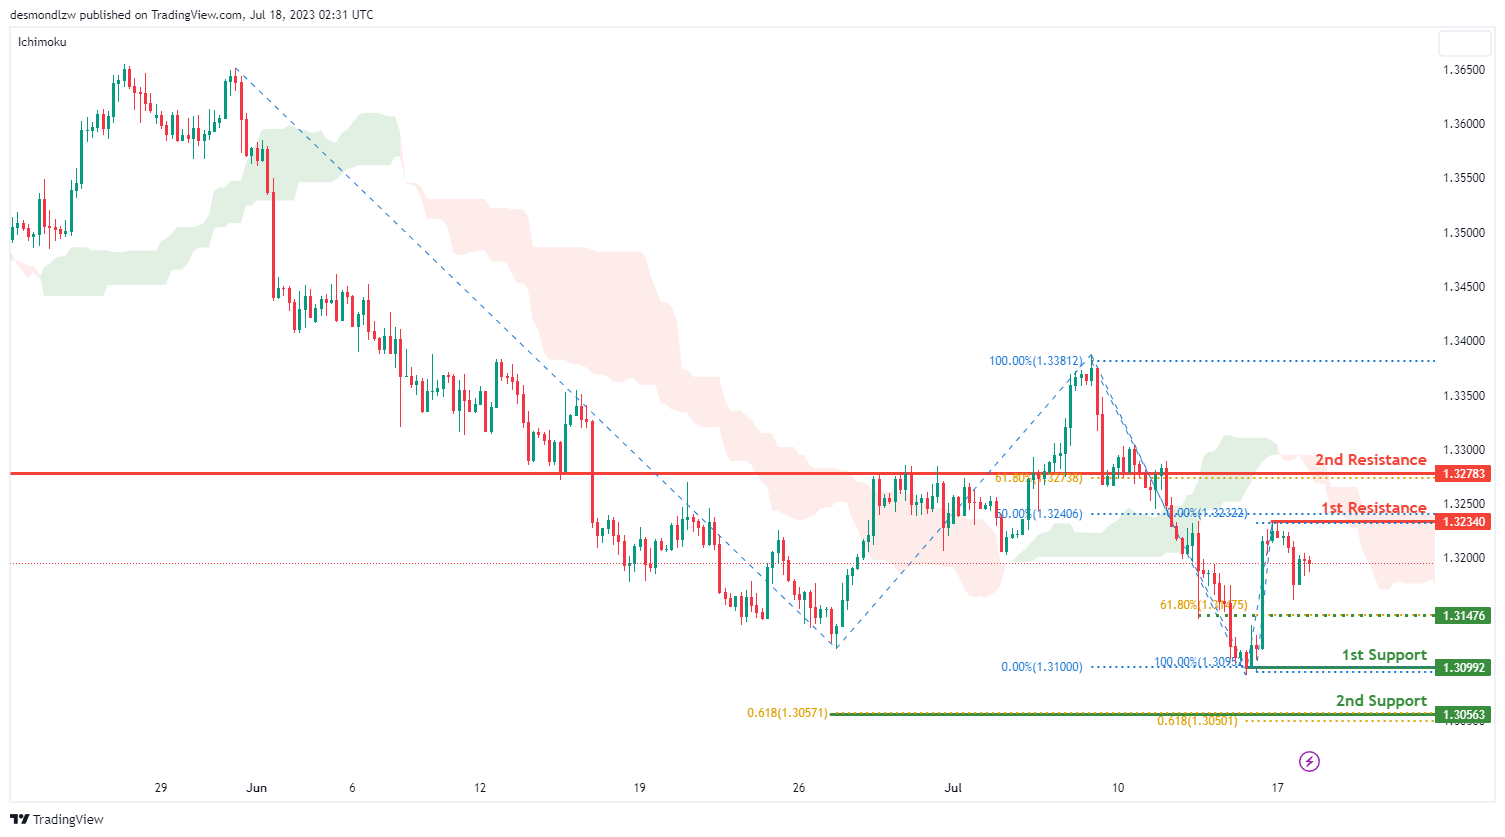
USD/CAD is currently showing a bearish momentum as the price is below the bearish Ichimoku cloud. This indicates that the price could potentially continue its bearish momentum towards the 1st support level.
The 1st support level is at 1.3099, identified as a swing low support level. In addition, there is also an intermediate support level at 1.3148 that coincides with the 61.8% Fibonacci retracement level. If the price goes beyond this point, the next level to watch would be the 2nd support at 1.3056, which is a pullback support level and also coincides with two Fibonacci projection levels at 61.80%. This indicates a strong Fibonacci confluence which might work as a strong barrier against further price decline.
On the other hand, if the price reverses its bearish course, it could face resistance at 1.3234, identified as a swing-high resistance level and also coinciding with the 50% Fibonacci retracement level. A further bullish move may encounter the 2nd resistance level at 1.3278, an overlap resistance which aligns with the 61.80% Fibonacci retracement level. These resistance levels could potentially hinder further price progress and trigger a selling response.
AUD/USD:
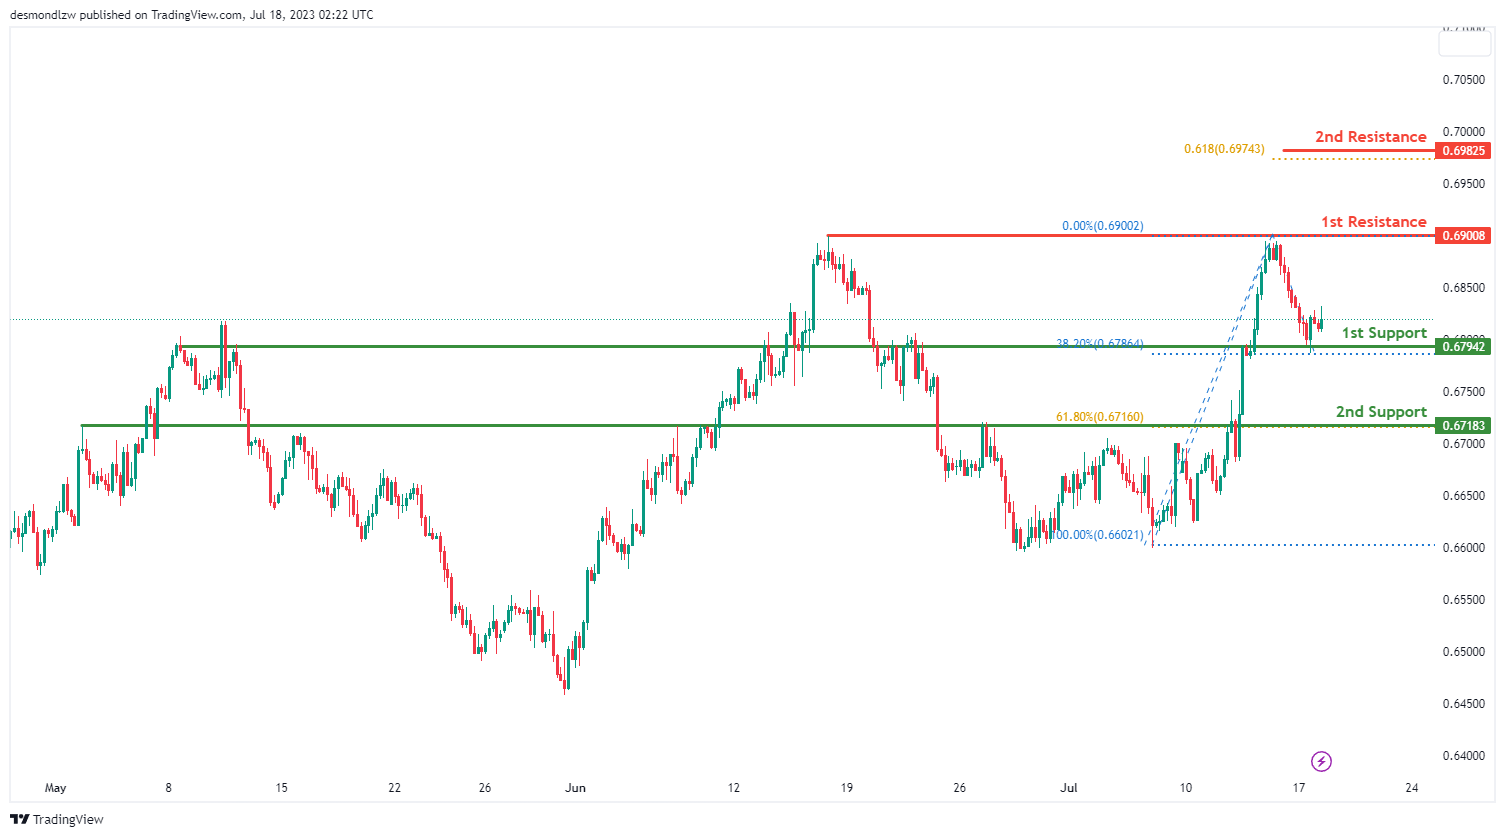
The AUD/USD pair currently shows bullish momentum. In this context, it could potentially make a bullish bounce off the 1st support level and head towards the 1st resistance level.
The 1st support level is located at 0.6794, recognized as an overlap support and coinciding with the 38.20% Fibonacci retracement level. If the price retreats to this level, it could find strong buying interest that could push it higher. Should the 1st support level fail to hold, the price might further decline towards the 2nd support level at 0.6718, which is identified as a pullback support and aligns with the 61.80% Fibonacci retracement level.
On the upside, the 1st resistance level is situated at 0.6900, defined as a multi-swing high resistance. This level might act as a hurdle where the price could face selling pressure. If the price successfully breaks this resistance, it could aim for the 2nd resistance level at 0.6982, also a significant level as per the 61.80% Fibonacci projection.
NZD/USD
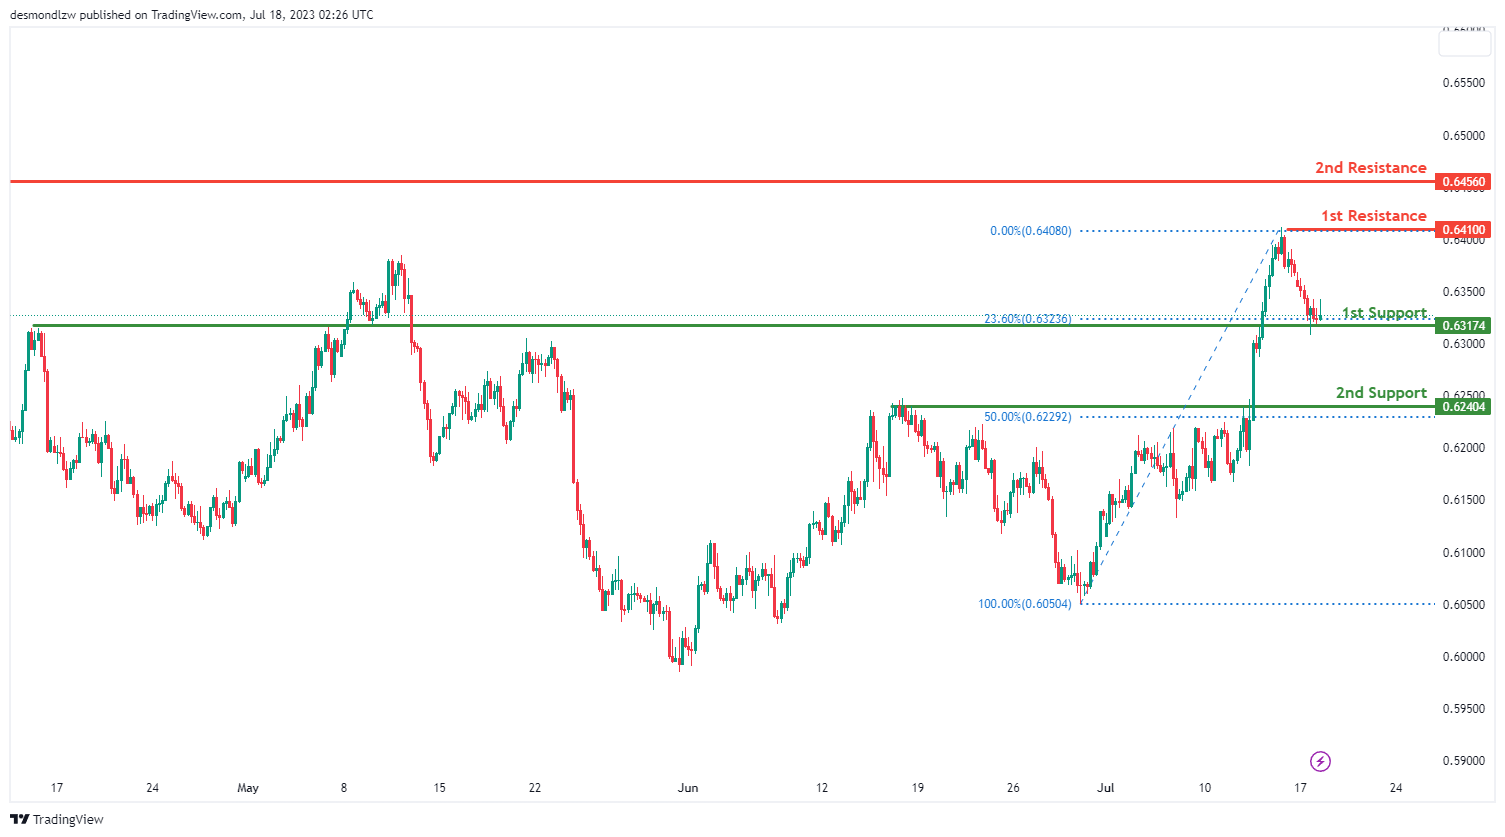
The NZD/USD pair is currently showcasing bullish momentum. Given this context, it could potentially make a bullish bounce off the 1st support level and proceed towards the 1st resistance level.
The 1st support level is at 0.6317, identified as an overlap support and coinciding with the 38.20% Fibonacci retracement level. If the price retraces to this level, it may encounter significant buying interest that could push it upwards. Should the 1st support fail to hold, the price may further decline towards the 2nd support level at 0.6240. This level is recognized as a pullback support and aligns with the 50% Fibonacci retracement level.
On the upside, the 1st resistance level stands at 0.6410, characterized by swing high resistance. This level might act as a hurdle, triggering some selling pressure. If the price successfully surmounts this resistance, it could then aim for the 2nd resistance level at 0.6456, known as a pullback resistance.
DJ30:
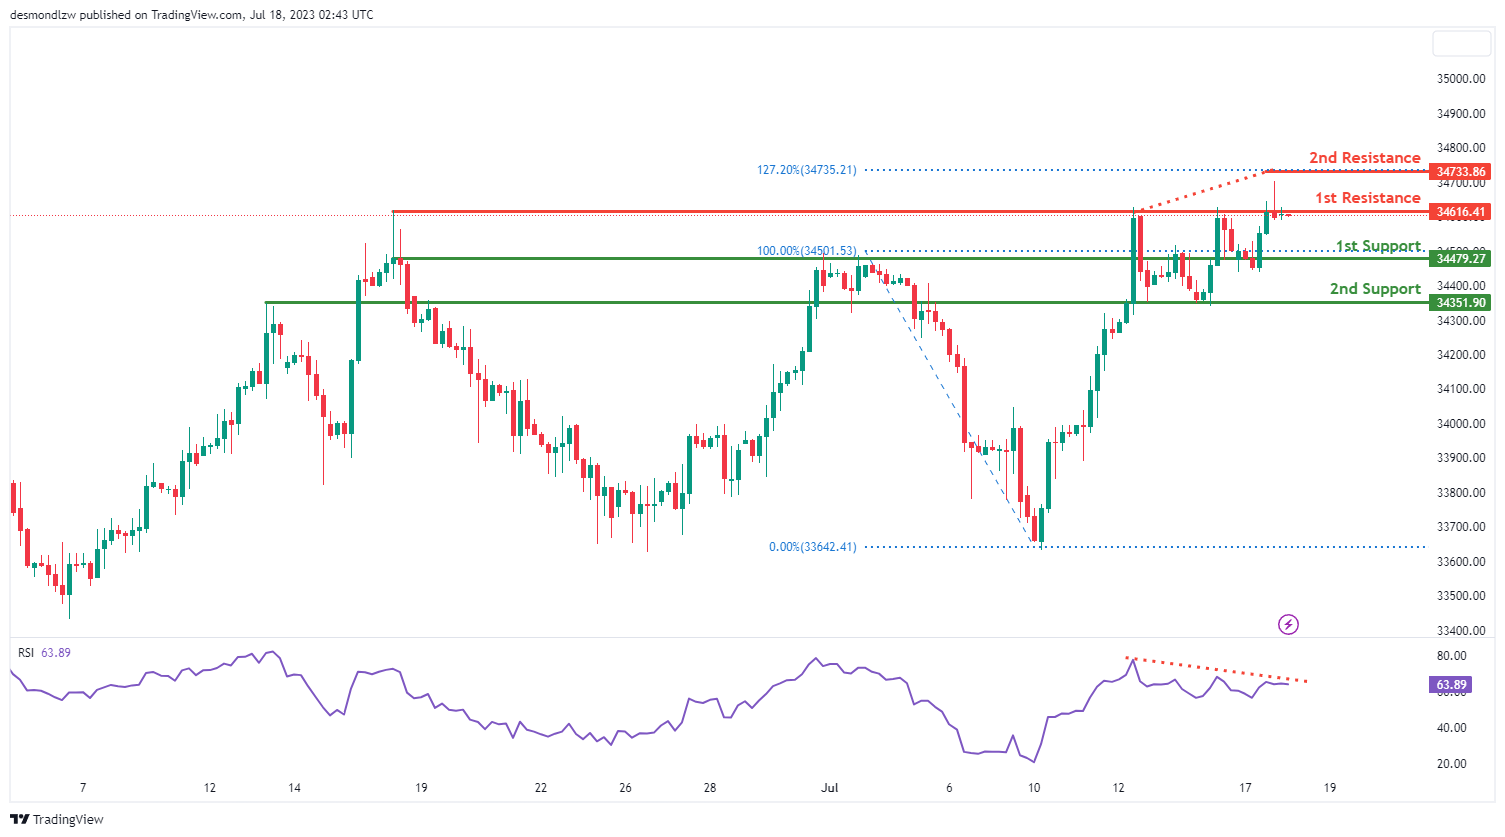
The DJ30, or Dow Jones Industrial Average, is currently experiencing a bearish momentum. Based on the chart analysis, there is a potential for a bearish reaction off the first resistance level, leading to a drop towards the first support level.
The first support level at 34479.27 is considered good as it provides pullback support and aligns with the 38.20% Fibonacci retracement level. The second support at 34351.90 is identified as an overlap support level.
On the upside, the first resistance level at 34616.41 is seen as a multi-swing high resistance. The second resistance at 34733.86 corresponds to the 127.20% Fibonacci extension level.
Additionally, the Relative Strength Index (RSI) is displaying bearish divergence versus price, suggesting that a reversal might occur soon.
GER30:
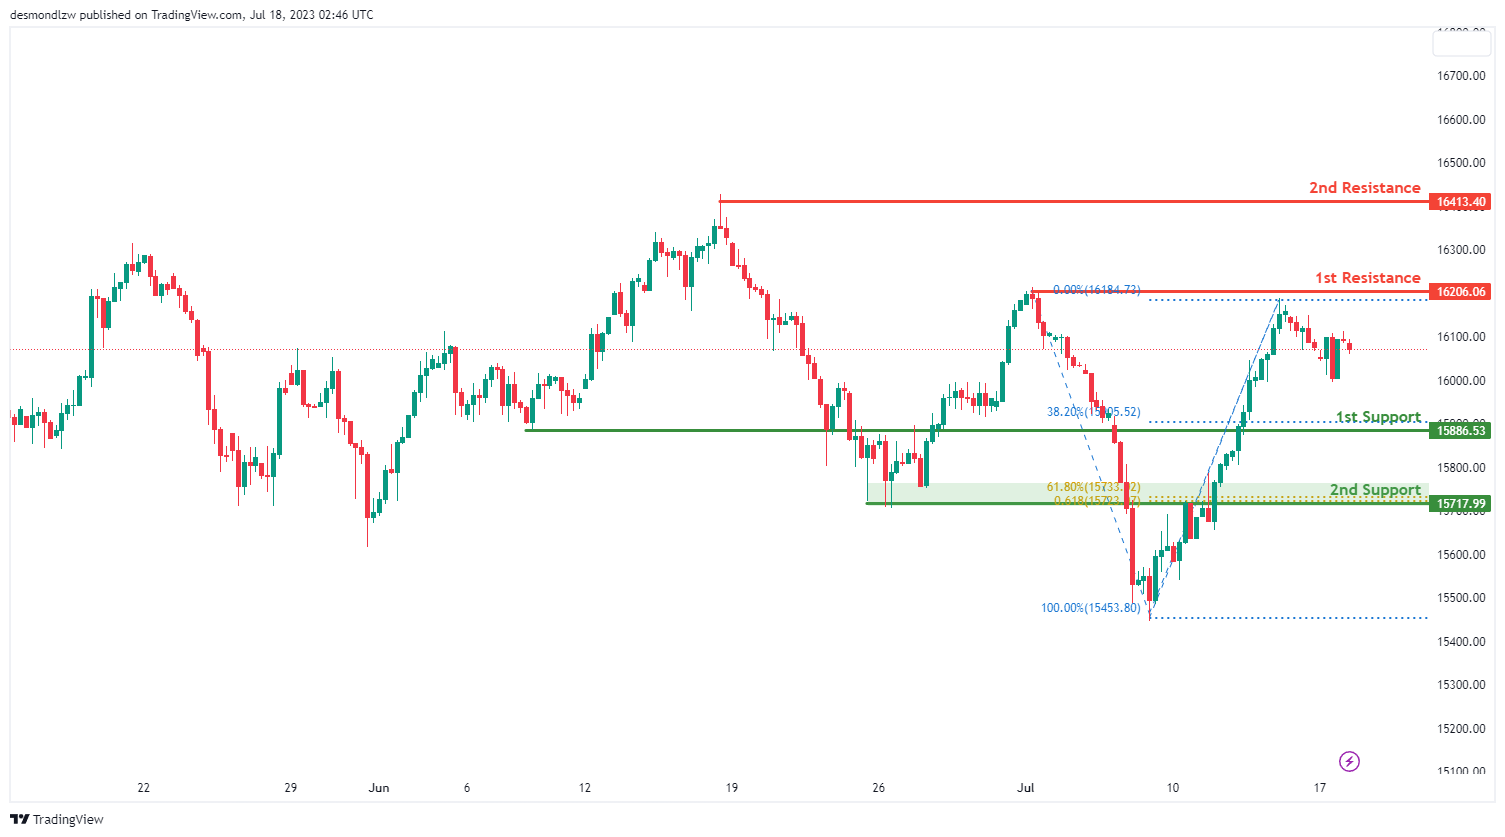
The GER30 (DAX) instrument is currently experiencing a neutral momentum, indicating a lack of clear directional bias in the chart.
Based on the analysis, there is a potential for price to fluctuate between the first resistance and first support levels.
The first support level at 15886.53 is considered good as it provides pullback support and aligns with the 38.20% Fibonacci retracement level. The second support at 15717.99 is identified as an overlap support, which also coincides with the 61.80% Fibonacci retracement and projection levels, indicating Fibonacci confluence.
On the upside, the first resistance level at 16206.06 is seen as a multi-swing high resistance. The second resistance at 16413.40 corresponds to a swing high resistance level.
US500
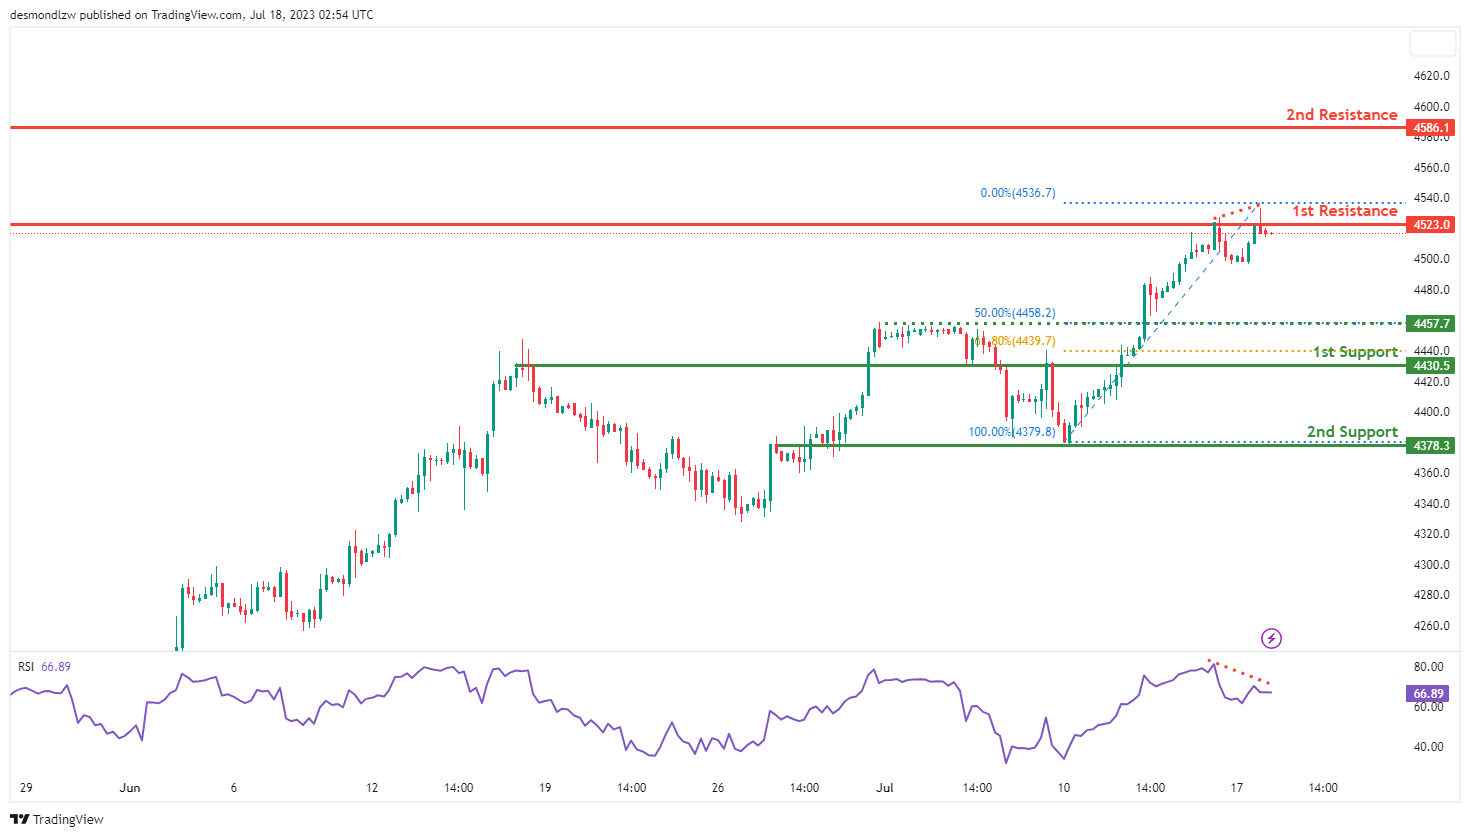
The US500 (S&P 500) instrument is currently experiencing a bearish momentum, indicating a downward bias in the chart.
Based on the analysis, there is a potential for price to have a bearish reaction off the first resistance level and drop towards the first support level. The first support level at 4430.5 is considered good as it aligns with an overlap support and coincides with the 61.80% Fibonacci retracement level. The second support at 4378.3 is identified as an overlap support.
On the upside, the first resistance level at 4523.0 is seen as a multi-swing high resistance. The second resistance at 4586.1 corresponds to a swing high resistance level.
Additionally, the RSI indicator is displaying bearish divergence versus price, suggesting that a reversal might occur soon. This could further support the bearish scenario.
BTC/USD:
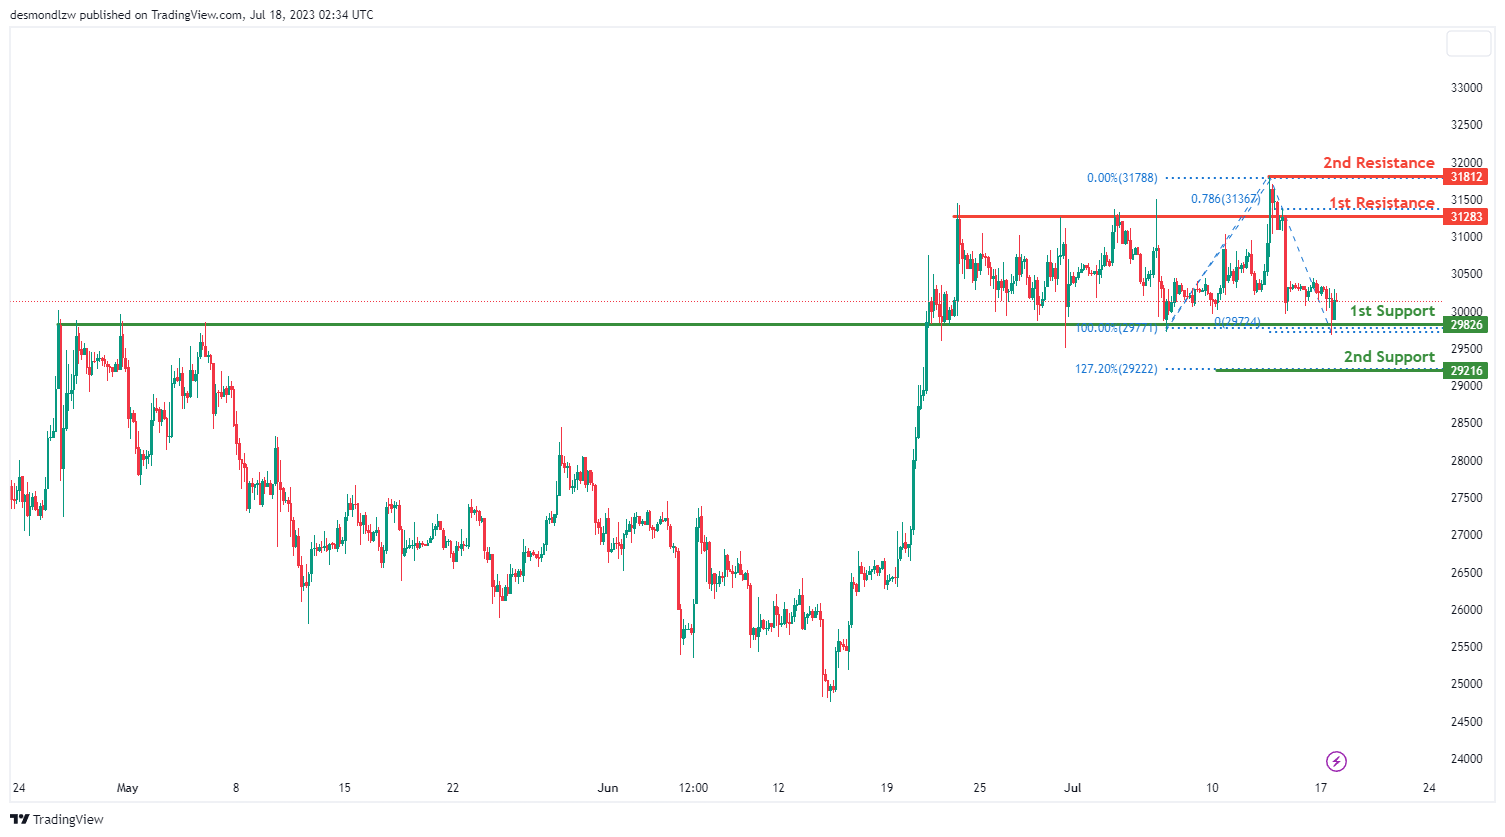
For the BTC/USD instrument, the overall momentum of the chart is currently neutral, which suggests that the price could potentially fluctuate between the 1st resistance and 1st support level.
The 1st support level is at 29826, identified by overlap support. If this support level fails to hold, the price could potentially drop to the 2nd support level at 29216, which is at the 127% Fibonacci retracement level. These support levels are critical areas where buying interest could outweigh selling pressure and lead to a price rebound.
On the other hand, if the price starts to rise, it could face resistance at 31283. This level is identified as an overlap resistance and a 78.6% Fibonacci projection. Further above, the 2nd resistance level is at 31812, which is a swing high resistance level, could also act as a strong barrier for upward price movement and potentially trigger a selling response.
ETH/USD:
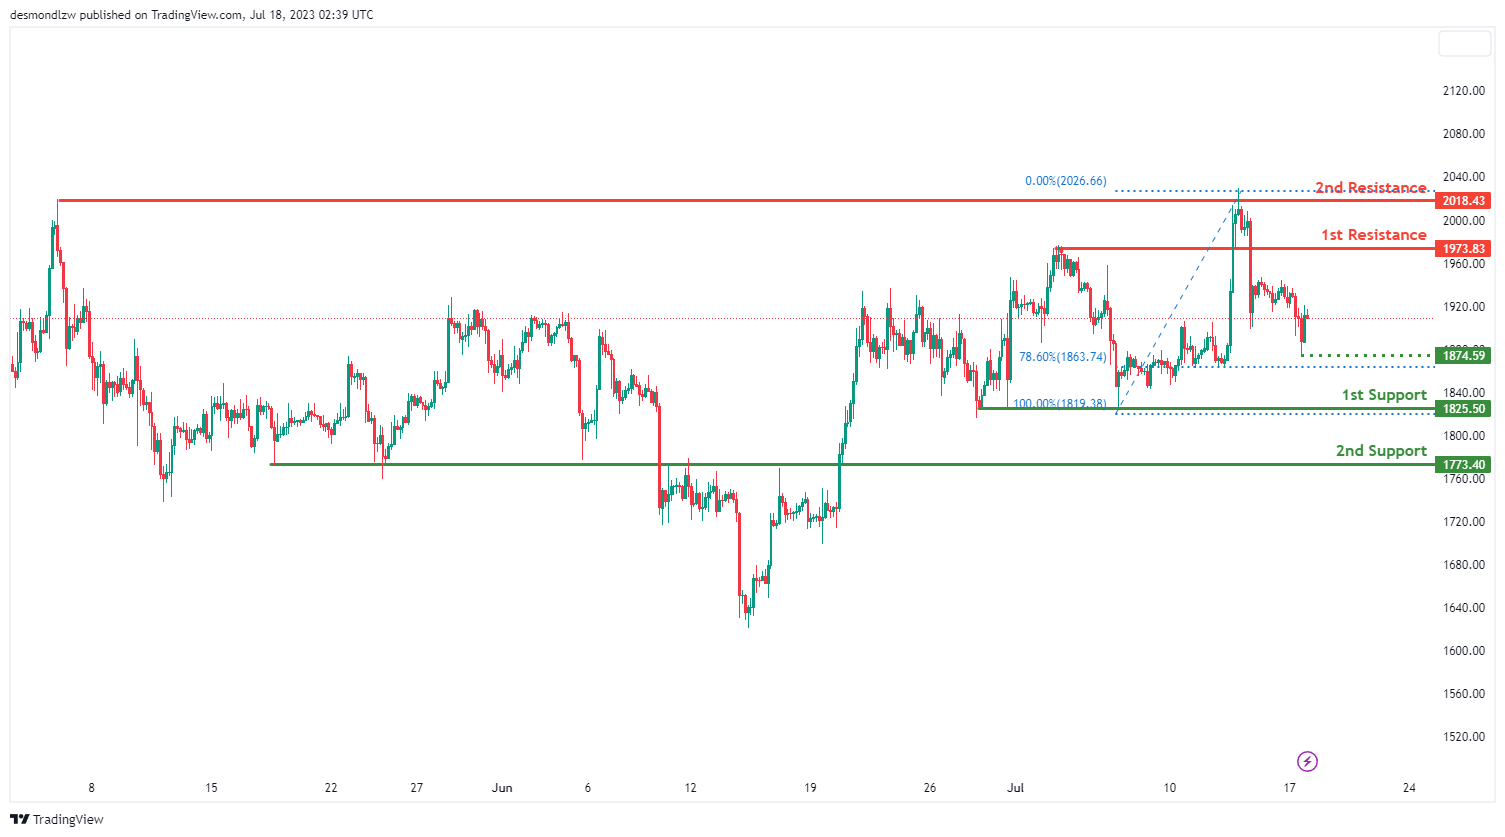
The ETH/USD instrument is currently exhibiting a neutral overall momentum. Based on the chart analysis, there is a potential for price to fluctuate between the first resistance and first support levels.
The first support level at 1825.50 is considered strong due to its status as a multi-swing low support. Additionally, the second support level at 1773.40 is identified as an overlap support.
On the other hand, the first resistance at 1973.83 is seen as an overlap resistance, indicating a potential barrier to further upward movement. The second resistance at 2018.43 is identified as a multi-swing high resistance.
There is also an intermediate support level at 1874.59, which is noteworthy as a swing low support and coincides with the 78.60% Fibonacci retracement level.
WTI/USD:
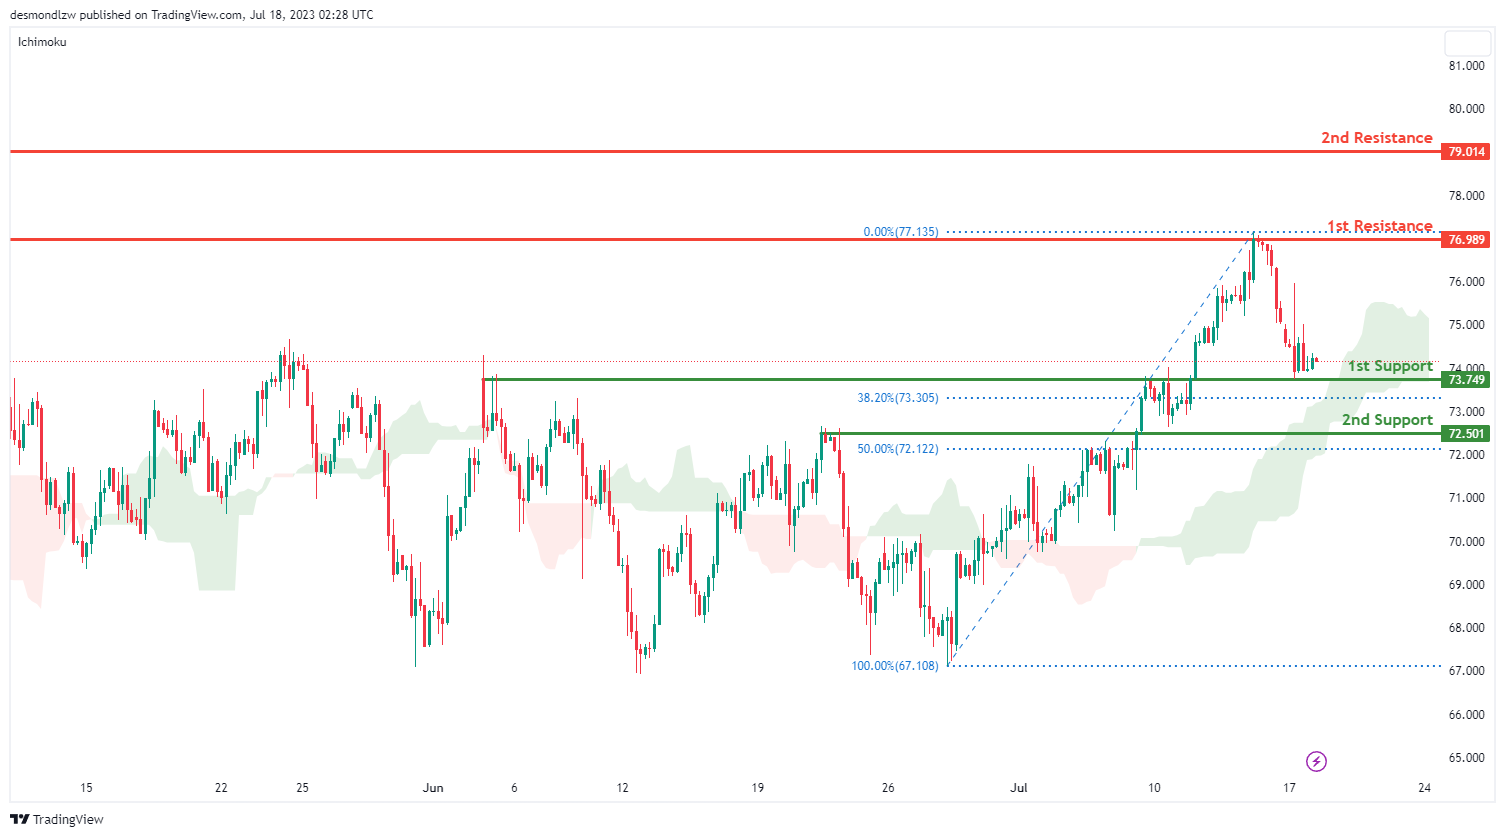
The WTI/USD pair is currently displaying a bullish momentum, despite being above the bullish Ichimoku cloud. In light of this, the price could potentially make a bullish bounce off the 1st support level and progress towards the 1st resistance level.
The 1st support level is situated at $73.75, recognized as an overlap support, and coincides with the 38.20% Fibonacci retracement level. If this level fails to hold the price, it could potentially decline towards the 2nd support level at $72.50. This level is also noted as an overlap support, and it aligns with the 50% Fibonacci retracement level.
On the flip side, if the price maintains its bullish trajectory, it could encounter resistance at $76.99. This level is marked as overlap resistance and could act as a barrier to the price’s upward progression. If the price manages to breach this resistance, it could then aim for the 2nd resistance level at $79.01, which is similarly recognized as overlap resistance.
XAU/USD (GOLD):
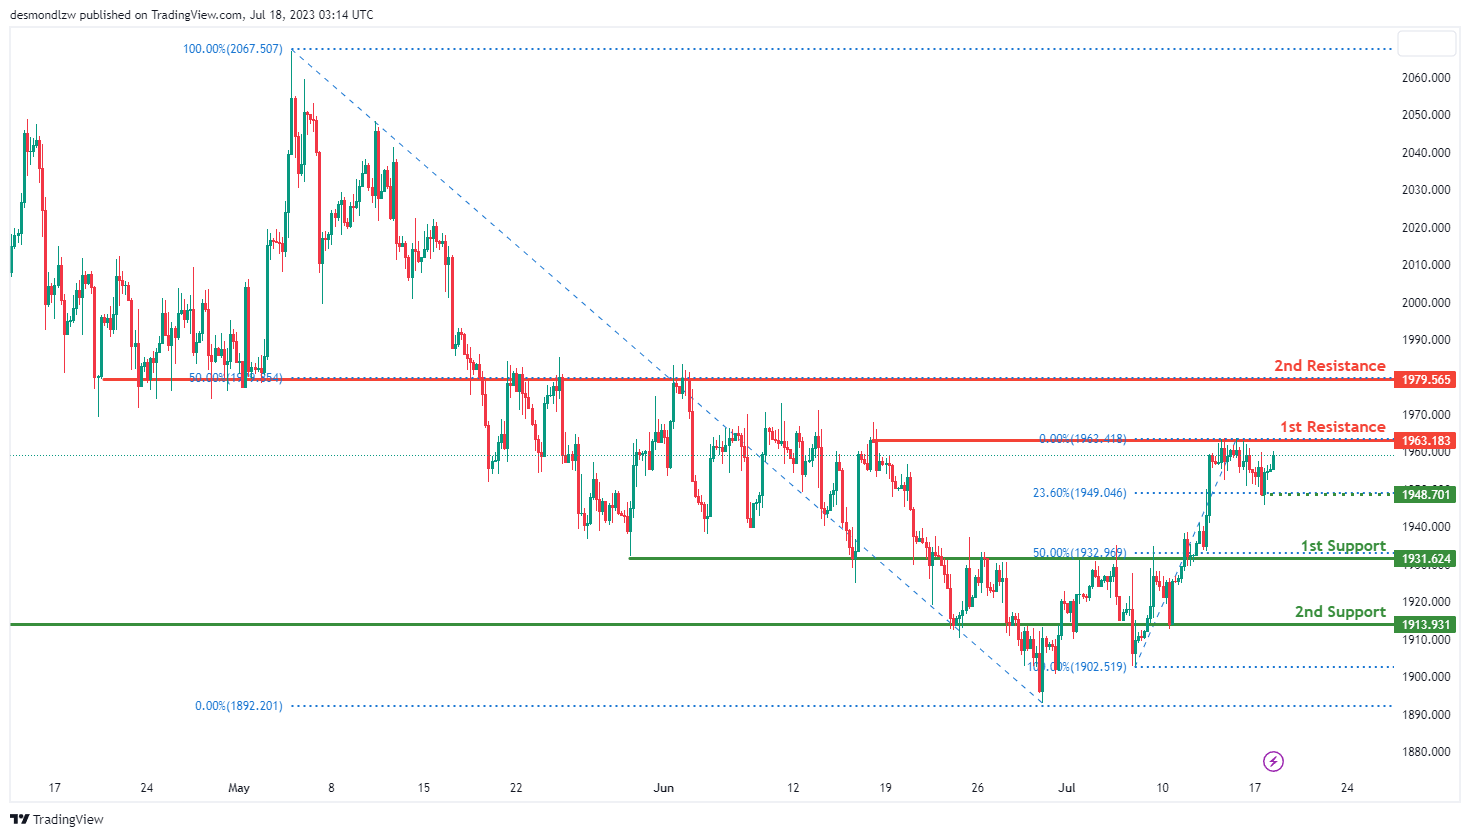
The XAU/USD pair, also known as gold, is currently showing neutral momentum, which indicates the price could potentially fluctuate between the 1st resistance and 1st support level.
The 1st support level is identified at 1931.62, known as an overlap support and aligning with the 50% Fibonacci projection level. This could be a level at which buying interest may potentially outweigh selling interest, leading to a possible price rebound. If the price breaks this level, it could drop further to the 2nd support level at 1913.93, also identified as an overlap support.
On the upside, the 1st resistance level is positioned at 1963.18, a level defined by the multi-swing high resistance. If the price manages to break this resistance, it could climb towards the 2nd resistance level at 1979.56, which is known as an overlap resistance. These resistance levels may act as barriers where the price could meet selling interest.
In between these levels, there’s an intermediate support level at 1948.70, recognized as a pullback support and coinciding with the 23.60% Fibonacci retracement.
AUD/USD Technical: Short-Term Potential Bullish Revival
- Cleared above 200-day moving average ex-post US CPI.
- Short-term uptrend but the medium-term trend is still sideways as it remained below a major descending trendline resistance at 0.6930.
- Short-term momentum, hourly RSI has turned bullish.
This is a follow-up analysis of our prior report, “AUD/USD Technical: Bulls rejected at 20 and 200-day moving averages ahead of US CPI” published on 12 July 2023.
Above the 200-day moving average but still below a major descending trendline resistance
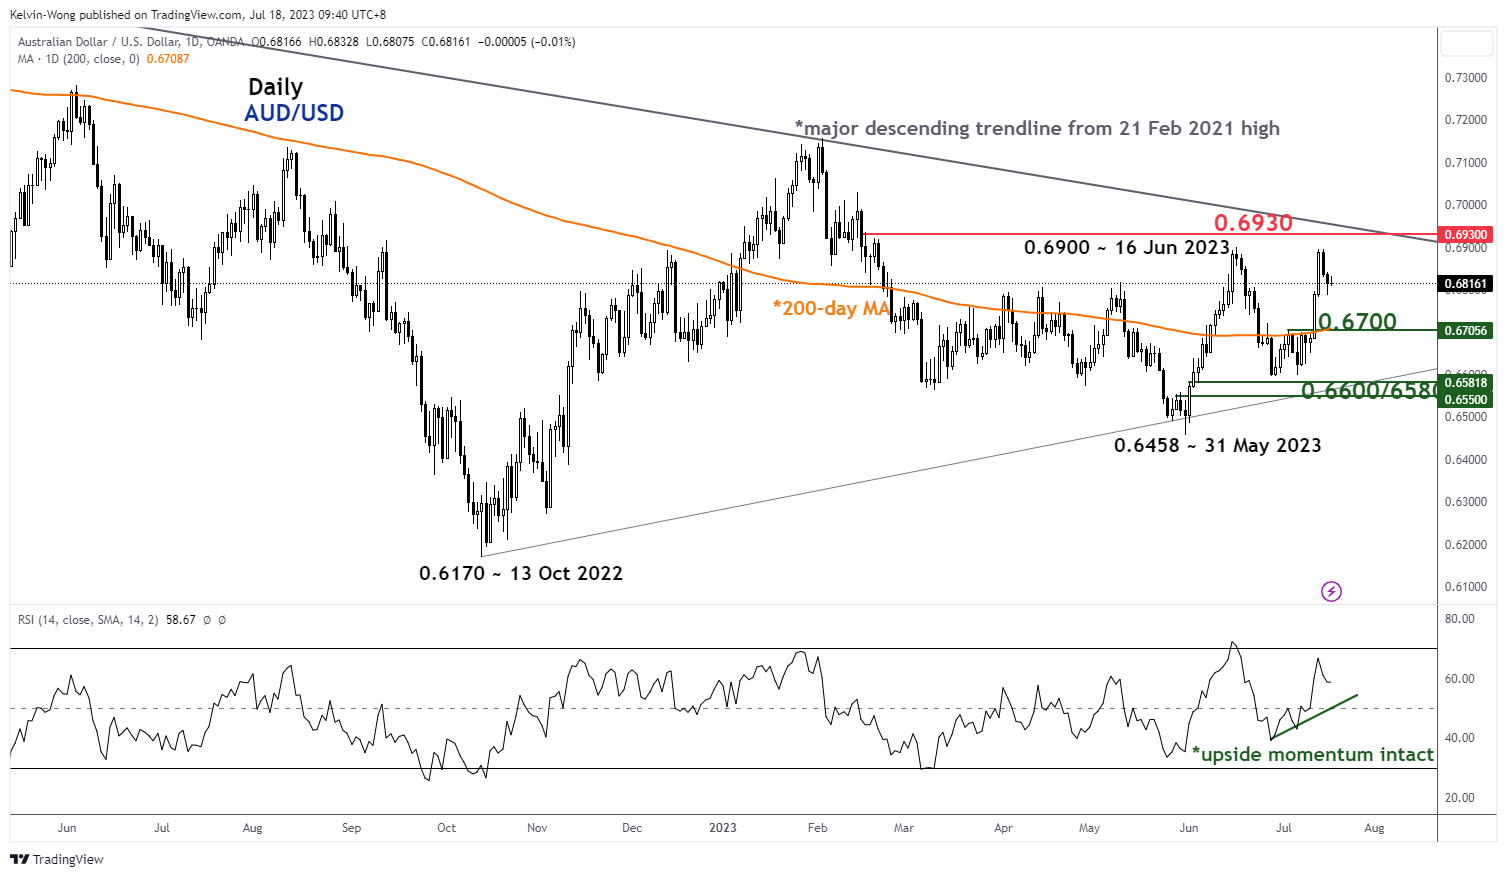
Fig 1: AUD/USD medium-term trend as of 18 Jul 2023 (Source: TradingView, click to enlarge chart)
The AUD/USD has staged the bullish breakout above the 200-day moving average ex-post US CPI data release, rallied by 190 pips from the breakout point triggered last Wednesday, 12 July to last Friday, 14 July intraday high of 0.6895.
Overall, the bigger picture major trend of the AUD/USD is still considered sideways as its current rally above the 200-day moving average is still capped by a major descending trendline in place since the 21 February 2021 high now acting as resistance at 0.6930 (see daily chart).
Short-term minor uptrend intact
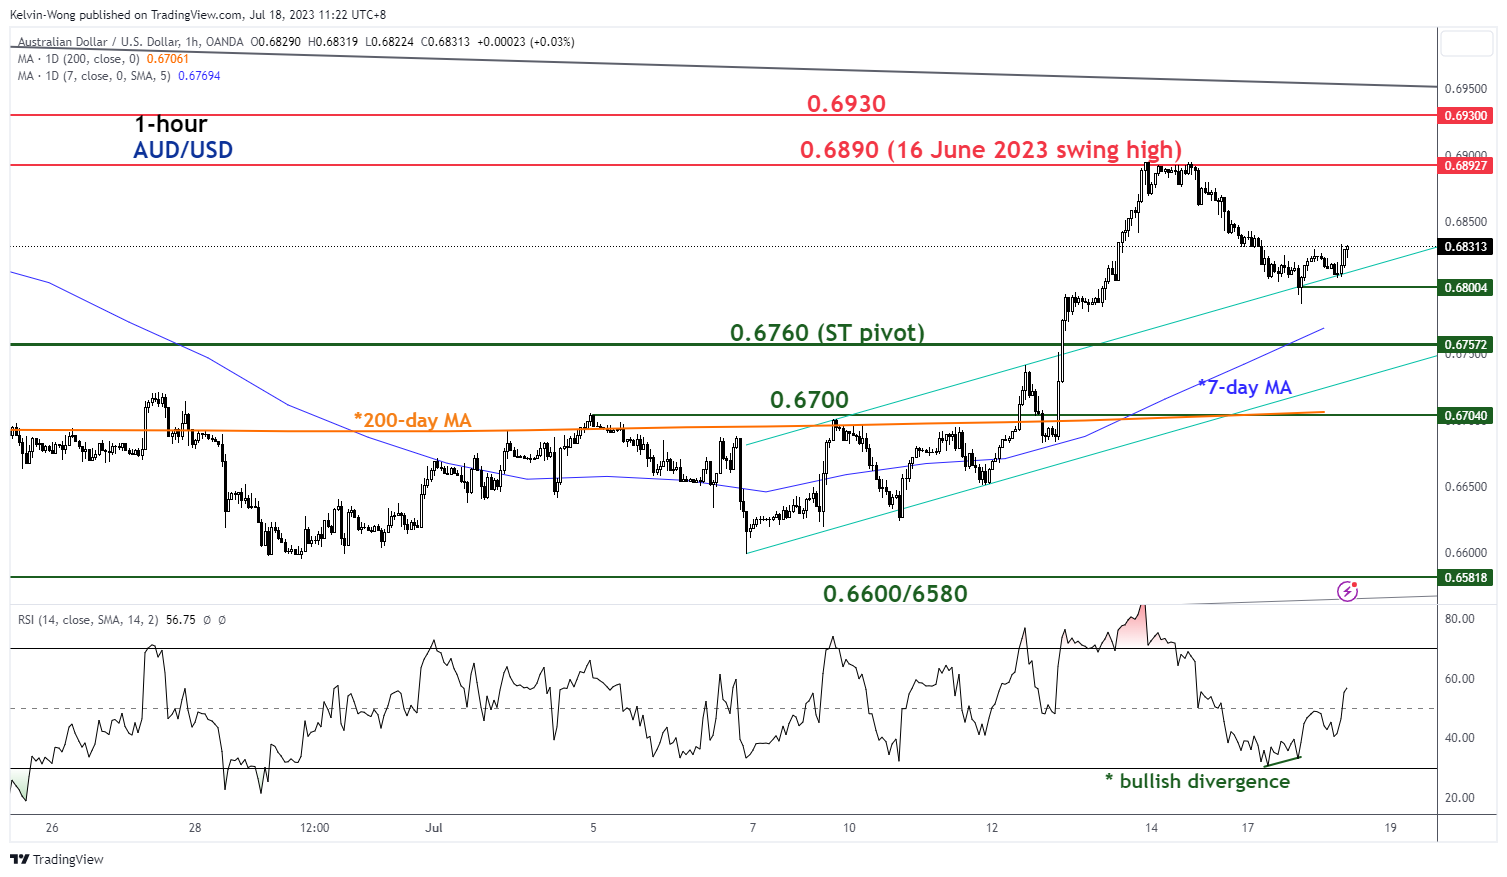
Fig 2: AUD/USD minor short-term trend as of 18 Jul 2023 (Source: TradingView, click to enlarge chart)
The AUD/USD has started to pull back from last Friday, 14 July high, and shed -107 pips to print an intraday low of 0.6787 yesterday, 17 July early US session.
Current key elements now suggest that the price actions of AUD/USD may resume the impulsive up move of its ongoing short-term minor uptrend in place since the 29 June 2023 low of 0.6595.
Today’s price actions have formed a “higher low” right after a retest on its former minor ascending channel resistance now turns intermediate pull-back support at around 0.6800 (see 1-hour chart).
Prior to the formation of the “higher low” in price actions, the hourly RSI has formed a bullish divergence signal near its oversold region which indicates that the downside momentum of the slide in price actions seen from last Friday, 14 July to yesterday, 17 July has waned.
Watch the 0.6760 key short-term pivotal support with the next resistances coming in at 0.6890 and 0.6930.
On the other hand, a break below 0.6760 negates the bullish tone to expose the next support at 0.6700 (also the 200-day moving average).
USD/CHF Daily Outlook
Daily Pivots: (S1) 0.8578; (P) 0.8604; (R1) 0.8629; More...
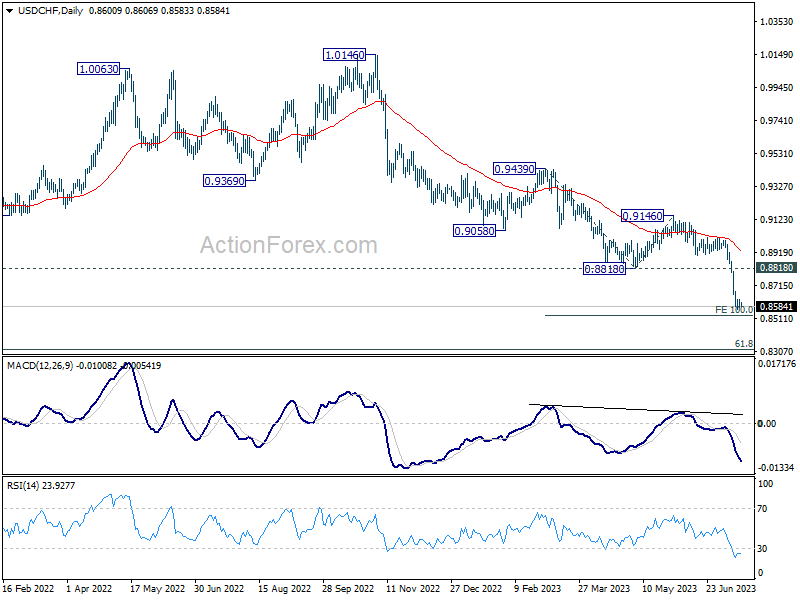
Intraday bias in USD/CHF remains neutral for the moment. Consolidation from 0.8564 could extend, but upside of recovery should be limited below 0.8818 support turned resistance to bring another fall. On the downside, break of 0.8564 will resume larger down trend from 1.0146 and target 100% projection of 0.9439 to 0.8818 from 0.9146 at 0.8525 next.
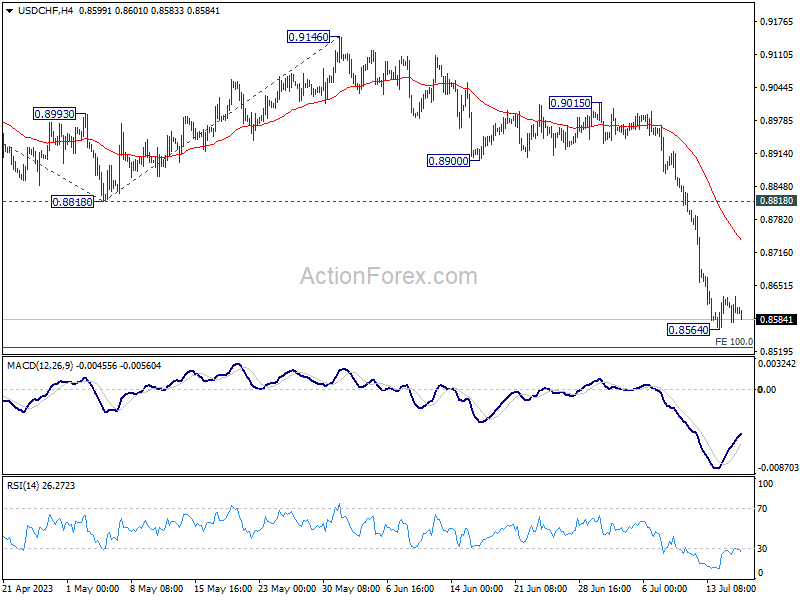
In the bigger picture, the break of 0.8756 (2021 low) indicates break out from the long term range pattern. For now, medium term outlook will stay bearish as long as 0.9146 resistance holds. Further fall would be seen to 61.8% retracement of 0.7065 (2011 low) to 1.0342 (2016 high) at 0.8317 next.
Markets in Waiting Mode ahead of Canada CPI and US Retail Sales, Eyes on USD/CAD
Asian markets presented a subdued trading environment today, despite overnight rallies in their US counterparts. A notable exception is that Hong Kong's stock market underwent a significant tumble, taking a step back after a day off. Elsewhere, indices generally hovered around flat levels within a tight range. In the realm of currencies, most major pairs and crosses stayed confined within Monday's narrow range. While Dollar, Yen, and Canadian dollar found themselves on the weaker side, Aussie and Kiwi are in stronger positions. European currencies showed mixed performance.
Particular attention is directed towards USD/CAD today, with release of Canada's CPI and US retail sales data on the horizon. Canada's headline inflation is anticipated to dip further to the top of BoC's 2-3% target range in June. However, BoC may be more interested in the monthly rise in core inflation, in order to gauge its persistent undercurrent. Other consumer spending and economic activity data will also carry substantial weight as the economy needs to cool off sufficiently to reduce core inflation. Today's data could evoke a complex response from Loonie.
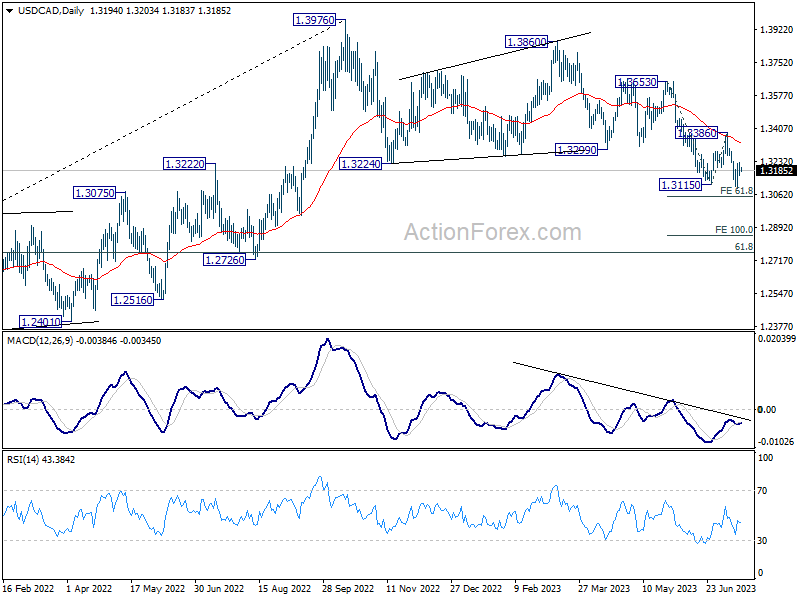
From a technical standpoint, USD/CAD's price actions from 1.3976 appear to be merely corrective. Ideally, the pair should bottom around the current level to round off the five-wave decline from 1.3860, as well as the three-wave pattern from 1.3976. Break of 1.3386 resistance would reinforce this outlook and retain medium-term bullishness. Conversely, decisive break of 61.8% projection of 1.3653 to 1.3115 from 1.3386 at 1.3054 might spark a faster descent and increase the probability of a larger bearish trend reversal. The next move, regardless of whether it is triggered by today's data or not, will be critical.
In Asia, at the time of writing, Nikkei is up 0.02%. Hong Kong HSI is down -2.17%. China Shanghai SSE is down -0.35%. Singapore Strait Times is down -0.17%. Japan 10-year JGB yield is down -0.0009 at 0.479. Overnight, DOW rose 0.22%. S&P 500 rose 0.39%. NASDAQ rose 0.93%. 10-year yield dropped -0.022 to 3.797.
Bundesbank Nagel: We have to be a little bit more patient
Bundesbank President and ECB Governing Council member, Joachim Nagel expects a 25 bps increase for the upcoming July meeting of ECB. As for the meeting in September, Nagel stated on Monday, "we will see what the data will tell us."
Unlike previous financial cycles, core inflation rates in developed nations are not declining as swiftly, implying a more drawn-out recovery process. Despite this, Nagel dismissed the notion of an over-tightened policy risking a hard landing for Europe as interest rates rise. "It's too early to really declare a certain kind of victory when it comes to our inflation fight," Nagel remarked.
Notably, the Bundesbank chief advised patience in the face of these challenges, acknowledging a potentially slower pace in transmission of monetary policy. "This time maybe we have to be a little bit more patient. The pace of the transmission channel is maybe not as fast as it was in the past," he added.
RBA Jul minutes: Hike considered, hold to reassess in Aug
Minutes from RBA's July 4th meeting reveal that two options were considered: raising cash rate by additional 25 bps, or keeping it unchanged. RBA eventually chose the latter, acknowledging the "uncertainty around the outlook and the significant increase in interest rates to date." Members agreed to "reassess the situation at the August meeting."
Despite maintaining status quo, RBA members acknowledged the possibility of future policy tightening. "Members agreed that some further tightening of monetary policy may be required to bring inflation back to target within a reasonable timeframe, but that this depended on how the economy and inflation evolve," the minutes read.
RBA's decision underscores the central bank's caution amid shifting economic conditions. With August meeting on the horizon, the Board anticipates additional data on inflation, the global economy, labor market, and household spending. This incoming information, combined with updated staff forecasts and a revised risk assessment, will guide the next policy decision.
Looking ahead
Canada CPI is a major focus today while IPPI and RMPI, as well as housing starts will be released. US retail sales will also be published, and industrial production, business inventories and NAHB housing index.
USD/CHF Daily Outlook
Daily Pivots: (S1) 0.8578; (P) 0.8604; (R1) 0.8629; More...
Intraday bias in USD/CHF remains neutral for the moment. Consolidation from 0.8564 could extend, but upside of recovery should be limited below 0.8818 support turned resistance to bring another fall. On the downside, break of 0.8564 will resume larger down trend from 1.0146 and target 100% projection of 0.9439 to 0.8818 from 0.9146 at 0.8525 next.
In the bigger picture, the break of 0.8756 (2021 low) indicates break out from the long term range pattern. For now, medium term outlook will stay bearish as long as 0.9146 resistance holds. Further fall would be seen to 61.8% retracement of 0.7065 (2011 low) to 1.0342 (2016 high) at 0.8317 next.
Economic Indicators Update
| GMT | Ccy | Events | Actual | Forecast | Previous | Revised |
|---|---|---|---|---|---|---|
| 01:30 | AUD | RBA Meeting Minutes | ||||
| 04:30 | JPY | Tertiary Industry Index M/M May | 1.2% | 0.40% | 1.20% | |
| 12:15 | CAD | Housing Starts Jun | 215K | 202K | ||
| 12:30 | CAD | CPI M/M Jun | 0.30% | 0.40% | ||
| 12:30 | CAD | CPI Y/Y Jun | 3.00% | 3.40% | ||
| 12:30 | CAD | CPI Core M/M Jun | 0.20% | |||
| 12:30 | CAD | CPI Median Y/Y Jun | 3.70% | 3.90% | ||
| 12:30 | CAD | CPI Trimmed Y/Y Jun | 3.60% | 3.80% | ||
| 12:30 | CAD | CPI Common Y/Y Jun | 5.00% | 5.20% | ||
| 12:30 | CAD | Industrial Product Price M/M Jun | -0.10% | -1% | ||
| 12:30 | CAD | Raw Material Price Index Jun | -0.20% | -4.90% | ||
| 12:30 | USD | Retail Sales M/M Jun | 0.50% | 0.30% | ||
| 12:30 | USD | Retail Sales ex Autos M/M Jun | 0.30% | 0.10% | ||
| 13:15 | USD | Industrial Production M/M Jun | 0.00% | -0.20% | ||
| 13:15 | USD | Capacity Utilization Jun | 79.50% | 79.60% | ||
| 14:00 | USD | Business Inventories May | 0.20% | 0.20% | ||
| 14:00 | USD | NAHB Housing Market Index Jul | 55 | 55 |
Minutes to RBA’s July Meeting Highlight Key Areas of Uncertainty
Stance of policy described as “clearly restrictive” and more prominence given to possible downside risks to growth but persistence of high inflation and tight labour market conditions still look to be the main factors shaping policy decisions in coming months.
At its July meeting the Reserve Bank Board considered two options for policy: to hold the cash rate steady or to increase it by 25bps. The minutes provide a detailed account of the arguments in favour of each of these options.
The case for a tightening is at its strongest when they point out that there is little spare capacity in the economy including in the labour market. Weak productivity and rising unit labour costs emphasise the risks to inflation associated with rising wages growth. This environment was assessed as being conducive to above average increases in prices and wages. The Board continues to highlight the stickiness of services inflation, both in Australia and offshore, and concerns that this development has extended tightening cycles in most countries. These arguments are consistent with the discussion around the decision to raise rates at the Board’s June meeting.
When central banks make decisions that are somewhat surprising they will always make a strong case to support that decision. These minutes are no exception with the case to hold rates steady strongly promoted. The current stance of monetary policy is described as “clearly restrictive”; a view backed by the inversion of the yield curve since April, which points to market expectations that rate hikes may have gone too far. Mortgage interest payments are estimated to be at record highs (9.4% of income) and are expected to increase further even if rates remain on hold – the full effect of policy tightening has yet to be felt.
In addition, the Board discusses downside prospects for their forecasts. An easing in labour market conditions might see current tightness ease more than expected while consumption may slow more sharply than implied in current forecasts. Under those circumstances, the unemployment rate would rise beyond the rate required to ensure inflation returns to target.
Despite this strong justification for rates remaining on hold in July, the Board still concludes that “some further tightening of monetary policy may be required” with that decision continuing to be contingent on how the economy and inflation evolve – data updates on inflation, the global economy, the labour market and household spending of particular importance alongside the full refresh of RBA staff forecasts due in August.
This increased prominence given to downside risks seems somewhat inconsistent with the data-flow since the June Board meeting – the March quarter national accounts in particular – but does again seem to emphasise the point that the case to justify a decision is always strengthened in the Board minutes.
As with last month, developments around inflation, employment, household spending, the housing market and global trends will be critical for the next decision in August. Westpac continues to expect that slow progress in reducing inflation, which is likely to be apparent in the June quarter inflation report, and ongoing tightness in the labour market, particularly as job vacancies remain historically elevated, will make the case for further tightening well justified. However, we cannot be unmoved by the strength of arguments put forward for the July decision to leave rates on hold, particularly new ones around the stance of policy, the shape of the yield curve and downside risks to the outlook. As such, we expect that, as with previous meetings, the August decision will again be balanced.
US Retail Sales May Not Come to the Dollar’s Rescue
The US Census Bureau will publish retail sales for June on Wednesday at 12:30 GMT. The data are a good proxy of consumer demand and will be worth dissecting as the July FOMC meeting is approaching. Still, the report alone may not have enough power to reverse last week’s freefall in the US dollar even if the forecasts are encouraging.
US retail sales to show stronger growth
Weaker-than-expected US CPI inflation figures barely affected rate hike expectations for this year but added more credence to the 2024 rate cut narrative, pulling the US dollar index below the 100 psychological mark last week and to the lowest level in 15 months.
Fed policymakers have already entered a blackout period ahead of next week’s FOMC policy meeting. Therefore, they cannot use public messaging to reshape rate cut expectations and save the greenback again. That leaves US retail sales the only potential market-mover in town along with initial weekly jobless claims and monthly housing data.
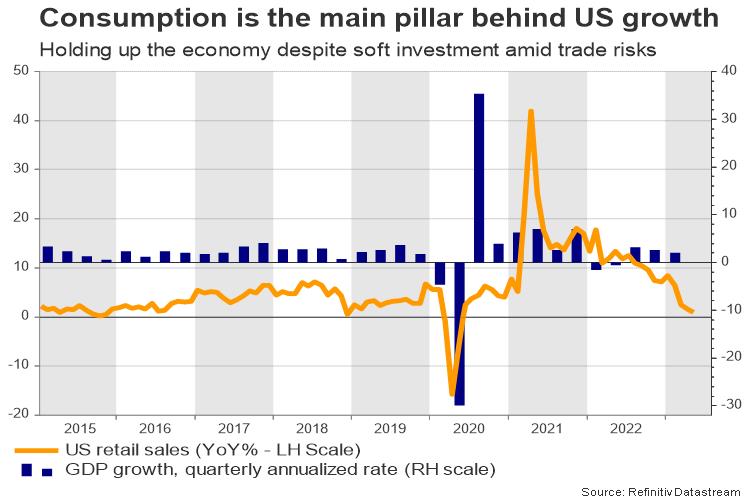
Analysts estimate a slight acceleration to 0.5% month-on-month from 0.3% before. If materialized, that would be the second fastest growth in retail sales this year, with the core measure, which excludes automobile sales, expected to increase to 0.3% from 0.1% previously. A rebound in the data could signify a resilient consumption as the economy moves into the second half of 2023, where Fed policymakers foresee a relatively subdued economic growth.
Annual trend in retail sales is not encouraging
On an annual basis, retail sales have fallen substantially this year. Excluding the pandemic plunge, growth has diminished to the lowest level in three years in April to 1.20% to rise only moderately to 1.6% in May. Perhaps the slowdown in inflation and the stability in the labor market could prompt some extra spending during the summer months as the latest upbeat University of Michigan's preliminary reading on consumer sentiment tried to message, though a monthly rebound could do little to change the cloudy trend.
Market reaction
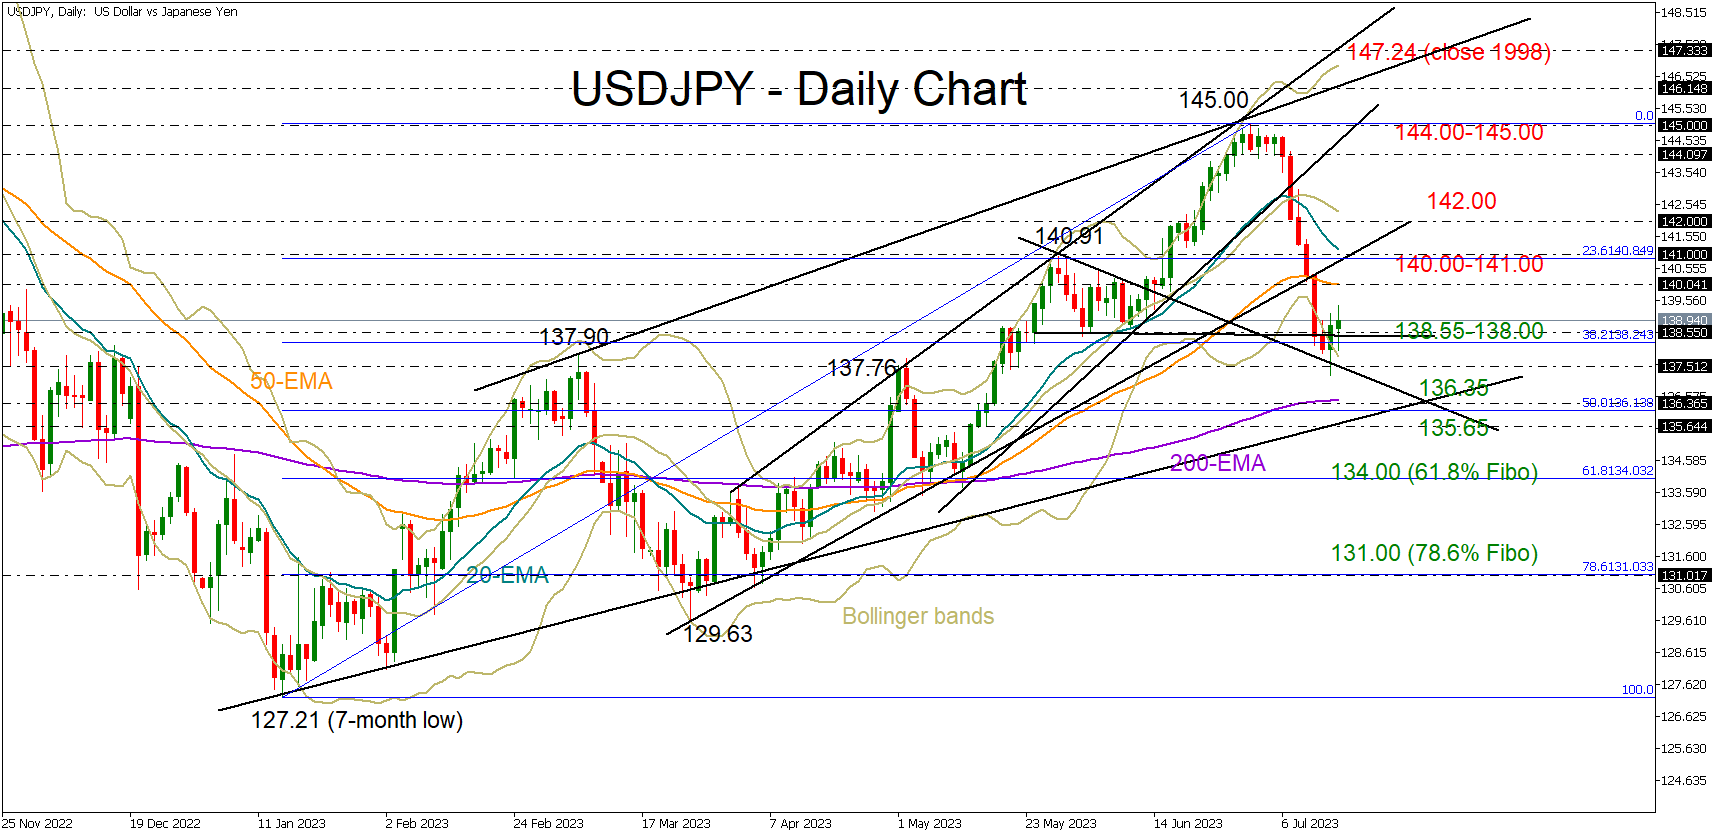
Hence, the market reaction to the data might not be extreme, but a temporary upside correction could be possible in dollar/yen if the data beat expectations. The 140.00-141.00 resistance region could cap upside forces in this case ahead of the 142.00 barrier.
Alternatively, a disappointing report may bolster rate cut expectations and if the pair slips below the 138.00-137.00 support region in the aftermath, the sell-off could continue towards the 200-day exponential moving average and the 2023 support trendline at 136.35 and 135.35 respectively.
RBA Jul minutes: Hike considered, hold to reassess in Aug
Minutes from RBA's July 4th meeting reveal that two options were considered: raising cash rate by additional 25 bps, or keeping it unchanged. RBA eventually chose the latter, acknowledging the "uncertainty around the outlook and the significant increase in interest rates to date." Members agreed to "reassess the situation at the August meeting."
Despite maintaining status quo, RBA members acknowledged the possibility of future policy tightening. "Members agreed that some further tightening of monetary policy may be required to bring inflation back to target within a reasonable timeframe, but that this depended on how the economy and inflation evolve," the minutes read.
RBA's decision underscores the central bank's caution amid shifting economic conditions. With August meeting on the horizon, the Board anticipates additional data on inflation, the global economy, labor market, and household spending. This incoming information, combined with updated staff forecasts and a revised risk assessment, will guide the next policy decision.
(RBA) Minutes of the Monetary Policy Meeting of the Reserve Bank Board
Hybrid – 4 July 2023
Members participating
Philip Lowe (Governor and Chair), Michele Bullock (Deputy Governor), Carolyn Hewson AO, Steven Kennedy PSM, Iain Ross AO, Carol Schwartz AO, Alison Watkins AM
Members had granted leave of absence to Mark Barnaba AM and Ian Harper AO in accordance with section 18A of the Reserve Bank Act 1959.
Others participating
Luci Ellis (Assistant Governor, Economic), Christopher Kent (Assistant Governor, Financial Markets), David Jacobs (Head, RBA Future Hub)
Anthony Dickman (Secretary), David Norman (Acting Deputy Secretary)
Marion Kohler (Head, Economic Analysis Department), Penelope Smith (Head, International Department), Carl Schwartz (Acting Head, Domestic Markets Department)
International economic developments
Members commenced their discussion of the global economy by noting that, while the year-ended rate had declined, inflation remained well above central banks' targets in most advanced economies. Core inflation continued to be stubbornly high, driven by persistent services price inflation, which had become a focal point for many central banks. Rent inflation, which is a sizeable component of services, was high and increasing in several advanced economies, in part because housing supply takes time to adjust to price signals. Sticky services price inflation also reflected high wages growth, which remained above rates consistent with inflation targets in many advanced economies. Although labour market conditions were easing, this was occurring more gradually than many central banks had previously forecast and wages growth remained high relative to productivity growth.
Members noted that in major advanced economies, surveyed business conditions in the services sector had remained expansionary in June, but less so than in the prior month. By contrast, conditions in the manufacturing sector had remained weak. Indicators of consumption activity had remained subdued in advanced economies; although sentiment had improved alongside recoveries in real income growth and/or higher housing prices, sentiment generally remained below long-run averages.
Members noted that China's economic recovery had lost some momentum. Following a strong rebound from COVID-19 outbreaks and restrictions in early 2023, a range of economic indicators had signalled weaker conditions through April and May. Similarly, property market indicators in China had weakened further; housing starts had declined to their lowest level since 2006 and real estate investment had contracted further to be almost one-quarter below its 2020 peak. Consistent with considerable spare capacity, inflation in China remained well below the authorities' target of 3 per cent. Inflation had also eased in several other Asian economies, in some cases – such as India, Indonesia and Thailand – to be consistent with central banks' targets.
Commodity prices had been mixed over the preceding month, but most were significantly below their level a year earlier. Expectations that the Chinese Government would provide targeted policy support for the property sector had supported the price of iron ore. Natural gas prices in several markets had increased sharply, in part owing to higher seasonal demand and supply disruptions, but prices remained well below their peaks in mid-2022. By contrast, global agricultural prices had generally continued to decline and were expected to contribute to a further moderation in headline inflation, particularly in emerging economies where food staples formed a larger share of the CPI basket. However, the potential for future supply disruptions remained an upside risk to agricultural prices. Oil prices had been broadly unchanged over the preceding month, with production cuts by OPEC+ and the deterioration in the political situation in Russia having had little impact.
Domestic economic conditions
Turning to the domestic economy, members noted that economic growth in Australia had slowed considerably, reflecting the impact of higher interest rates and high inflation. GDP increased by 0.2 per cent in the March quarter and growth was expected to be similar in the June quarter; output growth was well below the estimated rate of increase in the population over the same period. The slowdown in activity had had only a modest effect on the labour market, with conditions remaining tight. Employment growth had continued to be robust and measures of spare capacity remained near multi-decade lows. Inflation had eased from its peak but remained too high. Market measures of short-term inflation expectations had declined from their peaks but also remained high; however, survey measures suggested that households expected the current high inflation rate to be mostly temporary.
Timely indicators pointed to a gradual easing in inflation over the first half of 2023. The monthly CPI indicator for headline inflation had eased to 5.6 per cent in year-ended terms in May. Across most components of the basket, the year-ended rate of inflation had eased over the preceding three months. Members observed that measures of underlying inflation had remained high in May at 6.4 per cent, excluding volatile items and travel. Food inflation remained high; while the 2022 flood-related effects on fresh food had unwound, the reversion in global food prices was yet to be seen in domestic prices. Furthermore, the increased likelihood of an El Niño event in 2023/24 and an associated downgrade for agricultural production could put upward pressure on some food prices over the coming year.
Services price inflation remained high in the June quarter. This was consistent with ongoing strength in unit labour cost growth, with labour productivity broadly unchanged since mid-2019. Members noted that the largest part of the increase in domestic electricity prices was yet to be seen in domestic inflation data, with domestic prices increasing with a lag in response to the higher wholesale energy prices seen in 2022.
Recent housing-related inflation outcomes had been mixed. Inflation in new dwelling construction costs had eased as cost pressures on building materials had abated, even as shortages of tradespeople had continued to restrict activity. Members noted that, by contrast, rent inflation had continued to increase and was around 10 per cent in annualised terms in May. Indicators of rental vacancy rates and advertised rents pointed to ongoing tightness in housing availability.
Members observed that measures of spare capacity in the labour market remained near multi-decade lows. Employment growth had surprised on the upside in May (following a weak outcome in April) and the unemployment rate had declined to 3.6 per cent. Although economic growth was slowing, the continued tight labour market reflected the usual lags from activity to labour market outcomes. That said, a range of indicators suggested the tightness in the labour market had eased slightly and broader measures of underutilisation had increased a little from multi-decade lows in preceding months. Firms had also reported an improvement in labour availability in some sectors, though finding suitable labour remained more difficult than prior to the pandemic. Consistent with this, the job vacancy rate remained very high, though it had declined over the three months to May.
Timely indicators suggested that wages growth had been around 3½ to 4 per cent prior to the larger-than-expected award and minimum wage decision by the Fair Work Commission (FWC). Members noted that wages growth was expected to rise to around 4 per cent in the September quarter as the FWC decision flowed through to wage agreements. Broader measures of labour costs had grown around their fastest pace in over a decade – compensation of employees increased by 11 per cent over the year to the March quarter, although much of the increase had owed to growth in employment and hours worked, with a more modest contribution from average earnings per hour.
Despite the strong growth in nominal labour incomes, total real household incomes had declined by 4 per cent over the year to the March quarter, as the contribution from labour income had been more than offset by rising prices, tax payable and higher interest rates. Members observed that the tax and inflation effects on aggregate household incomes had been larger than the net interest effect, with higher interest payments by some households being partly offset by higher interest receipts by other households. Members discussed how the disposable incomes of different types of households were being affected by higher interest rates in significantly different ways.
Reflecting declining real household incomes, growth in household consumption was weak in the March quarter. Members noted that, while growth in consumption and retail sales had slowed from the strong growth rates observed in the first half of 2022, the level of consumption was close to its pre-pandemic trend. The household saving rate declined in the March quarter to be below its pre-pandemic average (though some of this measured decline reflected high construction costs boosting imputed depreciation). Household consumption growth was expected to remain weak in the June quarter, based on timely indicators. That said, nominal retail sales had increased unexpectedly in May, though some of this related to higher food prices and changes in the timing of sales promotions.
The turnaround in the established housing market had continued in the preceding month. Members noted that housing prices had increased noticeably across all major capital cities in June, based on preliminary data. Sydney continued to lead the recovery; housing prices there had increased by around 5 per cent since February. High growth in population and nominal labour incomes and the difficulties associated with building new dwellings had supported demand for established housing nationally, despite recent increases in the cost of credit. The turnaround in the housing market, if sustained, was expected to support household consumption and dwelling investment.
International financial markets
Members noted that market participants' expectations for central banks' policy rates had increased again over the preceding month. This reflected incoming data suggesting that inflationary pressures may be more persistent than previously expected, further policy rate increases by several central banks, and central banks' communication that further tightening is likely to be required. The Bank of Canada had raised its policy rate after a pause of several months, while the Bank of England and Norges Bank had raised policy rates by more than market participants had expected. Members noted that most central banks – including the US Federal Reserve, which had paused in June – were expected to raise policy rates at least once more in coming months. Moreover, policy rates were widely expected to remain restrictive for longer, given the persistence of core inflation at levels well above inflation targets.
Government bond yields had increased over the preceding month, underpinned by higher real yields. Market-based measures of longer term inflation expectations remained consistent with inflation targets in most advanced economies, including Australia. Indicators of private sector financial conditions were little changed overall. Equity prices in the United States, Japan and Australia had increased but remained stable in Europe. Corporate bond yields were also little changed, in part owing to a narrowing of sub-investment grade spreads following the suspension of the US debt ceiling. Conditions in banking systems remained largely stable, although credit growth had slowed further in the United States and Europe.
In China, the exchange rate had depreciated further as authorities lowered policy rates alongside the release of data confirming a slowing in the pace of the economic recovery. Headwinds to growth in China included persistent weakness in the property sector as well as a weaker outlook for manufactured exports, given slower growth in advanced economies.
The Australian dollar was little changed over the preceding month. The exchange rate had appreciated following the decision to increase the cash rate in June. Subsequently, it had depreciated following the release of the June meeting minutes (which had highlighted the finely balanced decision to raise the cash rate), the monthly CPI and concerns about output growth in China.
Domestic financial markets
Members noted that expectations regarding the path of the cash rate had increased in Australia, as had government bond yields. The expected path of the cash rate, as implied by money market rates, had risen following the decision to increase the cash rate by 25 basis points in June, the subsequent release of strong labour force data and developments abroad. The yield curve remained inverted – that is, longer term yields were below those on shorter term maturities – as had been the case since March. Inverted sovereign yield curves were also evident in some other advanced economies, including the United States, which had had an inverted yield curve since October 2022. Members discussed how inverted yield curves are consistent with tightening financial conditions and signal that market participants expect slowing economic growth in the future and associated reductions in policy rates.
Scheduled mortgage payments had increased to around a historical peak of 9.4 per cent of household disposable income in May. Scheduled payments would continue to increase (even if there were no further increases in the cash rate) as borrowers with fixed-rate loans rolled off onto higher variable rates and earlier increases in lending rates flowed through. The share of borrowers rolling off fixed rates to higher variable rates was high and would remain so for some months before declining markedly into 2024. Members acknowledged the difficulty in ascertaining the extent to which these low fixed-rate borrowers had been adjusting their spending and saving behaviour in anticipation of the increase in their scheduled payments.
New housing loan commitments had picked up in May, to be around 5 per cent higher than the low point reached in February. The increase in demand for housing finance was consistent with national housing prices and the fact that activity in the housing market had risen in the preceding few months. The recent rise in housing loan commitments had been broadly based, across the states and territories and for both investors and owner-occupiers. Despite the recent rises, housing loan commitments remained around 25 per cent below their peak in January 2022 in nominal terms and at low levels as a share of housing credit.
Market pricing implied a 35 per cent chance of an increase in the cash rate of 25 basis points at the July meeting, compared with around half of market economists expecting an increase. Overall, the market was pricing in two 25 basis point increases in the cash rate over the remainder of 2023, an expectation shared by around half of market economists.
Considerations for monetary policy
In turning to the policy decision, members noted that inflation in Australia remained very high, despite a decline in prior months, and was currently not expected to return to the top of the target range until mid-2025. Services price inflation, in particular, continued to be high. There was little spare capacity in the economy or the labour market, and the level of economic activity was high relative to some years prior. Further, the housing market had stabilised, with housing prices rising once again. At the same time, output growth had slowed materially. Consumer spending had been weak in the first half of 2023 because of the effect of higher inflation, increased tax payments and higher interest rates on households' real disposable incomes. The tightening of monetary policy was still working its way through the economy, including as fixed-rate loans matured. Core inflation had proved stickier than anticipated in many advanced economies and several central banks had tightened policy unexpectedly or by more than expected in preceding months. Market expectations for the peak in policy rates in most advanced economies had also continued to rise.
Members discussed two options for monetary policy at this meeting: increasing the cash rate by a further 25 basis points; or holding the cash rate unchanged.
The case to increase the cash rate further was centred on the observations that inflation was forecast to remain above target for an extended period and there was a risk that this timeframe would be extended without further monetary policy tightening. Members noted that several CPI categories for which inflation was typically quite persistent already had too high inflation, including rent and services prices more broadly. They also observed that weak productivity was contributing to strong growth in unit labour costs. Furthermore, electricity prices had risen substantially on 1 July; while this was expected and had been incorporated in the staff forecasts for some time, there was a risk that the wider effects on inflation had not been fully captured.
The labour market remained very tight, notwithstanding some easing in conditions in the preceding month or so. While nominal wages growth appeared to have stabilised recently, members assessed that the environment would remain conducive to above-average increases in prices and wages under such levels of labour market tightness.
Members observed that inflation in advanced economies was proving to be more persistent than expected and that central banks had responded to this with unexpected or larger-than-expected monetary policy tightening over the preceding month. The policy rate in Australia was still lower than in many comparable economies and the recent experience of those countries highlighted the upside risks to inflation and the outlook for interest rates.
Members then turned to the option of holding the cash rate unchanged.
Members noted that monetary policy had been tightened considerably and rapidly over the prior year and the stance of monetary policy was clearly restrictive at the prevailing cash rate. The inversion of the yield curve signalled that the market expected the cash rate to be higher in the near term than it would be over the longer term, consistent with a contractionary monetary policy setting. In addition, mortgage interest payments (as a share of household disposable income) were around a record high in May and would rise further as fixed-rate loans continued to mature, even if the cash rate was not increased further. Members noted that the lags in the transmission of monetary policy through the economy meant that the full effects of the policy tightening that had occurred over the preceding year were yet to be observed. They acknowledged that it takes time for households and businesses to adjust their spending and investment plans, and that there were still significant resets of low fixed-rate loans ahead. Similarly, demand for labour typically responds with a lag, which implied that the current tightness in the labour market might also ease.
Members acknowledged that inflation was now declining, albeit from a high level, and that this would help mitigate the risk of a rise in medium-term inflation expectations. Members noted that global developments over prior months – in particular, the fall in commodity and shipping prices – had reduced upstream cost pressures for goods. More broadly, the slowing in economic growth was working to bring demand and supply into closer alignment, which, over time, would work to lower inflation.
Members also discussed the risk that output growth slows by more than expected. They noted that the slowing in economic activity in general, and consumption in particular, had been consistent with what could reasonably have been expected given trends in household income and wealth. However, members observed that there was considerable uncertainty about the resilience of household consumption and that the squeeze on many households' finances could result in consumption slowing more sharply than implied by the current forecasts. Higher interest rates could also be expected to encourage households to save more, which would affect consumption. If that were to occur, the demand for labour would slow and the unemployment rate would be likely to rise beyond the rate required to ensure inflation returns to target in a reasonable timeframe.
The Board recognised the strength of both sets of arguments but judged that the case to hold the cash rate unchanged at this meeting was the stronger one. Noting both the uncertainty around the outlook and the significant increase in interest rates to date, members agreed to hold the cash rate steady and reassess the situation at the August meeting.
Members agreed that some further tightening of monetary policy may be required to bring inflation back to target within a reasonable timeframe, but that this depended on how the economy and inflation evolve. At the August meeting, the Board would have the benefit of additional data on inflation, the global economy, the labour market and household spending, as well as an updated set of staff forecasts and a revised assessment of the risks. Members reaffirmed their determination to return inflation to target within a reasonable timeframe and their willingness to do what is necessary to achieve that outcome.
The decision
The Board decided to leave the cash rate unchanged at 4.1 per cent, and the interest rate on Exchange Settlement balances at 4 per cent.