Sample Category Title
CAD: What’s Next?
It seems like the Canadian consumer has a firm grip on their wallet, which is no surprise given the current economic climate. Inflation in April crept up from 4.3% to 4.4%, adding to the financial woes. With soaring interest rates, it's no wonder consumers are feeling the pinch. Brace yourselves for the April retail sales report, which is expected to bring more bad news. Headline retail sales are predicted to slow to -1.4%, while the core rate is anticipated to fall to -0.8%. Not exactly the recipe for economic growth, right? If the report confirms these predictions, it might shake up investors and send the Canadian dollar on a downward spiral. The Bank of Canada won't be thrilled with the slight increase in inflation, but at least the core rate, a more reliable gauge, moved lower. Keep an eye on the BoC's meeting on June 7th, where interest rates are expected to remain at 4.50%. As for the US, it's a quiet day on the economic calendar, but we do have Jerome Powell and two FOMC members delivering public remarks. The market sentiment surrounding the June meeting has shifted, with a reduced chance of a pause and a higher chance of a 25 basis points hike. The Fed's consistently hawkish stance and a strong US economy have played a part in this revision.
EURCAD - H4 Timeframe
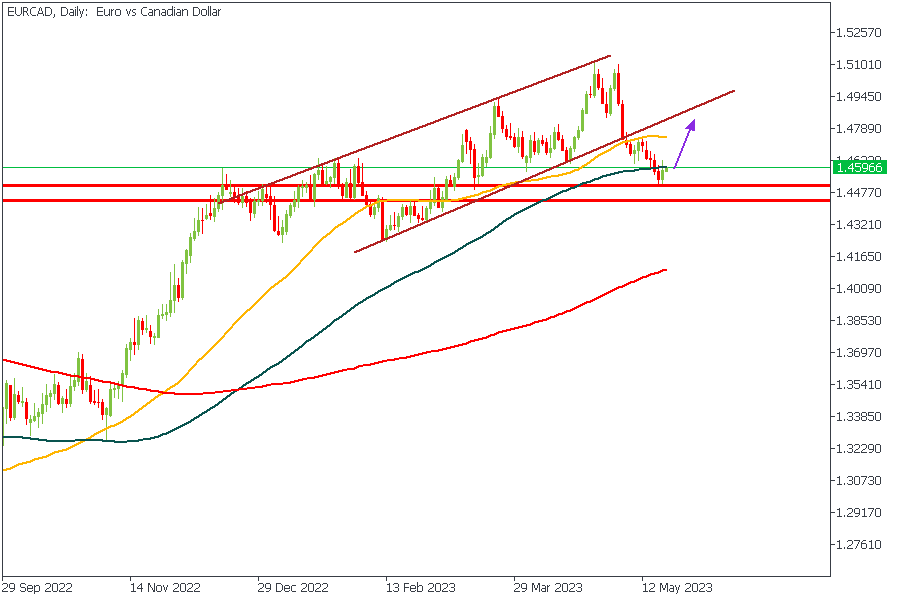
EURCAD closed last week with a major reaction off the pivot zone, after having broken out of the channel. Considering the bullish array of the Moving Averages, the reaction from the pivot zone, and the 100-Day moving average support, I believe price would attempt to reach for the 50-Day moving average; or slightly higher even. Based on the bearish outlook of the fundamental analysis as explained earlier, I have reasons to believe this is the logical direction to go for EURCAD.
Analyst’s Expectations:
- Direction: Bullish
- Target: 1.47029
- Invalidation: 1.45055
AUDCAD - Daily Timeframe
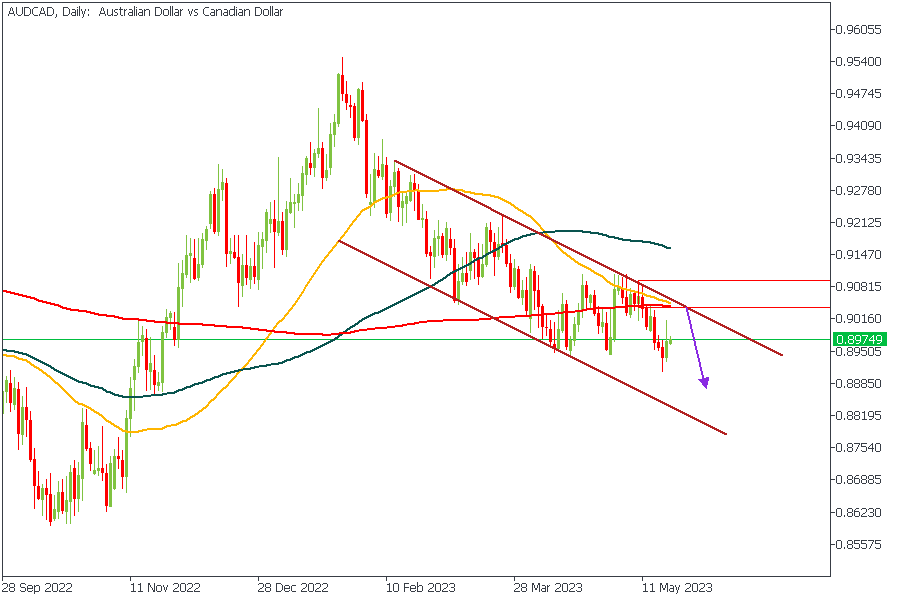
AUDCAD is trading within a descending channel at the moment, and seems to be in search of a valid supply zone from which it can recover sufficient momentum to continue its decline. It is on this ground that I have marked out the nearest supply zone that most readily provides the kind of confluences I like to see; a trendline resistance, rally-base-drop supply zone, as well as the 100 and 200 Day moving averages resistance - sweet confluences worth trading from my experience.
Analyst’s Expectations:
- Direction: Bearish
- Target: 0.88859
- Invalidation: 0.90890
GBPCAD - Daily Timeframe
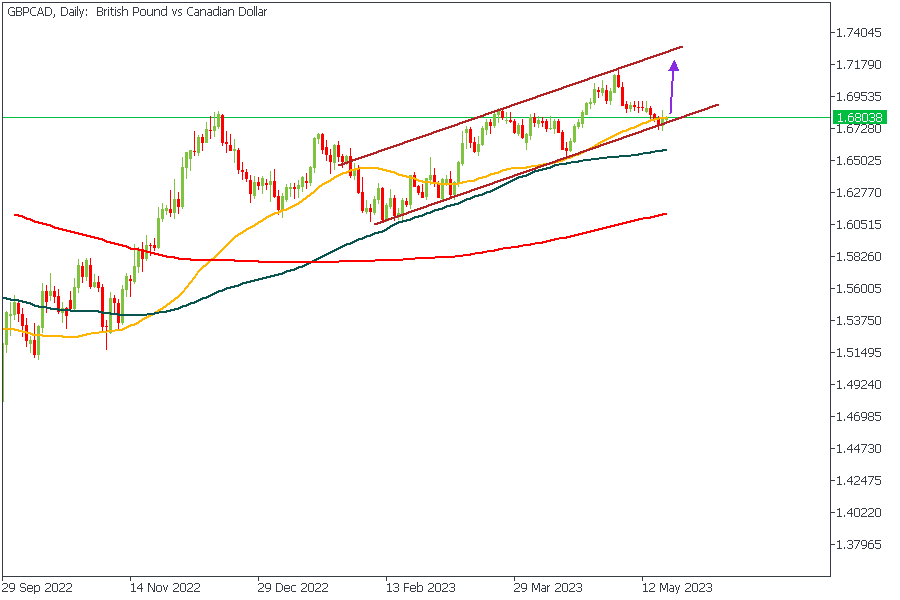
In the case of GBPCAD, the price action presents a largely bullish scenario. On the chart, we can see the price trading within a rising channel with the latest reaction being a bounce off the trendline support. My confluences on this trade include: the trendline support, 50-Day moving average support, overall bullish moving averages array, and the bullish market structure (since price recently broke above a previous high).
Analyst’s Expectations:
- Direction: Bullish
- Target: 1.72459
- Invalidation: 1.67055
CONCLUSION
The trading of CFDs comes at a risk. Thus, to succeed, you have to manage risks properly. To avoid costly mistakes while you look to trade these opportunities, be sure to do your due diligence and manage your risk appropriately.
USDCHF Found Sellers After Elliott Wave Double Three Pattern
Hello fellow traders. In this technical article we’re going to take a look at the Elliott Wave charts charts of USDCHF forex pair published in members area of the website. As our members know USDCHF has recently made recovery against the 0.944 04 peak that has unfolded as Elliott Wave Double Three Pattern. It made clear 7 swings from the lows and completed correction at the extreme zone (Blue Box- selling area) . In further text we’re going to explain the Elliott Wave pattern and trading strategy
Before we take a look at the real market example, let’s explain Elliott Wave Double Three pattern.
Elliott Wave Double Three Pattern
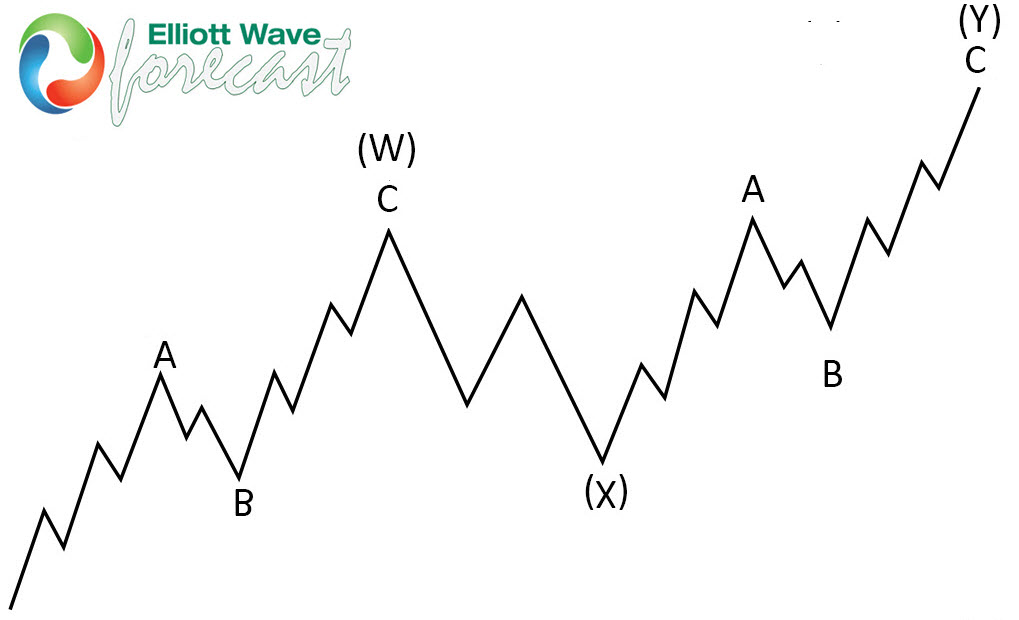
Double three is the common pattern in the market , also known as 7 swing structure. It’s a reliable pattern which is giving us good trading entries with clearly defined invalidation levels.
The picture below presents what Elliott Wave Double Three pattern looks like. It has (W),(X),(Y) labeling and 3,3,3 inner structure, which means all of these 3 legs are corrective sequences. Each (W) and (Y) are made of 3 swings , they’re having A,B,C structure in lower degree, or alternatively they can have W,X,Y labeling.
USDCHF 4h Hour Elliott Wave Analysis 05.16.2023
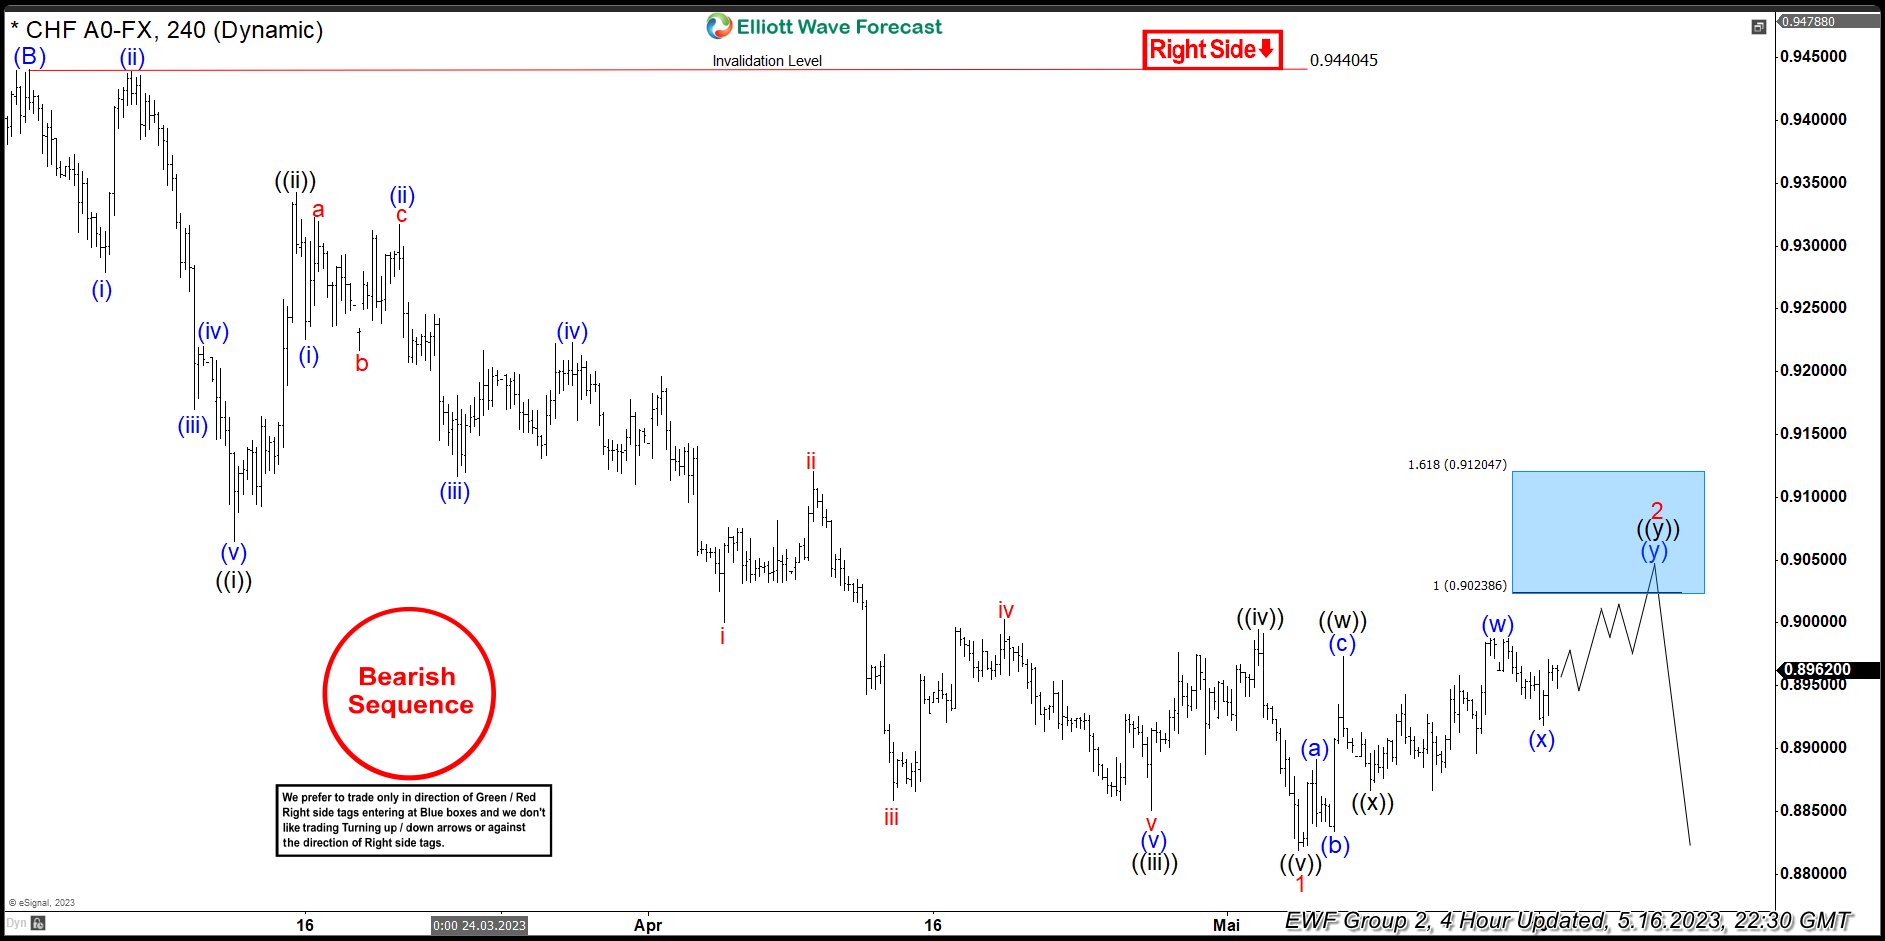
USDCHF ended cycle from the 0.94404 peak as 5 waves structure. Currently the pair is giving us 2 red recovery that is unfolding as Elliott Wave Double Three Pattern. Correction has ((w))((x))((y)) black inner labeling, when the price structure is still incomplete. We expect to see more short term strength in 7th swing toward 0.90238-0.91204 area to complete correction. At that zone we would like to be sellers. We can see either decline toward new lows or larger 3 waves pull back at least. Invalidation for the selling setup would be break above 1.618 fib ext level: 0.91204
USDCHF 1h Hour Elliott Wave Analysis 05.22.2023
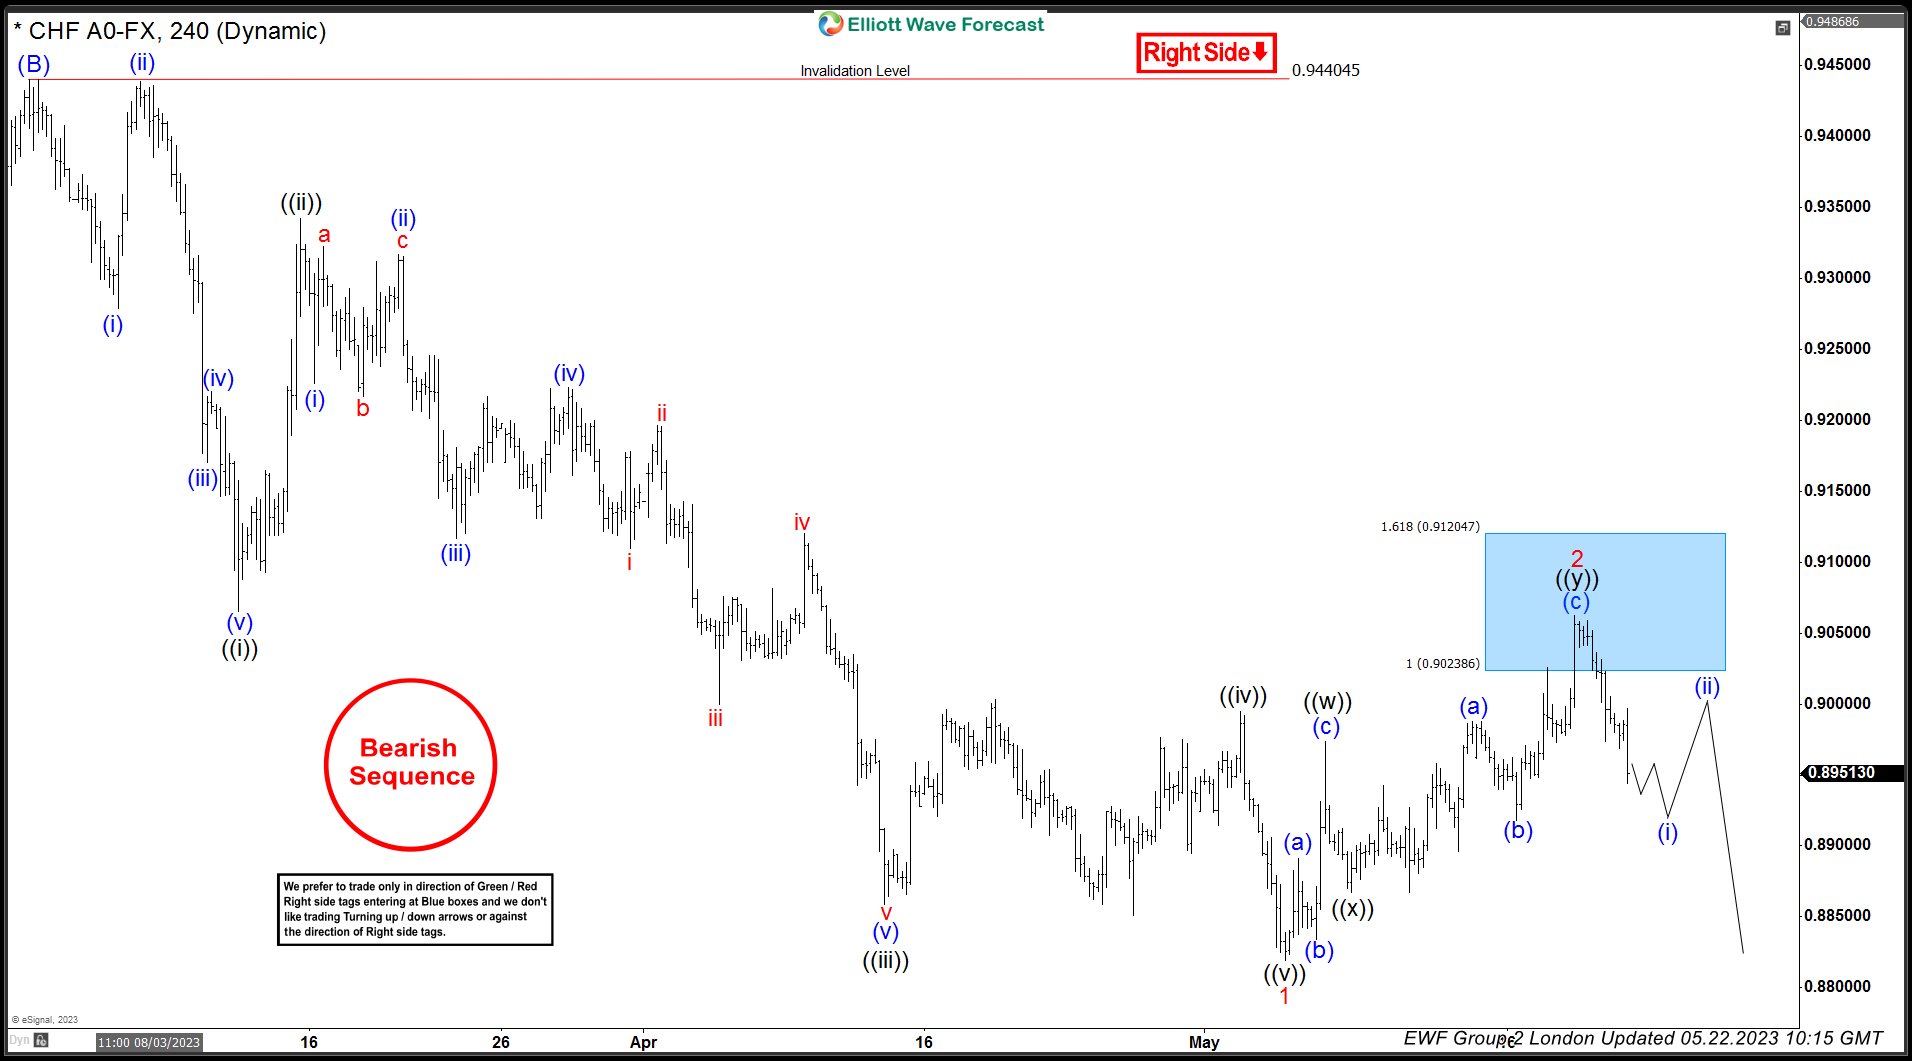
USDCHF made extension higher and reached our selling zone : 0.90238-0.91204. The pair found sellers and made nice reaction from the blue as we expected. All short positions should be risk free at this stage+ partial profit taken. Current view suggests 2 red recovery completed at 0.90625 high. As far as the price holds below that peak, further weakness should follow. We should wait for a break of 1 red low, before selling the pair again.
Cryptocurrencies Wait for a Signal
Market picture
Cryptocurrency market capitalisation fell 2% over the week to $1.12 trillion, mostly fluctuating between $1.11 trillion and $1.14 trillion. The market is in no hurry to pick a trend, bringing the cap back into its chosen range and moving on to news of the US debt ceiling and the Fed’s next move.
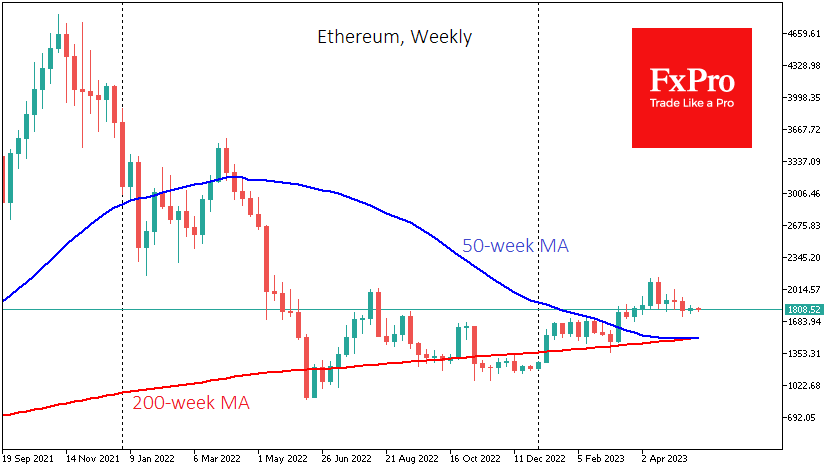
Bitcoin is back below $27K this new week, finding support from buyers on dips to the 200-week moving average, which is a notable indication the market still believes in the return of a long-term uptrend in Bitcoin. It is also a bullish signal for the cryptocurrency sector.
On the other hand, if Bitcoin fails to push back from this support soon, it will be an excuse for the bears to increase the pressure.
Ethereum has been treading water for around $1810 all last week, clearly waiting for an outside signal. Other top ten altcoins showed mixed dynamics, ranging from a 4.6% drop (Solana) to an 8.5% rise (XRP).
News background
Crypto whales could soon start selling Bitcoin, according to Lookonchain. Experts have highlighted the transfer of 1,750 BTC to the Binance exchange. The pressure will mount if other holders follow suit.
Robert Kennedy Jr, US presidential candidate who has consistently supported digital assets, called Bitcoin “an exercise in democracy”. The politician has pledged to protect the rights of Bitcoin owners and miners if he is elected the next US president.
Heisenberg Capital founder Max Keiser agreed with SEC chief Gary Gensler that all crypto assets other than bitcoin should be considered securities. He cited the example of El Salvador, where BTC has been legalised, and this adoption model could become the standard.
MicroStrategy founder Michael Saylor said the company wants to use the Ordinals protocol to build applications. He believes that Bitcoin NFT technology has the potential to drive innovation in the digital asset market.
A 30% tax on cryptocurrency mining proposed by US President Joe Biden would force the industry offshore, said Marathon Digital CEO Fred Thiel.
BTC/USD Market Analysis: Happy Bitcoin Pizza Day
Exactly 13 years ago, programmer Laszlo Heinitz, for the first time in history, paid for a real product with bitcoins — two Papa John's mushroom pizzas with sausages, tomatoes and onions. The purchase cost him “only” 10k bitcoins (25 USD at the exchange rate at that time, almost $270 million at the current price of 1 bitcoin in US dollars).
Then cryptocurrencies were practically unknown, now they are being discussed at the G7 summit. At a meeting in Japan, the leaders agreed to continue consultations on how to regulate digital assets.
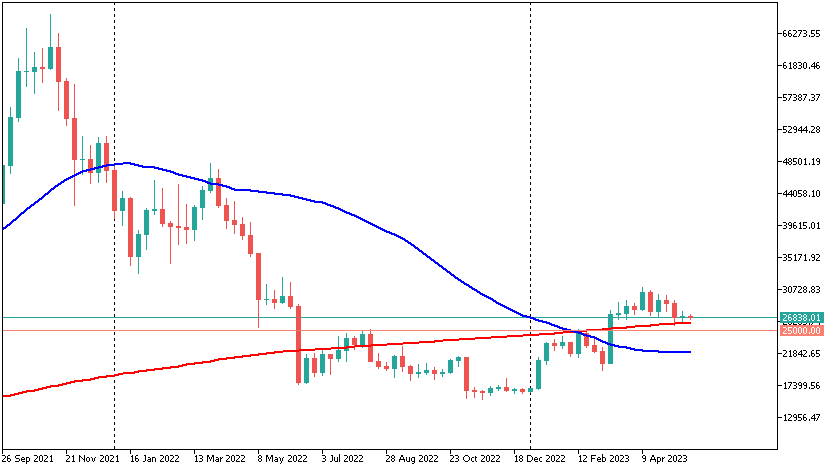
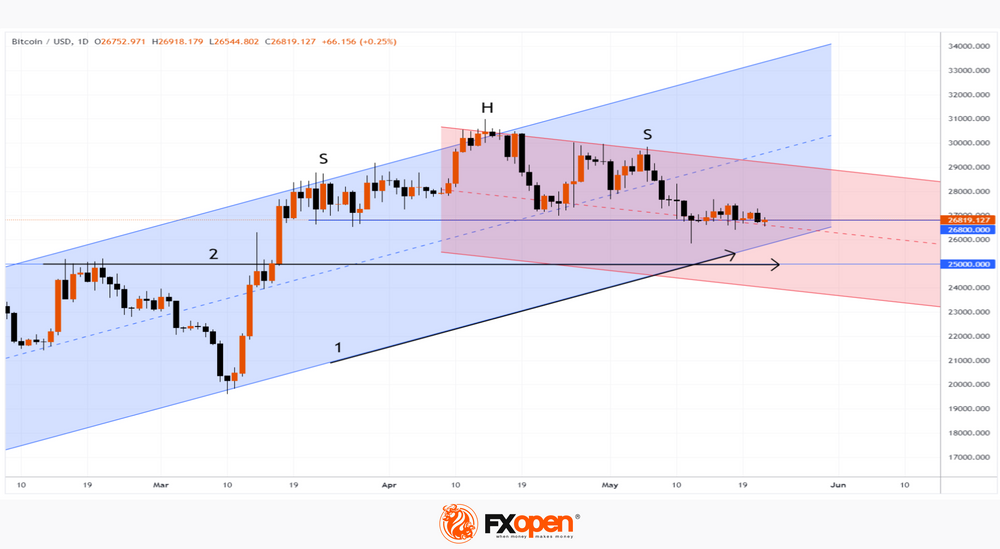
Meanwhile, bitcoin traders are looking with apprehension at the BTC/USD chart, which is forming a bearish head and shoulders (SHS) pattern. According to the classics of technical analysis, the breakdown of the “neck” level around 26,800 can lead to a downtrend. However, for this, sellers will have to apply serious pressure to overcome the support from the bottom line (1) of the ascending channel and the psychological mark (2) of USD 25k per bitcoin.
GBP/USD Struggles Below 1.2500 While EUR/GBP Remains at Risk
GBP/USD is struggling to clear the 1.2500 resistance zone. EUR/GBP is now consolidating losses below the 0.8700 resistance.
Important Takeaways for GBP/USD and EUR/GBP Analysis Today
- The British Pound is trading in a bearish zone below 1.2500 against the US Dollar.
- There was a break above a key bearish trend line with resistance near 1.2445 on the hourly chart of GBP/USD at FXOpen.
- EUR/GBP started a fresh decline from the 0.8710 resistance zone.
- There is a major bearish trend line forming with resistance near 0.8700 on the hourly chart at FXOpen.
GBP/USD Technical Analysis
On the hourly chart of GBP/USD at FXOpen, the pair started a major decline from well above 1.2520. The British Pound traded below the 1.2500 support zone against the US Dollar.
The pair tested the 1.2390 support zone. A low was formed near 1.2391 and recently the pair started a fresh increase. There was a decent move above the 50-hour simple moving average at 1.2445. More importantly, there was a break above a key bearish trend line with resistance near 1.2445.
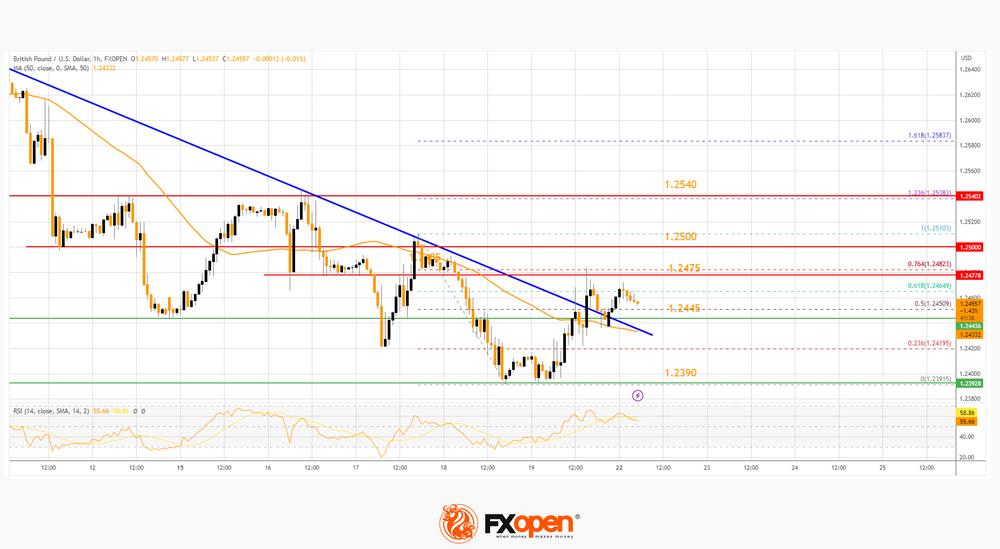
Finally, it spiked above the 61.8% Fib retracement level of the downward move from the 1.2510 swing high to the 1.2391 low. The GBP/USD chart indicates that the pair is facing resistance near the 1.2475 level.
The 76.4% Fib retracement level of the downward move from the 1.2510 swing high to the 1.2391 low is also near 1.2445. The next major resistance is near the 1.2500 level. A clear move above the 1.2500 level could spark a rally toward the 1.2540 level considering the RSI is above 50.
On the downside, there is a major support forming near the 1.2445 level. If there is a downside break below the 1.2445 support, the pair could accelerate lower.
The next major support is near the 1.2390 level, below which the pair could test 1.2350. In the stated case, GBP/USD may perhaps revisit the 1.2320 support. Any more losses could lead the pair toward the 1.2250 support.
EUR/GBP Technical Analysis
On the hourly chart of EUR/GBP at FXOpen, the pair started a fresh decline from the 0.8720 resistance. The Euro traded below the 0.8700 support to move into a bearish zone against the British Pound.
The EUR/GBP chart suggests that the pair settled below the 50-hour simple moving average and 0.8700. A low is formed near 0.8667 and the pair is slowly moving higher and the hourly RSI is back above 50. There was a break above the 23.6% Fib retracement level of the downward move from the 0.8734 swing high to the 0.8667 low.
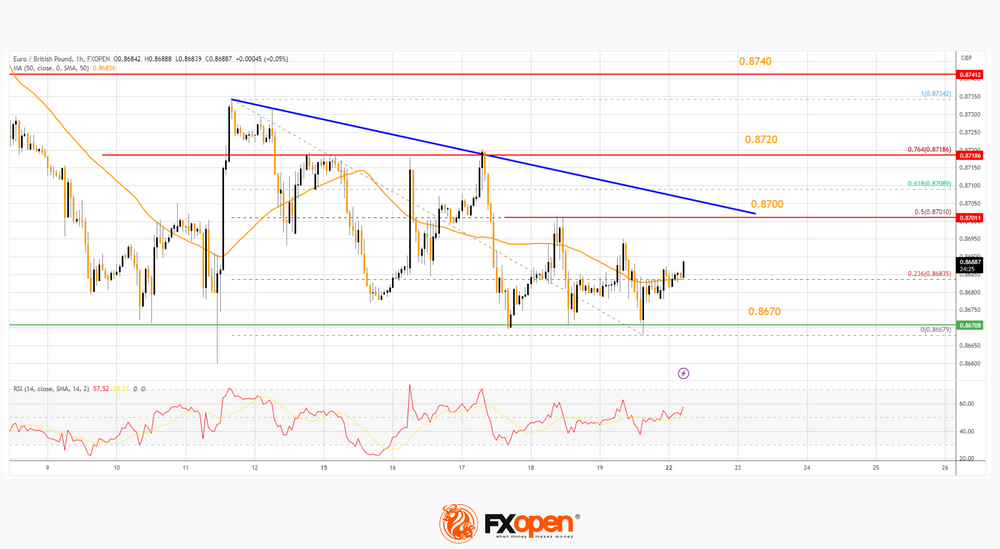
Immediate resistance is near a major bearish trend line at 0.8700. It coincides with the 50% Fib retracement level of the downward move from the 0.8734 swing high to the 0.8667 low.
The next major resistance for the bulls is near the 0.8720 level. A close above the 0.8720 level might accelerate gains. In the stated case, the bulls may perhaps aim for a test of 0.8740. Any more gains might send the pair toward the 0.8780 level.
If there is no move above 0.8700, the pair could decline again. Immediate support sits at 0.8670. The next major support is near 0.8650.
A downside break below the 0.8650 support might call for more downsides. In the stated case, the pair could drop toward the 0.8600 support level.
Dollar Index Shows Positive Uptrend as US Debt Limit Negations Ready to Eesume
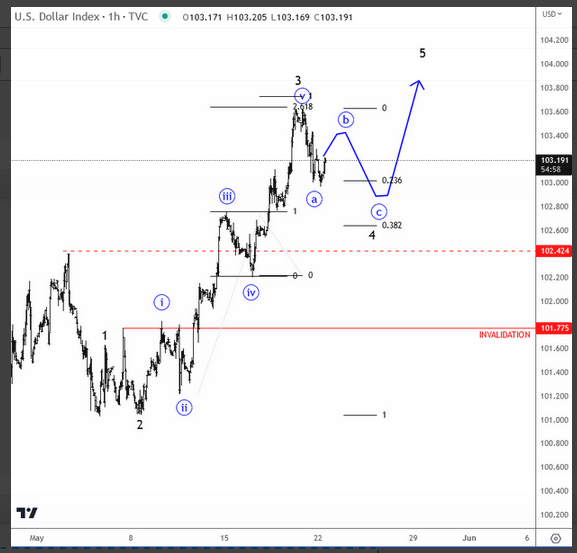
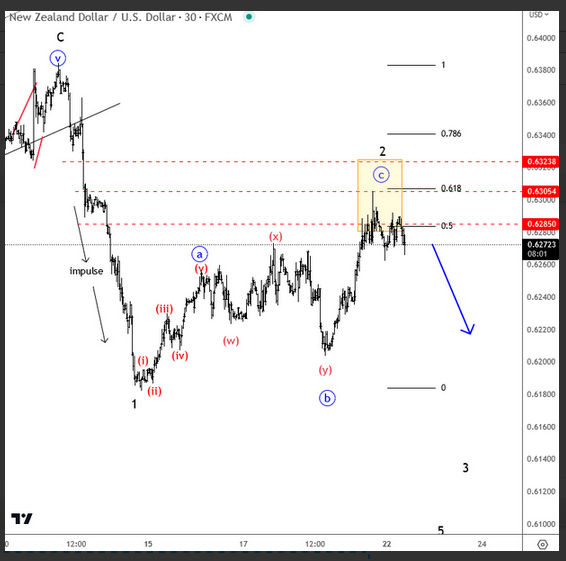
Markets can be volatile this week as US debt limit negations are ready to resume today. Then we have the EU PMI data tomorrow, followed by the RBNZ rate decision, FOMC meeting minutes and important UK CPI data on Wednesday. For now the USD remains strong, showing a clear uptrend on the hourly DXY chart where we track a bullish impulse that should resume after the current wave four set-back. Support is at 102.60/103 from where we will look higher, so at the same time other XXX/USD pairs can drop. We see kiwi forming an interesting recovery; a clear corrective rally after that shape leg down from May highs so I think that new sellers may show up this week, possibly after RBNZ rate decision.
USD/JPY: Bulls to Pause for Consolidation Before Resuming
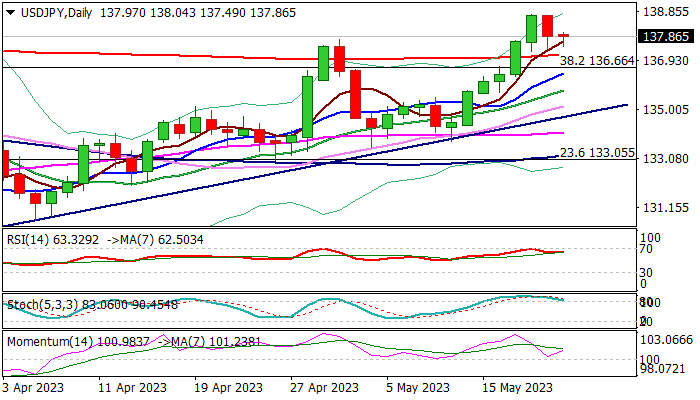
The USDJPY is consolidating under new multi-month high (138.74) as traders collected some profits after last week’s 1.65% advance.
Friday’s close above former tops at 137.90/77 (Mar 8 / May 2) added to bullish signals, however, overbought stochastic in daily chart suggest that consolidation would precede attack at 139.58/140.00 targets (50% retracement of 151.94/127.22 downtrend/psychological barrier).
Daily studies remain in full bullish setup and support the action, with consolidation to ideally stay above 137.13 (broken 200DMA) to maintain immediate upside prospects intact.
Extended dips should find ground above 136.66/44 zone (broken Fibo 38.2% of 151.94/127.22/rising 10DMA), to keep larger bulls in play.
The dollar was dented by surprise change in rhetoric of Fed Chair Powell, who said that it is unclear if interest rates will need to rise further, as inflation is proving hard to control, but full results of sharp increase in borrowing costs are still to be seen.
The Fed is likely to be more cautious, due to high uncertainty, and would make decision on meeting by meeting basis.
Debt ceiling negotiations unexpectedly broke off on Friday, adding pressure on dollar, but optimism about finding a deal persists and so far limiting negative impact on greenback.
Res: 138.74; 139.00; 139.58; 140.00.
Sup: 137.13; 136.66; 136.44; 135.75.
Gold Price Technical Analysis
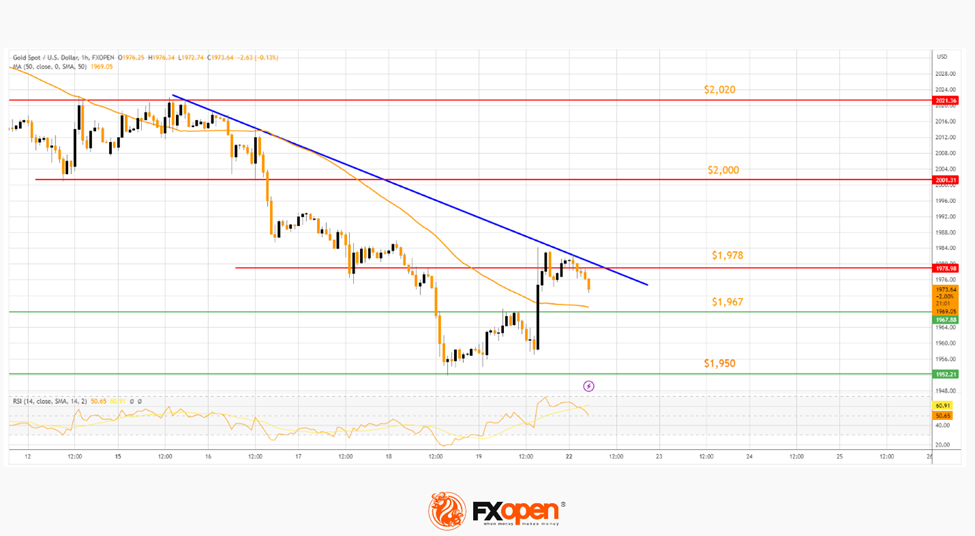
Gold price started a fresh decline from the $2,020 zone against the US Dollar. The price traded below the $2,000 level to move into a short-term bearish zone.
There was a clear move below the $1,967 level and the 50-hour simple moving average. A low was formed near $1,950 before the price started a recovery wave. It climbed above $1,967 and now facing resistance near a connecting bearish trend line at $1.978 on the hourly chart.
The next main resistance could be near the $2,000 level, above which the price could extend its rally toward the $2,020 level. Any more gains might send the price toward $2,050.
On the downside, immediate support is near the $1,967 level. The next major support is near the $1,950 level, below which the price might decline toward the $1,932 support level in the near term.
EURCHF Retreats to its Lowest Levels Since October 2022
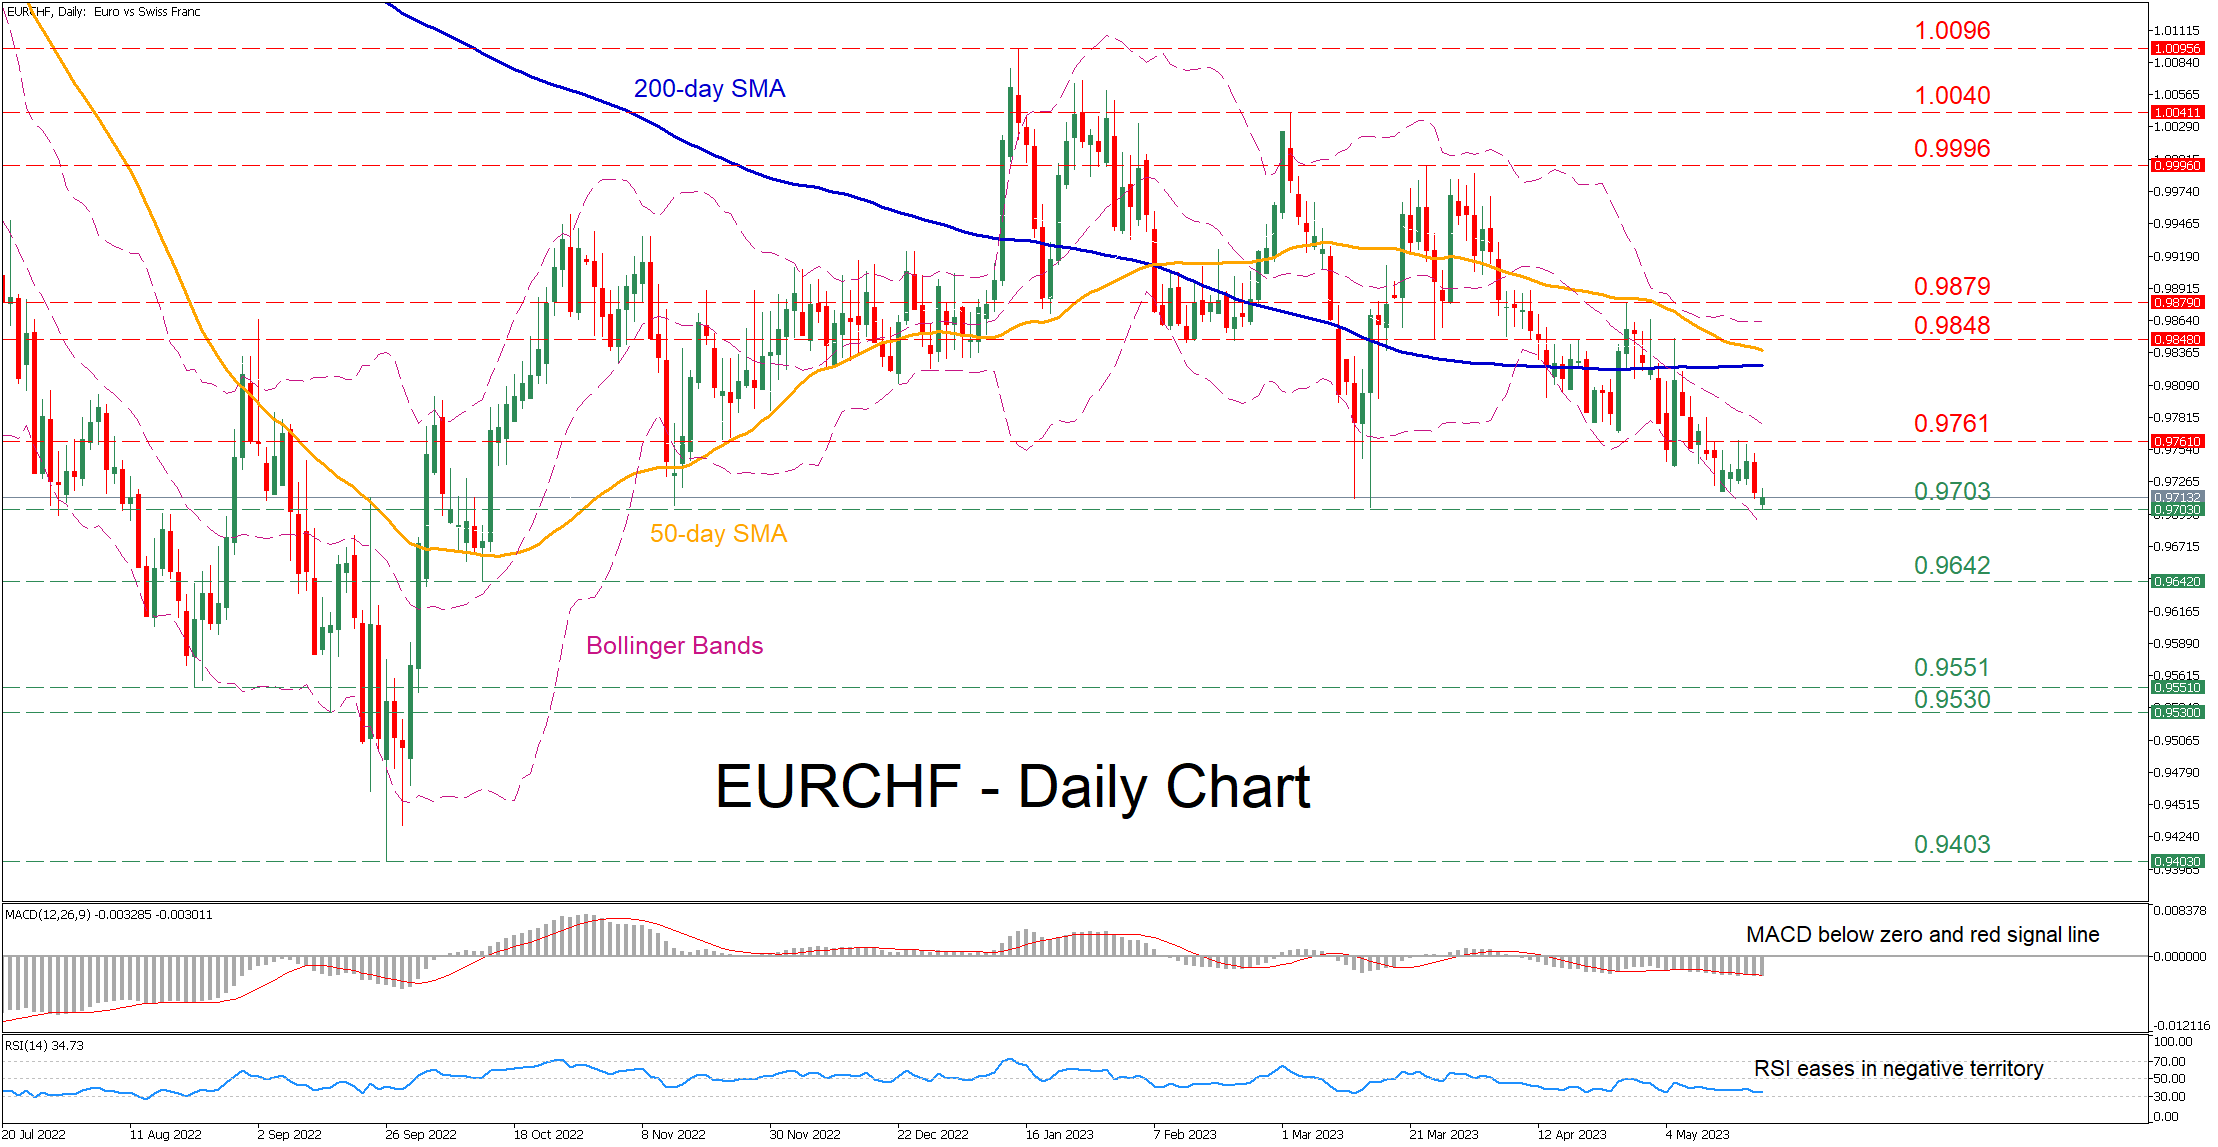
EURCHF has been trending lower since its latest rebound got rejected just shy of the parity level in late March. In today’s session, the pair posted a fresh seven-month low of 0.9703 before recouping some losses, indicating that this recent downtrend could resume.
The momentum indicators currently suggest that bearish forces are holding the upper hand. Specifically, the MACD is softening below both zero and its red signal line, while the RSI is flatlining near its 30-oversold zone.
If the price extends its retreat below today’s seven-month low, the October 2022 support of 0.9642 might prove to be a tough obstacle for the pair to overcome. If that barricade fails, the spotlight could turn to the August low of 0.9551 before the September support of 0.9530 appears on the radar. A violation of the latter may open the door for the 2022 bottom of 0.9403.
Alternatively, should the decline falter and the price reverse upwards, the bulls could attack the recent resistance of 0.9703. Crossing above that zone, the price could ascend towards 0.9848 or higher to challenge the April resistance of 0.9879. Further advances could then cease at the 0.9996 region.
Overall, EURCHF seems ready to extend its structure of lower highs and lower lows, while a potential completion of a death cross between the 50-day simple moving average (SMA) and the 200-day SMA could induce further negative pressures.
GBP/JPY Daily Outlook
Daily Pivots: (S1) 171.13; (P) 171.82; (R1) 172.39; More...
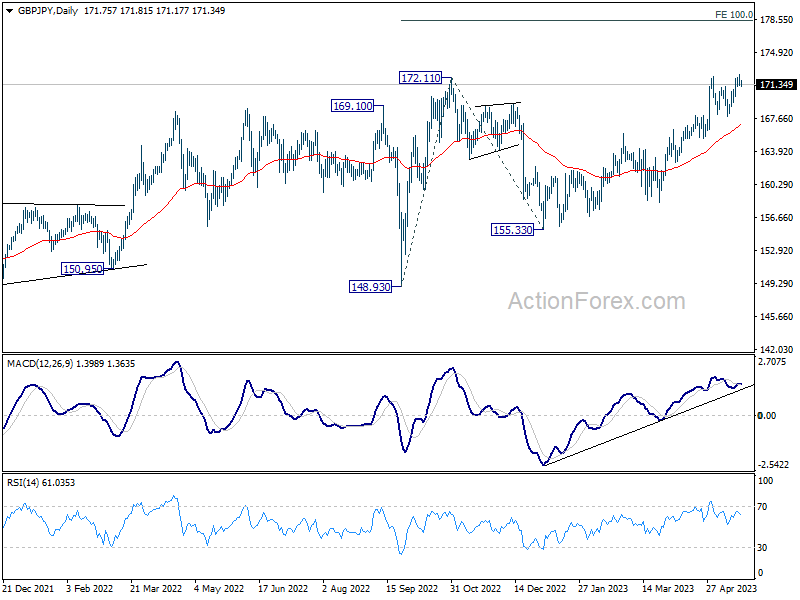
Further rise is in favor in GBP/JPY for the momentum. Current rally is part of the larger up trend and should target 100% projection of 148.93 to 172.11 from 155.33 at 178.51. Nevertheless, firm break of 167.82 support should confirm short term topping, and turn bias back to the downside for deeper pull back to 165.40 support and possible below instead.
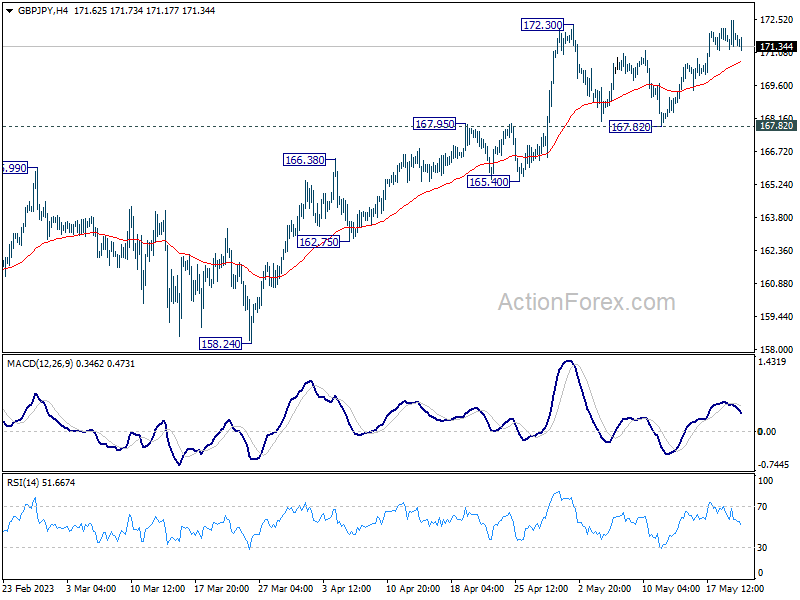
In the bigger picture, focus stays on 172.11 resistance (2022 high). Decisive break there will resume whole up trend from 123.94 (2020 low). Next target will be 161.8% projection of 122.75 (2016 low) to 156.59 (2018 high) from 123.94 at 178.69. Nevertheless, firm break of 165.40 support will indicate rejection by 172.11 and extend the corrective pattern from there with another falling leg.