

Sample Category Title
AUDCAD Wave Analysis
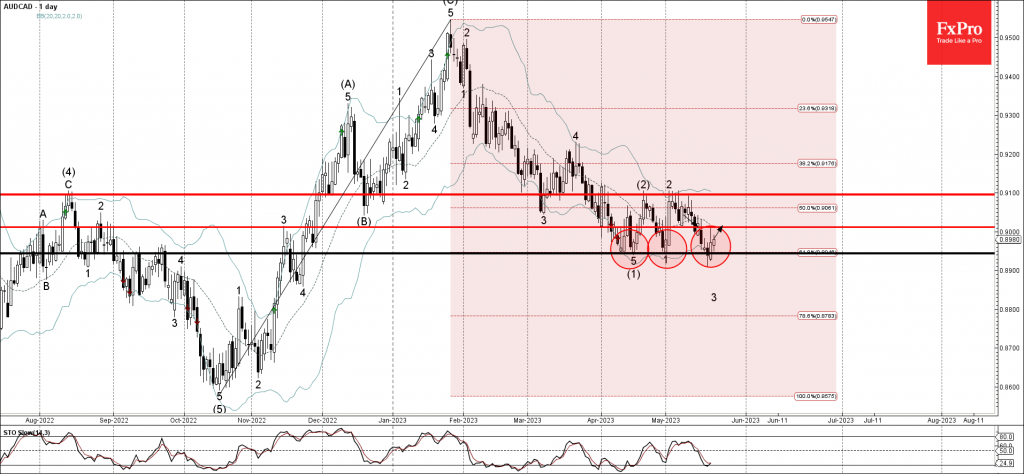
- AUDCAD reversed from support level 0.8945
- Likely to rise to resistance level 0.9010
AUDCAD recently reversed up from the key support level 0.8945 (which stopped the previous impulse wave (1) and 1), standing near the lower daily Bollinger Band.
The support level 0.8945 was further strengthened by the 61.8% Fibonacci correction of the previous sharp upward impulse from last October.
Given the strong AUD gains across the FX markets, AUDCAD can be expected to rise further toward the next resistance level 0.9010.
ECB’s Villeroy de Galhau: Terminal rate expected by summer, focus on monitoring past hikes’ effects
ECB Governing Council member Francois Villeroy de Galhau reiterated that the central bank's policy rate is expected to reach its peak "not later than by summer". He hinted at the possibility of either rate hikes or pauses in the three upcoming Governing Council meetings, but advised against making assumptions about future policy decisions based on this.
"Our primary focus right now isn't how much further we need to raise rates, but the extent of the impact of the decisions we've already made," he said. He further suggested that the policy changes may take 1 to 2 years to fully manifest, possibly leaning towards the upper end of this range given the current cycle of tightening.
Villeroy de Galhau praised the recent deceleration in rate hikes from 50 basis points to 25, referring to the move as "wise and cautious." He emphasized the need to closely monitor the effects of their past aggressive hikes and stated that "How long we maintain rates high is now more important than the precise terminal level."
He concluded by affirming the ECB's commitment to a data-driven approach, carefully assessing the inflation outlook and the effectiveness of monetary policy transmission on a meeting-by-meeting basis.
Debt Ceiling Update: A Big Week Ahead
Summary
- The debt ceiling drama has reached a fever pitch in recent weeks. As of May 17, the U.S. Treasury had roughly $68 billion of cash on hand and another $92 billion of untapped extraordinary measures. Taken together, Treasury had just $160 billion of additional borrowing capacity remaining under the debt ceiling.
- How long will that borrowing capacity keep the U.S. government afloat? During a May 21 appearance on NBC's "Meet the Press", Treasury Secretary Janet Yellen said the odds of reaching June 15 and being able to pay all the government's bills are "quite low", while noting there is always uncertainty about future tax receipts and spending.
- Our own internal tracking is a bit more optimistic, but the forecasting misses in recent weeks and months have been towards a greater financing need/bigger budget deficits, which does not inspire much confidence. It has become increasingly clear that, even in the best case scenario, the Treasury's General Account will be extremely low (<$50 billion) in the first half of June if the debt ceiling is not raised. Put another way, a fifty-fifty chance of an early June default in the absence of a debt ceiling increase is still very concerning and highlights the clear risk of hitting the X date in early June.
- As we have written previously, if Treasury can manage to stretch its funds to June 15, an infusion of corporate tax revenue and the unlocking of a new extraordinary measure on June 30 would likely keep the U.S. government afloat until the beginning of August.
- While the Treasury's cash balance and extraordinary measure balances continue to dwindle, lawmakers are attempting to negotiate a deal that would increase or suspend the debt ceiling. So far, negotiations between the two sides have not yielded a deal. This is not to say no progress has been made. But there remain major outstanding questions that still need answers to close a deal.
- So what happens next? In our view, there are three possibilities. First, Republicans in Congress could strike a sweeping deal with President Biden and Democrats in Congress to increase or suspend the debt ceiling for 1-2 years. For a deal to be reached and turned into law before early June, a breakthrough in the negotiations will need to occur this week.
- Another possibility is policymakers agree to a short-term debt ceiling increase that buys more time for negotiations. In this scenario, we envision a debt ceiling suspension for a very short period of time, perhaps one or two months.
- The third possibility is that the standoff continues, and we venture into the early June danger zone with Treasury perilously close to exhausting its borrowing capacity.
- We believe a short-term debt ceiling increase that gives negotiators a bit more time to reach a broader agreement is the most likely outcome, but the situation remains very uncertain and precarious, and we would not be shocked if any of these three possibilities are realized.
- We have continued to field numerous questions about the various contingency plans available to policymakers in the event the debt ceiling X date is breached. Although we are not entirely dismissive of such "break the glass" options, we do not view any of them as painless silver bullets. Ultimately, if any of these numerous plans are adopted, they would be entirely experimental and would come with a litany of legal, technical, economic and political challenges.
Debt Ceiling Crunch Time Draws Near
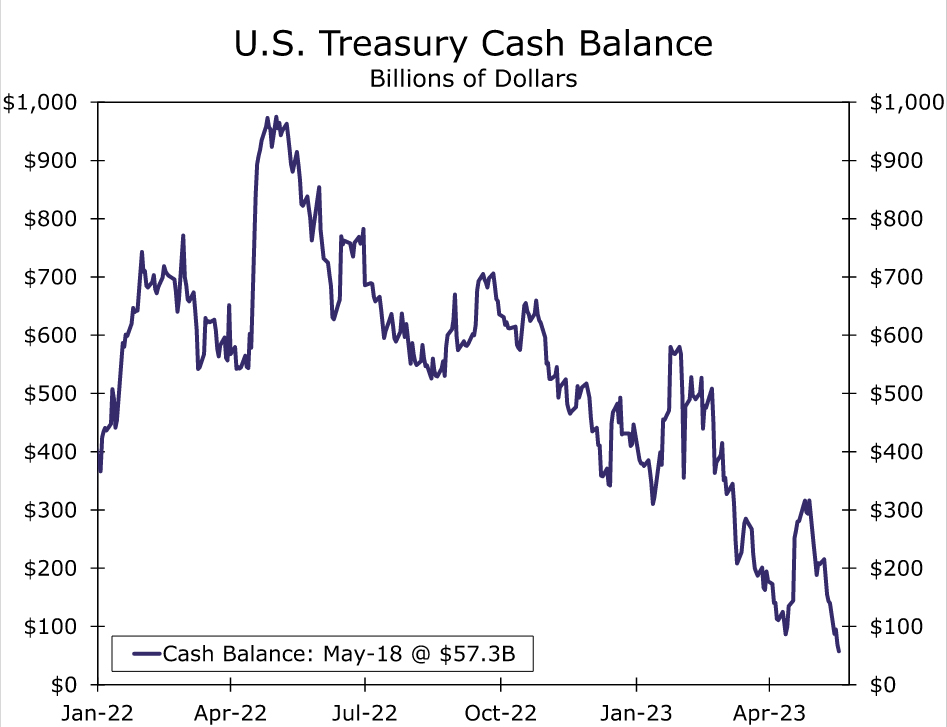
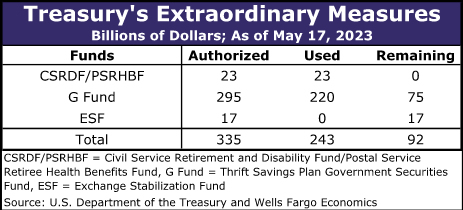
The debt ceiling drama has reached a fever pitch in recent weeks. The escalating showdown has occurred even though the issue has been coming to a slow boil for months. On January 19, the outstanding debt of the United States government hit its limit of $31.38 trillion. Since then, the U.S. Treasury has been relying on its cash balance and "extraordinary measures" to make up the difference between tax revenues and outlays. However, these two sources of wiggle room have begun to run dry. The Treasury's General Account (TGA) at the Federal Reserve was down to just $57.3 billion on May 18 (Figure 1). Absent debt ceiling constraints, the TGA would probably be around $600 billion, so a balance of just $57 billion is unusually low. Treasury's available extraordinary measures amounted to $92 billion as of May 17, the latest data available (Figure 2). When these extraordinary measures are added to the TGA balance on that day, Treasury had just $160 billion of additional borrowing capacity remaining as of May 17.
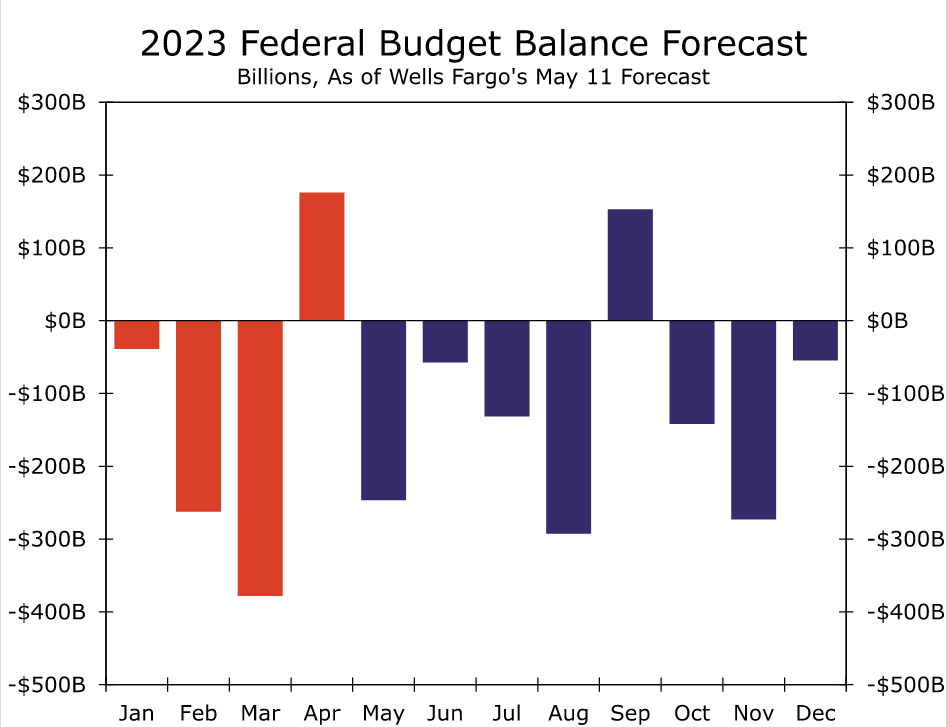
How long will that remaining borrowing capacity keep the U.S. government afloat? As we have written previously, June 15 is an important date in the timeline. If Treasury can stretch its funds through to June 15, a quarterly deadline for corporate tax payments should bring another revenue infusion of $75 billion or so. That should be enough money to remain solvent for at least another couple of weeks, at which point a new $133 billion one-time extraordinary measure will become available on June 30.1 Our federal budget deficit forecast for July is in the ballpark of $130 billion, and from there it becomes more clear how the X date, or the date on which the Treasury would be unable to meet all of its obligations on time due to the debt limit, could be as far away as the beginning of August (Figure 3).
But getting to June 15 is far from a guarantee. It has become increasingly clear that, even in the best case scenario, the TGA will be extremely low (<$50 billion) in the first half of June if the debt ceiling is not raised. For context, the average daily non-debt cash outflow from the TGA this year has been about $30 billion, and daily withdrawals of more than $50 billion are not uncommon. On May 15, Treasury Secretary Janet Yellen sent another letter to Congressional leaders reiterating that Treasury will likely no longer be able to satisfy all of the government's obligations if Congress has not acted to raise or suspend the debt limit by early June.2 During a May 21 appearance on NBC's "Meet the Press", Yellen said the odds of reaching June 15 and being able to pay all the government's bills are "quite low", while noting there's always uncertainty about future tax receipts and spending. Our own internal tracking is a bit more optimistic, but the forecasting misses in recent weeks and months have been towards a greater financing need/bigger budget deficits, which does not inspire much confidence. Put another way, a fifty-fifty chance of an early June default in the absence of a debt ceiling increase is still very concerning and highlights the clear risk of hitting the X date in early June.
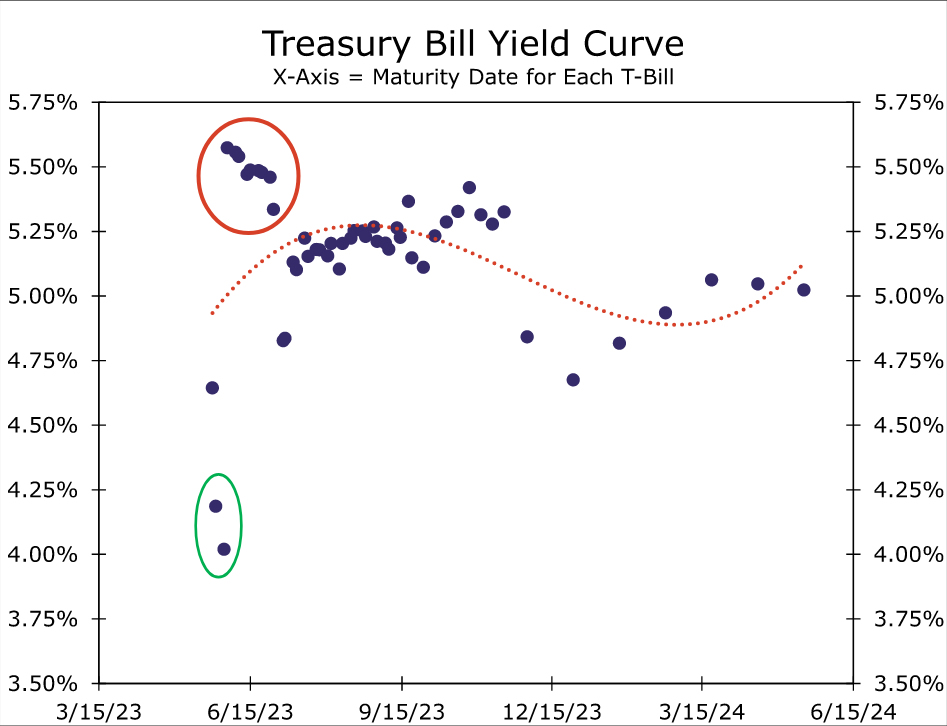
Yields on Treasury bills signal that investors are taking Treasury's guidance seriously. As we go to print, the yield on the T-bill maturing on May 30 is 4.02%. The yield on the T-bill maturing just two days later on June 1 is a whopping 5.57%, 155 bps higher for two very similar securities with one important difference. Figure 4 illustrates that investors are paying a healthy premium to own bills that mature in May while demanding hefty compensation to hold T-bills that are maturing in the first half of June.
Deal or No Deal?
While the TGA and extraordinary measure balances continue to dwindle, lawmakers are attempting to negotiate a deal that would increase or suspend the debt ceiling. So far, negotiations between the two sides have not yielded a deal. This is not to say no progress has been made. Active negotiations are forward progress relative to the standstill that prevailed for much of the year, and some areas of compromise might be within reach. For example, the two sides appear to be moving closer to rescinding about $50 billion of COVID relief funds that have gone unspent. But there remain major outstanding questions that still need answers to close a deal. Will budget caps on discretionary spending be put in place for just the next one or two years, or will they be implemented for a much longer period of time, such as the next decade? Will the budget caps lead to outright discretionary spending cuts as House Republicans have proposed, a spending freeze, or just slower growth in future outlays? Will lawmakers enact tougher work requirements for some social assistance programs such as Temporary Assistance for Needy Families (TANF) and the Supplement Nutritional Assistance Program (SNAP)? Will energy production permitting reform find its way into the final bill?
The policy disagreements among lawmakers appear wide as we enter crunch time. So what happens next? In our view, there are three possibilities. First, Republicans in Congress could strike a sweeping deal with President Biden and Democrats in Congress to increase or suspend the debt ceiling for 1-2 years. For a deal to be reached and turned into law before early June, a breakthrough in the negotiations will need to occur this week. Another possibility is policymakers agree to a short-term debt ceiling increase that buys more time for negotiations. In this scenario, we envision a debt ceiling suspension for a very short period of time, perhaps one or two months. The third possibility is that the political standoff continues, and we venture into the early June danger zone with Treasury perilously close to exhausting its remaining borrowing capacity. We believe a short-term debt ceiling increase that gives negotiators a bit more time to reach a broader agreement is the most likely outcome, but the situation remains very uncertain and precarious, and we would not be shocked if any of these three possibilities are realized.
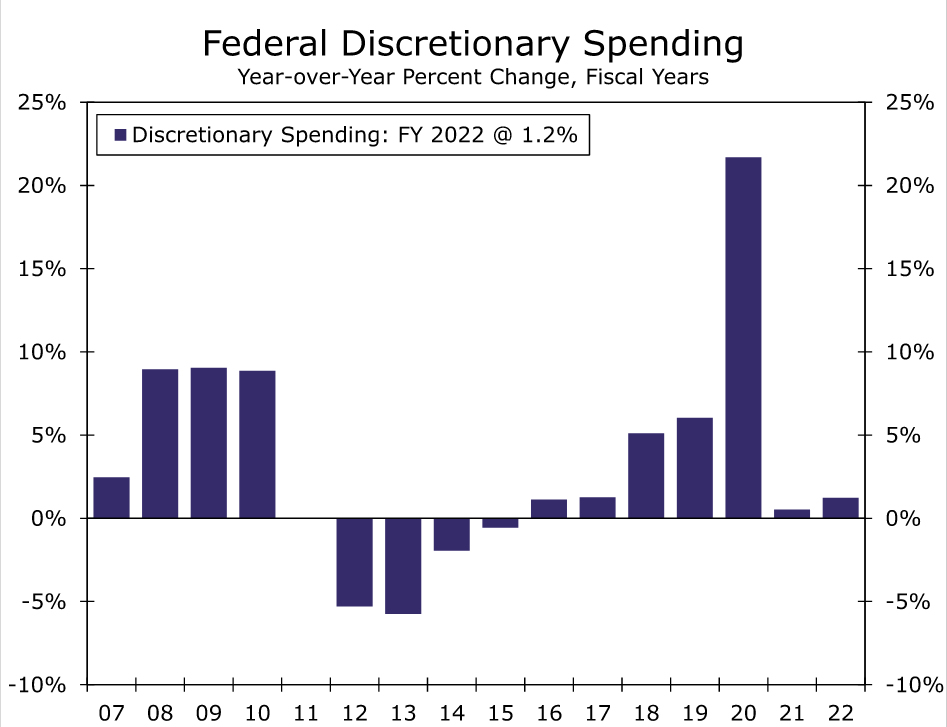
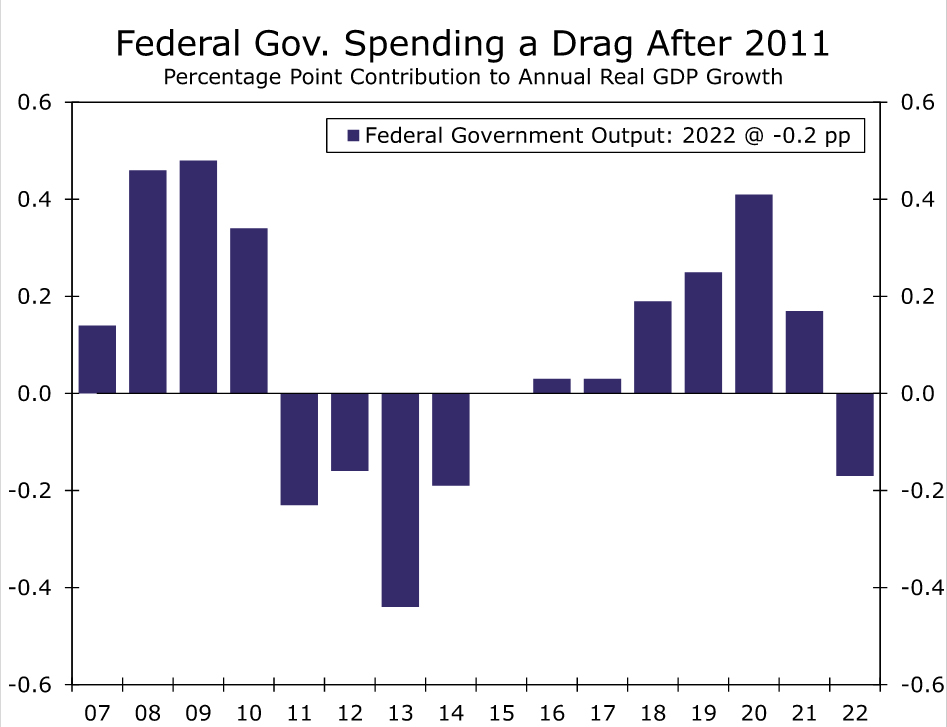
The substance of a debt ceiling deal remains just as fluid as its prospects. We think it is important to keep in mind that any major changes in the fiscal policy outlook could have a material impact on the broader economic outlook. The fiscal austerity that flowed from the 2011 debt ceiling showdown imparted a significant drag on economic growth in the years that followed (Figures 5 and 6). Our baseline economic forecast assumes federal discretionary spending is modestly additive to economic growth in 2024 as most annual appropriations grow roughly with inflation and the 2021 infrastructure bill and other previously-enacted spending boosts continue to flow. However, spending cuts much closer to what was in the House Republican debt limit bill would create downside risk to this forecast. For example, returning total discretionary spending in FY 2024 to FY 2022 levels would amount to roughly a $130 billion spending cut (~0.5% of GDP) relative to the Congressional Budget Office's baseline. If realized, federal fiscal policy could shift from neutral or somewhat accommodative to restrictive. A pending Supreme Court ruling on President Biden's student loan forgiveness program also looms in the near future as an important swing factor in the outlook for the federal fiscal policy growth impulse.
Fallback Options, but No Silver Bullet
We have continued to field numerous questions about the various contingency plans available to policymakers in the event the debt ceiling X date is breached. We would encourage our readers to review the debt ceiling guide we published in January, which can be found here, for further reading on Treasury prioritization plans and Federal Reserve options. The Congressional Research Service also has written extensively on various hypothetical escape hatches, such as minting a high denomination platinum coin or invoking the 14th amendment.3
Although we are not entirely dismissive of such "break the glass" options, we do not view any of them as painless silver bullets. Treasury may be able to prioritize principal and interest payments on the national debt, but choosing to pay bondholders would still delay payments due to other recipients of federal spending, such as military salaries, health care providers or Social Security beneficiaries. Furthermore, financial markets may still face serious stress in such a scenario, not caring to differentiate between a de jure or de facto default. The Federal Reserve could attempt to soothe financial markets with repurchase agreements or bond purchases for defaulted securities, but this would still not fix the fundamental problem of not enough tax revenue to cover existing obligations, and transcripts from past debt ceiling showdowns suggest the bar for such FOMC actions would be extremely high.4 Financial system stress could also emerge if markets are forced to await a Supreme Court ruling on unilateral executive action to bypass the debt limit. Ultimately, if any of these numerous plans are adopted, they would be entirely experimental and would come with a litany of legal, technical, economic and political challenges.
Our economic forecast is predicated on the assumption that the debt ceiling is eventually increased or suspended with minimal collateral damage on the real economy. However, past brushes with default have tightened financial conditions, occasionally in a significant way, such as the summer of 2011. The economic impact of a default is highly uncertain since that has never happened previously, but economic modeling suggests the fallout could be quite severe.5 For now, we will continue to monitor developments closely, and we will keep our readers updated on our latest thinking. Stay tuned.
Endnotes
1 U.S. Department of the Treasury. "Description of the Extraordinary Measures" January 19, 2023. (Return)
2 Yellen, Janet. "Debt Limit Letter to Congress Members" U.S. Department of the Treasury. May 15, 2023. (Return)
3 Austin, D. Andrew; Stiff, Sean. "Clearing the Air on the Debt Limit" Congressional Research Service, CRS Report 45011. November 10, 2021. (Return)
4 "Conference Call of the Federal Open Market Committee on August 1, 2011" Federal Reserve. August 8, 2011. (Return)
5 Engen, Eric; Follette, Glenn; Laforte, Jean-Philippe. "Possible Macroeconomic Effects of a Temporary Federal Debt Default" Federal Reserve. October 4, 2013. (Return)
US Debt Ceiling Drama Begins to Weigh on Markets
US markets made an impressive surge last week, taking the S&P500 to 4200, a crucial turning point. It is worth preparing for an upside stop or correction before the index steadily moves to the next level.
The S&P500 index has stopped near the 4200 level many times in the last two years. There was a pause on the way up from April to June 2021; then, it became significant support in March and May 2022; and over the last twelve months, it has been the resistance level.
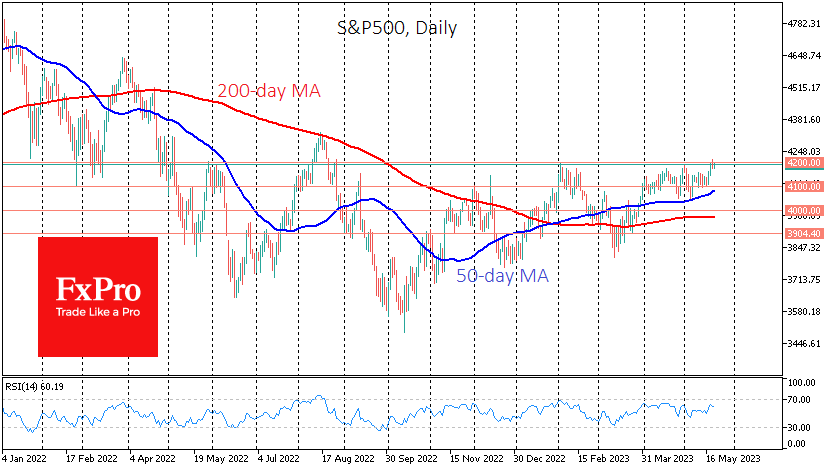
At the start of May and in trading on Friday, the S&P500 retreated from this level again. The appropriate info trigger is required to take a major tactical level, but the lack of progress in the debt ceiling negotiations on Friday formed the mood for profit-taking.
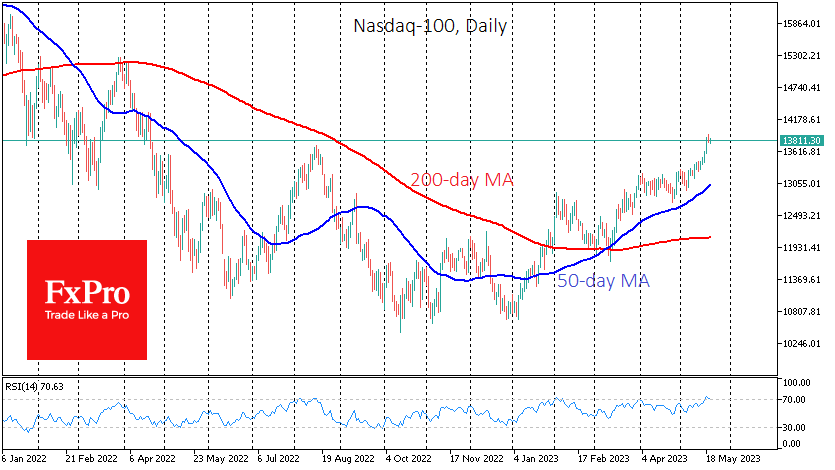
Although S&P500 doesn’t look overbought after last week’s rise, on the daily timeframes, the Nasdaq100 reversed on Friday just after touching the overbought zone in RSI. The high-tech index was experiencing a rally on the AI theme, but even more, investors were attracted by the financial performance of technology heavyweights. They have been vulnerable to rate hikes in previous years but have performed impressively during the current reporting season. But that rally is ending, and profit-taking in the Nasdaq100 looks to be reason enough for a local correction in the broad market.
The US debt ceiling drama is starting to look more and more like the most dramatic scenario we saw in 2011, where the market lost around 20% from the peak to the bottom. Interestingly, it peaked near the original ceiling date (now 1 June). However, investors and traders should be aware that due to tax receipts and other measures of the US Treasury, there is time for discussions until mid-August. And lawmakers appeared to get the most out of this time, trying to score points before next year’s presidential election.
On the technical analysis side, the S&P500 index has the potential to correct to the 4100 area without breaking its medium-term rising trend. The 50-day moving average passes through here. In a more extreme case, the pullback might occur towards the area of 4000, where the 200-day MA is located. In addition, this level carries a specific psychological load. The level of 3800 is achievable if the economy experiences a sharp decline in addition to the debt ceiling drama.
It is doubtful that the S&P500 would lose 20% and bounce back to 3350 on the sovereign debt story, as this level would not have the same devastating effect again.
Sunset Market Commentary
Markets
Markets struggled for direction. A backloaded calendar is at least part of the reason. First up are European, British and US PMI business confidence indicators. They’ll gain much attention as the May edition will have captured the effect, if any, of the financial turbulence in full. For all three regions, they are expected to come in at solid levels (for the services sector at least). The Fed will release its policy meeting minutes on Wednesday and the UK publishes April inflation figures. US PCE inflation, a price gauge watched closely by the Fed, is scheduled on Friday. The New Zealand and Hungarian central bank as well as a flurry of central bank speeches fill in the remaining gaps. Voting FOMC member Kashkari was the latest one to weigh in. He said today that hiking or pausing in June is a close call, adding that if they were to “skip a meeting”, it doesn’t mean the Fed is done tightening. Kashkari hasn’t seen any evidence of bank stress tightening credit conditions. He also said rates could possibly need to go north of 6% though added that if banking stress does bring inflation down, the central bank is maybe getting closer to being done. Non-voting member Bullard in a speech later said US recession worries are overstated. He expects rates to be lifted by an additional 50 bps later this year. Kashkari and Bullard are the two most outspoken hawks. Yet their comments did not go unnoticed. US bond yields swapped a few bps of losses for minor gains in the 1-3 bps area. Both the 2-y and the 10-y yield are trying to escape the sideways trading range in place since mid-March. German Bunds slightly underperform with yields adding 2.5-3.7 bps across the curve. European stocks inch lower. The EuroStoxx50 eases 0.3% after failing to take out resistance from the April 2023 high/Nov 2021 post-pandemic recovery high. WS opens with small gains. Japan’s yen on currency markets is the underperformer but all is within tight ranges. USD/JPY rises to 138.40, EUR/JPY to 149.79. EUR/USD and EUR/GBP are going nowhere near 1.081 and 0.868 respectively.
News & Views
According to the consumer survey published by the National Bank of Belgium today, consumer confidence declined in May from -6 to -9 after reaching the best level since early February 2022 in April. The loss of confidence affected al components in the indicator. The outlook on the economic situation was revised downwards (-20 from -15), to its lowest level since the beginning of the year. Fears of rising unemployment have increased (18 from 14), offsetting the favourable development observed last month. On a personal level, households expect to save less in the coming months (2 from 6). They are also slightly less optimistic about their financial situation for the next twelve months (-3 from -2).
A series of April activity and price data published by Statistics Poland showed a mixed picture. Sold production (constant prices not seasonally adjusted) of industry in April declined 14,8% M/M to be 6.4% lower compared to the same month last year, the biggest decline since the start of the pandemic in spring 2020. Yearly declines were registered in 25 out of 34 industry divisions. Among the main industrial groupings there was a significant decrease in production of energy (14.5% Y/Y), durable consumer goods (13.5%), intermediate goods (10.8% ) and non-durable consumer goods (5.3%). Sales of capital goods increased (7.2%). Compared to March 2023 volumes of sold production declined in 33 out of 34 industry divisions. PPI inflation also declined more than expected at -0.7% M/M and 6.8% Y/Y, the third consecutive monthly decline. Monthly price declines were registered for manufacturing (-0.5% M/M) and electricity and gas (-2.1%). Average gross wages in April (-1.0% M/M and 12.1 % Y/Y) were close to expectations. Employment unexpectedly rose 0.1% M/M and 0.4% Y/Y.(-0.1% M/M was expected). Polish central bankers recently pushed back against calls for rate cuts as both headline (14.7% y/y) and core inflation (12.2%) stayed elevated. Additional fiscal spending is also a source of concern for inflation. The zloty is holding strong (EUR/PLN 4.5075 currently) after testing the strongest level in 2 years last week.
EUR/USD Mid-Day Outlook
Daily Pivots: (S1) 1.0768; (P) 1.0798; (R1) 1.0837; More...
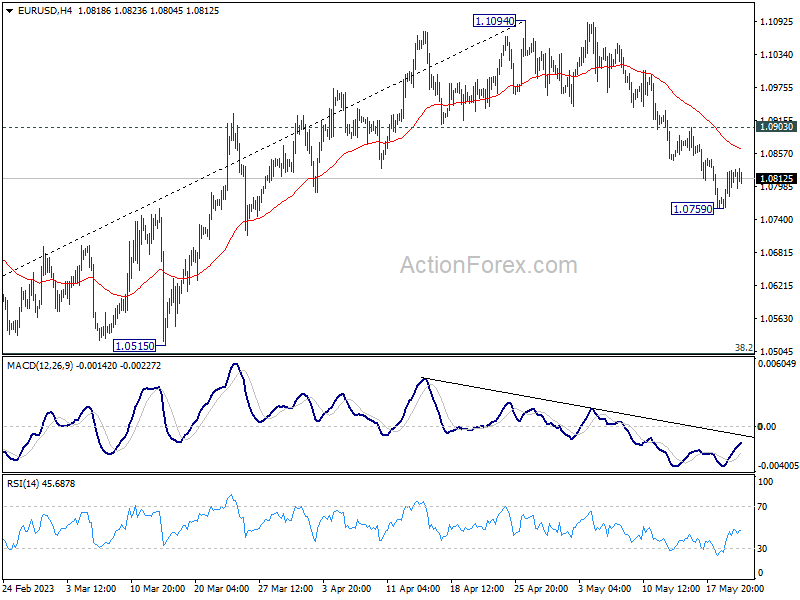
EUR/USD is staying in consolidation above 1.0759 temporary low and intraday bias stays neutral. Deeper decline is expected as long as 1.0903 resistance holds. Fall from 1.1094 is seen as correcting whole up trend from 0.9534. Below 1.0759 will target 1.0515 cluster support, 38.2% retracement of 0.9534 to 1.1094 at 1.0498. On the upside, though, firm break of 1.0903 will bring stronger rebound back to retest 1.1094 high instead.
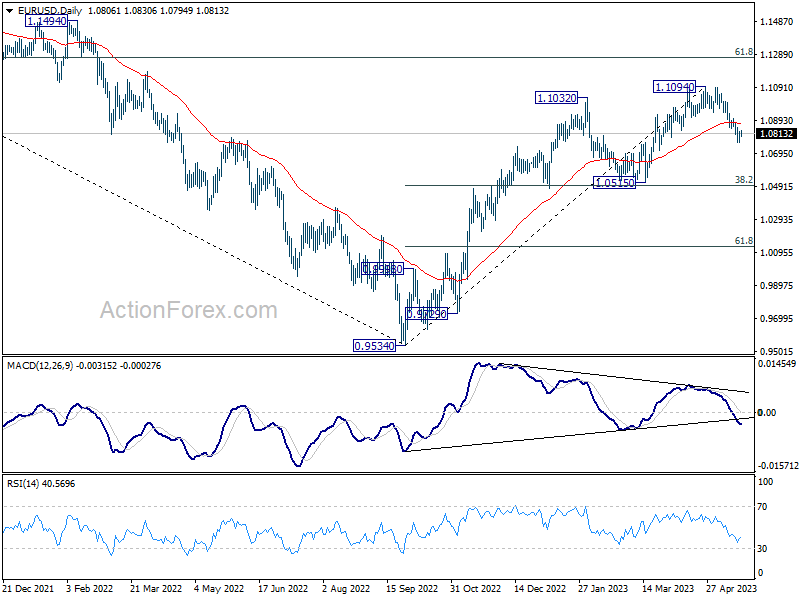
In the bigger picture, as long as 1.0515 support holds, rise from 0.9534 (2022 low) would still extend higher. Sustained break of 61.8% retracement of 1.2348 (2021 high) to 0.9534 at 1.1273 will solidify the case of bullish trend reversal and target 1.2348 resistance next (2021 high).
GBP/USD Mid-Day Outlook
Daily Pivots: (S1) 1.2396; (P) 1.2440; (R1) 1.2488; More...
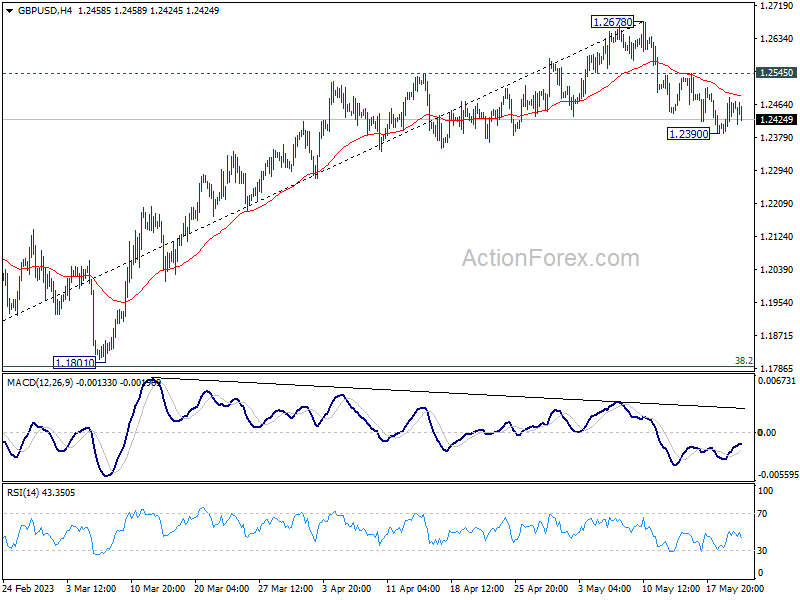
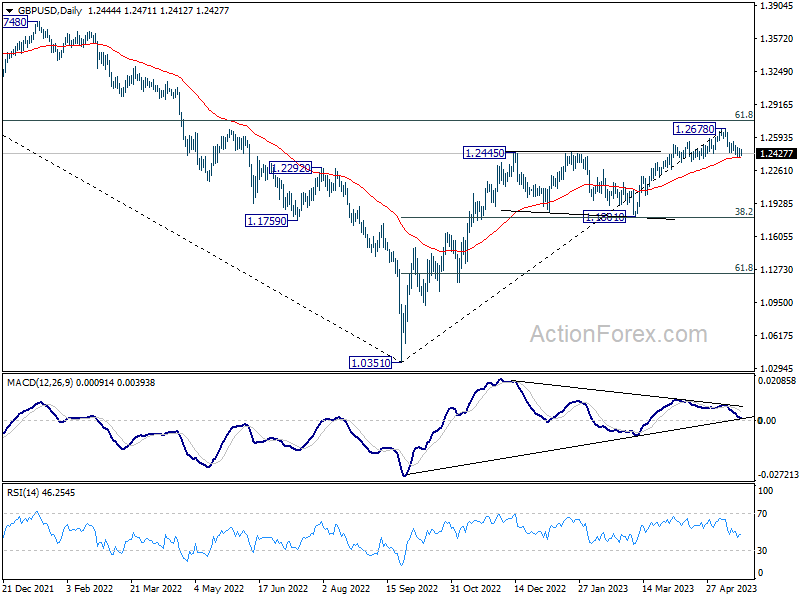
GBP/USD is staying in tight range above 1.2390 and intraday bias stays neutral. Decline from 1.2678 short term top is expected to continue as long as 1.2545 resistance holds. On the downside, sustained trading below 55 D EMA (now at 1.2394) should confirm that it's already in correction to whole up trend form 1.0351. Deeper fall should then be seen to 1.1801 cluster support (38.2% retracement of 1.0351 to 1.2678 at 1.1789). On the upside, however, break of 1.2545 will bring stronger rebound back to retest 1.2678 high.
In the bigger picture, as long as 1.1801 support holds, rise from 1.0351 medium term bottom (2022 low) is expected to extend further. Sustained break of 61.8% retracement of 1.4248 (2021 high) to 1.0351 at 1.2759 will add to the case of long term bullish trend reversal. However, firm break of 1.1801 will indicate rejection by 1.2759, and bring deeper decline, even as a correction.
USD/JPY Mid-Day Outlook
Daily Pivots: (S1) 137.34; (P) 138.04; (R1) 138.65; More...
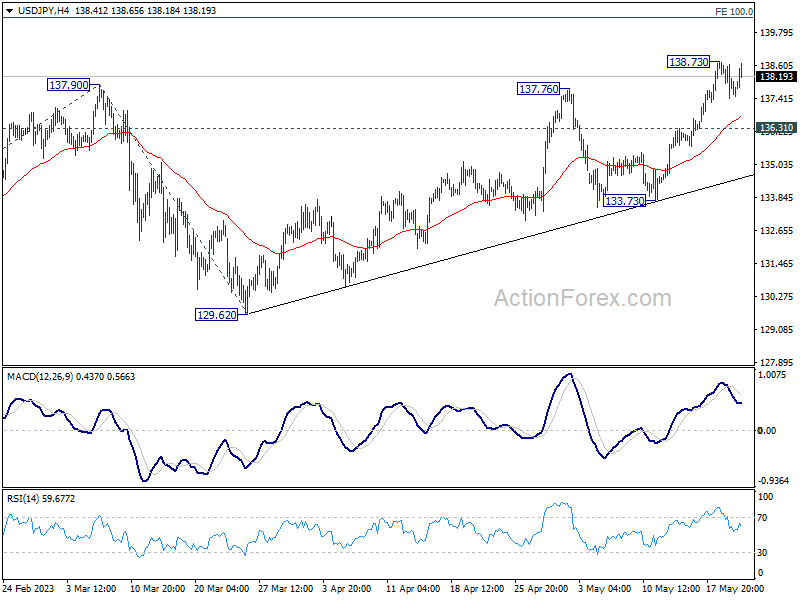
USD/JPY rebounds notably today but stays below 138.73 temporary top. Intraday bias remains neutral and another retreat cannot be ruled out. but downside should be contained by 136.31 support to bring another rally. Break of 138.73 will turn bias back to the upside for 100% projection of 127.20 to 137.90 from 129.62 at 140.32. Break there will target 142.48 fibonacci level.
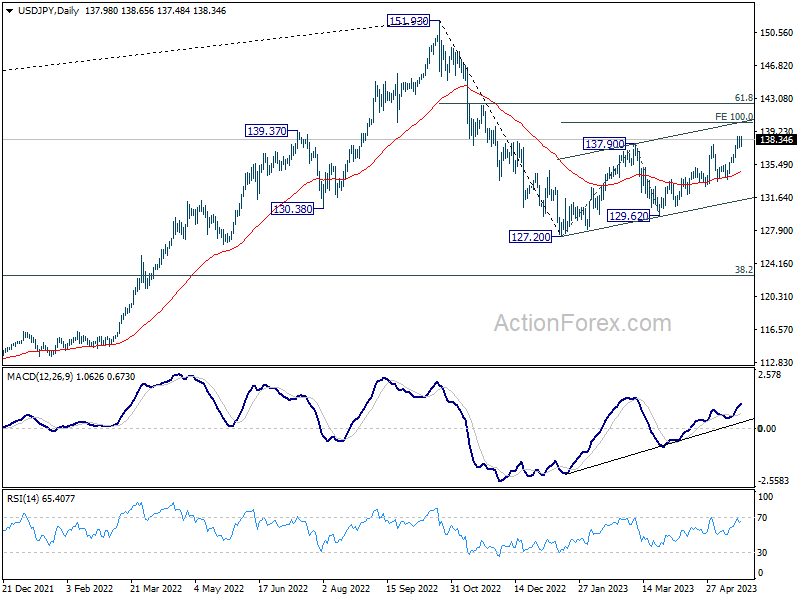
In the bigger picture, rise from 127.20 is seen as the second leg of the corrective pattern from 151.93 high. Stronger rally would be seen to 61.8% retracement of 151.93 to 127.20 at 136.34. Sustained break there will pave the way back to retest 151.93. On the downside, however, break of 133.73 support will argue that the pattern could have started the third leg through 127.20 low.
Fed Bullard: I’m thinking two more moves this year
St. Louis Fed President James Bullard reiterated the need for more rate hikes to combat persistent inflationary pressures. He stated, "I think we're going to have to grind higher with the policy rate in order to put enough downward pressure on inflation and to return inflation to target in a timely manner."
"I'm thinking two more moves this year – exactly where those would be this year I don't know – but I've often advocated sooner rather than later," he added.
According to Bullard, Fed's March median forecast, which suggested rates peaking at 5.1%, was predicated on a slowing U.S. economy and rapidly falling inflation. Instead, he noted, the economy has exhibited robust growth and inflation has not been abating as swiftly as hoped.
With this unexpected scenario in play, Bullard cautioned about the risks of inflation not subsiding to lower levels. Referring to the buoyant labor market, he emphasized, "As long as the labor market is so good it is a great time to get this problem behind us and not replay the 1970s."