

Sample Category Title
EUR/CHF Daily Outlook
Daily Pivots: (S1) 0.9681; (P) 0.9703; (R1) 0.9729; More...
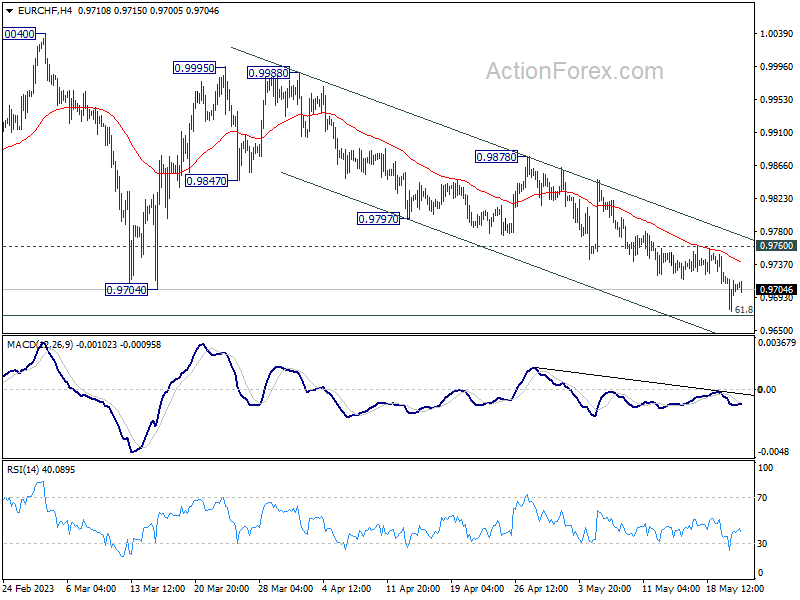
Outlook in EUR/CHF is staying unchanged. The corrective pattern from 1.0095 could be contained by 61.8% retracement of 0.9407 to 1.0095 at 0.9670. On the upside, break of 0.9760 resistance should confirm short term bottoming and turn bias back to the upside for stronger rebound. However, sustained break of 0.9670 will pave the way back to 0.9407 low.
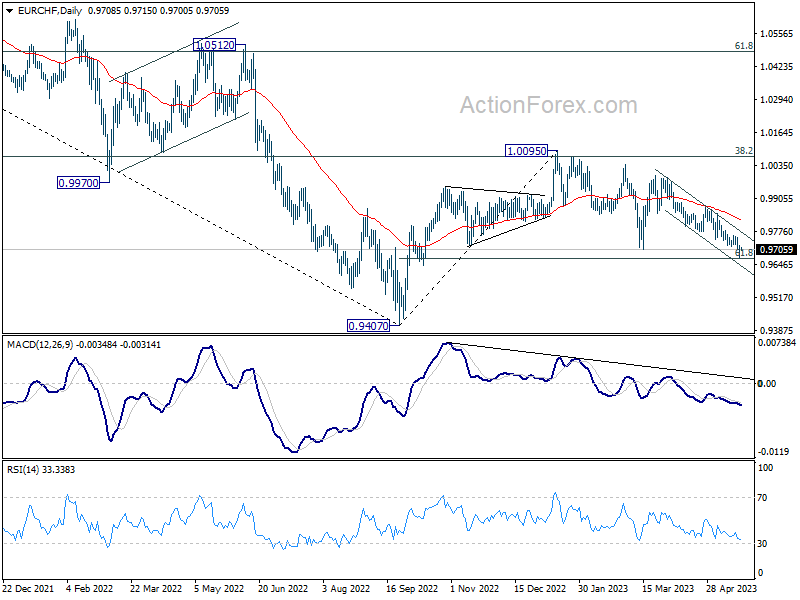
In the bigger picture, prior rejection by 38.2% retracement of 1.1149 to 0.9407 at 1.0072 suggests that medium term outlook is staying bearish. The pair is also capped below 55 W EMA (now at 0.9963). Down trend from 1.2004 is not completed yet and is in favor to resume through 0.9407 at a later stage. However, decisive break of 1.0095 resistance will raise the chance of bullish trend reversal. Rise from 0.9407 should then target 1.0505 cluster resistance (2020 low at 1.0505, 61.8% retracement of 1.1149 to 0.9407 at 1.1484).
GBPUSD Moves With Weak Momentum Within SMAs
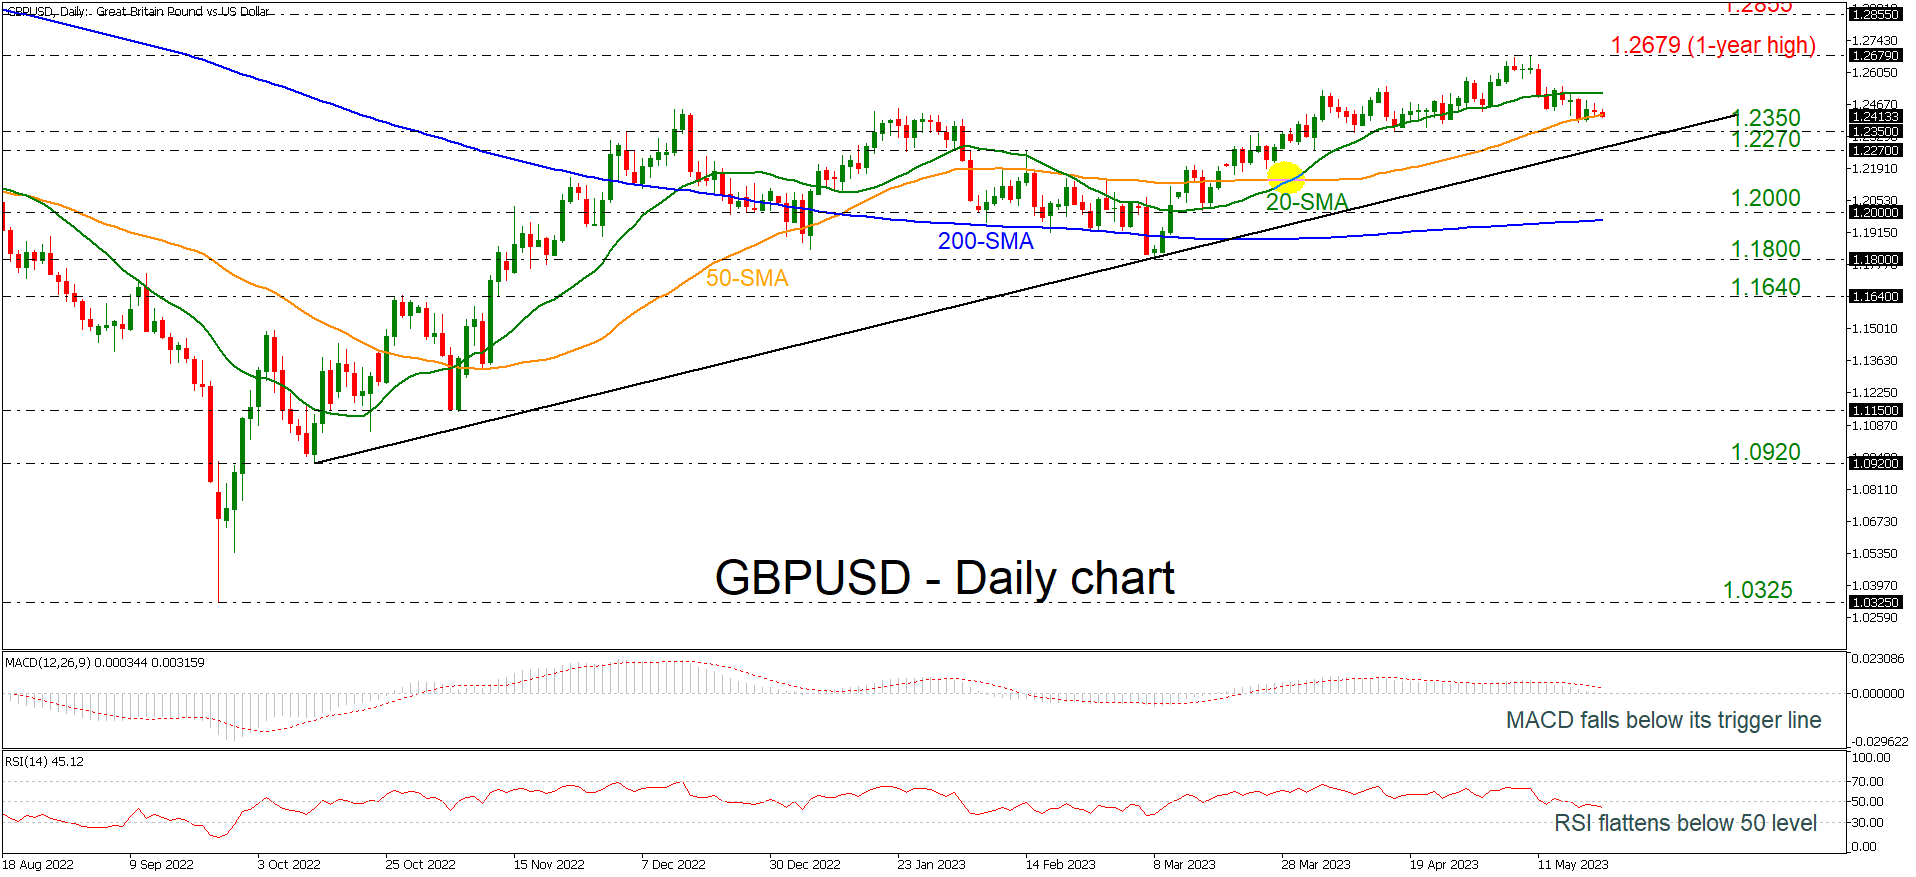
GBPUSD is moving with weak momentum within the 20- and the 50-day simple moving averages (SMAs), indicating that a sideways move may be on the cards in the short-term timeframe. The recent outlook is also confirmed by the technical oscillators as the MACD is standing below its trigger line and near the zero level, while the RSI is flattening beneath the neutral threshold of 50.
Any bullish actions above the 20-day SMA could open the way for the next key levels such as the one-year peak of 1.2679, registered on May 10, before resting near the 1.2855 barrier, which is overlapping with the 200-weekly SMA.
In the negative scenario, a successful decline beneath the 50-day SMA could reach the 1.2350 support and even lower the 1.2270 barrier, which is also near the long-term ascending trend line. If the bears drive the market below the aforementioned line, they would test the 1.2000 psychological mark and the 200-day SMA around 1.1970.
All in all, GBPUSD is still positive in the long-term view, but in the short-term the view is currently neutral after the drop within the SMAs.
Gold Has Not Lost Its Glitter (Part 2)
- Gold (XAU/USD) has dropped by -5.6% from its recent 52-week high of US$2,067.
- Recent price weakness of gold (XAU/USD) is due to the unwinding of potential long hedges and large speculators’ positions ahead of a potentially positive outcome of the US debt ceiling extension negotiations.
- Longer-term factors such as global stagflation risk and technical analysis are still in favour of a potential multi-month bullish scenario for gold.
The bullish momentum of the shiny metal, gold (XAU/USD) seems to have dissipated in the recent weeks after it printed a fresh 52-week high of US$2,067 on 4 May 2023 and thereafter staged a decline of -5.6% to hit a low of US$1,952 on last Thursday, 18 May. Click here to read Part 1 of the previous analysis.
Even though last Friday, 19 May, the price actions of gold managed to stage a rebound of +1% to close the US session at US$1,977.90 but still below its 20 and 50-day moving averages that are acting as resistances at around US$2,008 and USS$1,990 respectively.
What are the factors that are driving this bout of ongoing weakness for gold?
Firstly, it is the drama that is playing out from Washington that is centered on the soon-to-be “X-date” US debt ceiling extension deadline that falls on 1 June 2023 where the US government is at high risk of running out of cash to meet its obligations if the current debt ceiling of US$31.4 trillion is not raised on 1 June.
The aftermath is a technical default that will likely see a credit downgrade on US sovereign bonds by credit rating agencies and triggered havoc in the global markets via a significant spike in US Treasury yields that may cause global liquidity conditions to tighten and even though such an occurrence happen for a short period before brinkmanship dissipates, its adverse impact can still spark a severe risk-off behaviour among market participants.
Hence, in anticipation of such a US government debt obligation default scenario that may occur on 1 June, long hedges and speculative positions have started to build up in the past two months in safe-haven assets such as gold.
Large speculators’ net open position in gold futures hit close to 1-year high
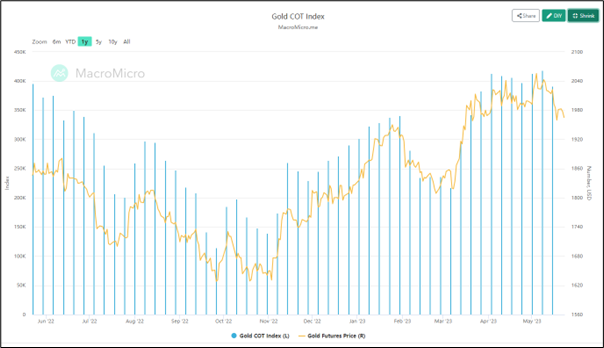
Fig 1: Gold futures net positioning trend as of 15 May 2023 (Source: MacroMicro, click to enlarge chart)
Based on the latest CFTC’s Commitments of Traders weekly report, the net open positions of large speculators in the gold futures market have increased steadily since the week of 31 October 2022. From the week of 3 April to 15 May 2023, these large speculators’ net long open positions have hovered close to a one-year high at around 395,000 contracts.
Thus, this observation on the net long open positioning of large speculators on leveraged gold-related instruments such as futures indicates a slight hint of medium-term over-optimism on the price of gold to march higher in the event of a US government default scenario.
Also in the past week, there were news reports that stated there were potential breakthroughs in the US debt ceiling limit extension negotiation talks between the Biden Administration and the House Republicans that may lead to some form of middle-ground trade-offs to agree to an extension on or before 1 June that has likely triggered some form unwinding of long hedges and speculation positions that dampen the prior bullish sentiment on gold.
Recent short-term bullish strength seen in the US dollar has reinforced gold’s weakness
In addition, the movement of the US dollar in general will tend to have an indirect correlation with gold. In the past two weeks, the US dollar has shown signs of a short-term bullish resurgence, measured by the US Dollar Index that has recorded a weekly gain of +1.4% for the week of 8 May 2023, its highest return since 19 September 2022 supported by a less dovish Fed Speak where the latest public speeches from several Federal Reserve officials have indicated a “not in favor consensus” to kickstart a fresh interest rate cut cycle in the second half of 2023.
On the contrary, there are still several long-term supporting factors that may spark another fresh round of rally in gold.
Global stagflation risk cannot be ruled out
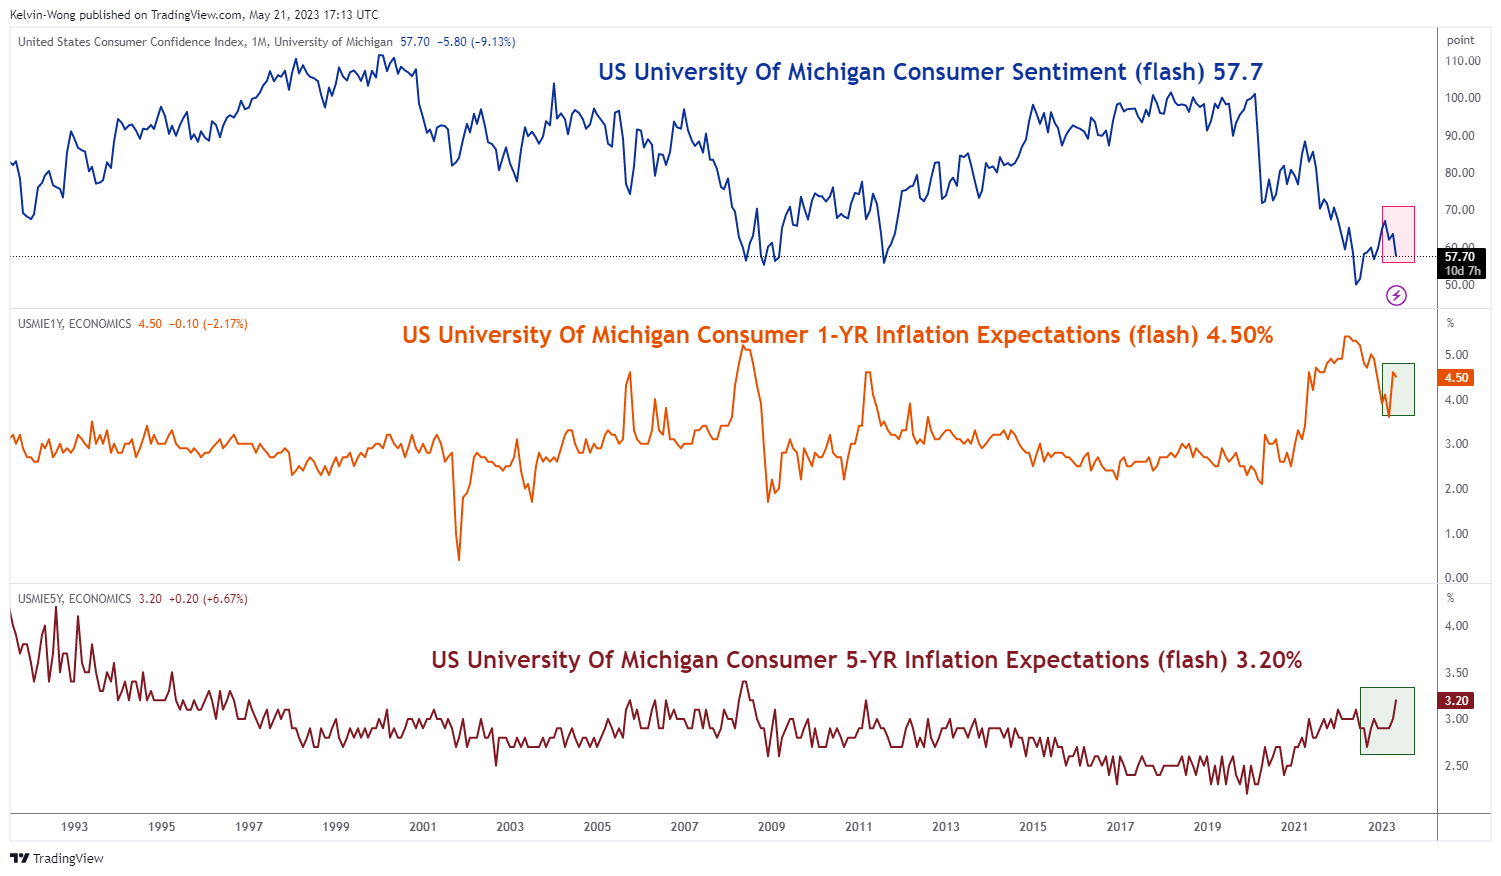
Fig 2: Preliminary University of Michigan US consumer sentiment & inflationary expectations for May
(Source: TradingView, click to enlarge chart)
Recent soft key leading economic data from the two largest economies, the US and China such as the Purchasing Managers’ Index (PMI) survey-based reports for April and the preliminary University of Michigan US consumer sentiment index for May have increased the odds of an impending global recession in the second half of the year.
Also, forward-looking inflationary pressures have appeared to be getting stickier; the preliminary University of Michigan US consumer 1-year inflation expectations reading for May have rebounded since March and remained elevated at 4.50%. In addition, the longer-term 5-year inflation expectations reading has spiked up to 3.20%, its highest level since March 2011.
Slower global growth and elevated sticky inflation is a toxic concoction that led to a stagflation environment where gold tends to outperform other asset classes in the past.
Technical analysis is still indicating a potential major uptrend in the making since September 2022 low
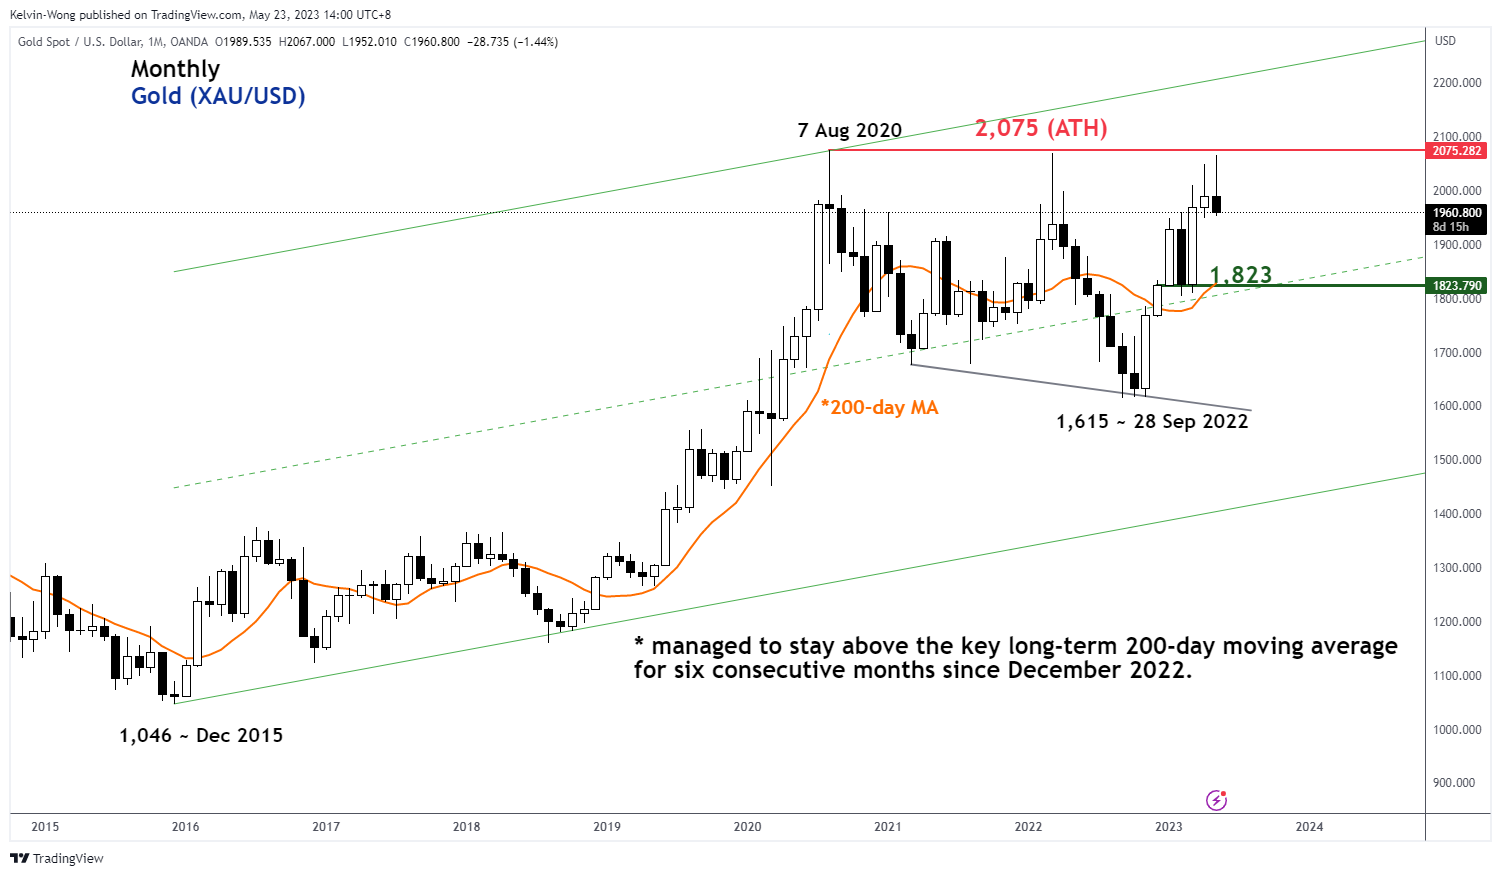
Fig 2: Gold (XAU/USD) trend as of 23 May 2023 (Source: TradingView, click to enlarge chart)
Even though the recent price actions of gold (XAU/USD) have failed to break above its current all-time high of US$2,075 printed in August 2020 on its second attempt in May 2023 with the first being in March 2022, it has managed to stay above the key long-term 200-day moving average for six consecutive months since December 2022.
This positive observation of its consecutive price actions’ duration above the 200-day moving average is the longest period recorded so far since a two-year plus consolidation from its August 2020 all-time high.
It indicates that a potential major uptrend phase is still evolving for gold since the September 2022 low of US$1,615 which may support further potential upside going forward.
USD/CAD Daily Outlook
Daily Pivots: (S1) 1.3488; (P) 1.3504; (R1) 1.3521; More....
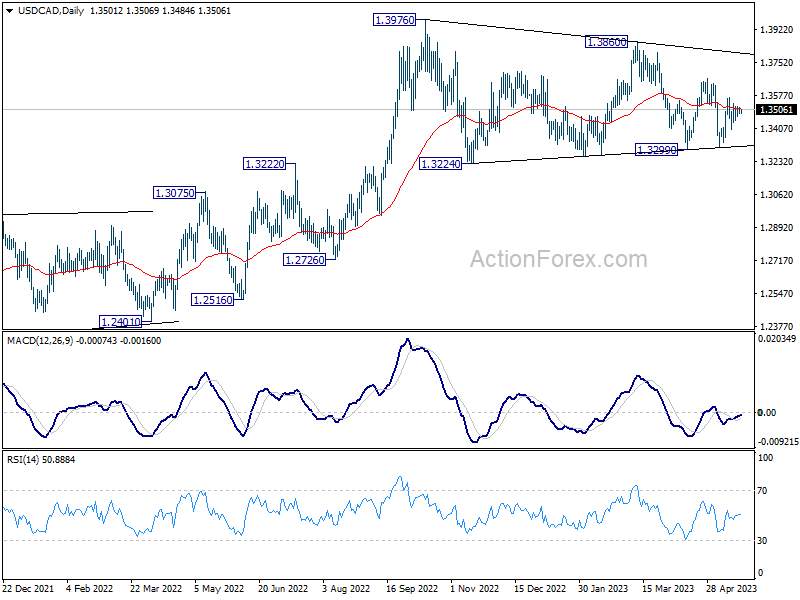
Intraday bias in USD/CAD remains neutral and outlook is unchanged. Overall, the pair is seen as extending the triangle consolidation pattern from 1.3976. Above 1.3566 will resume the rebound from 1.3313 towards 1.3666 resistance and then 1.3860. However, firm break of 1.3313 support will invalidate this view and indicate that deeper correction is underway.
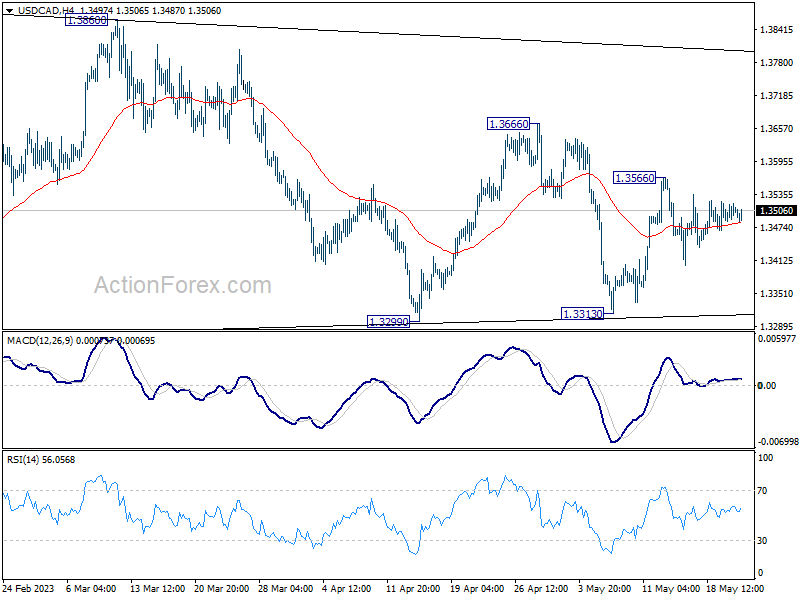
In the bigger picture, as long as 55 W EMA (now at 1.3333) holds, up trend from 1.2005 (2021 low) is still in favor to resume through 1.3976 at a later stage. However, sustained trading below the EMA and 38.2% retracement of 1.2005 to 1.3976 at 1.3233 will raise the chance of bearish reversal. Deeper should then be seen to 61.8% retracement at 1.2758 next.
AUD/USD Daily Report
Daily Pivots: (S1) 0.6630; (P) 0.6649; (R1) 0.6671; More...
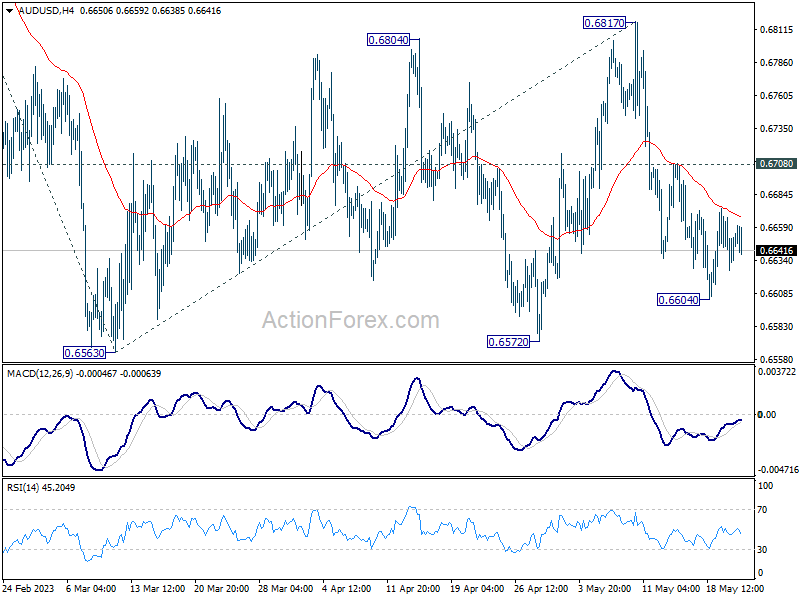
Intraday bias AUD/USD stays neutral at this point. Further decline is in favor as long as 0.6708 resistance holds. Below 0.6604 will bring retest of 0.6563 low first. Decisive break there will resume larger decline from 0.7156 to 61.8% projection of 0.7156 to 0.6563 from 0.6817 at 0.6451. On the upside, above 0.6708 minor resistance will delay the bearish case, and extend the corrective pattern from 0.6563 with another rising leg.
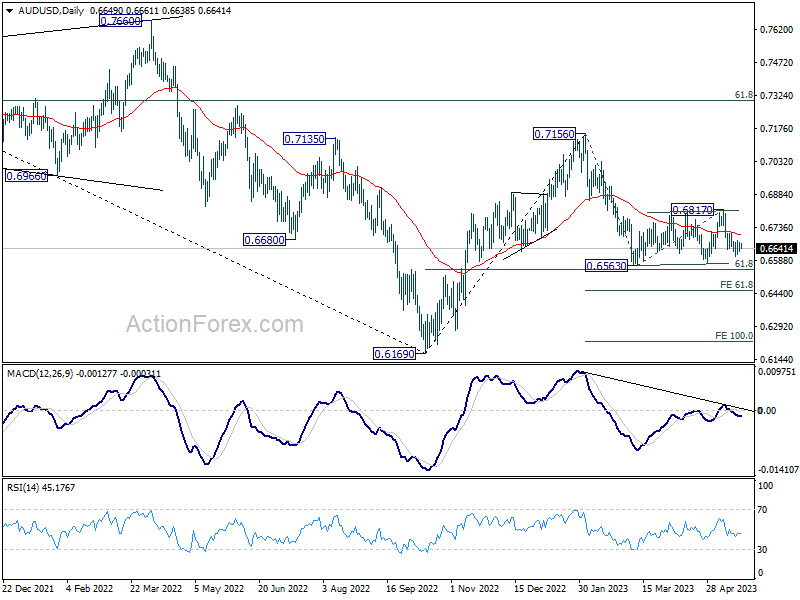
In the bigger picture, the failure to break through 55 W EMA (now at 0.6822) keeps medium term outlook bearish. Firm break of 61.8% retracement of 0.6169 to 0.7156 at 0.6546 will raise the chance of long term down trend resumption through 0.6169 low. This will now be the favored case as long as 0.6817 resistance holds.
EUR/USD Daily Outlook
Daily Pivots: (S1) 1.0795; (P) 1.0813; (R1) 1.0830; More...
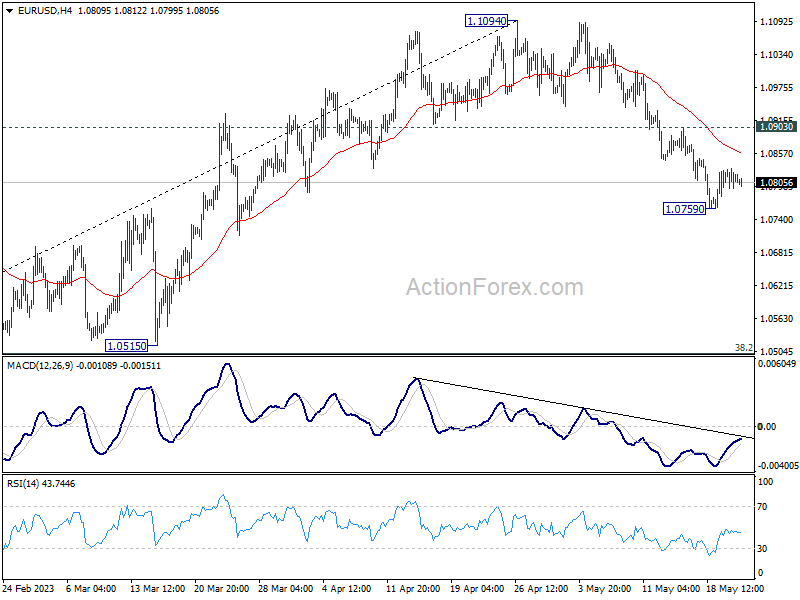
No change in EUR/USD's outlook as consolidation continues above 1.0759. Deeper decline is expected as long as 1.0903 resistance holds. Fall from 1.1094 is seen as correcting whole up trend from 0.9534. Below 1.0759 will target 1.0515 cluster support, 38.2% retracement of 0.9534 to 1.1094 at 1.0498. On the upside, though, firm break of 1.0903 will bring stronger rebound back to retest 1.1094 high instead.
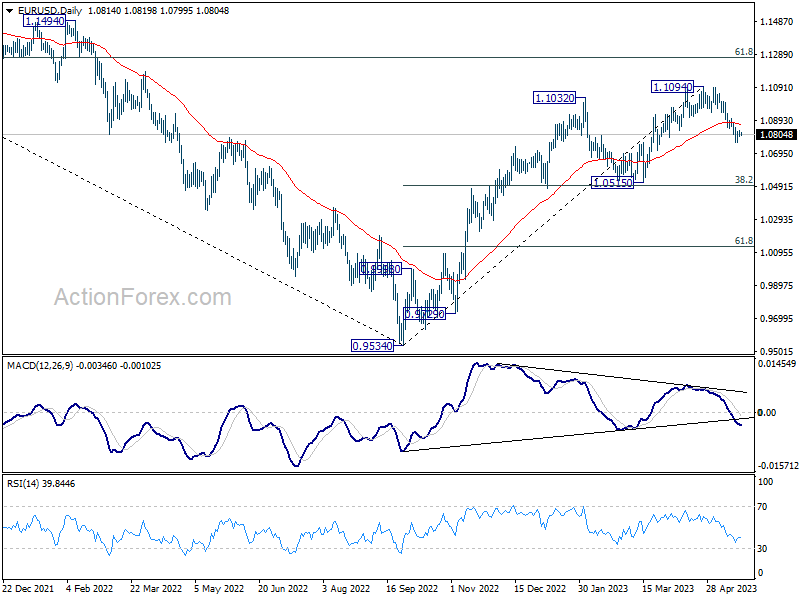
In the bigger picture, as long as 1.0515 support holds, rise from 0.9534 (2022 low) would still extend higher. Sustained break of 61.8% retracement of 1.2348 (2021 high) to 0.9534 at 1.1273 will solidify the case of bullish trend reversal and target 1.2348 resistance next (2021 high).
GBP/USD Daily Outlook
Daily Pivots: (S1) 1.2410; (P) 1.2441; (R1) 1.2469; More...
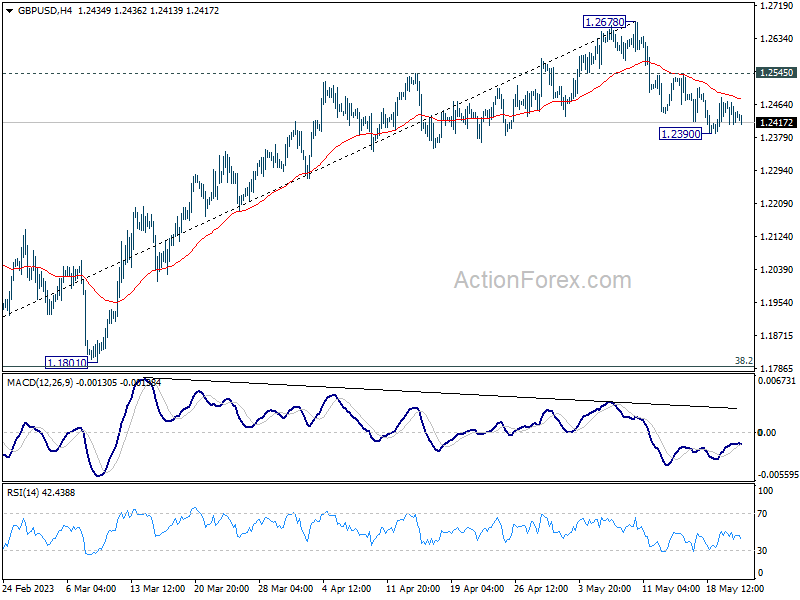
Intraday bias in GBP/USD remains neutral and fall from 1.2678 short term top is expected to continue as long as 1.2545 resistance holds. On the downside, sustained trading below 55 D EMA (now at 1.2395) should confirm that it's already in correction to whole up trend form 1.0351. Deeper fall should then be seen to 1.1801 cluster support (38.2% retracement of 1.0351 to 1.2678 at 1.1789). On the upside, however, break of 1.2545 will bring stronger rebound back to retest 1.2678 high.
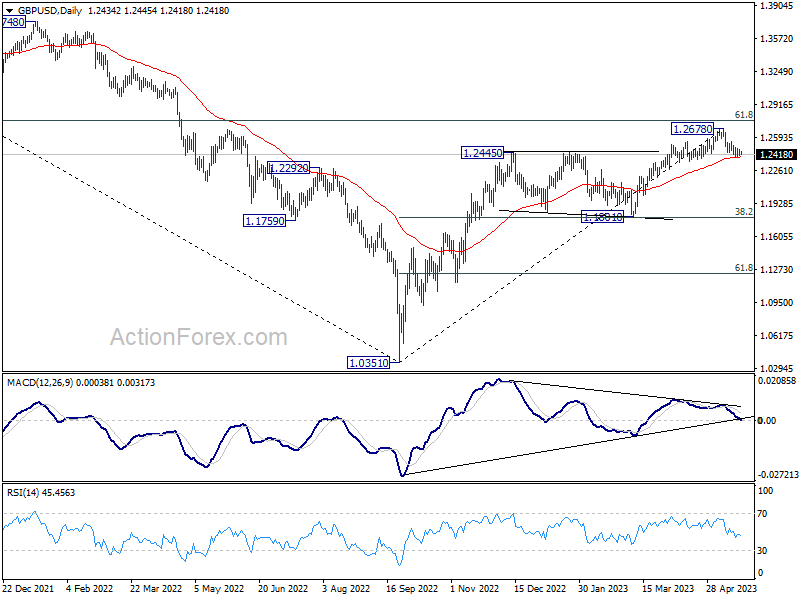
In the bigger picture, as long as 1.1801 support holds, rise from 1.0351 medium term bottom (2022 low) is expected to extend further. Sustained break of 61.8% retracement of 1.4248 (2021 high) to 1.0351 at 1.2759 will add to the case of long term bullish trend reversal. However, firm break of 1.1801 will indicate rejection by 1.2759, and bring deeper decline, even as a correction.
USD/CHF Daily Outlook
Daily Pivots: (S1) 0.8947; (P) 0.8972; (R1) 0.9004; More...
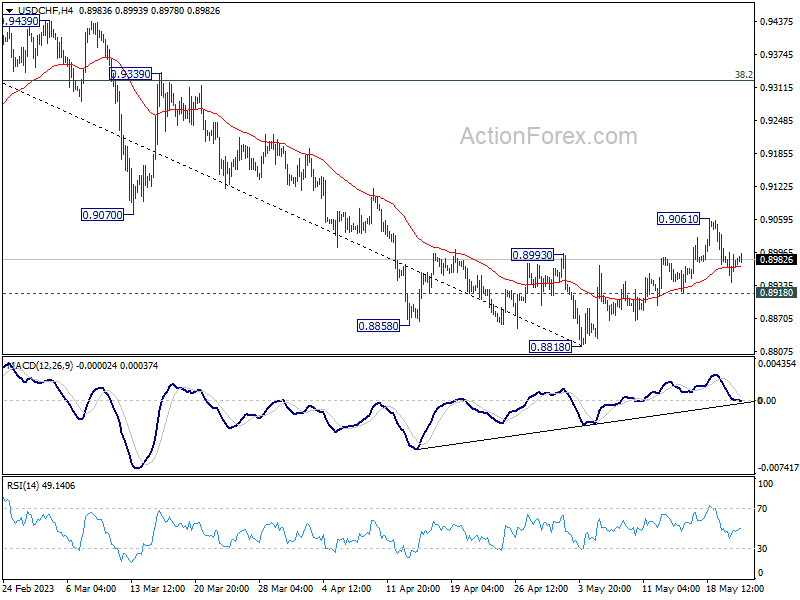
Intraday bias in USD/CHF remains neutral at this point, and outlook is unchanged. Rebound from 0.8818 short term bottom is expected to continue as long as 0.8918 minor support holds. On the upside, sustained trading above 55 D EMA (now at 0.9039) should confirm that current rally is at least correcting whole down trend from 1.0146. Further rise should then be seen to 38.2% retracement of 1.0146 to 0.8818 at 0.9325. On the downside, though, break of 0.8918 will bring retest of 0.8818 low instead.
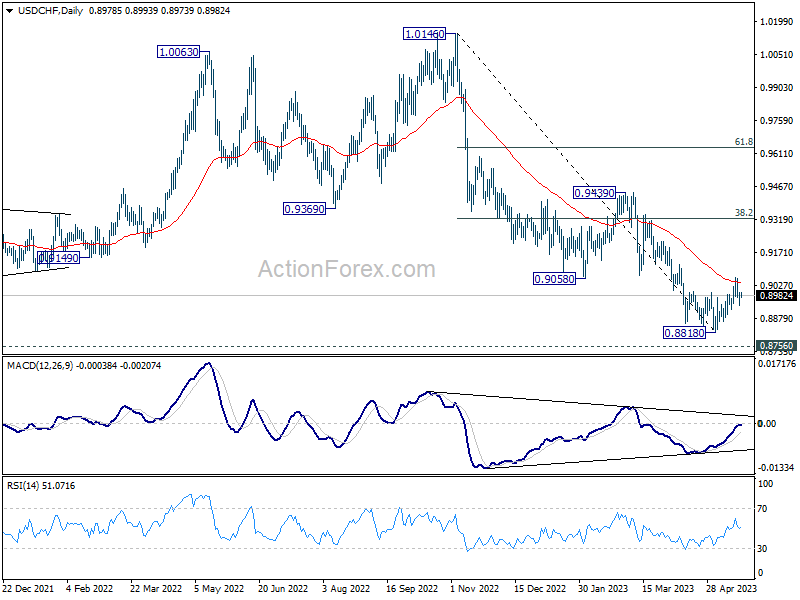
In the bigger picture, fall from 1.1046 (2022 high) is seen as a leg in the long term range pattern from 1.0342 (2016 high). So, downside should be contained by 0.8756 to bring reversal. Sustained break of 0.9058 support turned resistance will be the first sign of medium term bottoming. However, decisive break of 0.8756 will carry larger bearish implications.
Fed’s Two Biggest Hawks Yesterday Coloured Trading
Markets
The Fed’s two biggest hawks yesterday coloured trading which until then turned out to be non-directional. Kashkari from the Minneapolis Fed said it’s a close call between a pause and a hike in June, adding that the former wouldn’t mean tightening is over per se. St. Louis Fed president Bullard called US recession worries overstated and expects some 50 bps more rate hikes sooner rather than later this year. SF’s Daly and Atlanta’s Bostic argued for caution but their comments were largely dismissed. US yields went from losing almost 5 bps to similar-sized gains at the front end of the curve. Longer tenors also added between 3.8-4.2 bps. German yields followed suit, adding 3.1-5.2 bps with the front underperforming. ECB’s Villeroy warned about persistent underlying price pressures. Especially services inflation needs to be monitored as it is likely to become the dominant inflation source. Peripheral spreads narrowed with Greece hugely outperforming (-17 bps, to the lowest since Nov 2021) following incumbent PM Mitsotakis’s election victory last Sunday. FX markets were stoic. EUR/USD (barely) held above 1.08 and EUR/GBP (0.869) tried to leave the recent lows behind. Stocks finished slightly lower in Europe. Wall Street closed mixed as investors awaited the outcome of another round of debt ceiling talks. Those concluded during Asian trading on a more upbeat note, even though there is no deal yet. Catching the eye this morning is excess volatility in the Turkish lira for a second day straight (see below). USD/TRY surged yesterday and this morning past 20 before paring gains back below in a sign how authorities are struggling to keep TRY-depreciation in check. The Japanese yen ekes out a tiny gain following strong May PMI business confidence (cf. infra). The US dollar in general trades a tad stronger.
PMIs are going from Japan this morning to Europe, the UK and US later today. Expectations are for a slight easing in all of the three areas, mostly on the account of the services sector. At 53 (composite) or more that would, all in all, still mean solid economic growth. The May edition will capture the effect, if any, of the March financial turbulence in full, suggesting risks today are tilted to the downside. In this case it could temporarily mark an end to the core bond yield rebound over the past few days, especially in the US. The picture is more nuanced in Europe. As such it may also help EUR/USD find a bottom after the May decline. If, however, such a downward surprise doesn’t materialize, we expect the turmoil and (credit crunch) worries related to it to move to the background, at least in the short run, allowing core bond yields and the USD to extend gains.
News Headlines
The Jibun Japan May PMI’s indicated that growth in the economy continued at the fastest pace since October 2013. The composite PMI, compiled by S&P, rose to 54.9 from 52.9 in April. It was the fifth consecutive reading above the 50 mark that separates growth from contraction. Growth still was mainly driven by activity in the services sector. The services PMI rose to a record rate for survey (56.3 from 55.4) reflecting sustained improvements in private consumption and international tourism post COVID-19. PMI data also indicates that service activity continues to fare strongly and has yet to reach the end of the current boom cycle. Employment levels within Japan's service sector also expanded at the second fastest pace on record. Manufacturing output expanded at a slower pace, but, but also returned in positive territory (50.8 from 49.5). The Flash PMI suggests that inflationary pressures eased from April, but stay elevated. Input cost inflation rose at its slowest rate for 17 months, but is still running well above the average level in May. Output price inflation eased to its 12-month average but remained consistent with Japan's CPI staying elevated in mid-year. The yen this morning rebounds marginally after touching the lowest levels since end November (USD/JPY 138.5 area).
It’s Like Watching an American Film
Yesterday was just another day with the same topics. The US debt ceiling talks continued; US President Joe Biden expressed optimism about reaching a deal. US Treasury Secretary Janet Yellen said that the Treasury will soon be running out of money and won’t be able to service its debt.
The US 2-year yield pushed higher to above 4.30%, the S&P500 was little changed near levels last seen last summer, while Nasdaq 100 advanced to levels above last summer peaks and is now trading at the highest levels since April 2021.
Interestingly however, gold doesn’t see much demand despite the looming debt ceiling talks. Inflows remain limited and the price pressures are to the downside. The stronger US dollar and higher yields weigh on gold appetite at a time investors would be ready to take on higher opportunity costs due to rising default risk.
But the fact that equities remain strong despite the rising yields, and that gold sees limited safe-haven inflows point that investors watch the US debt ceiling saga as an American film knowing that there will eventually be a happy ending…
Two more hikes?
Federal Reserve (Fed) officials remain surprisingly hawkish. It’s just yesterday that St Louis Fed President Bullard – who is happily not a voting member this year – said he would back two more rate hikes in 2023. Minneapolis Fed’s Kashkari said that even if the Fed decided to bypass a rate hike in June, it should make sure to investors that tightening is not over.
That, with the fact that the US Treasury will be refilling its General Account as soon as a debt ceiling deal is reached, means that the financial and liquidity conditions will tighten in the next few months, rather than the contrary.
And that’s not necessarily good news for stocks.
In the short run, however, a resolution to the debt ceiling saga will likely trigger a further positive push in stocks before the liquidity headache kicks in. In this context, we will likely see the S&P500 clear the 4200 resistance with the news of an eventual debt ceiling deal, before the winds turn south.
Flash PMIs
In Japan, the flash PMI data showed that services expanded faster in May, while manufacturing unexpectedly turned to expansion. With such a massive support from the Bank of Japan (BoJ), it’s good news that the Japanese manufacturers are feeling better despite the soft yen which makes the cost of raw material more expensive by the day. The USDJPY is approaching the 139 level. Softer yen means that inflation in Japan will only get worse if the BoJ doesn’t step in. But until then, the widening spread between the Japanese and US rates support a further advance in USDJPY toward the 140 psychological mark.
Elsewhere, the EURUSD remains bid around the 1.08 mark, with manufacturing PMI seen slightly less in contraction than the previous month. A better-than-expected set of data could help fuel the European Central Bank (ECB) hawks and give a positive spin to the euro at the current levels. The ECB Chief Lagarde and Spanish central bank head de Cos reiterated their hawkish stance over the past couple of days saying that the ECB is already at an advanced tightening level, but that the bank will continue raising rates and will keep them at restrictive levels to bring inflation back to the 2% policy target. Given that the ECB doesn’t deal with a banking crisis and political shenanigans, the hawkish call from its members is more credible than their colleagues across the Atlantic Ocean. Therefore, the medium-term outlook for the euro remains positive, yet the short-term direction will mostly depend on the US dollar appetite into the US debt ceiling deadline. The rising US yields and safe haven demand support the US dollar in the actual context of uncertainty, and the dollar could hold on to its gains in the coming days.
In energy
US crude remains in a tight range above the $70pb level. Bulls are skeptical as the looming debt ceiling talks in the US are not ideal for appetite, but bears are rare below the $70pb level as the lower the price the higher the risk of another OPEC intervention at the next meeting which will take place at the beginning of next month.
Until then, we will likely see strong resistance into the 50-DMA, which stands around $74.50 mark, and into the 100-DMA, which is just shy of $76pb.