

Sample Category Title
First Impressions: RBNZ Monetary Policy Statement May 2023
The RBNZ tightened by 25 points to 5.5 percent and expressed confidence that this will be sufficient to bring inflation back to target. We continue to see risks that the large migration surge will ultimately require more action after July.
RBNZ Monetary Policy Statement, May 2023
The RBNZ increased the OCR as expected to 5.5 percent.
However, the big surprise was in the forward profile, in which the RBNZ strongly suggests that it is on hold from here until at least mid-2024. We see some upside risks to the RBNZ’s view, but for now see the RBNZ on hold in July, with some potential of a 25 point rise in the OCR in August.
Migration pressures are acknowledged, but the RBNZ takes a sanguine view on their impact on capacity pressures. The RBNZ’s net migration estimates are higher and imply a net 75,000 net inflow in the year to December. This is only slightly lower than Westpac’s equivalent forecast of a net 83,000 inflow (on a working-age population basis). Despite the upgrade, the RBNZ’s view is that this adds significantly to supply as well as demand. Migration is seen as having some supportive impact on house prices but by not as much as we have taken in our recent Economic Overview.
The RBNZ has upgraded its view on potential output growth, which means it has higher growth but less inflation. Implicitly, migration is adding to the economy’s capacity in tandem with demand on resources, allowing the economy to grow more strongly without adding to inflation pressures.
Government spending is not seen as a significant driver of inflation pressures. The RBNZ has inserted the recent Budget estimates into its projections and takes a sanguine view on any inflation implications. While government is adding somewhat to inflation pressures in the next year, the RBNZ’s view is that the assumed fiscal consolidation in later years will balance out those pressures.
Ongoing emphasis on pipeline tightening pressures seen as sufficient to reduce inflation significantly. There is considerable emphasis on the pipeline of interest rate increases still to be felt by households and businesses. As a result, consumer spending and residential investment are forecast to remain weak.
For the first time the Committee held a vote on the OCR decision, debating between no change and a 25 point hike. Two members voted for no change and the others for the 25 point increase. Some members discussed potential upside risks to house prices and the economy from migration, but on balance the MPC felt sufficiently confident that a 5.5 percent OCR will be sufficient to balance those risks.
The bottom line is that this is a central bank that sees itself on hold for a protracted period. Key risk factors are likely to be around the judgement of the RBNZ that the quite significant boost in population growth will quickly reverse and not add to housing market or inflation pressures. Data on house prices and migration will be important to watch in that regard. Similarly labour market indicators will be important to watch.
We now see the RBNZ on hold in July, but some potential of a 25 point rise in the OCR in August. Should this not eventuate we anticipate the RBNZ to remain on hold until after the election in October. By this time we expect that the housing market and migration pressures will be showing up fairly strongly and require a further adjustment in the OCR to the 5.75-6.00 percent range.
Technical Outlook and Review
DXY:
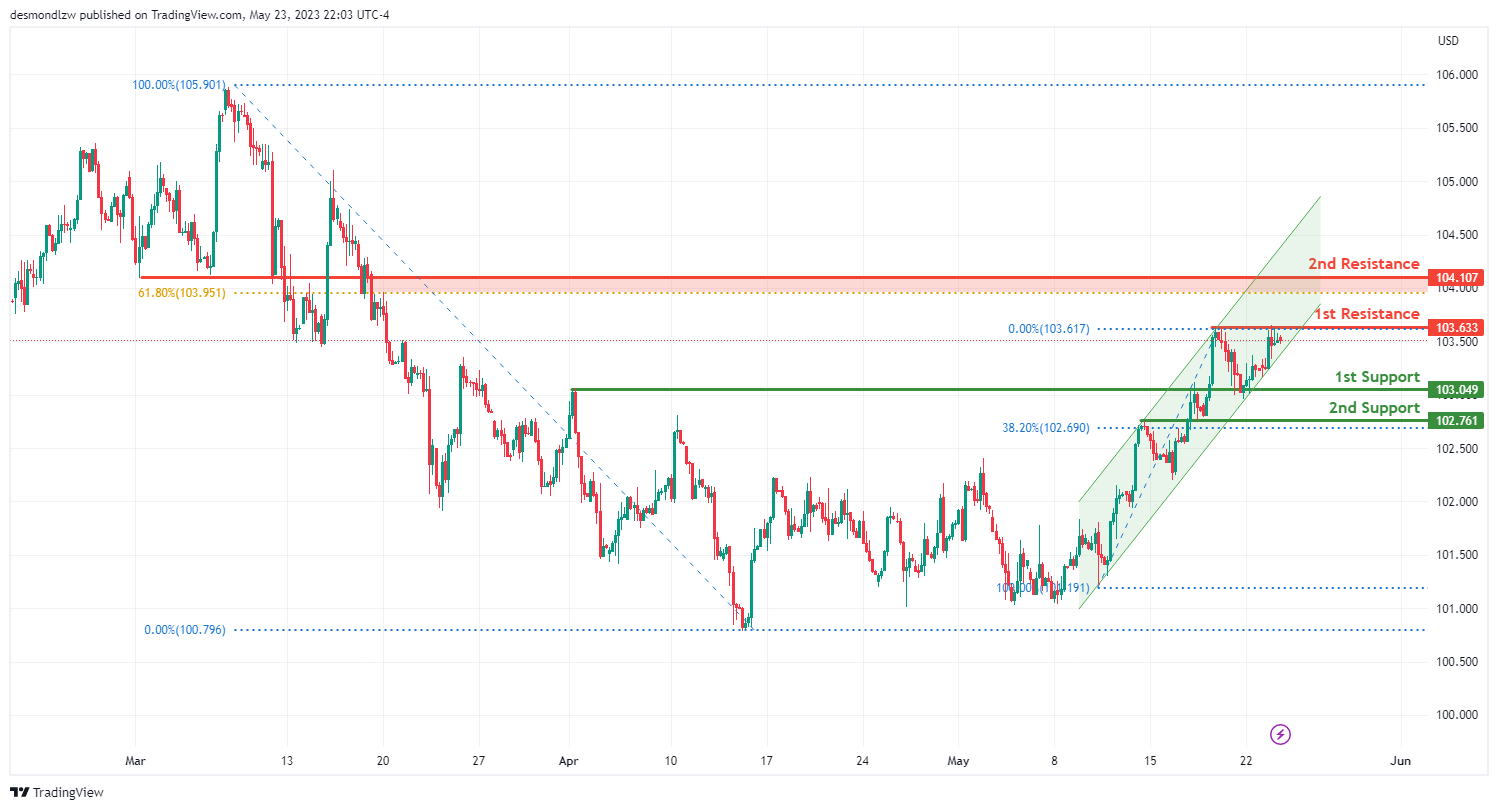
The DXY instrument is currently exhibiting a bullish trend, with the price moving in a bullish ascending channel. This indicates that the momentum is upwards and the price could potentially continue towards the first resistance level.
The first support level is located at 103.04, which acts as an overlap support and corresponds to the 38.20% Fibonacci retracement level. Overlap supports are levels that have historically acted as both support and resistance, and in conjunction with a significant Fibonacci level, this could provide a solid base for the price.
The second support level is at 102.76 and is also considered an overlap support. This could act as another potential floor for the price in the event of a retracement.
On the other hand, if the bullish momentum continues, the price could encounter resistance at 103.63, which represents a multi-swing high resistance level. This means that the price has peaked and reversed at this level on multiple occasions in the past, making it a significant barrier.
The second resistance level is at 104.10 and is characterized as a pullback resistance. This level is significant as it aligns with the 61.80% Fibonacci retracement level, which could act as a critical barrier to price increases. If the price retraces but fails to break through this level, it could signal a continuation of the bullish trend.
EUR/USD:
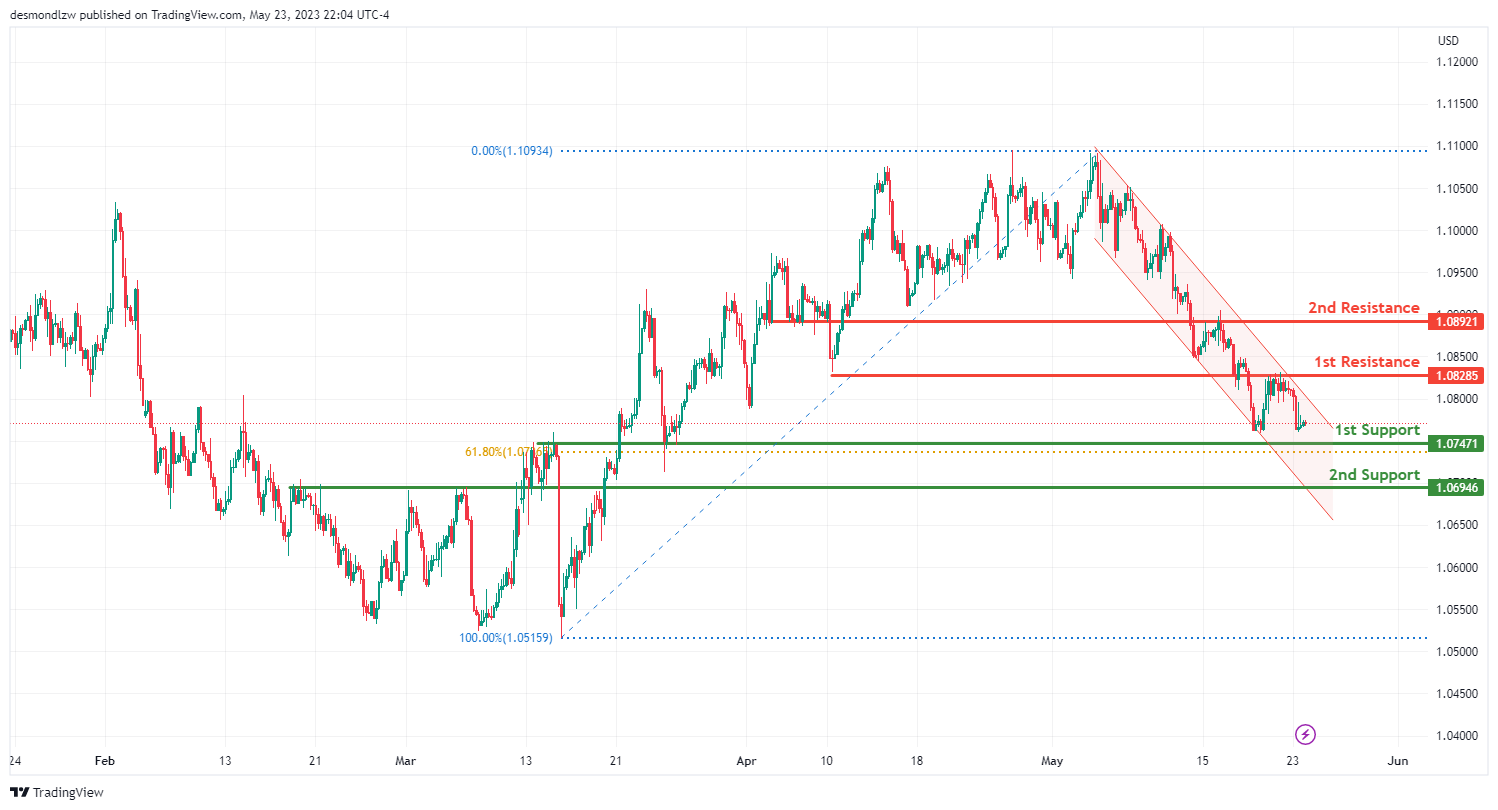
The EUR/USD pair is currently showing a bearish trend, with the price in a bearish descending channel. This suggests that there is potential for a bearish reaction off the first resistance level and a drop towards the first support level.
The first support level is set at 1.0747 and is an overlap support, which means it has historically served as both support and resistance. This could potentially provide a solid base to stop or reverse any further price decline.
The second support level is at 1.0649, which also acts as an overlap support, providing another potential floor for the price in the event of a downward movement.
On the other hand, should the price attempt to reverse its bearish trend, it could face resistance at 1.0828, which acts as an overlap resistance. This level could potentially halt an upward price movement.
The second resistance level is found at 1.0892, serving as another overlap resistance. If the price reaches this level, it might find it challenging to continue its upward trajectory and may instead reverse back towards its support levels.
GBP/USD:
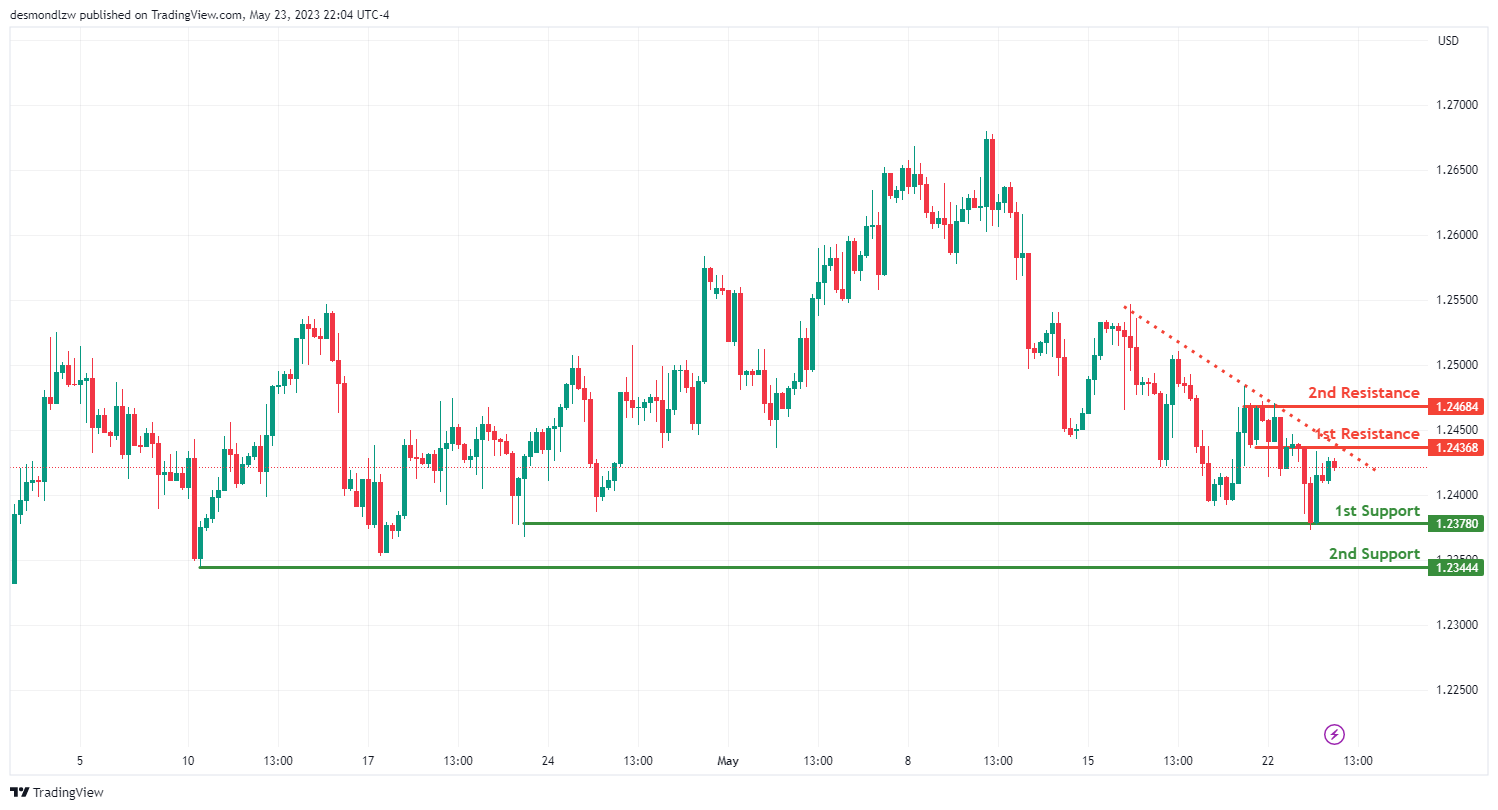
The GBP/USD pair is currently in a bearish trend, suggesting that bearish momentum is on the cards due to the price being below a major descending trend line.
The first level of support is at 1.2378, which is a multi-swing low support, indicating it is a point where the price has bottomed out multiple times in the past. This makes it a potentially strong level to halt further price drops.
The second support level is at 1.2344, acting as a swing low support, which is a point where the price has previously bottomed out, indicating its potential as a floor to prevent further declines.
On the other hand, should the price attempt to reverse its current trend, it will face resistance at 1.2436, an overlap resistance level that may potentially halt an upward price movement.
The second resistance level is at 1.2468 and is recognized as a multi-swing high resistance, meaning it has capped price increases multiple times in the past and could potentially do so again in the future.
USD/CHF:
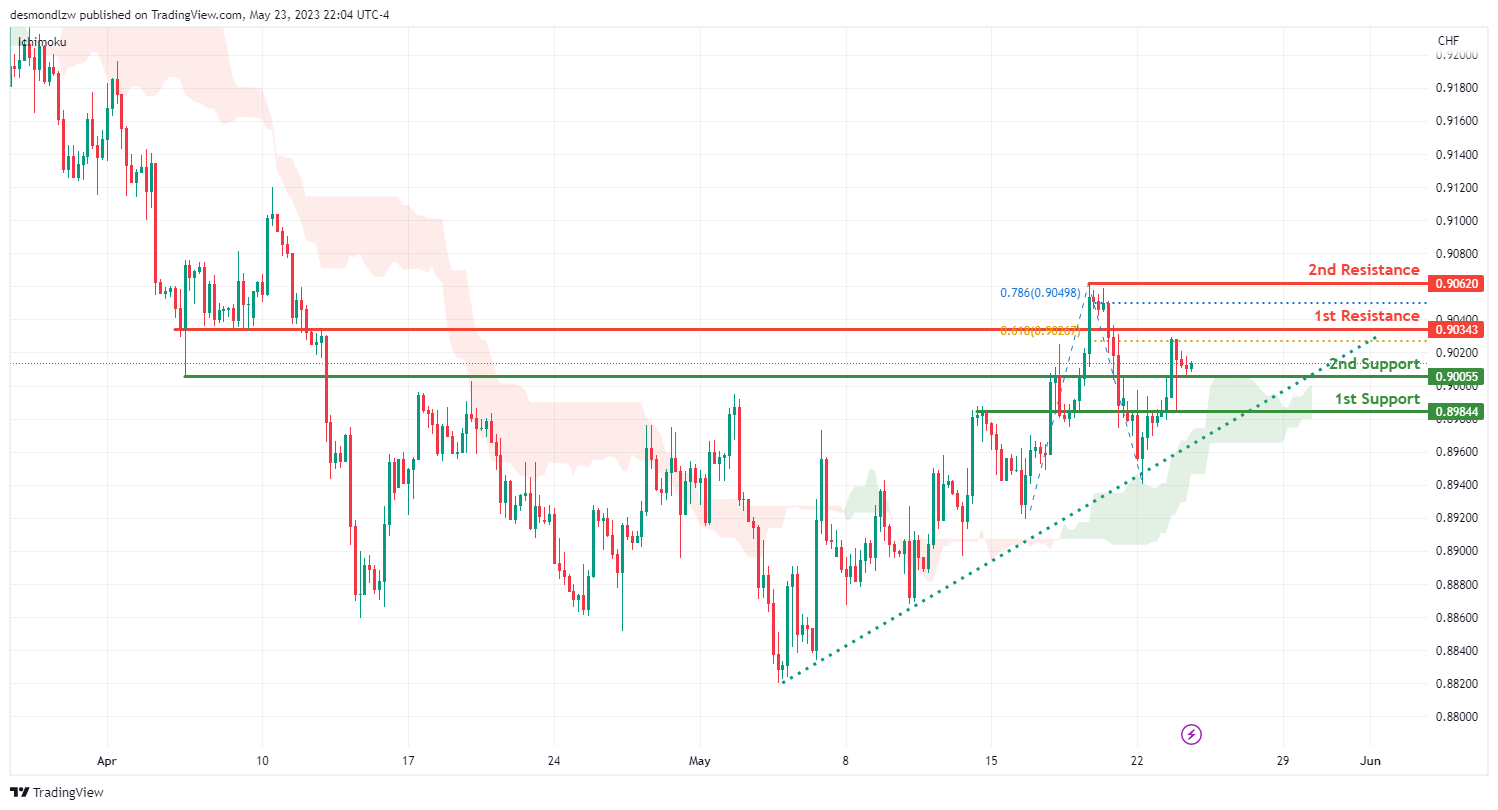
The USD/CHF pair is presently in a bullish trend, suggesting potential further bullish momentum. This is supported by the price being above a major ascending trend line and above the bullish Ichimoku cloud
The first level of support is at 0.9005, identified as an overlap support. This means the level has historically functioned as both support and resistance, potentially stopping any price decline.
The second support level is at 0.8984, also an overlap support, reinforcing its potential as a floor level to halt further drops.
On the upside, the first resistance level stands at 0.9034. This is an overlap resistance and aligns with the 61.8% Fibonacci retracement level, potentially acting as a significant barrier to any price increases.
The second resistance level is at 0.9062, which functions as a multi-swing high resistance. This means the level has historically halted price increases multiple times, potentially indicating a reversal in the future.
USD/JPY:
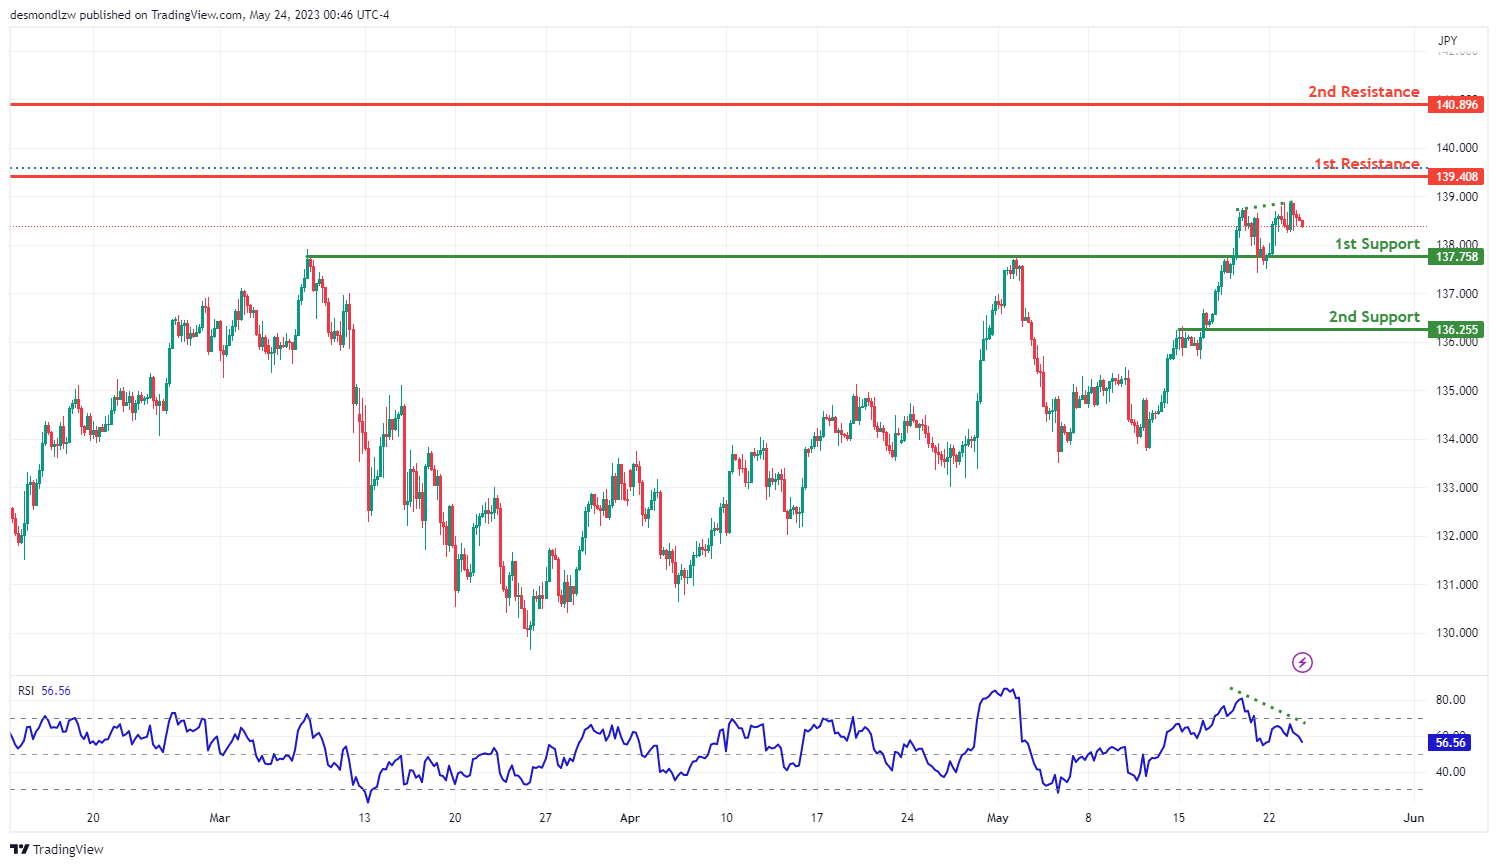
The USD/JPY pair currently shows a bearish trend, suggesting a potential continuation of price decline towards the first support level.
The first level of support is at 137.75, serving as a pullback support. Pullback supports typically signal levels where the price has previously rebounded after a short-term retracement, making it a potential stopping point for further price declines.
The second support level is at 136.25, known as an overlap support. Overlap supports have historically acted as both resistance and support, indicating it could halt or reverse any further downward movement in the pair.
On the other hand, if the price reverses direction, the first resistance level is at 139.40. This level is seen as a swing high resistance, a point at which the price has previously reversed after increasing.
The second resistance level is at 140.89, also a swing high resistance. These levels are significant as they have historically capped price increases.
Furthermore, the Relative Strength Index (RSI) is showing bearish divergence compared to the price, which often suggests a forthcoming rapid decline in price
AUD/USD:
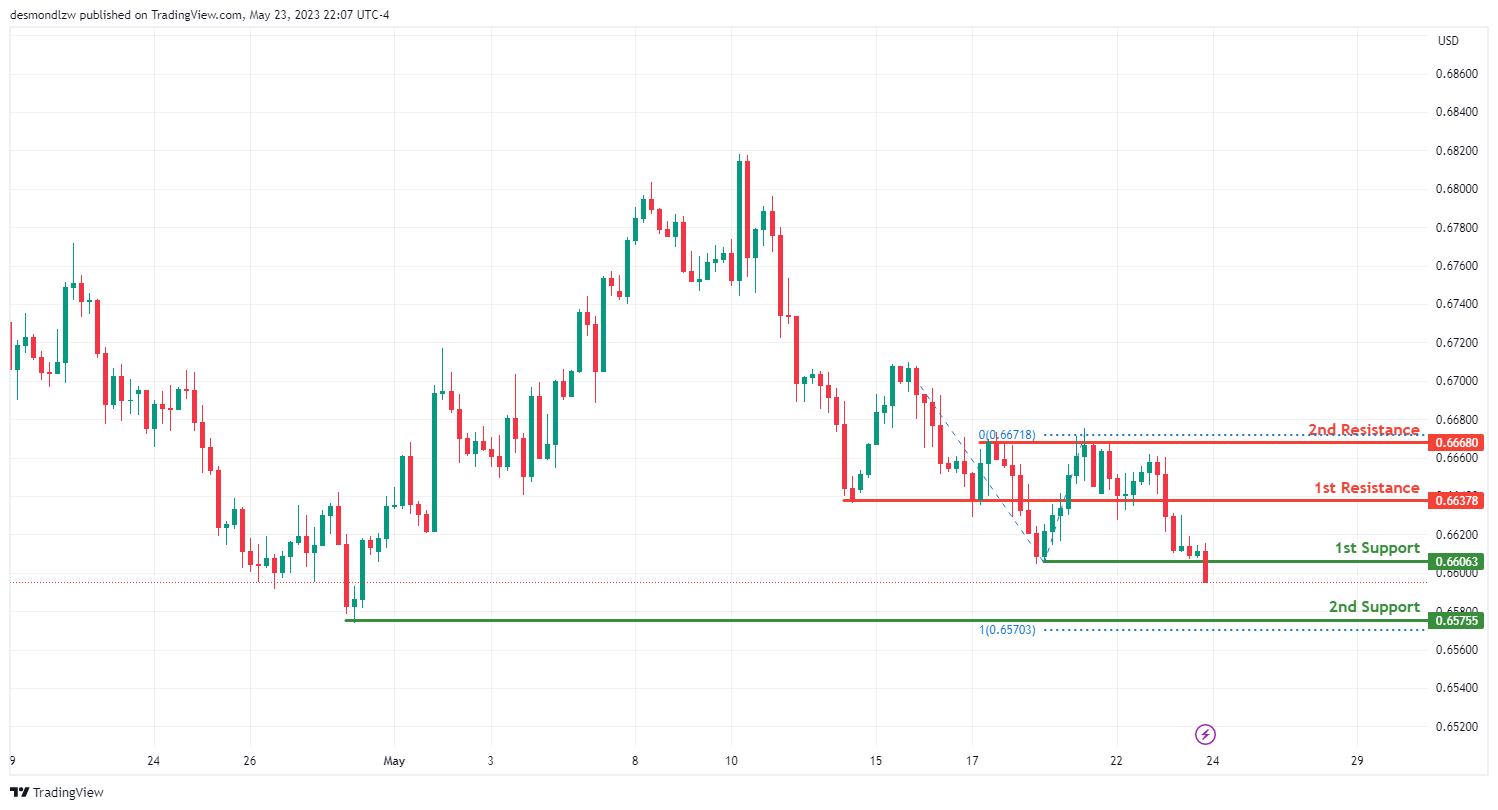
The AUD/USD pair is currently demonstrating a bearish trend, suggesting a potential bearish break off the first support level and a drop towards the second support level.
The first level of support is at 0.6606, representing a multi-swing low support. This suggests that this level has acted as a floor multiple times in the past, making it a strong potential support level.
The second support level is at 0.6575 and is identified as a swing low support. This is a price point where the value has historically bottomed out, making it a potential floor for further price declines.
On the other hand, if the price were to reverse, the first resistance level is at 0.6637, acting as a pullback resistance. This level represents a point where the price has previously stopped and reversed after a retracement.
The second resistance level is located at 0.6668, acting as a multi-swing high resistance and aligning with the 100% Fibonacci projection level. This suggests that it could be a significant barrier to price increases.
NZD/USD
The NZD/USD pair is currently on a bearish trend, suggesting a potential bearish break from the first support level and a drop towards the second support level.
The first support level is at 0.6166, and it’s considered an overlap support. Overlap supports have historically acted as both resistance and support, indicating that this level could potentially halt a price decline.
The second support level is at 0.6124, characterized as a multi-swing low support. This suggests that this level has acted as a floor multiple times in the past, reinforcing its potential as a crucial support level.
On the upside, if the price reverses its trend, the first resistance level is at 0.6265. This level is recognized as an overlap resistance, which could act as a significant barrier to price increases.
The second resistance level is at 0.6302, functioning as a swing high resistance, and it’s also at the 100% Fibonacci projection level. This suggests that it could be a significant point of price reversal.

USD/CAD:
The USD/CAD chart currently exhibits bullish momentum, suggesting the potential for further upward movement.
In the short term, there is a possibility of a bullish continuation towards the first resistance level at 1.3529. This resistance level is identified as an overlap resistance, indicating its significance as a potential price ceiling.
Additionally, there is a second resistance level at 1.3581, recognized as an overlap resistance and coinciding with a 78.60% Fibonacci retracement. This level further reinforces the potential for resistance in case of a price increase.
On the support side, the first support level at 1.3421 is an overlap support, which may provide a price floor and support any potential pullbacks.
Furthermore, there is a second support level at 1.3335, identified as an overlap support, further contributing to the potential for support in case of a price decline.

DJ30:
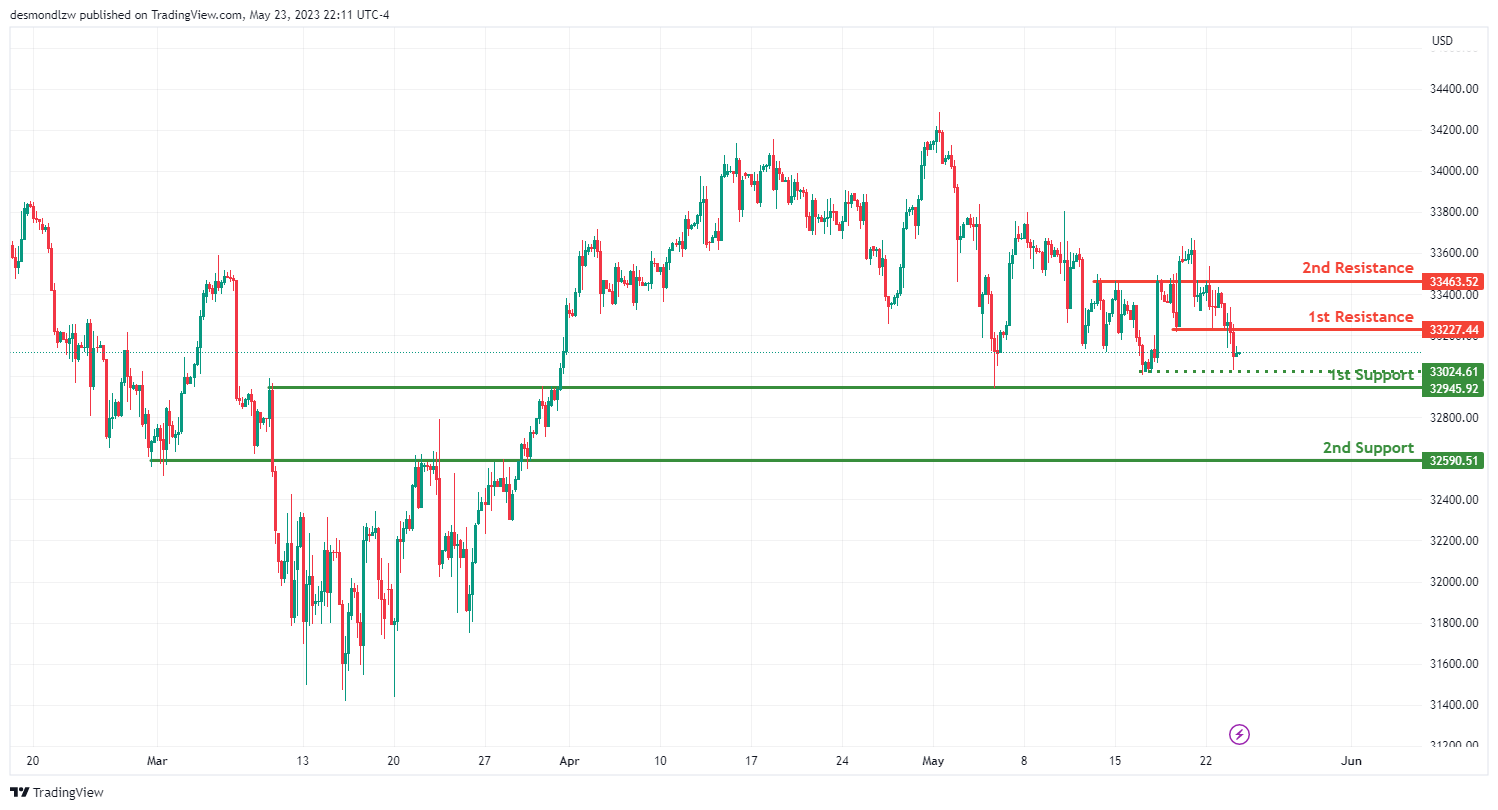
The DJ30 chart currently demonstrates a bearish momentum, indicating the potential for further downward movement.
In the short term, there is a possibility of a bearish continuation towards the first support level at 32945.92.
The first support level at 32945.92 is identified as an overlap support, suggesting it could act as a price floor if the price were to decline.
Additionally, there is a second support level at 32590.51, recognized as an overlap support, providing further support in case of a price decline.
In between, there is an intermediate support level at 33024.61, recognized as an overlap support, which contributes to the potential for providing a price floor.
On the resistance side, the first resistance level at 33227.44 is an overlap resistance, which could pose a barrier if the price attempts to rise.
There is also a second resistance level at 33463.52, identified as an overlap resistance, which adds to its significance in potentially restraining the price’s upward movement.
GER30:
The GER30 chart currently demonstrates a bearish momentum, indicating the potential for further downward movement.
In the short term, there is a possibility of a bearish continuation towards the first support level at 16034.64. This support level is identified as an overlap support and coincides with a 61.80% Fibonacci retracement, adding to its significance as a potential price floor.
Additionally, there is a second support level at 15847.26, recognized as an overlap support, which further reinforces the potential for support in case of a price decline.
On the resistance side, there is an intermediate resistance level at 16199.70, identified as an overlap resistance, which may pose a barrier to any potential upward movement.
Furthermore, the first resistance level at 16293.56 is an overlap resistance, further contributing to its potential significance in restraining the price’s upward movement.

BTC/USD:
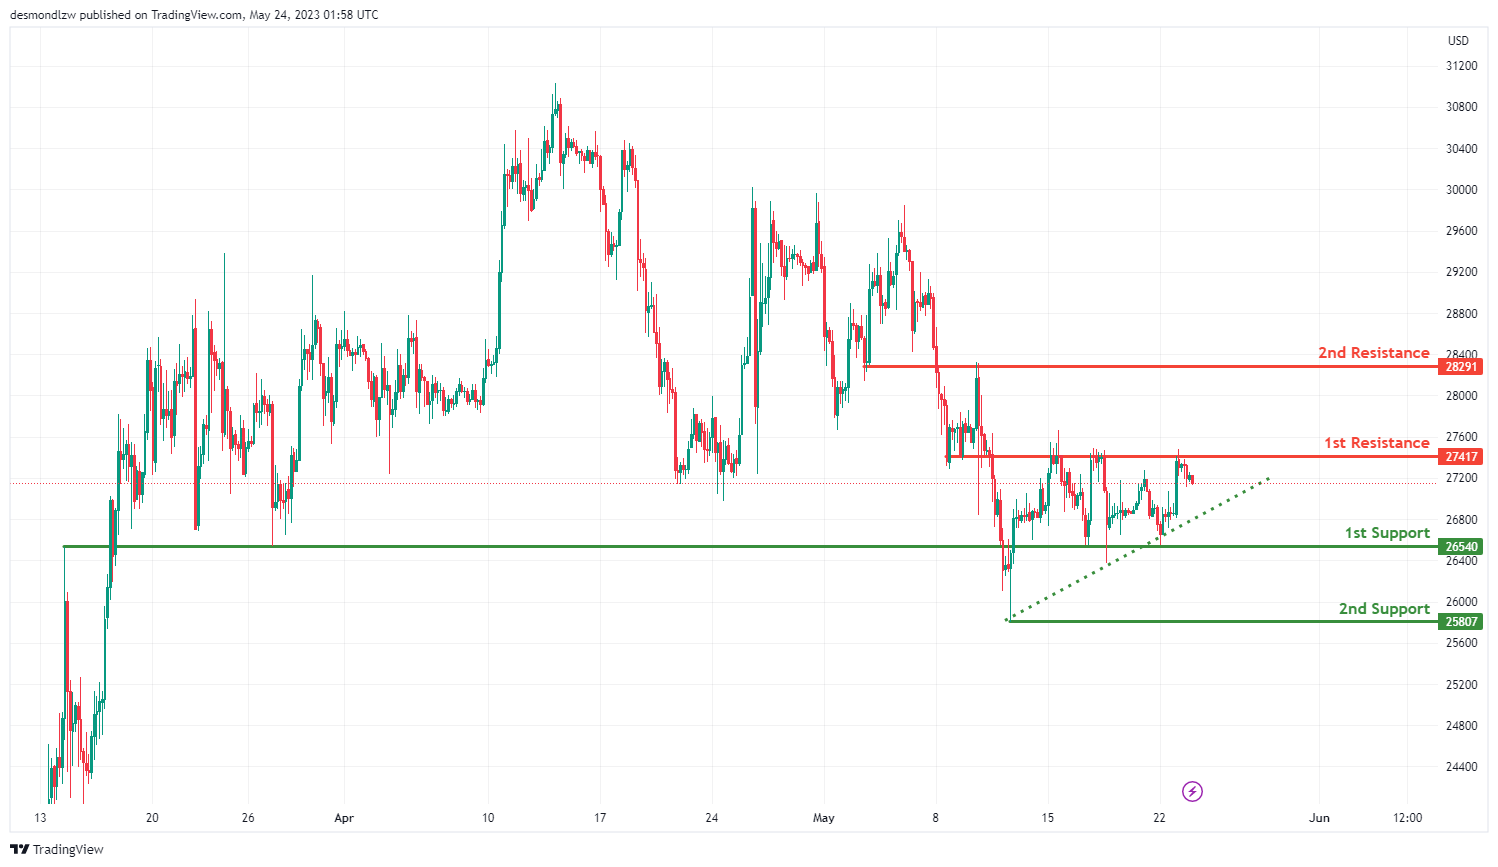
The BTC/USD pair is currently on a bullish trend, largely contributed by the price being above a major ascending trend line, suggesting that further bullish momentum is likely.
In the short term, the price might drop further to the first support level at 26450, which is recognized as an overlap support. Overlap supports have historically acted as both resistance and support, and it could potentially halt a price decline.
The second support level stands at 25807 and is identified as a swing low support. Swing low support levels are areas where the price has historically bottomed out, reinforcing its significance as a potential floor for the price.
On the upside, once the price bounces from the first support level, it might rise to the first resistance level at 27417. This level is seen as an overlap resistance and could act as a significant barrier to price increases.
The second resistance level is at 28291, also recognized as an overlap resistance, which could potentially cap price increases, indicating a possible price reversal at this level.
US500
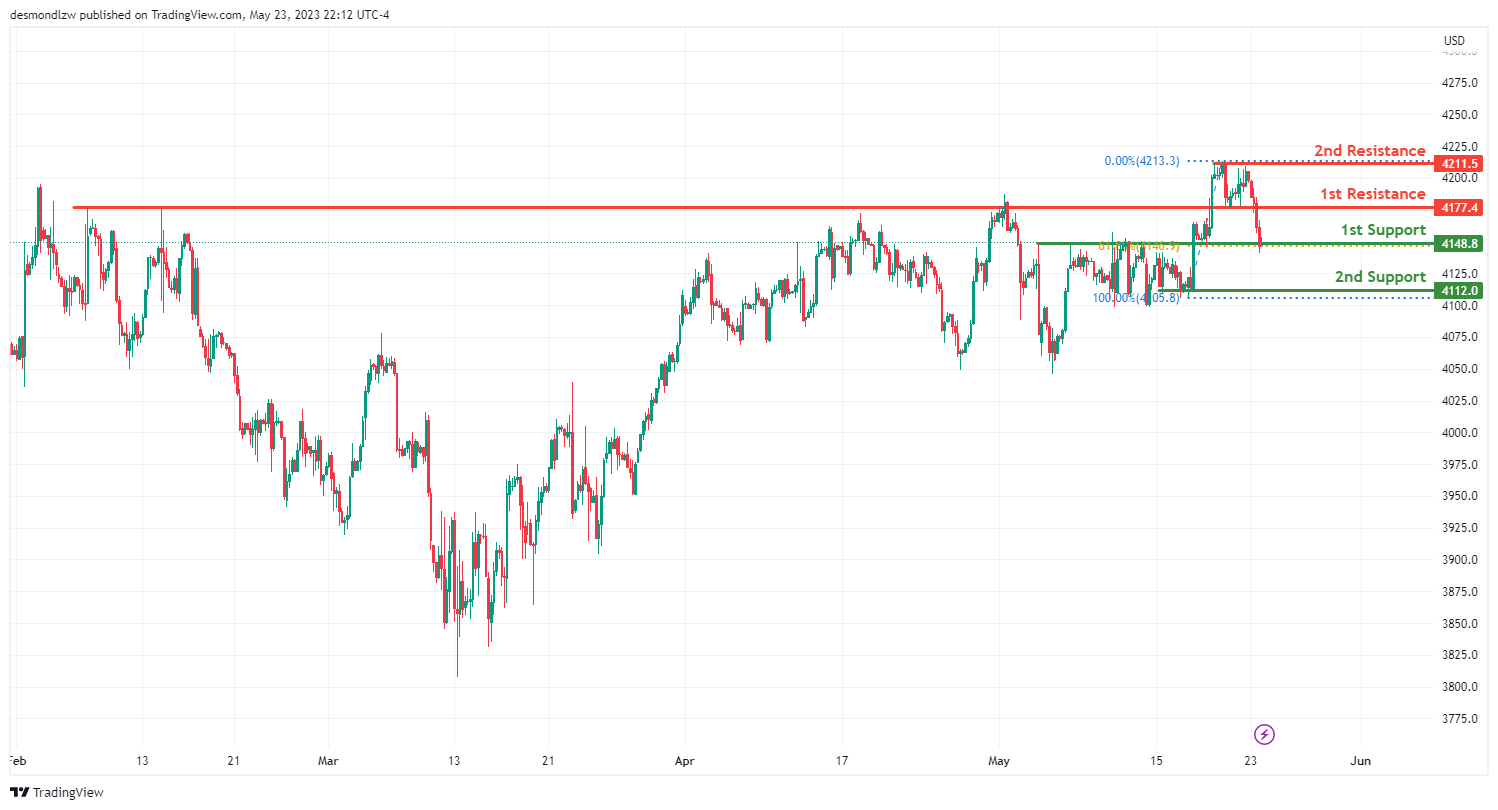
The US500 chart currently exhibits a weak bullish momentum with low confidence, suggesting the potential for limited upward movement.
In the short term, there is a possibility of a bullish bounce off the first support level at 4148.80. This support level is identified as an overlap support and coincides with a 61.80% Fibonacci retracement, indicating its significance as a potential price floor.
Additionally, there is a second support level at 4112.00, recognized as an overlap support, further contributing to the potential for support in case of a price decline.
On the resistance side, the first resistance level at 4177.40 is an overlap resistance, which may pose a barrier to any potential upward movement.
Furthermore, the second resistance level at 4211.50 is identified as an overlap resistance, reinforcing its potential significance in restraining the price’s upward movement.
ETH/USD:
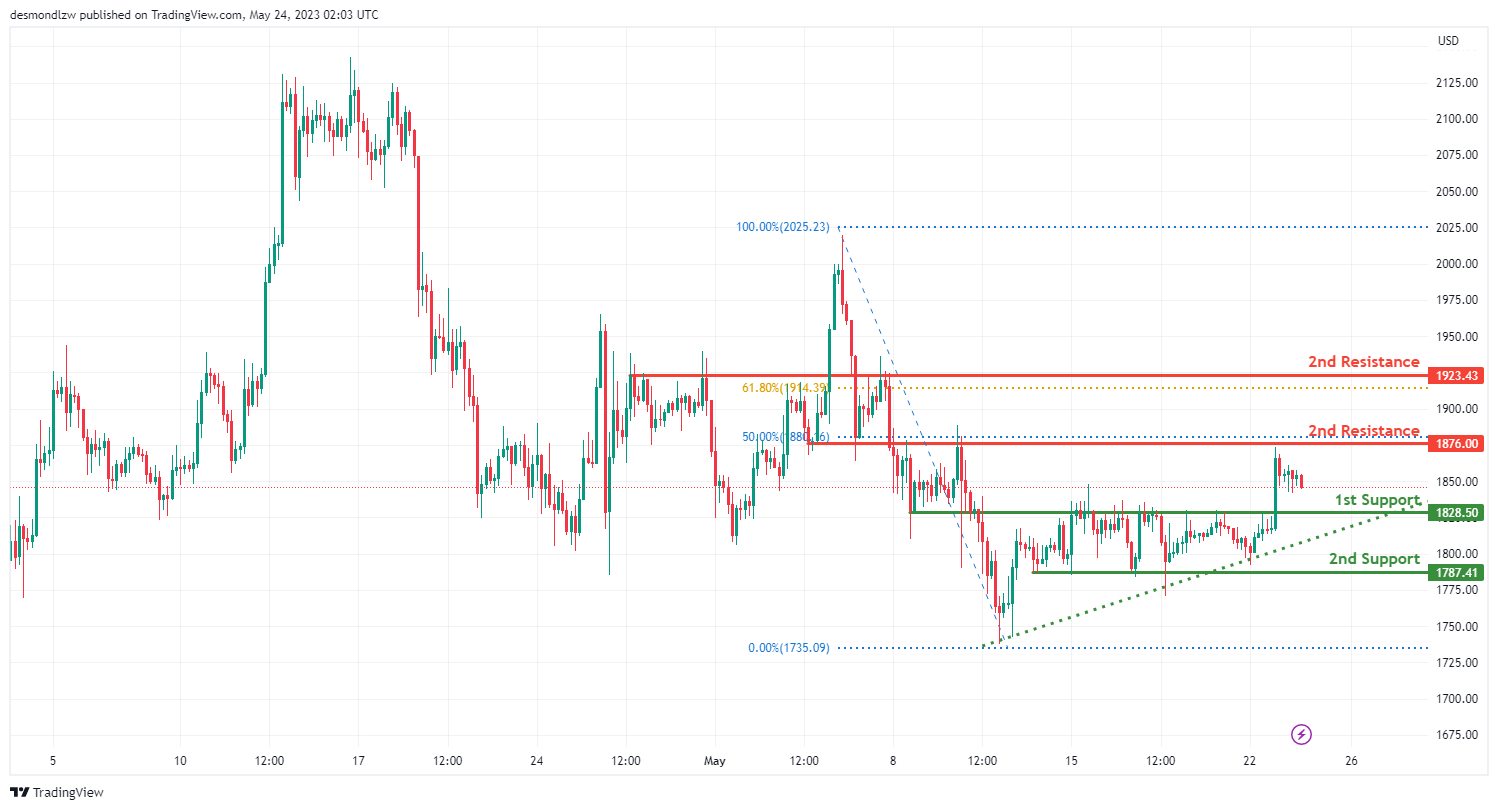
The ETH/USD pair is exhibiting a bullish trend, largely due to the price being above a major ascending trend line. This suggests that further bullish momentum is likely.
In the short term, the price may drop to the first support level at 1828.50, which acts as a pullback support. Pullback support levels are often seen as strong support zones as they have previously halted a downward trend and triggered a price rebound.
The second support level stands at 1787.41, recognized as a multi-swing low support. Multi-swing low support levels have historically acted as a strong floor, where the price has repeatedly bottomed out, increasing their significance as a potential support level.
On the upside, once the price bounces from the first support, it might rise to the first resistance level at 1876.00. This level acts as an overlap resistance and aligns with the 50% Fibonacci retracement level, potentially offering a significant barrier to price increases.
WTI/USD:
The WTI crude oil is currently showing a bullish trend, with the price above a major ascending trend line, suggesting that further bullish momentum could be on the horizon.
In the short term, the price might drop further to the first support level at 70.95, which is considered a swing low support. Swing low support levels have historically acted as a reliable floor, where the price has previously bottomed out.
The second support level is at 69.33, serving as an overlap support. Overlap supports have historically functioned as both resistance and support, suggesting this level could halt a price decline.
If the price bounces off the first support level, it could potentially rise to the first resistance level at 73.85. This level is identified as an overlap resistance, potentially offering a substantial obstacle to price increases.
The second resistance level stands at 76.69, also recognized as an overlap resistance. Overlap resistance levels have often capped price increases in the past, potentially indicating a reversal.

XAU/USD (GOLD):
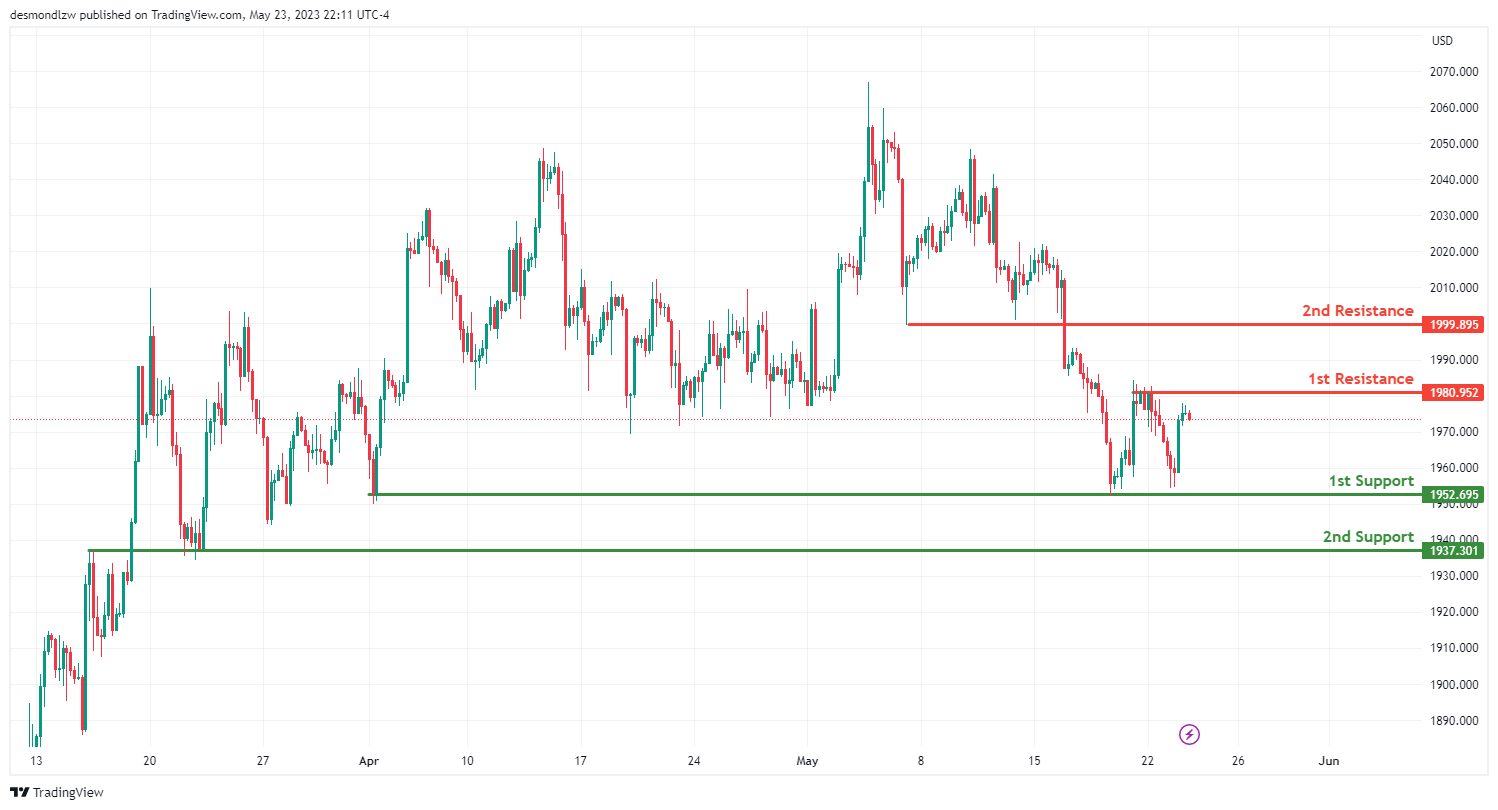
The XAU/USD pair currently exhibits a bearish trend, suggesting potential continuation towards the first support level.
The first support level is at 1952.69 and serves as a multi-swing low support, a level at which the price has bottomed out multiple times historically, potentially halting further price decline.
The second support level, at 1937.30, is an overlap support. Overlap supports have historically acted as both resistance and support, suggesting that this level could also prevent further price drops.
Conversely, should the price reverse direction, the first resistance level is found at 1980.95. This level acts as a multi-swing high resistance, indicating that it has been a point at which price increases have stopped and reversed historically.
The second resistance level is at 1999.59, serving as a pullback resistance. Pullback resistances are levels where the price has previously experienced a reversal following a brief retracement. This level could potentially cap further price increases.
AUD/USD Could Nosedive Below This Support
Key Highlights
- AUD/USD is showing bearish signs below the 0.6660 resistance.
- It traded below a contracting triangle with support near 0.6610 on the 4-hour chart.
- EUR/USD could extend losses below the 1.0750 level.
- GBP/USD might be volatile as it approaches the UK CPI report.
AUD/USD Technical Analysis
The Aussie dollar started a fresh decline from well above 0.6700 against the US Dollar. AUD/USD traded below the 0.6660 support to move into a bearish zone.
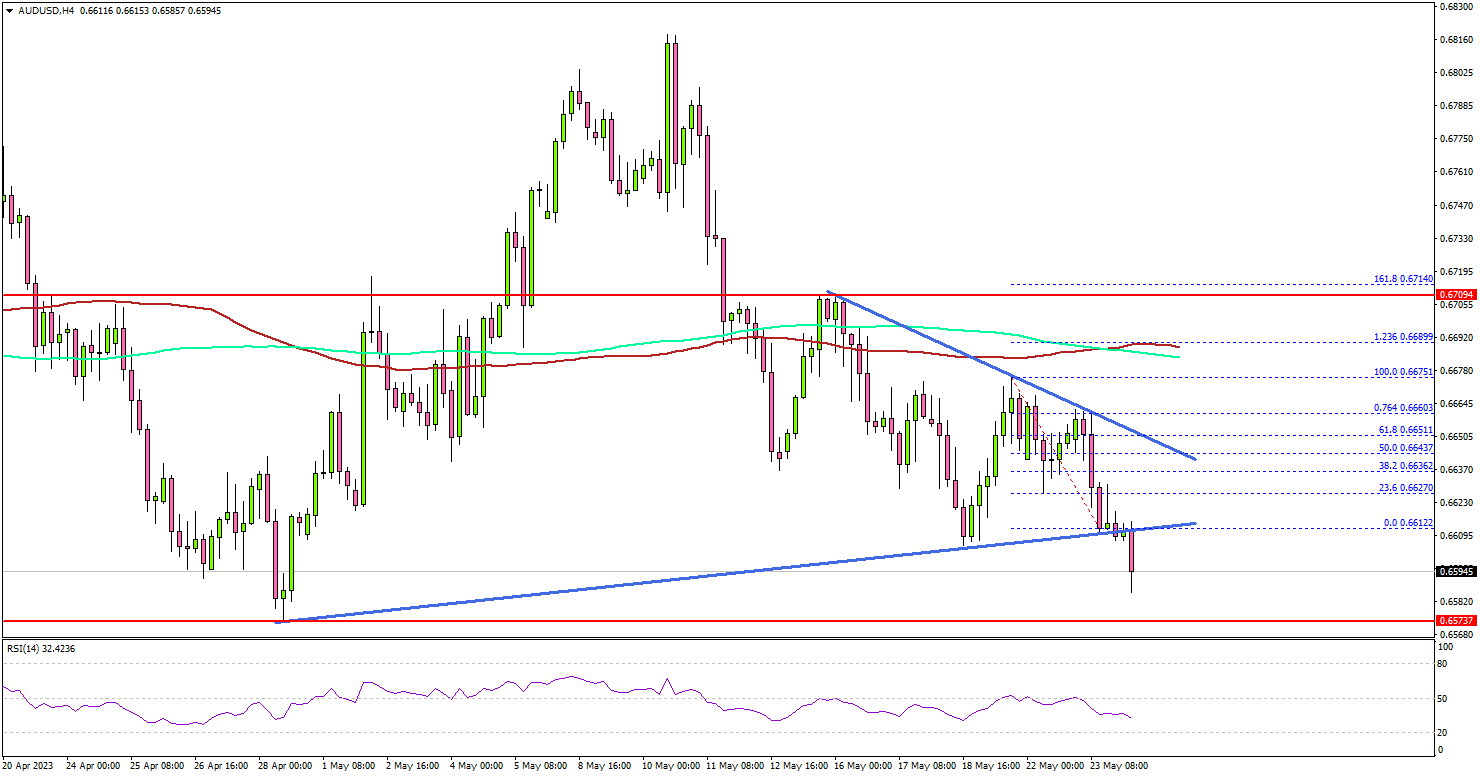
Looking at the 4-hour chart, the pair settled below the 0.6660 level, the 100 simple moving average (red, 4 hours), and the 200 simple moving average (green, 4 hours).
It even traded below the 0.6620 support level. Besides, AUD/USD traded below a contracting triangle with support near 0.6610 on the same chart. A low is formed near 0.6585 and the pair is now consolidating losses.
Immediate resistance is near the 0.6620 level. The next major resistance is near 0.6675 and the 200 simple moving average (green, 4 hours), above which the pair could rise toward the 0.6700 level.
Any more gains might send AUD/USD toward the 0.6750 level. On the downside, the pair might find support near 0.6600. The next major support is near the 0.6580 level.
If there is a downside break below the 0.6580 level, the pair could decline toward the 0.6500 support level. The next major support sits near the 0.6440 level.
Looking at EUR/USD, the pair is still trading in a bearish zone and there is a risk of a move toward the 1.0700 level in the near term.
Economic Releases
- UK Consumer Price Index for April 2023 (YoY) – Forecast +8.2%, versus +10.1% previous.
- UK Core Consumer Price Index for April 2023 (YoY) – Forecast +6.2%, versus +6.2% previous.
- German IFO Business Climate Index for May 2023 – Forecast 93.0, versus 93.6 previous.
EURUSD Close to Ending Elliott Wave Impulse Decline
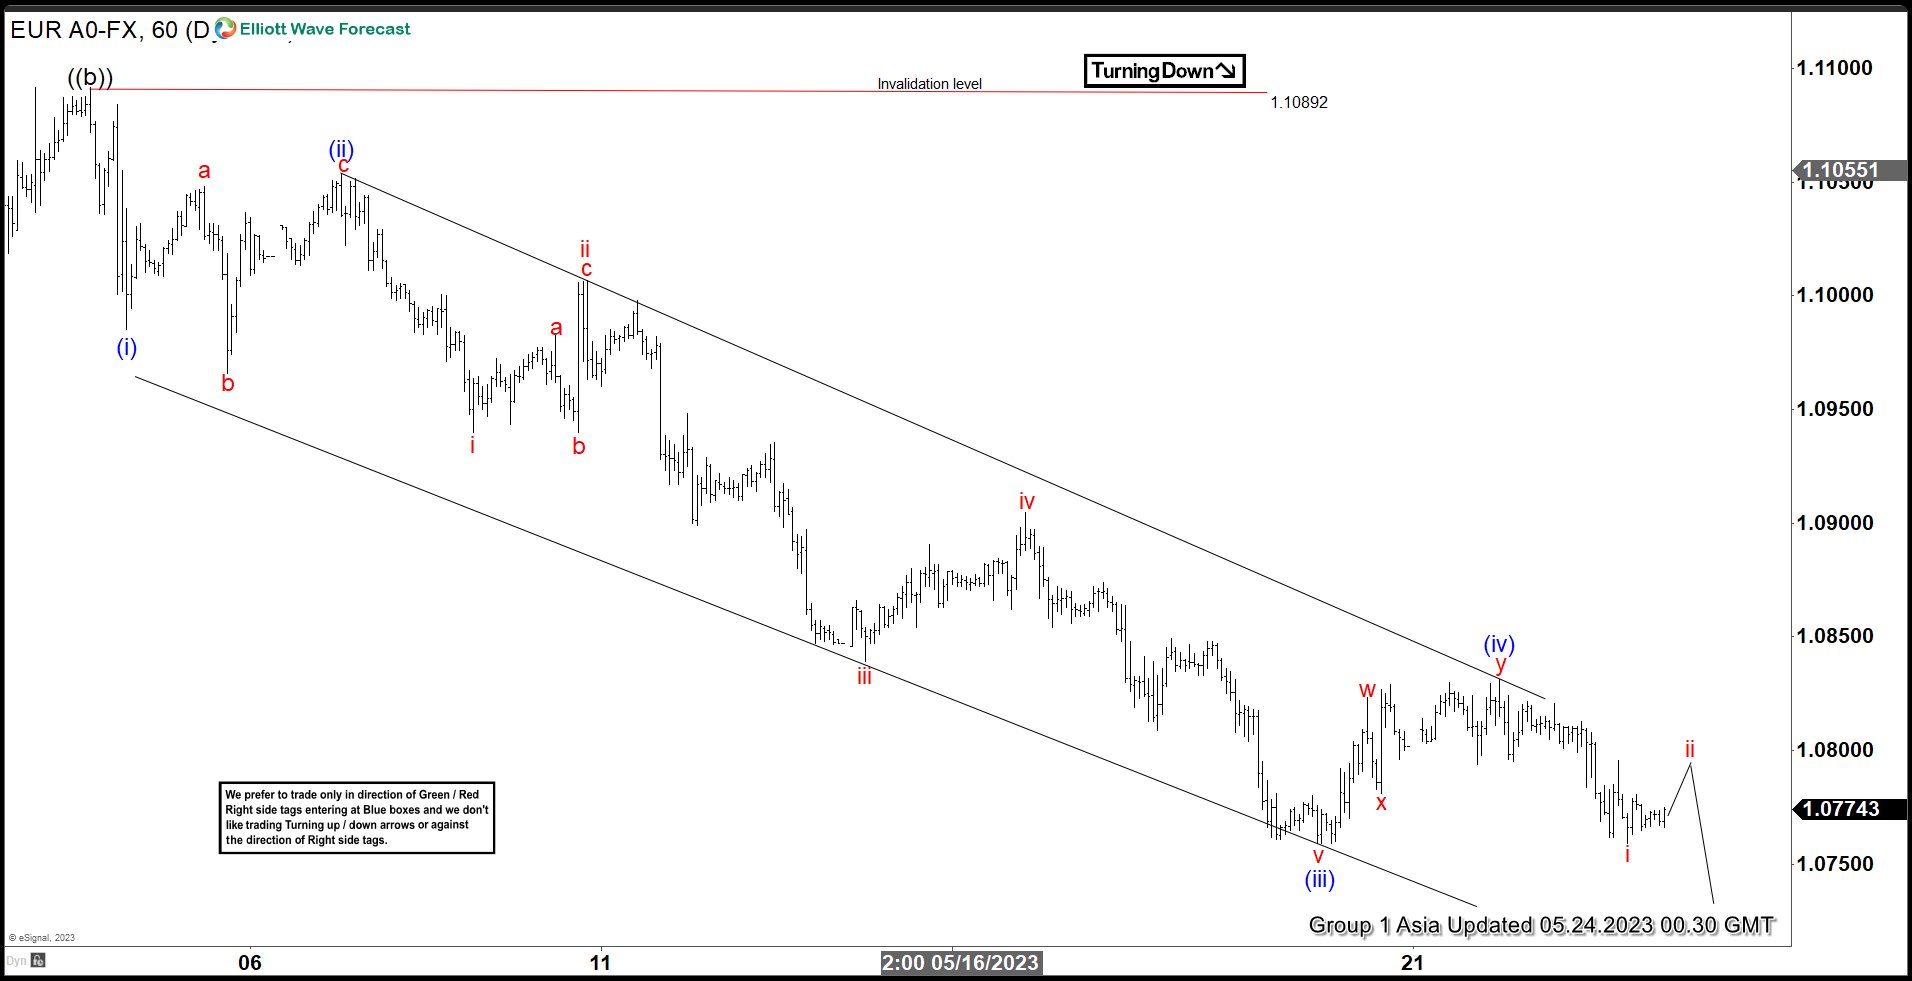
Short term Elliott Wave view in EURUSD suggests pair ended wave ((b)) at 1.1089. Wave ((c)) is currently in progress with internal subdivision as a 5 waves impulse Elliott Wave structure. Down from wave ((b)), wave (i) ended at 1.0985 and rally in wave (ii) ended at 1.1053. Internal subdivision of wave (ii) unfolded as expanded flat where wave a ended at 1.1048, wave b ended at 1.0965, and wave c higher ended at 1.1054.
Down from wave (ii), wave i ended at 1.094 and rally in wave ii ended at 1.10068. Pair resumes lower in wave iii towards 1.0839 and rally in wave iv ended at 1.0904. Final leg lower wave v ended at 1.0759 which completed wave (iii). Rally in wave (iv) ended at 1.0831 with internal subdivision as a double three Elliott Wave. Up from wave (iii), wave w ended at 1.0823, pullback in wave x ended at 1.0781, and wave y ended at 1.0831. Pair resumes lower in wave (v) with internal subdivision as another 5 waves. Down from wave (iv), wave i ended at 1.0759. Expect rally to fail in 3, 7, or 11 swing for further downside while pivot at 1.1089 high stays intact.
EURUSD 60 Minutes Elliott Wave Chart
EURUSD Elliott Wave Video
https://www.youtube.com/watch?v=5ynnhejBgsg
Nikkei 225 Wave Analysis
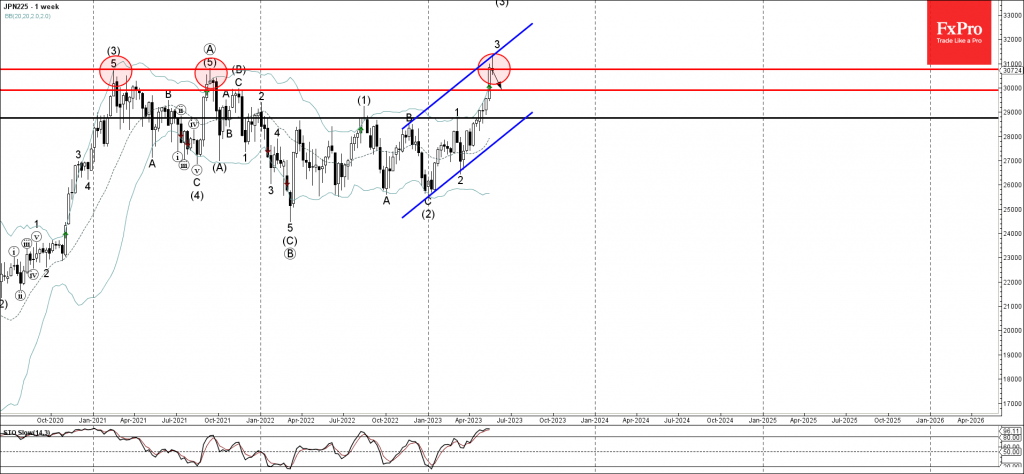
- Nikkei 225 reversed from multiyear resistance level 30750.00
- Likely to test support level 30000.00
Nikkei 225 index recently reversed down from the multiyear resistance level 30750.00 (which reversed the index twice in 2021 as can be seen below).
The resistance level 30750.00 was strengthened by the upper weekly Bollinger Band and by the resistance trendline of the weekly up channel from the end of last year.
Given the overbought weekly Stochastic, Nikkei 225 index can be expected to fall further toward the next round support level 30000.00.
EURCHF Wave Analysis
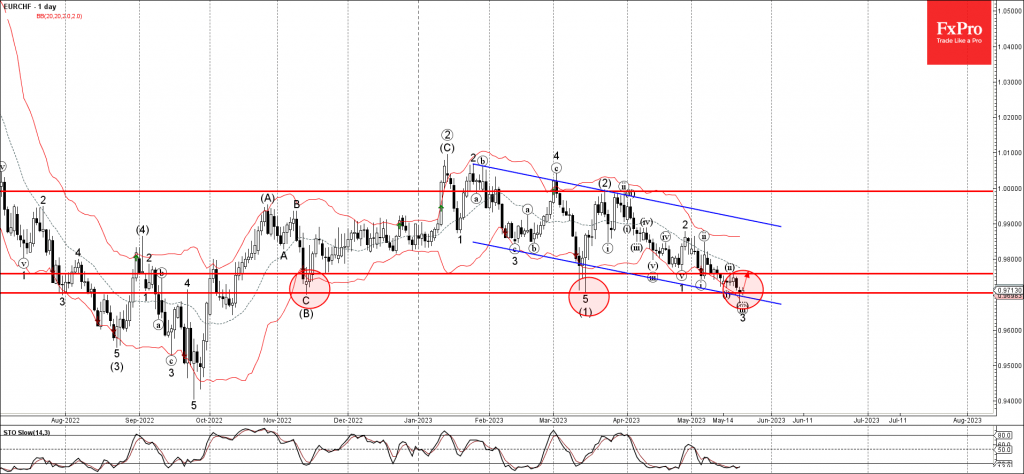
- EURCHF reversed from support level 0.9705
- Likely to rise to resistance level 0.9760
EURCHF recently reversed up from the major long-term key support level 0.9705 (low of the previous waves (B) and (1) from November and March respectively).
The support level 0.9705 was further strengthened by the lower daily Bollinger Band and by the support trendline of the daily down channel from January.
Given the oversold daily Stochastic, EURCHF can be expected to rise further toward the next resistance level 0.9760 (top of the previous correction (ii)).
Sunset Market Commentary
Markets
At first sight, EMU May PMI’s were close to expectations. The composite measure eased slightly from 54.1 to 53.3 (vs 53.5 expected), but still suggests solid growth. The dichotomy between a further contraction in manufacturing (44.6 from 45.8) and strong services growth continues (55.9 from 56.2). This divergence was also visible in pricing behavior. According to S&P global, average prices for goods and services rose at the slowest pace in 25 months. However, prices rises remain high by historical standards. Especially the services sector continues reporting higher pricing power amid resurgent demand while goods producers see reducing input costs and demand for discounts. Still, service sector input costs continue to rise sharply, often due to higher wage an salary costs. In its comment, HCOB chief economist Cyrus de la Rubia concludes that ‘The European Central Bank will have a headache with the PMI data. This is because selling prices in the services sector actually rose more than in previous month. …. This upward move that can still be observed here is keeping the central bank from taking an interest rate pause’. Companies continue to hire, even in the weakening industrial sector. As said, the EMU PMI’s didn’t provide a spectacular surprise. However, the combination of a healthy labour market and ongoing price pressures in the services sector was enough to further extend recent rise in core European and US bond yields. German yields are trading off the intraday top levels, but still add about 2-3 bps across the curve. US Treasuries underperform with additional yield gains between 5.5 bps (2-y) and 2 bps (30-y). Higher yields and a more inverse yield (US) curve this time triggered a correction on global equity markets (Eurostoxx 50 -0.9%, S&P -0.4%). However, recent highs remain within reach. At the time of finishing this report, the US Composite PMI is released at a stronger than expected 54.50, with services showing solid growth (55.1) while manufacturing drifts below the 50 boom-or-bust level (48.5). Yields in a first reaction gain marginally. The dollar trades little changed.
On FX markets, higher yields and a risk-off favors the dollar, even as the negotiations on raising the debt ceiling didn’t yield any result yet. EUR/USD slipped from the 1.0810 area to trade near 1.078. DXY rebounded nearing the recent top levels in the103.63 area. Despite higher core yields, yen losses remain negligible. Still, USD/JPY (currently 138.5) tries to break above the 138.75 resistance, touching the highest levels in about six months. Sterling showed somewhat of a bumpy intraday pattern. The UK currency was hit around the time of the publication of a weaker than expected UK PMI (composite 53.9 from 54.9). EUR/GBP briefly jumped to the 0.8715 area, but sterling soon recovered the post-PMI loss as UK yields still rose faster than their EMU counterpart. Governor Bailey in a hearing before Parliament mainly repeated the message for the May policy meeting (further tightening is need if inflation persists). EUR/GBP currently again trades in the 0.8695 area, counting down to tomorrow’s key April inflation data.
News & Views
The Saudi energy minister, prince Abdulaziz bin Salman, lashed out at oil short-sellers again. At the Qatar Economic Forum (Doha), bin Salman told speculators they will get burned whilst referring to OPEC’s decision back in April. The oil cartel then delivered a surprise output cut of more than 1m barrels a day. Brent oil prices soared from sub $80/b to around $87 shortly thereafter. But ongoing recessionary worries and tepid Chinese growth following the end of zero-Covid (more than) erased those gains. At the same time there are serious doubts whether some OPEC+ members including Russia are at all abiding by the production cuts. The price of a barrel of Brent ekes out a tiny gain after bin Salman’s comments, selling at around $77/b currently. OPEC+ will meet on June 3-4.
The Hungarian central bank proceed its cutting cycle today by lowering the overnight collateralised lending rate serving as the top of the interest rate corridor by 100 basis points to 19.5 percent. The key decision however was that it also cut the overnight deposit tender (and de facto policy) rate from 18% to 17%. The base rate was left unchanged at 13%, a level which it considers high enough to fight inflation and expects to stay there for a prolonged period. The Hungarian central bank said it is to continue the convergence of both rates, provided the improvement in risk perceptions vis-à-vis Hungarian assets, the forint in particular, persists. The MNB favours a cautious and gradual approach in doing so (a monthly 100 bps reduction through September?!). The forint reacted stoic to today’s decision as markets were already pricing the cut for quite some time. The forint is holding strong near EUR/HUF 374.
Forget Default, is a Debt Ceiling Deal the True Risk for Stocks?
With US lawmakers unable to reach a deal on the debt ceiling, investors are laser-focused on the risk of a catastrophic default. However, the real problem for markets might be what happens after an agreement is found. That's when the Treasury will scramble to raise its cash levels, which can drain liquidity out of the financial system and in the process, inflict damage on riskier assets such as stocks.
Political theater
It's almost certain that US lawmakers will ultimately reach a debt ceiling deal, even if it takes some time. Nobody really wants the US government to default as that would severely damage the nation's credibility, raise borrowing costs and make matters worse for both parties. This showdown is a political game of chicken, and investors are fully aware.
Republicans want the government to slash spending, whereas the Democrats are only prepared to freeze public spending at current levels. Some compromise will eventually be found, hopefully before the X-date that Treasury Secretary Yellen has warned is around early June.
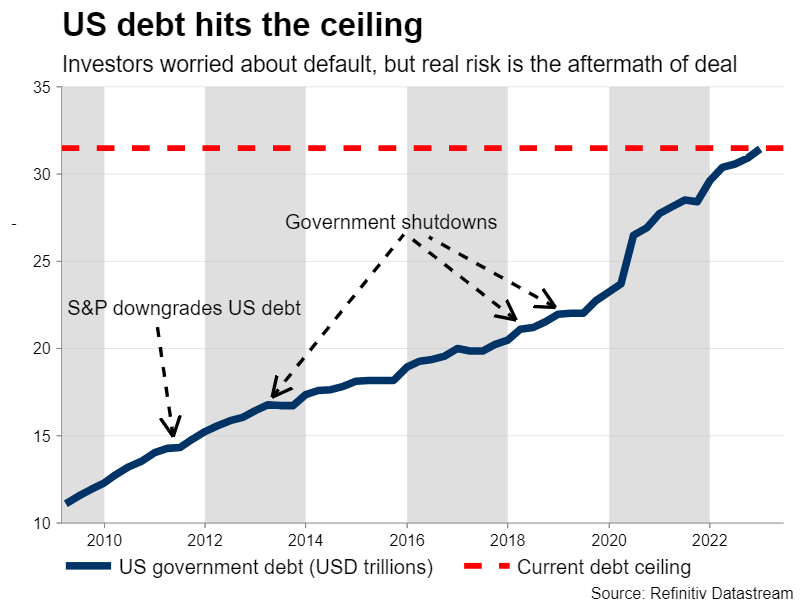
In reality, there are some extraordinary measures the Treasury can take to avert default for a few more weeks, so the real X-date might be closer to late June. Even so, the real question is what will happen in the aftermath of the resolution.
Liquidity drain
Once a deal is found, the Treasury would need to sharply boost its borrowing, in order to replenish its cash levels and be able to honor the spending obligations of the US government. This means a flood of newly-issued bonds will hit the markets in the following weeks, which investors need to absorb.
Let's dig into the numbers. The government's cash account at the Fed, called the Treasury General Account, currently stands at $60 billion. According to the Treasury's own estimates, this cash balance is expected to soar to $550 billion at the end of this quarter and then rise to $600bn by the end of the third quarter.
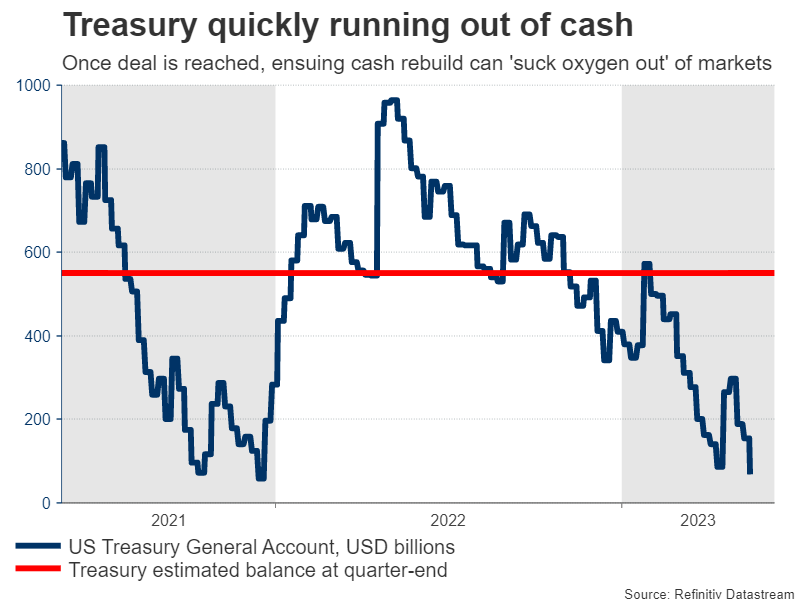
This implies that around half a trillion dollars might be drained from the private sector, reducing bank reserves and in the process siphoning liquidity out of financial markets. Liquidity is the life blood of the financial system, so a sharp reduction would spell bad news for riskier assets such as stocks and cryptocurrencies.
And that's without even considering the Fed's quantitative tightening (QT) program, which is reducing its balance sheet at a steady pace. Hence, it looks like the Fed and the Treasury will be simultaneously pulling liquidity out of US markets this summer, effectively 'sucking the oxygen' out of the room.
QT kicks into overdrive
Markets have essentially taken a break from quantitative tightening since last October. Since then, the Fed has shrunk its balance sheet by only $300bn, but the Bank of Japan and the People's Bank of China have jointly injected around $1.2 trillion into their own financial systems.
Liquidity is a global phenomenon, so the tremendous expansions in China and Japan have more than eclipsed the Fed's cautious efforts to remove liquidity. It is probably not a coincidence that stock markets bottomed in early October, exactly when these foreign liquidity injections started.
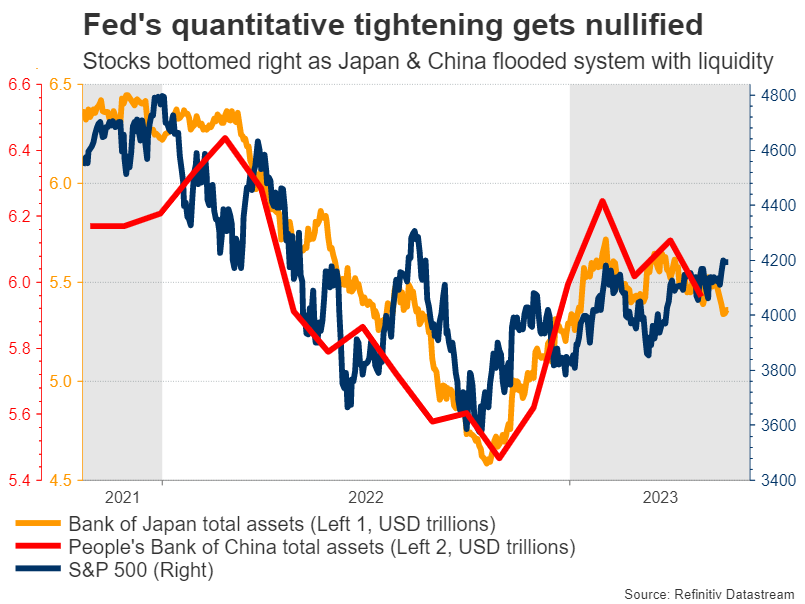
But this liquidity effect seems to be going into reverse now. The balance sheets of the Japanese and Chinese central banks have been falling in recent weeks, the Fed is still reducing its own, and the Treasury is about to turbocharge this process.
Market effects
Blending everything together, investors are staring down the barrel of a dramatic liquidity extraction in the coming months, just as the real economy starts to feel the lagged impact of all the previous rate increases.
This is important because it could mark the end of the stunning rally in risk assets. Long duration plays such as tech stocks or shares of speculative profitless companies would likely get hit the hardest, alongside cryptocurrencies. The riskier the investment, the more vulnerable it is in an environment of evaporating liquidity.
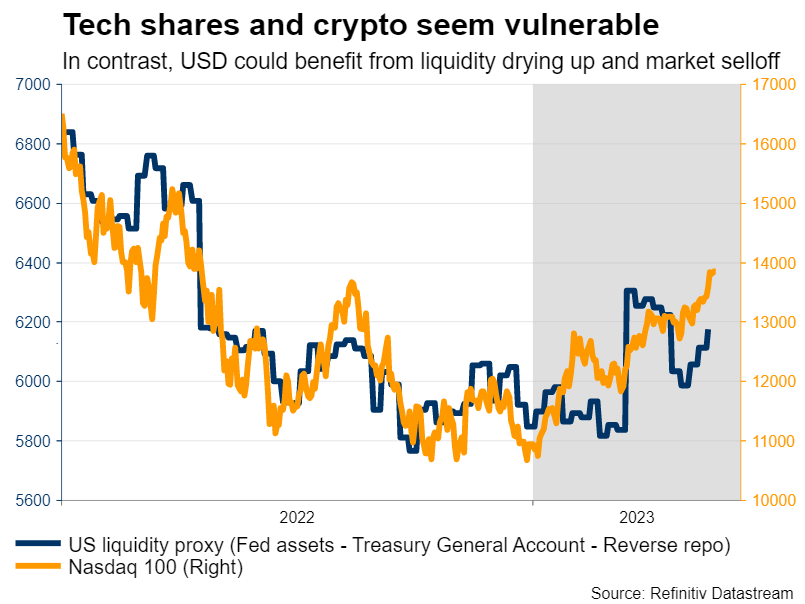
With the tech-heavy Nasdaq 100 index rising by nearly 27% so far this year and Bitcoin rallying 64% over the same timeframe, these instruments already seem overextended and susceptible to a deep correction. In contrast, the main beneficiary in the FX arena might be the US dollar, which tends to perform well when liquidity dries up and markets sell off.
In conclusion, investors seem to be focusing on the wrong risk. Even if the US government shuts down next month, the politicians will eventually strike a deal. What's most important is what happens afterwards once the Treasury unleashes a tsunami of bond issuance, amplifying the effects of quantitative tightening.
It could be a tough summer for riskier investments, which have been flying high this year.
Short-term Negatives from PMIs Do Not Cause ECB to Change Course
Preliminary readings of the PMIs for business activity in the euro area generally revealed a worse-than-expected deterioration. According to the composite index, the last time the euro area industry suffered this badly was in 2008-2009, when the economy was in a sharp downturn.
The persistent decline in manufacturing activity since the beginning of the year has already impacted the services sector, where a reversal from growth to contraction may have occurred after the annual highs in April.

The principal destabilising factor was the collapse in German manufacturing activity, where the corresponding index fell from 44.5 to 42.9, against expectations for a rise to 44.9. The surprise in this collapse was the sharp fall in gas prices in recent months, which should have boosted activity.
The services sector has been solid, especially in Germany. The gaps between the indices have not existed since 2009, and at least they were moving in the same direction, with manufacturing falling faster. However, services are gaining ground as they can pass higher costs to buyers.
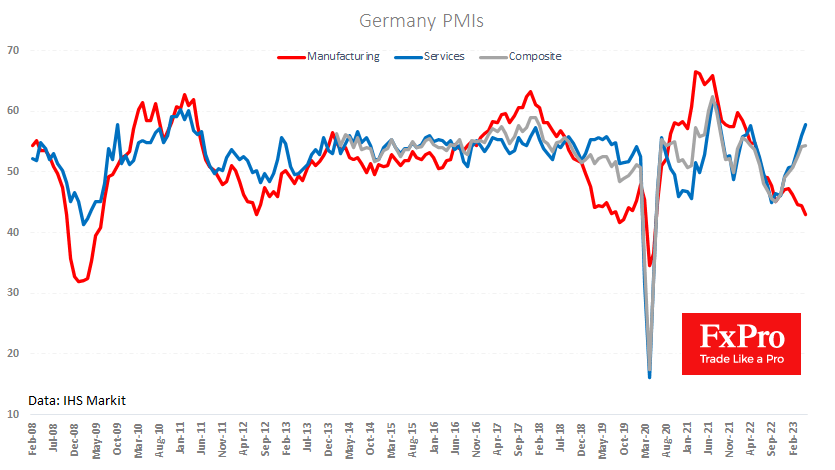
This is a very uncomfortable picture for the central bank. A contraction in output is a strong argument for a softer monetary policy. This is also reflected in employment trends, which are already showing a reversal. However, price developments in the services sector point to secondary inflationary effects – the central bank’s worst enemy.
The ECB faces a difficult choice between inflation and recession. The signals we have received at the last two rate-setting meetings indicate a willingness to sacrifice growth temporarily in favour of a quicker victory over inflation. And this choice is in line with the historical behaviour of continental Europe.
Overall, the weak PMI data for May could put some pressure on the Euro in the short term. However, investors and traders should remember that there has been no sign of a pause in interest rate hikes from the ECB, and the new data strengthens the case for a continued fight against inflation.
Technically, the EURUSD is in bearish territory, below the 50-day MA and testing a two-month low at 1.0780. There is also a key support area for the pair in 2020 and from 2015 to 2017. The pullback in the EURUSD over the past four weeks looks like a correction from the accumulated overbought area from the 16% rise in the pair from last October’s lows.
