

Sample Category Title
USD/JPY Daily Outlook
Daily Pivots: (S1) 138.25; (P) 138.58; (R1) 138.91; More...
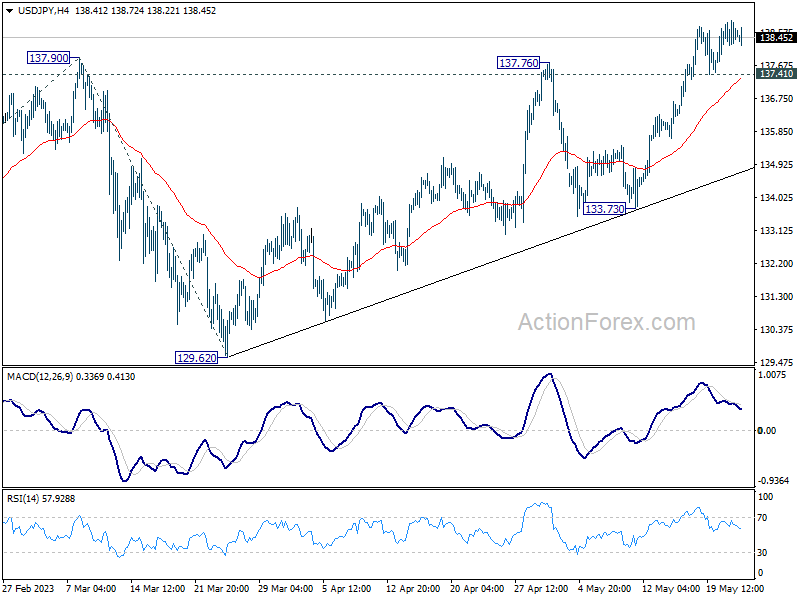
While USD/JPY continues to lose upside momentum as seen in 4 H MACD, there is no clear sign of topping yet. Further rise is still expected to 100% projection of 127.20 to 137.90 from 129.62 at 140.32. Break there will target 142.48 fibonacci level. On the downside, however, break of 137.41 will turn bias back to the downside for deeper pull back.
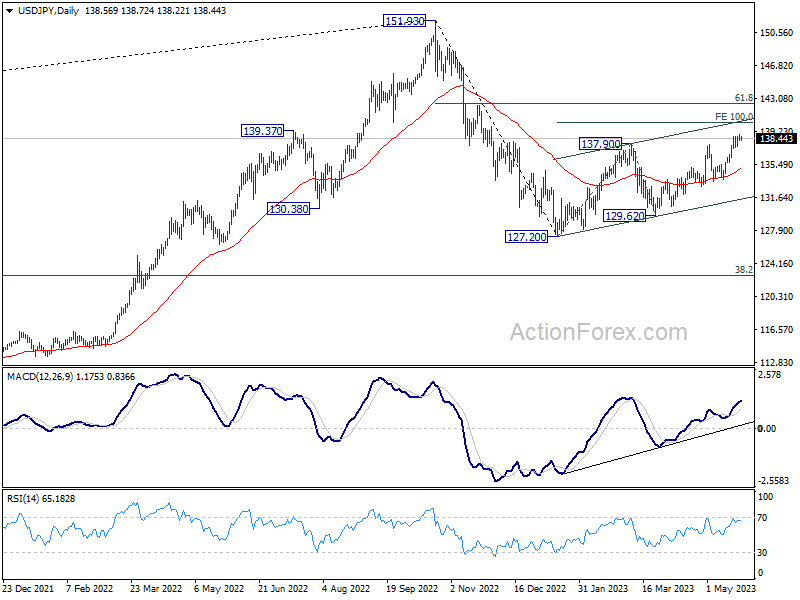
In the bigger picture, rise from 127.20 is seen as the second leg of the corrective pattern from 151.93 high. Stronger rally would be seen to 61.8% retracement of 151.93 to 127.20 at 136.34. Sustained break there will pave the way back to retest 151.93. On the downside, however, break of 133.73 support will argue that the pattern could have started the third leg through 127.20 low.
USD/CHF Daily Outlook
Daily Pivots: (S1) 0.8983; (P) 0.9006; (R1) 0.9038; More...
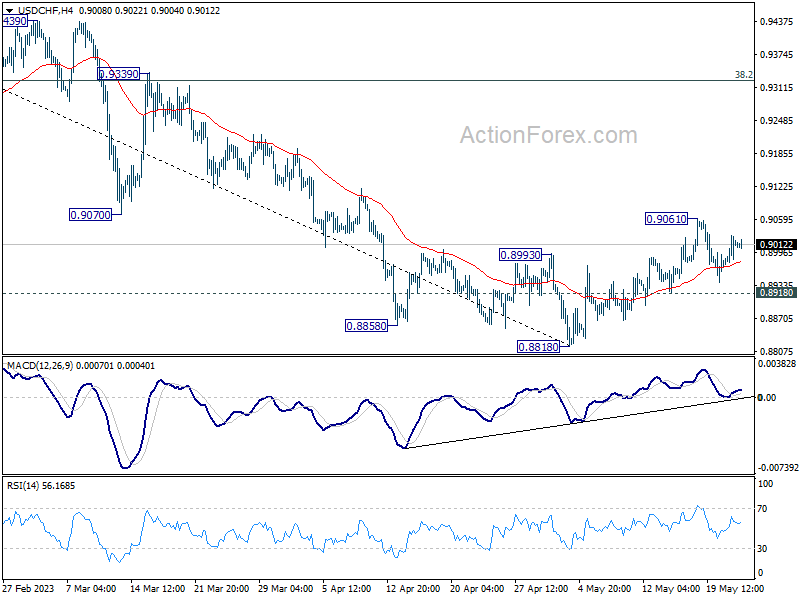
Range trading continues in USD/CHF and intraday bias stays neutral. Rebound from 0.8818 short term bottom is expected to continue as long as 0.8918 minor support holds. On the upside, sustained trading above 55 D EMA (now at 0.9039) should confirm that current rally is at least correcting whole down trend from 1.0146. Further rise should then be seen to 38.2% retracement of 1.0146 to 0.8818 at 0.9325. On the downside, though, break of 0.8918 will bring retest of 0.8818 low instead.
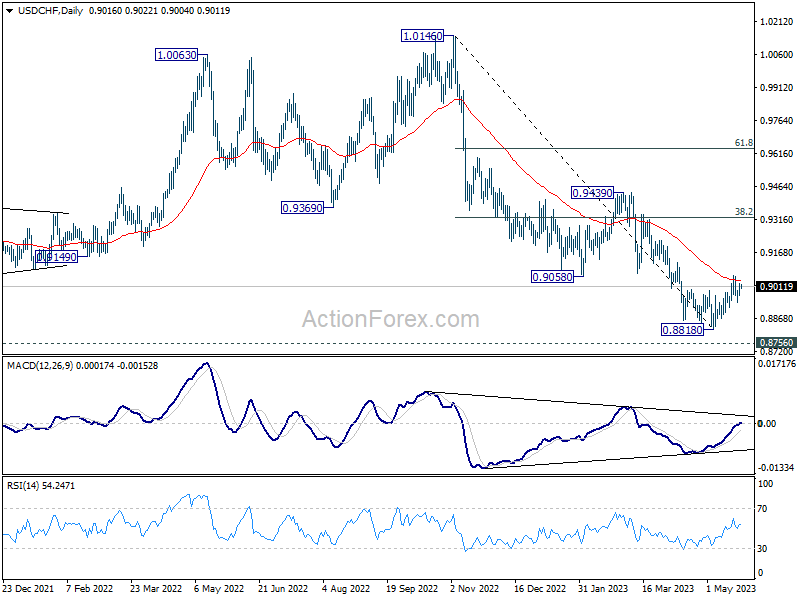
In the bigger picture, fall from 1.1046 (2022 high) is seen as a leg in the long term range pattern from 1.0342 (2016 high). So, downside should be contained by 0.8756 to bring reversal. Sustained break of 0.9058 support turned resistance will be the first sign of medium term bottoming. However, decisive break of 0.8756 will carry larger bearish implications.
EUR/USD Daily Outlook
Daily Pivots: (S1) 1.0747; (P) 1.0784; (R1) 1.0808; More...
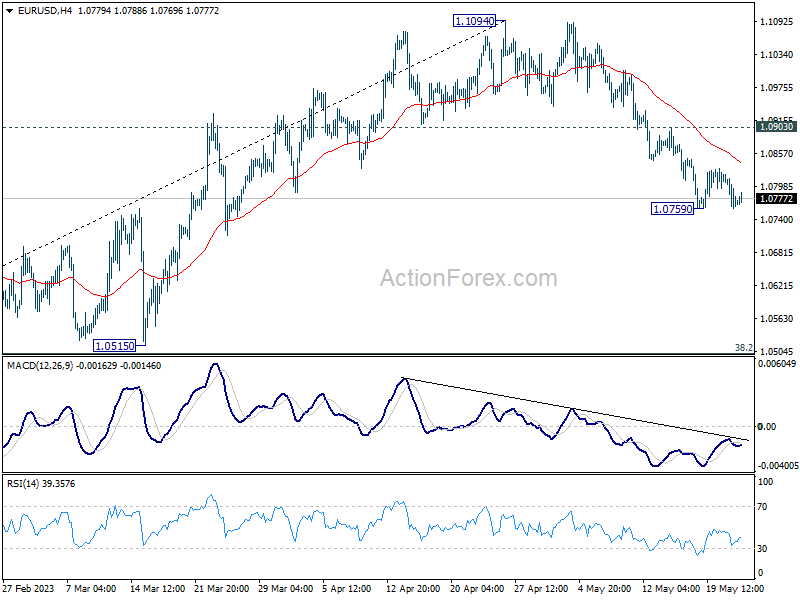
EUR/USD is still bounded in consolidation above 1.0759 temporary low and intraday bias stays neutral. Deeper decline is expected as long as 1.0903 resistance holds. Fall from 1.1094 is seen as correcting whole up trend from 0.9534. Below 1.0759 will target 1.0515 cluster support, 38.2% retracement of 0.9534 to 1.1094 at 1.0498. On the upside, though, firm break of 1.0903 will bring stronger rebound back to retest 1.1094 high instead.
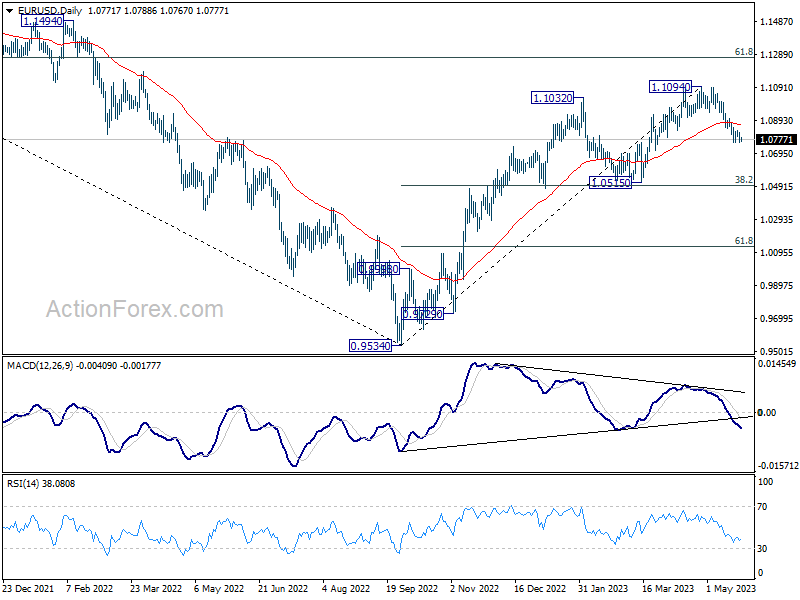
In the bigger picture, as long as 1.0515 support holds, rise from 0.9534 (2022 low) would still extend higher. Sustained break of 61.8% retracement of 1.2348 (2021 high) to 0.9534 at 1.1273 will solidify the case of bullish trend reversal and target 1.2348 resistance next (2021 high).
USD/JPY Technical Analysis
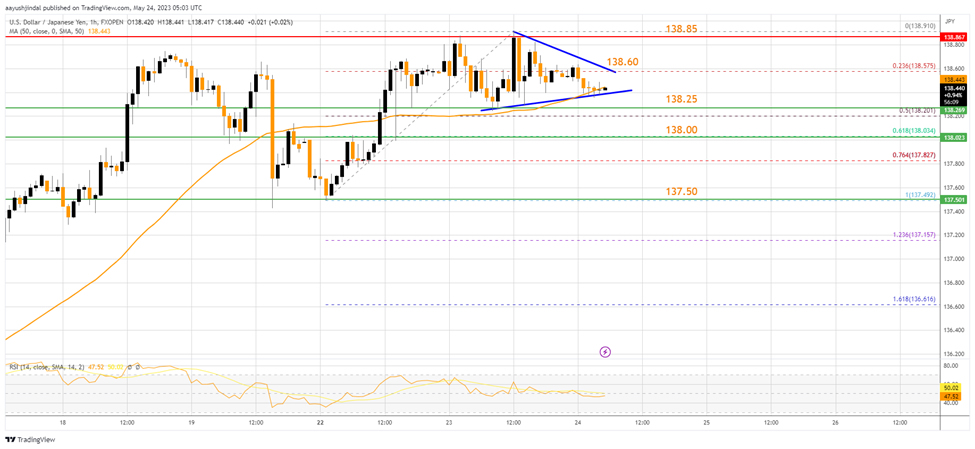
On the hourly chart of USD/JPY at FXOpen, the pair started a fresh increase from the 137.50 support zone. The US Dollar climbed higher above the 138.25 resistance zone against the Japanese Yen.
A high is formed near 138.91 and the pair is now consolidating gains near the 50-hour simple moving average. Immediate resistance on the upside is near a contracting triangle at 138.60. The first major resistance is near the 138.85 level, above which the pair might gain bullish momentum.
The next major resistance is near the 139.20 zone. A clear break above the 139.20 resistance could push the price further higher toward 140.00.
If there is a fresh decline, the pair might find bids near the 138.25 level. The next support sits near the 138.00 zone, below which there is a risk of more downsides toward the 137.50 level.
RBNZ Seemingly Done But UK Inflation Data Shows BoE Has A Lot To Do
It's been a tough start to the trading day, with UK inflation data sending worrying signals while the RBNZ seemed to declare job done in its inflation battle.
Bitterly disappointing inflation report from the UK
The headline UK inflation number may look like a massive step in the right direction in April but the reality is that there's far more to be concerned about in the report than happy. On the one hand, inflation has slipped significantly from 10.1% to 8.7% but unfortunately, that's where the good news starts and ends.
This is still much higher than what forecasters were predicting, a decline to 8.2%, while core inflation leaped higher unexpectedly to 6.8% from 6.2%. That's a serious setback when you consider that sticky inflation is what the BoE is fighting, not the headline number. Today's report can not be viewed as a step in the right direction, but rather a big step back.
The MPC will find it very hard to justify holding rates now in June and may have little option but to go further again unless we see a dramatic improvement at the core level over the coming months. The risk of inflation becoming embedded has recently increased greatly and that must make the MPC a little nervous. It will be very interesting now to hear what Governor Bailey has to say on the release later on today.
RBNZ brings a surprise end to its tightening cycle
'Job done' was the message coming from the RBNZ meeting on Wednesday, as the MPC hiked the cash rate by 25 basis points and effectively declared the end to the tightening cycle. For once, there was no unanimity in the vote, with two policymakers voting for a pause, but all are seemingly comfortable with that being the end of the road.
Governor Adrian Orr declared that “all of the committee were comfortable with the forward path that had interest rates holding around 5.5%” so they couldn't be more explicit in their guidance. Barring another inflation shock, the RBNZ now expects to hold rates steady for a year at least before cutting once inflation returns sustainably to target.
It also expects the economy to be more resilient than before, eyeing only a minor recession in the process. This far more upbeat view didn't do the currency any favours, tumbling more than 1.3% as traders were forced to pare back interest rate expectations and factor in a lower terminal rate. The question now is will other central banks be so abrupt with their pivot and will they join the RBNZ in doing so soon?
Oil continues higher as short-sellers warned to "watch out"
Oil prices are trading higher again on Wednesday, buoyed by the latest short-seller warning from Saudi Arabia. The prospect of another "ouching" moment is seemingly too much to bear although if past experience is anything to go by, traders may be tempted to call his bluff.
Saudi Energy Minister Prince Abdulaziz bin Salman told short-sellers to watch out during his most recent comments on the market which come a little before the next OPEC+ meeting on 4th June. Coming over the weekend again, traders may not be in quite the same mood to test the group's resolve as the market gapped significantly higher last time. That said, a failure to follow through could see prices move sharply in the other direction.
Gold could see support solidify if debt ceiling talks don't progress
Gold is treading water it seems ahead of the Fed minutes later today and the US inflation data at the end of the week. It's stabilized around $1,960 which is a big technical level of support for the yellow metal. It remains in correction territory and while a move below here wouldn't exactly change that it would suggest we may be facing a much deeper correction.
Some good news on the inflation side or a softening in the tone from Fed policymakers in the minutes could further solidify this support zone. As could debt ceiling talks going right up to the deadline, assuming we are seeing traders gravitate to safe-haven gold as a hedge.
Is bitcoin making a break lower?
Bitcoin remains in consolidation but dipped a little on Wednesday, taking the price back below $27,000 and toward the lower end of its recent range. The trend of recent weeks has been against it and may suggest there's further pain to come. That said, it still pales to insignificance compared with the gains we've seen since the start of the year. The next key technical level below remains $25,000.
EUR/USD Turns Red, USD/CHF Bulls in Control
EUR/USD started a fresh decline from the 1.0830 resistance. USD/CHF is rising and might aim a move toward the 0.9060 resistance.
Important Takeaways for EUR/USD and USD/CHF Analysis Today
- The Euro struggled to clear the 1.0845 resistance against the US Dollar.
- There is a major bearish trend line forming with resistance near 1.0800 on the hourly chart of EUR/USD at FXOpen.
- USD/CHF is gaining pace above the 0.9000 resistance zone.
- There is a key bearish trend line forming with resistance near 0.9020 on the hourly chart at FXOpen.
EUR/USD Technical Analysis
On the hourly chart of EUR/USD at FXOpen, the pair faced rejection near 1.0830. The Euro started a fresh decline from the 1.0828 swing high against the US Dollar.
There was a move below the 50-hour simple moving average at 1.0800. The pair tested the 1.0765 support. A low is formed near 1.0760 and the pair is now correcting losses. It is slowly moving higher above the 23.6% Fib retracement level of the recent decline from the 1.0828 swing high to the 1.0760 low.
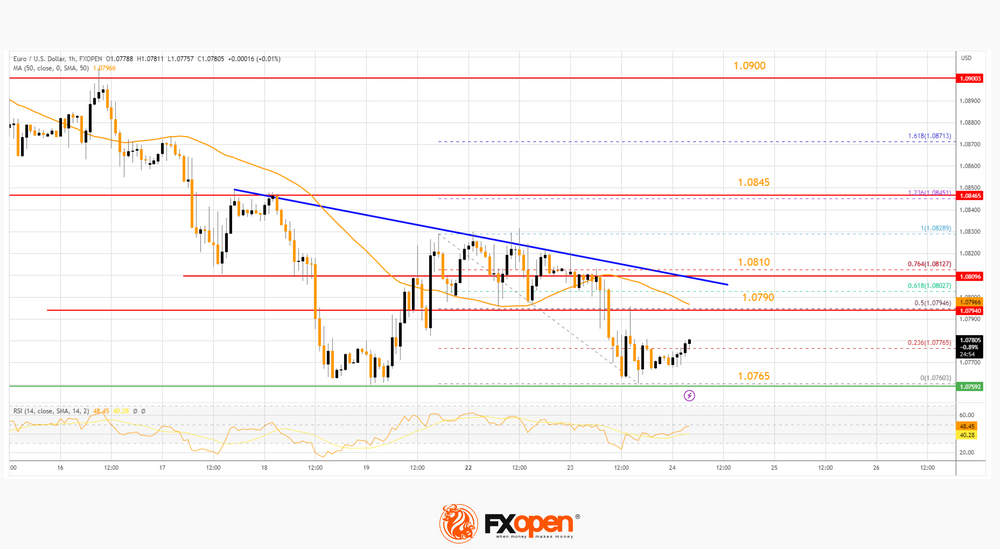
Immediate resistance on the upside is near the 50-hour simple moving average at 1.0790. It is close to the 50% Fib retracement level of the recent decline from the 1.0828 swing high to the 1.0760 low.
The first major resistance is a major bearish trend line at 1.0810. An upside break above the 1.0810 level might send the pair toward the 1.0845 resistance. The next major resistance is near the 1.0900 level. Any more gains might open the doors for a move toward the 1.0920 level.
If there is no move above 1.0810 and RSI stays below 50, the pair might start a fresh decline. On the downside, immediate support on the EUR/USD chart is seen near 1.0765.
The next major support is near the 1.0750 level. A downside break below the 1.0750 support could send the pair toward the 1.0720 level.
USD/CHF Technical Analysis
On the hourly chart of USD/CHF at FXOpen, the pair started a decent increase from the 0.8940 support. The US Dollar gained climbed above the 0.8990 resistance zone against the Swiss Franc.
The pair cleared the 50% Fib retracement level of the downward move from the 0.9062 swing high to the 0.8940 low. It is now trading above the 0.9000 level and the 50-hour simple moving average.
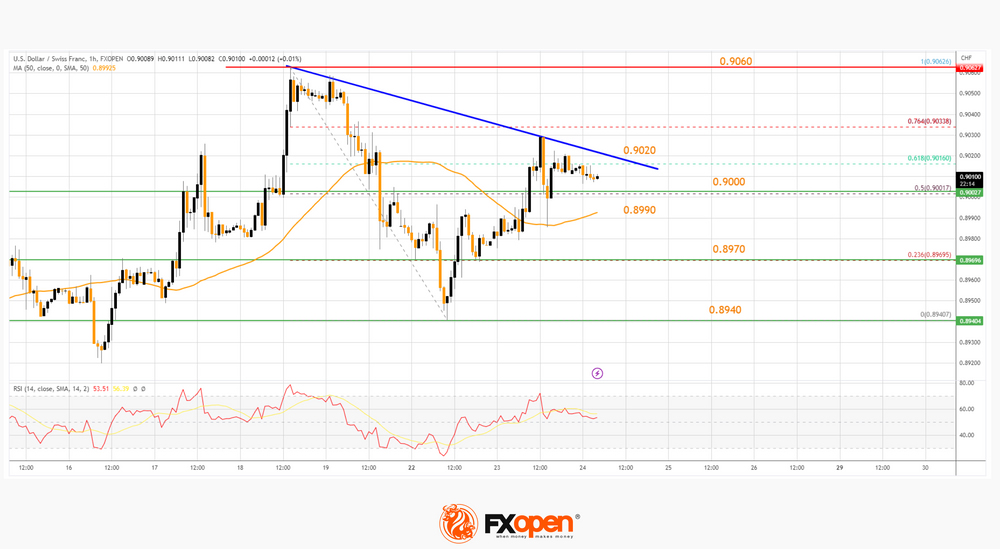
On the upside, the pair is now facing resistance near a key bearish trend line at 0.9020. It is close to the 61.8% Fib retracement level of the downward move from the 0.9062 swing high to the 0.8940 low. The next major resistance is near the 0.9060 level.
If there is a clear break above the 0.9060 resistance zone, the pair could start another increase. In the stated case, it could test 0.9120.
On the downside, immediate support on the USD/CHF chart is near 0.9000. The first major support is near the 50-hour simple moving average at 0.8990. The next major support is near the 0.8970 level. Any more losses may possibly open the doors for a move toward the 0.8974 level or even 0.8920 in the coming days.
USDJPY Remains Above 200-SMA and Within Upward Channel
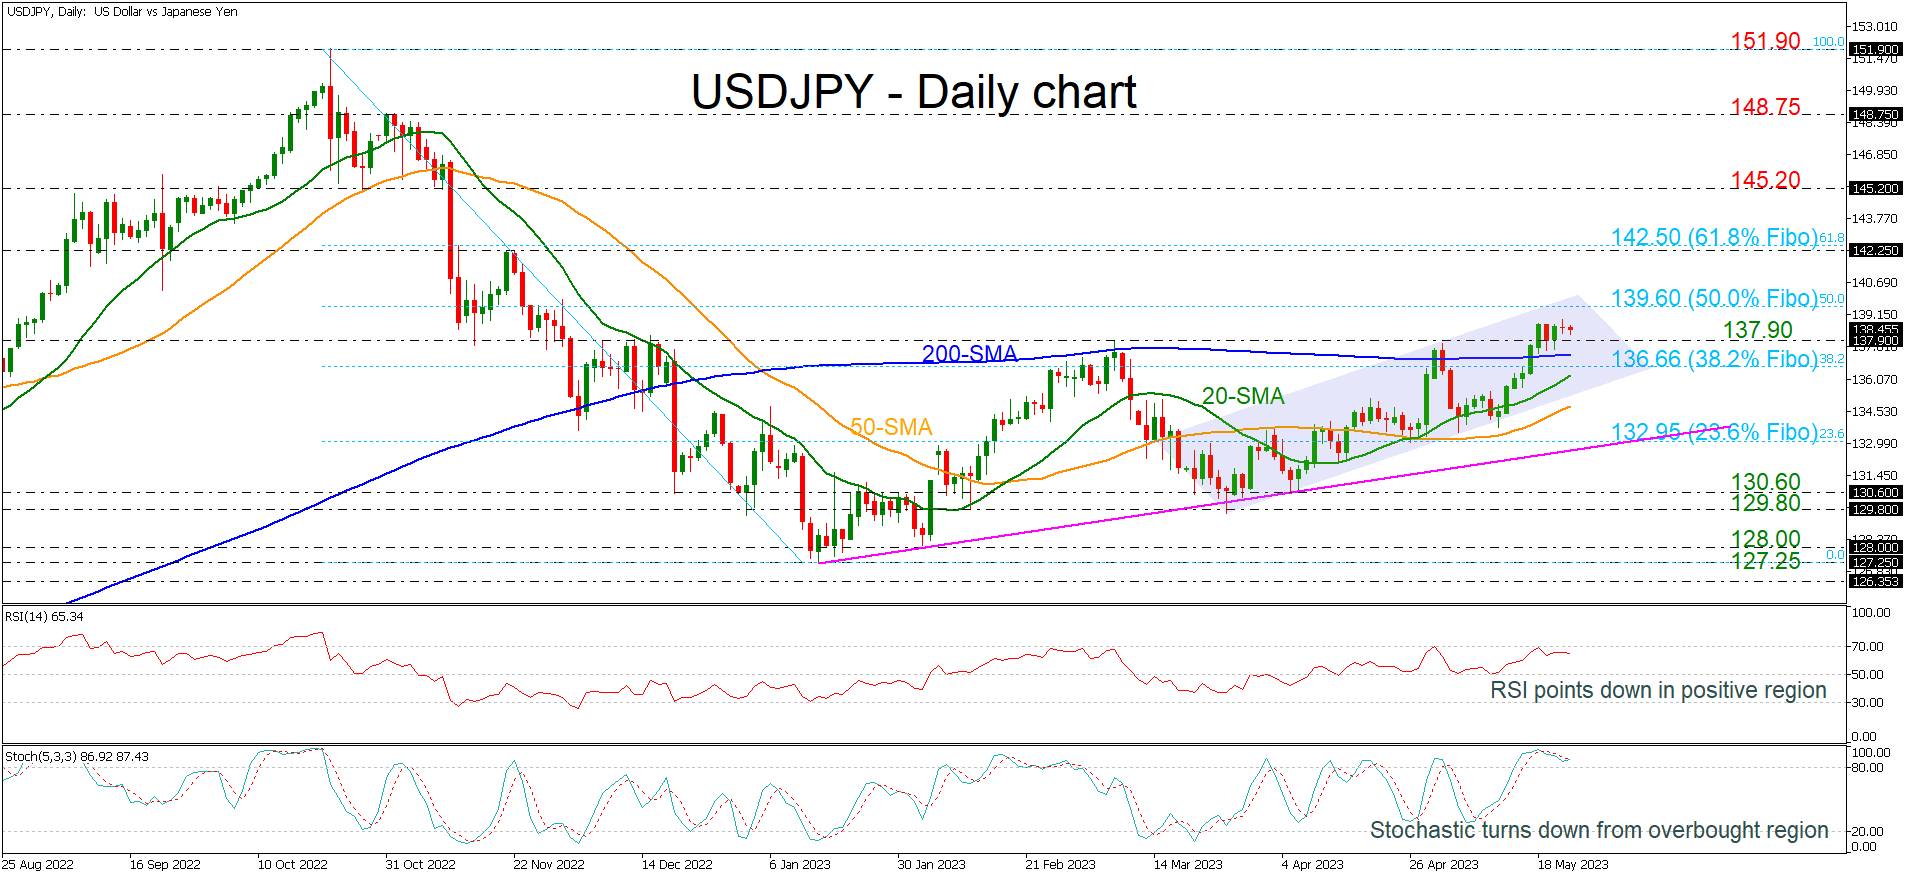
USDJPY is holding above the key 137.90 level and the 200-day simple moving average (SMA), suggesting that more bullish actions could come within the short-term upward sloping channel.
However, the technical oscillators are showing some weakness as the RSI is pointing down, failing to jump above the 70 level and the stochastic oscillator is flattening in the overbought region, indicating an overstretched market. In trend indicators, the bullish crossover within the 20- and the 50-day SMAs remains in place.
Should USDJPY make another run higher, it’s likely to meet resistance at the 50.0% Fibonacci retracement level of the downward wave from 151.90 to 127.25 at 139.60. A successful break above this resistance area would open the way for the 142.25 barrier and the 61.8% Fibonacci at 142.50.
If the soft positive momentum fails to hold and prices turn lower, the 137.90 level and the 200-day SMA at 137.20 are the nearest supports that could halt steeper declines. A potentially important support, though, is the 38.2% Fibonacci at 136.66 as well as the short-term SMAs at 136.20 and 134.85. If breached, it would shift the focus to the downside and prices would slip towards the 23.6% Fibonacci of 132.95.
In the bigger picture, USDJPY would need to make a sustained climb above the 50.0% Fibonacci of 139.60 in order for the outlook to become convincingly bullish.
Gold Tries to Bounce
USD/CHF bounces back
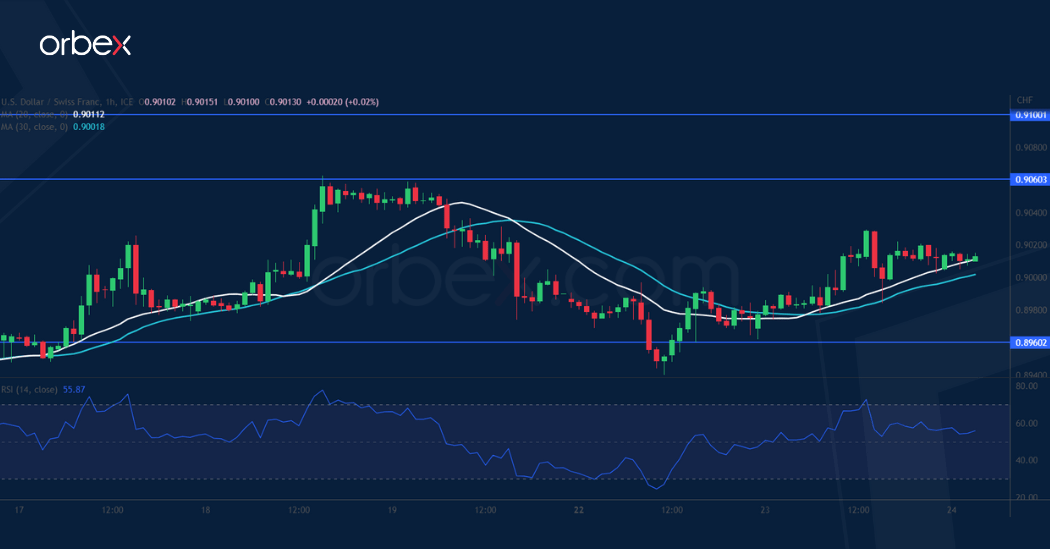
The US dollar finds support from recovering Treasury yields in the wake of hawkish Fed comments lately. Having seemingly bottomed out near January 2021’s lows at 0.8820, the pair could start to recover some lost ground. 0.8960 is the latest support and a bullish MA cross on the daily chart is an encouraging sign and could attract market participants who dread missing the rebound. After clearing the psychological level of 0.9000, 0.9060 would be the next hurdle where a subsequent breakout would lead to a runaway rally.
EUR/GBP struggles to bounce
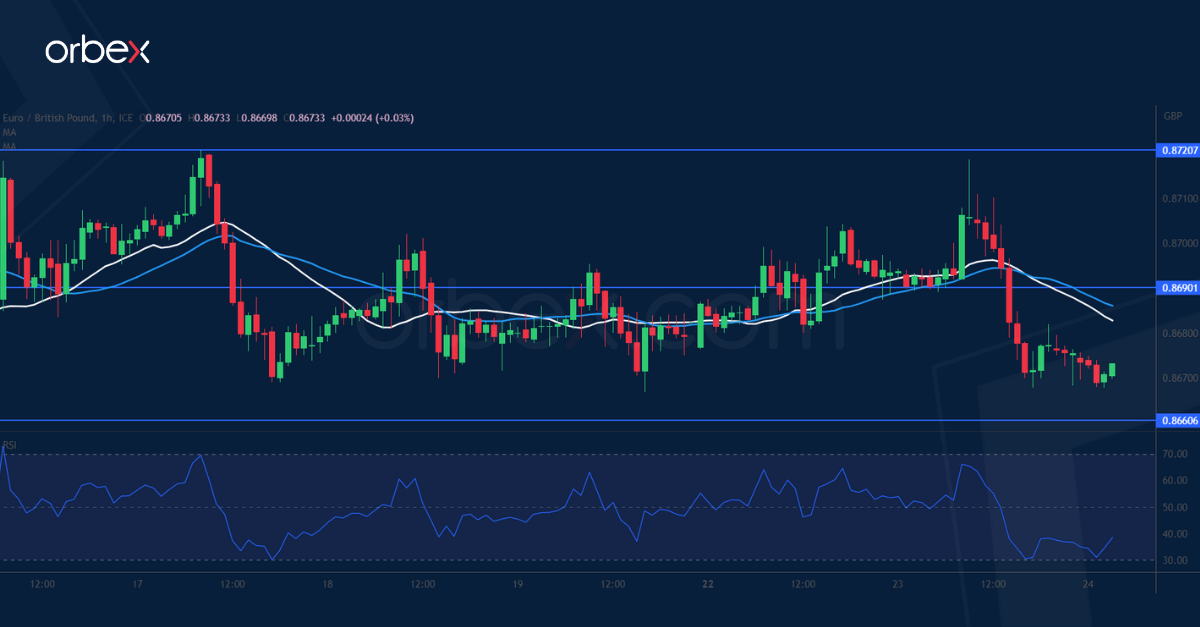
The euro softened after May’s manufacturing PMI showed signs of easing across the bloc. The bulls have been trying to hold against the bears’ repeated attempts to push below 0.8660. A breakout would expose last December’s lows around 0.8560. 0.8720 on the 20-day SMA is a major ceiling and a shooting star in this supply zone indicates a lingering selling pressure. An invalidation of 0.8690 has forced short-term buyers to bail out and put sellers back on the driver’s seat instead, turning the level into a fresh resistance.
XAU/USD tests resistance
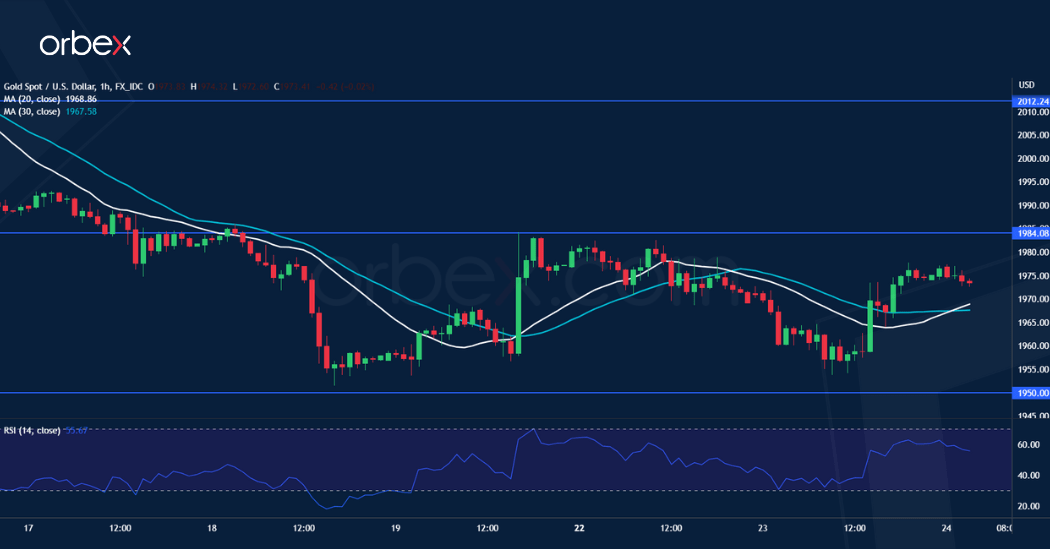
Gold rebounds amid a lack of breakthrough in the latest US debt ceiling talks. A fall below the daily support of 1980 has dented the bullish mood, prompting buyers to trim their exposure in fear of a deeper pullback. A bearish MA cross on the daily chart combined with a faded rebound at the demand-turned-supply zone around 1984 suggests that the path of least resistance could be down. A drop below 1950 would renew the selling pressure and make 1920 the next stop. 2012 is the ceiling to lift before the rally could resume.
Watch Out, You Bears
Debt ceiling talks in the US led to some progress, but no deal was reached yesterday. The two sides are apparently close in some areas – they both want to avoid a default – but the Republicans need ‘some movement or some fundamental change’ on the White House deck. Republicans want to slash spending over as long as possible, while Democrats offer little cuts over a couple of years. But the time is ticking louder as the US Treasury’s General Account goes south at a decent pace, and the US will soon run out of money to pay its bills.
And even though there is a strong belief that the US politicians are not foolish to trigger a self-induced economic crisis and that they will reach a deal just before time, appetite in risk assets looks weakened. Both the S&P 500 and Nasdaq lost more than 1% yesterday, while the US 2-year yield spiked to 4.40%, though it’s sharply lower this morning. Gold somehow struggles gathering positive momentum, and even the Swiss franc doesn’t benefit from safe haven inflows, as the US dollar is where investors seek refuge – as absurd as it sounds.
Watch out, you bears
Crude oil performed well on Tuesday despite the US debt ceiling shenanigans, as the Saudi Prince Abdulaziz bin Salman warned oil bears to watch out. The prince said speculators will be ouching ‘as they ouched in April’, that he doesn’t need to show his cards because he is not a poker player, but that he would just tell them to watch out.
In summary, bin Salman gave a clear hint that OPEC is preparing to announce another output cut when it meets at the beginning of June.
US crude jumped more than 2% yesterday after his warnings. There is a good chance that the oil bears will gently turn neutral into the OPEC announcement, and that we will see the price of a barrel test the 50 and 100-DMA to the upside.
But it’s important to note that any OPEC-induced boost to oil prices will likely remain short lived. The 200-DMA, which stands a touch below the $80pb level, will likely continue act as a solid resistance to any rally in the short run.
UK inflation slows, but less than expected
In May, both manufacturing and services PMI were lower than expected and lower than the previous readings in Britain. Yet, service-sector companies reported the fastest increase in cost pressures in 3 months.
Released this morning, the latest CPI fell less than expected by analysts while core inflation spiked to 6.8% unexpectedly, hinting that the Bank of England (BoE) will unlikely see inflation slump as fast as it expects in the second half of the year, and more rate hikes could be needed in the UK.
But maybe not in New Zealand. Even though the Reserve Bank of New Zealand raised interest rates to the highest levels in more than 14 years pointing at inflation that ‘remains too high’, the bank’s forecasts signaled that its tightening cycle has peaked amid an unexpected GDP contraction of 0.6% in Q4 of 2022 and a subdued near-term outlook for activity. The kiwi-dollar took a dive following the decision and is preparing to test the 200-DMA.
Debt Ceiling Anxiety Grows
Market movers today
Today we get IFO figures, which will shed some more light on the German growth momentum, after PMI figures yesterday further intensified the two-speed economy narrative.
In the FOMC minutes, focus will be on the banking sector turmoil and how it is seen affecting the monetary policy outlook, and any hints on the future policy rate outlook.
We will also keep an eye on UK April CPI inflation. Energy is set to drag headline inflation significantly lower. This is the first of two inflation prints ahead of the next BoE meeting where we expect a 25bps hike.
The 60 second overview
Macro: The release of US flash PMIs for May was a mixed bag. The manufacturing sector index fell below 50 again, while the service sector index rose to 55.1 - the highest level in a year.
US: Talks to solve the debt ceiling problem continued yesterday showing some progress, but no result. Meanwhile anxiety in the Treasury bills market grows with front-end bills briefly topping 6% yesterday. The market eyes 1 June as the potential X-date, when the US government risks running out of money. The yield on the Treasury bill maturing 1 June rose 2.5pp above the yield on the bill maturing 30 May yesterday.
New Zealand: Another major central bank looks done raising interest rates. The Reserve Bank of New Zealand hiked its key policy rate 25bp to 5.5% overnight and signalled an end to monetary policy tightening.
Equities: Equities retreated on Tuesday, backed by weak data. The sell-off intensified in the US session, with S&P and Nasdaq closing south of -1%. Most sectors were lower and performance was tightly bunched. Almost all cyclicals a percent lower, while defensives (energy, utilities, staples) fared better together with regional banks. VIX rose to 18.5. Europe was a little different, as real estate stocks jumped 2% and banks continued its rebound. But in sum, a pretty harsh reaction to the numbers. Futures are a tad lower again.
FI: There have been modest movements in US Treasury yields. The US Treasury curve flattened a few bp from the long end as the uncertainty regarding a deal on the Debt Ceiling increased. There were only modest moves in the EGB markets that were dominated by issuance from Germany and Netherlands as well as the new 15Y Italian linker sold through syndication.
FX: The US dollar gained ahead IFO and FOMC Minutes and continued uncertainty about the debt ceiling, while diverging flash PMIs between the euro area and the US added fundamental support for EUR/USD moving lower, below the 1.08 mark. Also CNH loses ground vs the USD. GBP eyes today's inflation numbers. As for the Scandies there is no relief yet, with EUR/SEK in the mid-11.40s and EUR/NOK testing above 11.80.
Credit: Yesterday the credit markets were trading sideways exemplified by the iTraxx main tightening by 1bp to 82bp while the Xover index widened by 2bp to 433bp. All this happened under a continued flurry of new issues from both financials and non-financials. Noticeable deals included the Finnish nuclear operator TVO, which printed a 7-year EUR600m bond at MS+165bp corresponding to a yield of 4.8%.
Nordic macro
Denmark. The Danish government has raised its estimate for the structural budget balance by 0.4% of GDP for every year from now until at least 2030. This will allow it to increase spending or lower taxes by about DKK 12bn a year without violating its structural deficit targets. The change comes after many years of actual budget surpluses far above expectations, and in that light, the new estimate still looks cautious.
Sweden. Riksbank's deputy governor Jansson (hawk) will participate in a breakfast seminar and discuss the economic situation (CET 8:00). Yesterday's speech by governor Thedéen did not provide any new insights.