

Sample Category Title
AUD/USD: Key Support Zone Under Increased Pressure
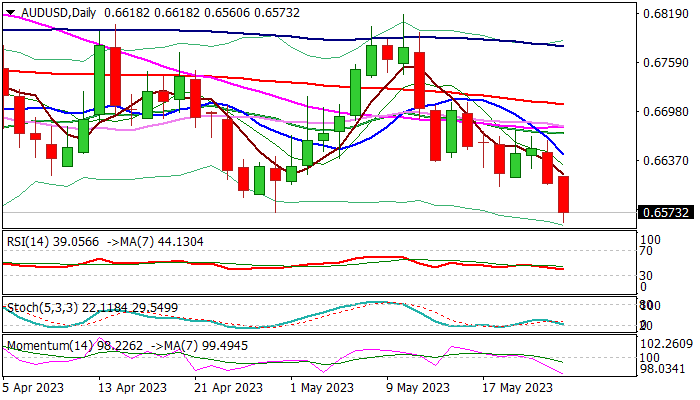
Australian dollar hit new (marginally lower) 2023 low on Tuesday, in extension of fresh weakness, sparked by higher US dollar and drop in base metal prices.
Bears cracked the floor of a larger range (0.6563/0.6818, since early March) and also pressure nearby key Fibo support at 0.6547(61.8% retracement of 0.6170/0.7157 uptrend), with sustained break of support zone to signal continuation of a downtrend from 0.7157 (2023 high of Feb 2) which was paused for consolidation in past 2 ½ months.
Bearish daily studies support the action, though significance of the support (annual low which resisted several attacks) and south-heading stochastic about to break into oversold territory, warn of increased headwinds.
Bears may slow at this area but expected to remain in play while the price action stays below falling 10DMA (0.6645).
Sustained break of 0.6560/47 pivots to spark fresh acceleration lower and expose next targets at 0.6400 zone (Fibo 76.4% / Nov 10 low).
Only firm break of upper pivots lay at 0.6670/80 zone would sideline bears and signal prolonged range-trading.
Res: 0.6618; 0.6645; 0.6680; 0.6707.
Sup: 0.6547; 0.6516; 0.6480; 0.6422.
Euro Sees Near-Term Boost, Commodity Currencies Pressured
Today's trading session saw broad selling pressure on commodity currencies, partially due to risk-off sentiment prevalent in the market and partly due to the dovish rate hike from RBNZ. As it stands, Euro seems to be the major benefactor, in part due to its rebound against Swiss Franc. However, despite a slight recovery, the common currency is still considered bearish against Dollar in the near term. The uplift in Sterling following the Consumer Price Index (CPI) data proved to be short-lived. Yen, for its part, is consolidating its recent losses and appears still poised for a near-term decline.
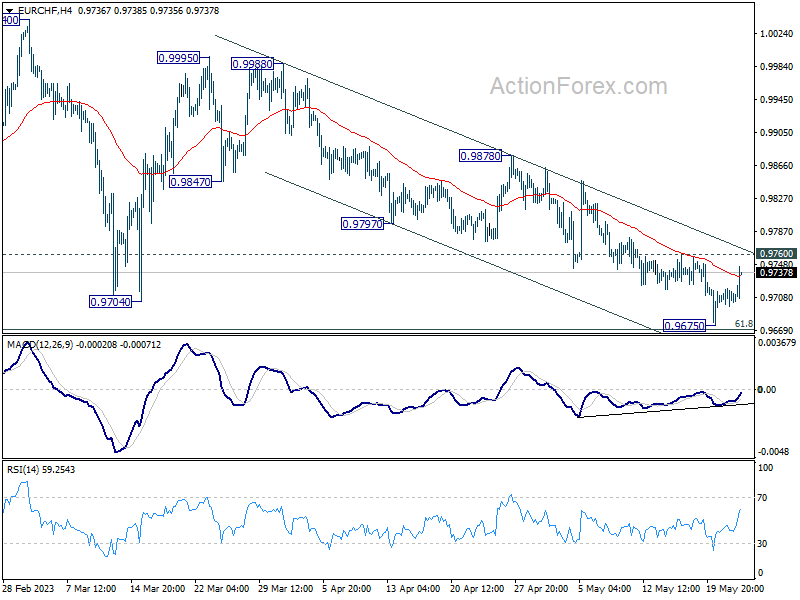
From a technical perspective, EUR/CHF could be a focal point for the remainder of the day. Break of 0.9760 resistance level will confirm short-term bottoming at 0.9675, with a bullish convergence condition in 4H MACD. This could lead to a stronger rebound towards 0.9878 resistance level. If this occurs, stronger bounce in EUR/CHF could potentially aid Euro in rebounding further against both the Dollar and Sterling.
In Europe, at the time of writing, FTSE is down -1.77%. DAX is down -1.68%. CAC is down -1.76%. Germany 10-year yield is down -0.0206 at 2.451. Earlier in Asia, Nikkei dropped -0.89%. Hong Kong HSI dropped -1.62%. China Shanghai SSE dropped -1.28%. Singapore Strait Times dropped -0.12%. Japan 10-year JGB yield rose 0.0045 to 0.409.
Bundesbank: German economy expected to have slight uptick in Q2
In their most recent monthly report, the experts at Bundesbank forecast that Germany's economic output will experience a modest increase in the second quarter of 2023. A confluence of factors, including easing supply bottlenecks, a substantial backlog of orders, and a decrease in energy prices, are all expected to bolster the ongoing recovery of the industrial sector.
Despite the continuing high inflation, the sharp rise in wages should prevent further declines in the real net income of private households. As a result, private consumption is predicted to remain steady, rather than falling.
Bundesbank stated, "The German economy stagnated in the first quarter of 2023 after shrinking in the previous quarter". The bank's experts maintain an overall slightly positive outlook for the labor market, although they note that its prospects have not brightened further in recent months.
In light of the robust labor market, high inflation, and the anticipated economic improvement, the Bundesbank predicts, "high wage agreements can also be expected in the coming months".
Germany Ifo dropped to 91.7, businesses skeptical about upcoming summer
Germany Ifo Business Climate dropped from 93.4 to 91.7 in may, below expectation of 93.4. This also marked the first decline in the index after six increases in a row. Current Assessment Index dropped from 95.1 to 94.8, worse than expectation of 95.2. Expectations Index, also dropped from 91.7 to 88.6, below expectation of 91.7.
By sector, manufacturing dropped sharply from 6.3 to -0.3. That's the largest decrease since March 2022, after the start of the war in Ukraine. Services ticked down from 6.9 to 6.8. Trade tumbled from -10.7 to -19.1. Construction also dropped from -16.6 to -18.2.
Ifo said: "Sentiment in the German economy has suffered a setback..... Driving this development are the significantly more pessimistic expectations. Managers are somewhat less satisfied with their current situation. German companies are skeptical about the upcoming summer."
UK CPI slowed to 8.7%, CPI core rose to highest since 1992
UK CPI slowed from 10.1% yoy to 8.7% yoy in April, above expectation of 8.2% yoy. On a monthly basis, CPI rose by 1.2% mom, above expectation of 0.8% mom.
CPI core (excluding energy, food, alcohol and tobacco) rose from 6.2% yoy to 6.8% yoy, above expectation of 6.2% yoy. That's the highest level since March 1992.
CPI goods annual rate eased from 12.8% yoy to 10.0% yoy, while the CPI services annual rate rose from 6.6% yoy to 6.9% yoy.
RBNZ delivered dovish rate hike
RBNZ raised OCR by 25bps to 5.50% today, reaching the projected peak interest rate. The decision was made by a 5-2 vote, with two committee members voted for no change. The central bank noted that "The OCR will need to remain at a restrictive level for the foreseeable future, to ensure that consumer price inflation returns to the 1% to 3% annual target range, while supporting maximum sustainable employment."
EUR/AUD Daily Outlook
Daily Pivots: (S1) 1.6224; (P) 1.6268; (R1) 1.6299; More...
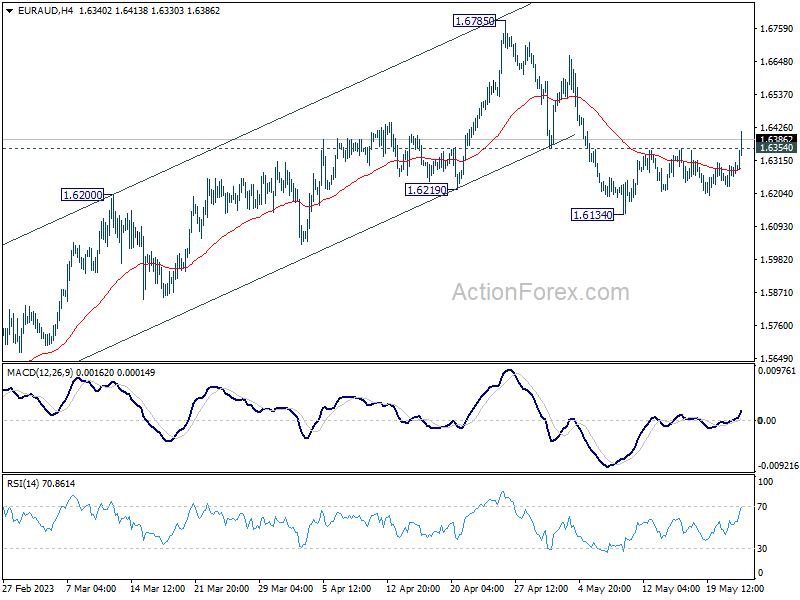
Range trading continues in EUR/AUD and intraday bias remains neutral. Fall from 1.6785 might be a correction to whole up trend from 1.4281. Break of 1.6134 will target 38.2 retracement of 1.4281 to 1.6785 at 1.5828, which is inside 1.5254/5976 support zone. Nevertheless, sustained break of 1.6354 minor resistance will turn bias back to the upside for retesting 1.6785 high instead.
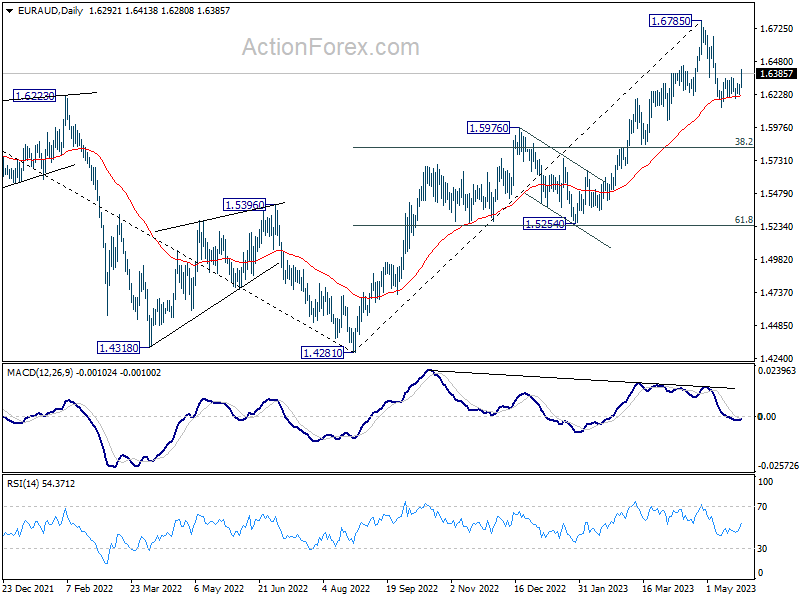
In the bigger picture, whole down trend from 1.9799 (2020 high) should have completed at 1.4281 (2022 low). Further rise should be seen to 61.8% retracement of 1.9799 to 1.4281 at 1.7691 next. For now, outlook will stay bullish as long as 1.5976 resistance turned support holds, even in case of deep pull back.
Economic Indicators Update
| GMT | Ccy | Events | Actual | Forecast | Previous | Revised |
|---|---|---|---|---|---|---|
| 22:45 | NZD | Retail Sales Q/Q Q1 | -1.40% | 0.20% | -0.60% | -1.00% |
| 22:45 | NZD | Retail Sales ex Autos Q/Q Q1 | -1.10% | -1.00% | -1.30% | -1.60% |
| 00:30 | AUD | Westpac Leading Index M/M Apr | 0.00% | 0.00% | ||
| 02:00 | NZD | RBNZ Rate Decision | 5.50% | 5.50% | 5.25% | |
| 03:00 | NZD | RBNZ Press Conference | ||||
| 06:00 | GBP | CPI M/M Apr | 1.20% | 0.80% | 0.80% | |
| 06:00 | GBP | CPI Y/Y Apr | 8.70% | 8.20% | 10.10% | |
| 06:00 | GBP | Core CPI Y/Y Apr | 6.80% | 6.20% | 6.20% | |
| 06:00 | GBP | RPI M/M Apr | 1.50% | 1.70% | 0.70% | |
| 06:00 | GBP | RPI Y/Y Apr | 11.40% | 11.20% | 13.50% | |
| 06:00 | GBP | PPI Input M/M Apr | -0.30% | -0.50% | 0.20% | |
| 06:00 | GBP | PPI Input Y/Y Apr | 3.90% | 3.80% | 7.60% | 7.30% |
| 06:00 | GBP | PPI Output M/M Apr | 0.00% | -0.10% | 0.10% | 0.00% |
| 06:00 | GBP | PPI Output Y/Y Apr | 5.40% | 7.40% | 8.70% | 8.50% |
| 06:00 | GBP | PPI Core Output M/M Apr | 0.00% | 0.10% | 0.30% | |
| 06:00 | GBP | PPI Core Output Y/Y Apr | 6.00% | 7.30% | 8.50% | 8.30% |
| 08:00 | EUR | Germany IFO Business Climate May | 91.7 | 93.4 | 93.6 | 93.4 |
| 08:00 | EUR | Germany IFO Current Assessment May | 94.8 | 95.2 | 95 | 93.1 |
| 08:00 | EUR | Germany IFO Expectations May | 88.6 | 91.7 | 92.2 | 91.7 |
| 14:30 | USD | Crude Oil Inventories | 1.5M | 5.0M | ||
| 18:00 | USD | FOMC Minutes |
ETHUSD Analysis: Hong Kong to Open Cryptocurrency Trading to Retail Investors
While Coinbase is launching an advertising campaign in Washington to convey to government officials that cryptocurrencies are technologies that can move the country forward, Hong Kong has taken a step towards a regulated cryptocurrency market.
The Hong Kong Securities and Futures Commission (SFC) announced on May 23 that rules for retail investors to trade cryptocurrencies on licensed exchanges will come into effect on June 1. It also became known that 152 applications have already been received from key industry players, professional associations and consulting firms.
The regulatory framework will cover important aspects, including asset storage security requirements, avoidance of conflicts of interest, and other standards.
Against the backdrop of positive news from Hong Kong, the price of cryptocurrencies rose yesterday. But today it is declining. For example, the price of ETH on Wednesday morning is down about 3% from the high of May 23rd.
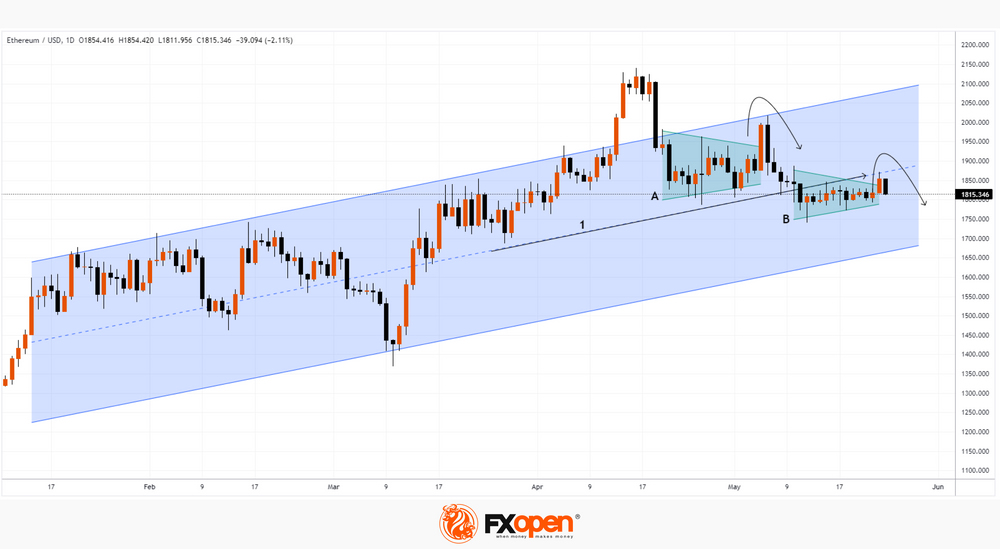
The daily ETH chart shows a disturbing picture.
Firstly, the price of Ethereum tested the median line (1) of the ascending channel yesterday (shown in blue).
Secondly, the pattern of yesterday’s and today’s candlesticks can form a false breakout of balance B. And if the ETH price dynamics develops in the same direction as during the false breakout of balance A (in early May), then the ETH rate against USD may update the lows of the year.
FTSE Drops Rapidly to April Lows Today
The FTSE 100 index is rapidly declining on Wednesday morning amid news of another spike in inflation. The Core CPI (excluding energy, food and tobacco prices) reached 6.8%, the highest in over 30 years. Market participants are now almost certain that the Bank of England will raise interest rates at its next meeting.
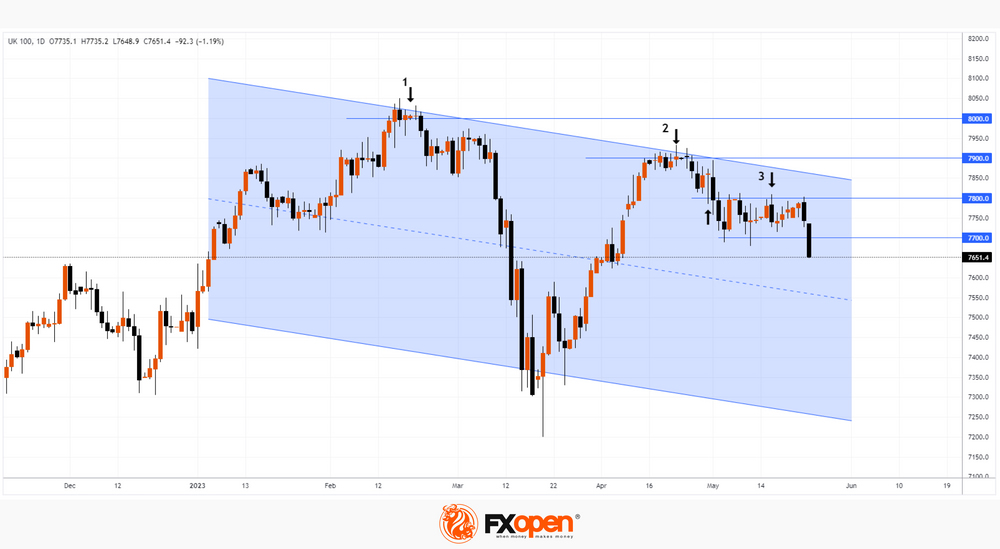
The UK100 chart (a tool that reflects the dynamics of the FTSE 100 index) shows a consistent series of bull failures around psychologically significant levels:
1→ UK100 price failed to settle above 8,000 in February;
2→ UK100 price did not fix above 7,900 in April;
3 → level 7,800 used to be support but is now resisting.
The action of the UK100 price today suggests that the level of 7,700 may now also provide resistance in an attempt to increase. If the downtrend strengthens, the FTSE may continue to decline within the channel (shown in blue), reaching its median line (or even the lower border — which would mean a 2023 low).
Above-Expected Inflation Failed to Impress Pound Buyers
Another release of UK consumer inflation well above expectations has failed to take the issue off the country’s agenda.
The report for April showed a 1.2% rise in consumer prices, compared to the 0.8% that markets were expecting this time and the previous month. Annual inflation slowed from 10.1% to 8.7% (8.2% was expected). This is a 13-month low, but still above the peak inflation levels in the early 1990s, when it was barely above 8% y/y.
The core CPI hit a new multi-year high of 6.8% y/y. It was widely expected to remain at 6.2%. The Bank of England is likely to take note of this acceleration, which demonstrates the depth of the roots of inflation.
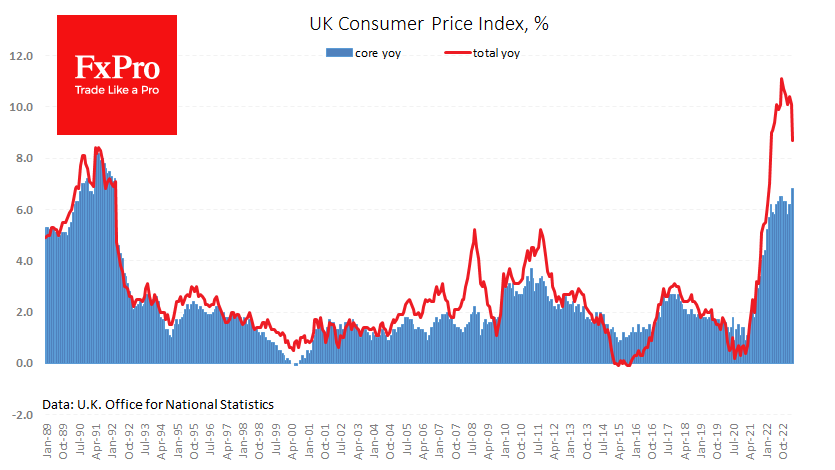
In modern UK history, core and headline inflation have moved in the same direction, albeit to different degrees. Still, the current case is characterised by a sustained rise in core inflation. This divergence is due to a tight labour market and the associated increase in service prices, which continue to rise despite the reversal in commodity prices.
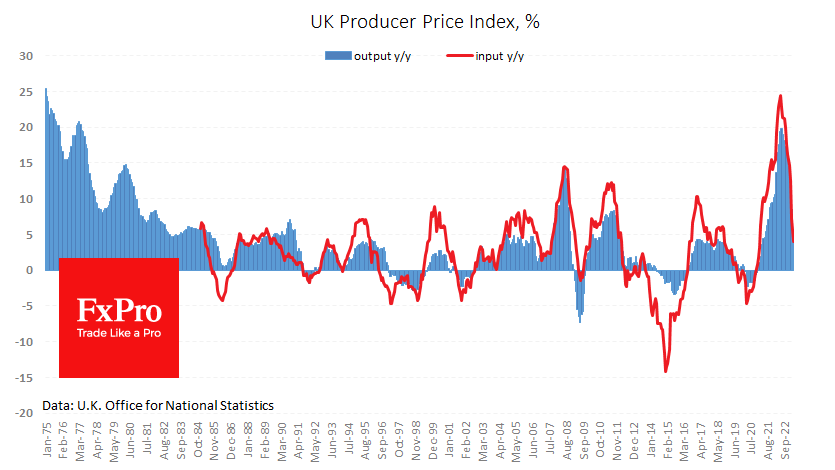
Astonishing in this story is the persistence of price rises, mainly in the final consumption stage. Producer Price Index Input fell by 0.3% in April and has now fallen in four of the last six months. Over the past year, their rise has decreased to 4.0%.
Producer Price Index Output was unchanged for the third month, and the year-on-year rate of increase slowed to 5.4%, compared with 8.5% the previous month and a peak of 19.8% in July last year.
Producer price trends tend to lead consumer price trends by several months.
Immediately following the release of the inflation data, the GBPUSD rallied, at one point approaching 1.2470. This was likely the result of algorithmic strategies acting on above-expectation headline CPI numbers.
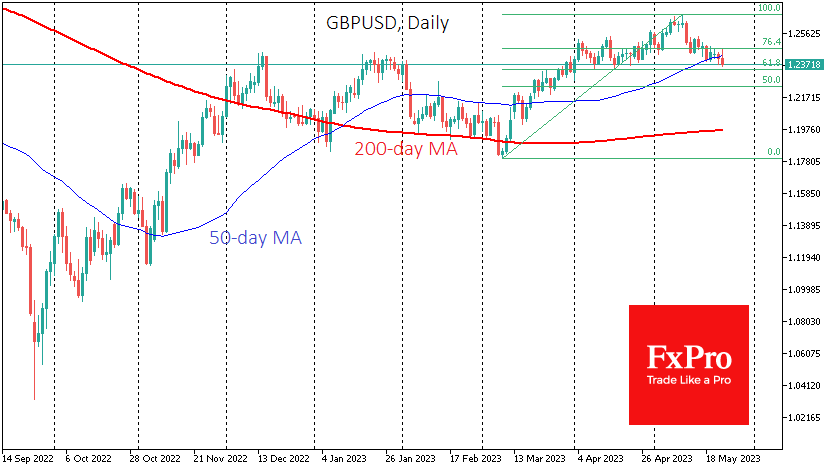
However, the pound soon reversed and fell below 1.2390 for a few hours. This drop brought the British currency back into the downtrend of the last two weeks and prevented the cable from staying above its 50-day moving average. Technically, the decline has a high probability of extending to 1.2340-1.2350, the area of last month’s lows and the 61.8% Fibonacci retracement level of the rise from 1.18 in March to 1.2680 in early May. It is also the area of the December and January highs, making a test of this area even more cautious.
A solid move lower from current levels would signal a market shift in favour of the dollar for many weeks to come. The ability to hold these levels and move higher would signal that the Pound remains within the bullish trend that has been in place since late September.
GBP/USD Dips after Disappointing UK Inflation
- UK headline inflation falls but the core rate jumps
- US debt ceiling impasse continues, boosting US dollar
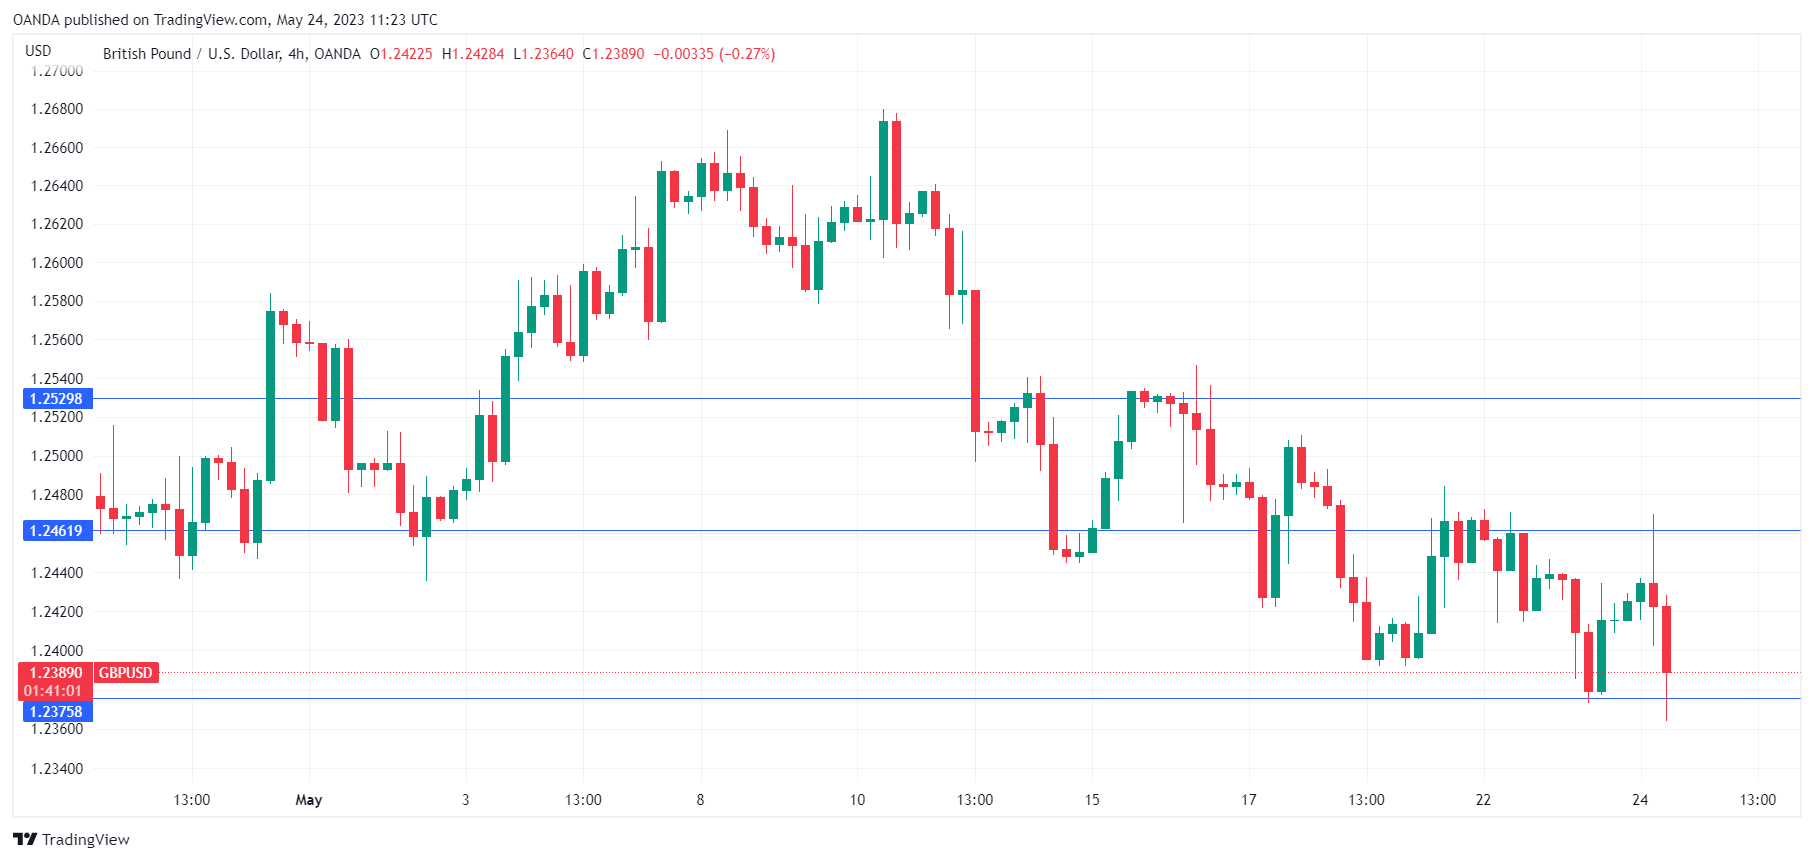
GBP/USD is down for a third straight day, trading at 1.2374, down 0.33%. Earlier, GBP/USD touched a low of 1.2369, its lowest level since April 18th. The FOMC releases the minutes of the May meeting later today.
UK inflation a mixed bag
The closely-watched UK inflation report for April was a disappointment. There was some good news as headline inflation fell to 8.7%, down sharply from 10.1%. Hopefully, this is the end, finally, of inflation in double-digit territory. Still, the reading was above the estimate of 8.2%.
There was nothing positive about core CPI, which is the more important gauge of inflation. The core rate jumped from 6.2% to 6.8%. Forecasters had expected core CPI to remain at 6.2% and the unexpected rise is clearly a big step backward for the Bank of England in its tenacious battle with inflation. Governor Bailey is speaking at two public engagements today, and we can expect him to make mention of the inflation report.
The BoE has raised rates by 1% this year, bringing the cash rate to 5.25%, but inflation has proven to be persistent. The IMF has projected that UK inflation would fall to around 5% by the end of the year and drop to the 2% target by the middle of 2025. It will be a bumpy road to restore low inflation, and the BoE will probably have to raise rates again in June, unless core inflation surprises dramatically on the downside.
US debt ceiling impasse continues
US lawmakers continue to fight over the debt ceiling, as US Treasury Secretary Yellen has warned that the ceiling could be reached on June 1st, which doesn’t leave a lot of time for an agreement. Republicans have said Yellen’s date isn’t accurate, but even if the deadline is a week or two later, Congress seems to be playing with fire to score political points. Investors are worried, and stock markets are down while safe-havens such as gold and the US dollar are higher. We’ve seen this movie before, and Congress has always reached a deal before the deadline. Still, we can expect risk sentiment to slide and the US dollar to gain ground the longer we go without a deal.
GBP/USD Technical
- GBP/USD tested support at 1.2375 in the European session. Below, there is support at 1.2307
- 1.2461 and 1.2529 are the next resistance levels
Nasdaq 100 Technical: Bulls Getting Exhausted
- Bearish reversal elements have been sighted for Nasdaq 100
- The +30% up move from the 28 December low has reached the upper boundary of the “Ascending Wedge”, a bearish reversal chart pattern.
- The key short-term resistance to watch will be at 13,835.
This is a follow-up on a prior report, “Nasdaq 100 bulls may be too optimistic on US CPI” that has been published earlier on 11 May (click here for a recap).
The Nasdaq 100 has been the strongest performing major US stock index since October 2022 fuelled by solid gains seen in the mega market capitalization-weighted technology stocks; Meta/Facebook, Apple, Amazon, Netflix, Alphabet/Google, Microsoft, and NVIDIA. Interestingly, it underperformed yesterday, 23 May against the other indices with a loss of -1.28%; S&P 500 (-1.12%), Dow Jones Industrial Average (-0.69%), Russell 2000 (-0.43%), its worst daily performance since 25 April.
Nasdaq 100 Technical Analysis – Bearish elements sighted at “Ascending Wedge” resistance
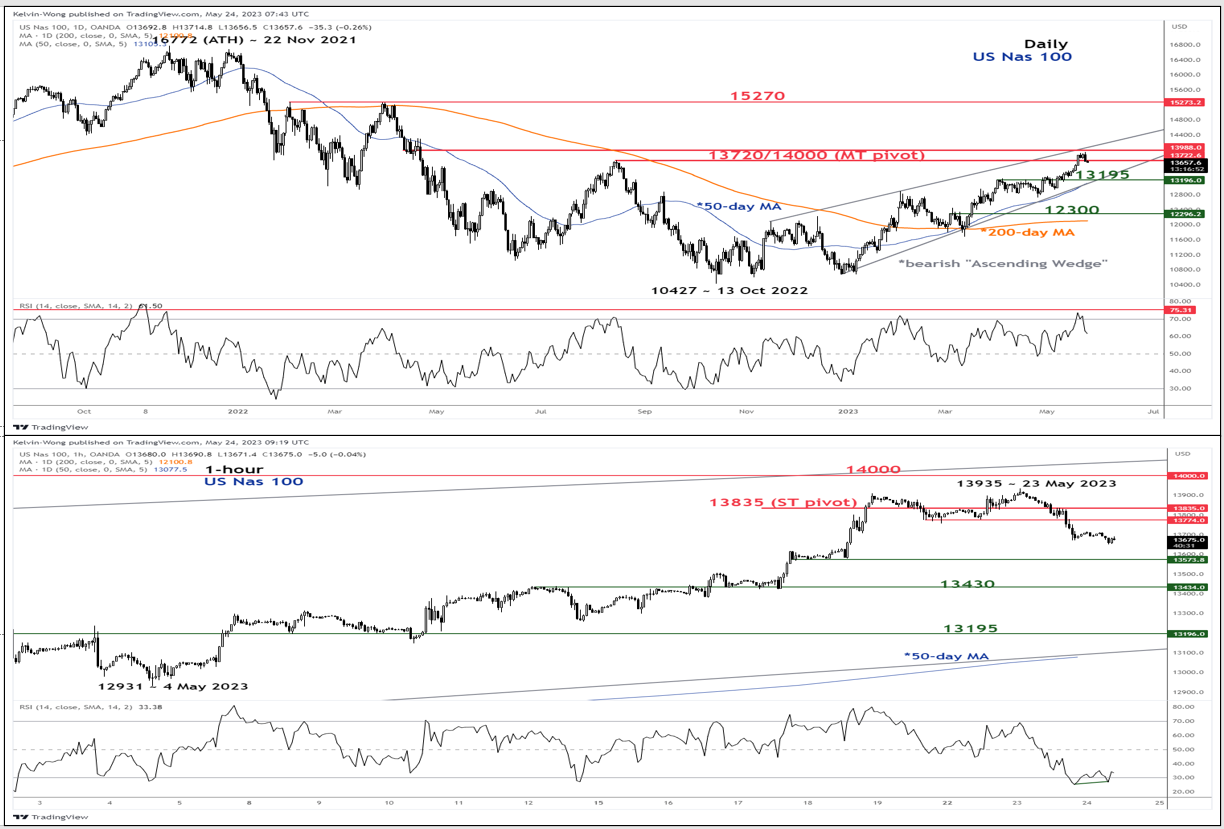
Fig 1: US Nasdaq 100 trend as of 24 May 2023 (Source: TradingView, click to enlarge chart)
The +30% up move seen on the US Nas 100 Index (a proxy for the Nasdaq 100 futures) from its 10,675 low of 28 Dec 2022 to its recent high of 13,935 printed on 23 May 2023 has reached the upper boundary/resistance of a major “Ascending Wedge” configuration which tends to represent a bearish reversal pattern.
In addition, the daily RSI oscillator has just exited from its overbought region which reinforces the view that the upside momentum of the up move from the 28 December 2022 low of 10,675 has dissipated and increased the probability of a bearish reversal move in price actions at this juncture.
In the shorter term as depicted on the hourly chart, yesterday’s slide of -2% from the 23 May 2023 high of 13,935 has led the hourly RSI to reach its oversold region which may see a risk of a minor bounce to retrace a portion of the earlier -2% decline.
Key short-term pivotal resistance at 13,835 to maintain the bearish tone with intermediate support at 13,430 and follow by 13,195 next (50-day moving average & the lower boundary of the “Ascending Wedge”). On the other hand, a clearance above 13,835 negates the bearish tone to see the medium-term resistance coming in at 14,000 (upper boundary of the “Ascending Wedge”).
Bundesbank: German economy expected to have slight uptick in Q2
In their most recent monthly report, the experts at Bundesbank forecast that Germany's economic output will experience a modest increase in the second quarter of 2023. A confluence of factors, including easing supply bottlenecks, a substantial backlog of orders, and a decrease in energy prices, are all expected to bolster the ongoing recovery of the industrial sector.
Despite the continuing high inflation, the sharp rise in wages should prevent further declines in the real net income of private households. As a result, private consumption is predicted to remain steady, rather than falling.
Bundesbank stated, "The German economy stagnated in the first quarter of 2023 after shrinking in the previous quarter". The bank's experts maintain an overall slightly positive outlook for the labor market, although they note that its prospects have not brightened further in recent months.
In light of the robust labor market, high inflation, and the anticipated economic improvement, the Bundesbank predicts, "high wage agreements can also be expected in the coming months".
Gold’s Bears Take the Upper Hand
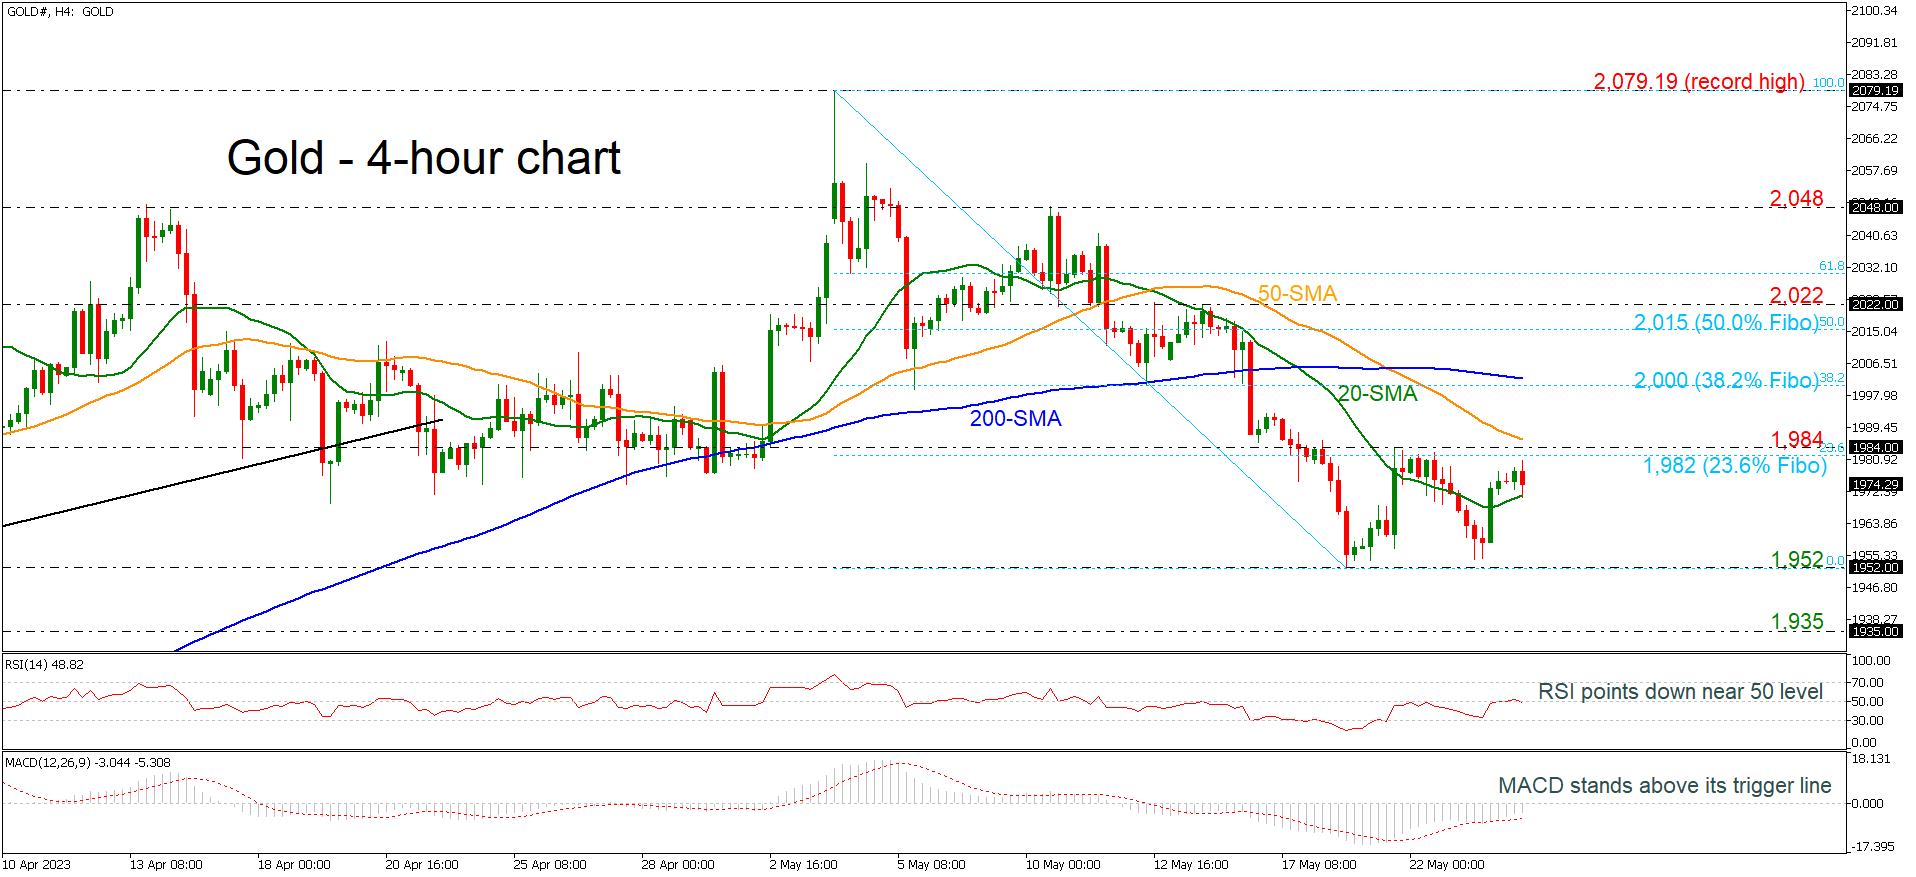
Gold remains under pressure and risk is still to the downside as prices continue to drift lower from the 2,079.19 record high. The short-term technical indicators are bearish and point to more weakness in the market.
Looking at the 4-hour chart, gold prices are being capped by the 1,984 resistance and the 23.6% Fibonacci retracement level of the down leg from 2,079.19 to 1,952 at 1,982. The RSI is pointing down below the neutral threshold of 50, while the MACD is standing in the negative territory above its trigger line.
The next target to the downside is the 1,952 support level. At this stage the market would likely see a resumption of the downtrend and put in place a lower low at 1,935.
Upside moves are likely to find resistance at the 23.6% Fibonacci at 1,982 ahead of the 1,984 barrier. There is an important resistance zone between the 2,000 psychological mark and the 200-period SMA at 2,003. Breaking this level could see a re-test of the 50.0% Fibonacci at 2,015 and turn the bias to bullish.
In the short-term, the bearish phase remains in play especially if gold prices continue to trade below the 23.6% Fibonacci and under the key 2,000 level.
Crypto Hits the Ceiling
Market picture
The crypto market lost 1.8% over the past 24 hours to $1.120 trillion, returning to Monday’s levels. The growth momentum of the previous day was not supported by the new portion of bad news about the debt ceiling, which launched a pull from risky assets.
Over the past 24 hours, Bitcoin has lost 2.2%, Ethereum 2%, and the top altcoins have lost between 1% (XRP) and 5.8% (Litecoin).
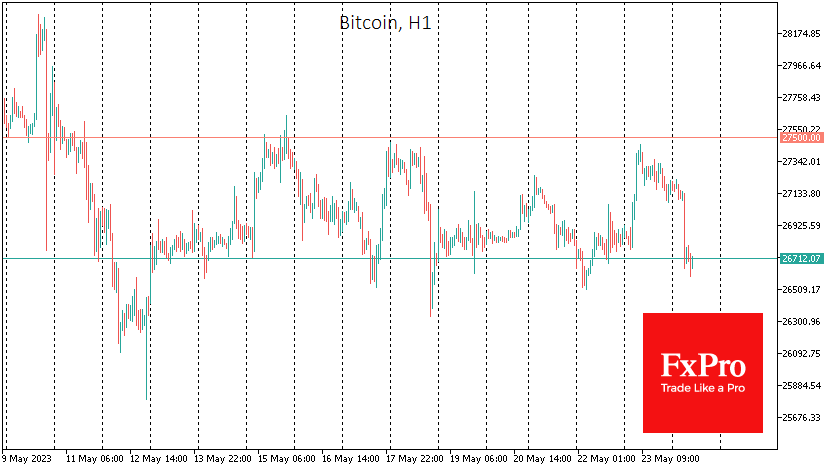
Bitcoin is trading near $26650 on Wednesday morning, near the lower end of its trading range since May 13. The upper boundary of this corridor, 27300, remains a significant upside hurdle. A simple scenario codenamed “what doesn’t go up, goes down” could soon come to fruition in Bitcoin. Also on the bears’ side is that the former cryptocurrency is under the 50-day moving average, settling there long enough after the failure, and now former support works as resistance.
BTC volatility has fallen to a five-month low. Last week, the narrow range of BTC quotations coincided with a meagre volume of transferred on-chain value. Most of the coins are “napping” in anticipation of higher prices.
News background
Since 13 April, following the activation of the Shapella hardfork on the Ethereum network, the volume of ETH in stacks has increased by 4.4 million coins. In total, 22.5 million ETH, or approximately 18% of the total supply, have been staked on the blockchain.
Strike, a Lightning Network-based payment application operator, announced the integration of the Tether (USDT) into its platform.
Bloomberg reports that the Hong Kong Securities and Futures Commission (SFC) will officially allow retail investors to trade cryptos from June 2023.
According to The Block, the share of trading volume on decentralised exchanges (DEX) has reached a record high, surpassing 22% for the first time amid the popularity of meme cryptocurrencies. Users are not waiting for them to be listed on centralised exchanges (CEXs) but are switching to DEXs to buy meme tokens.
Government authorities could use the courts to demand access to funds in Ledger wallets connected to Recover’s private key recovery service, the hardware cryptocurrency wallet maker confirmed but called such a scenario unlikely.