Sample Category Title
GBP/JPY Daily Outlook
Daily Pivots: (S1) 171.35; (P) 171.99; (R1) 172.69; More...
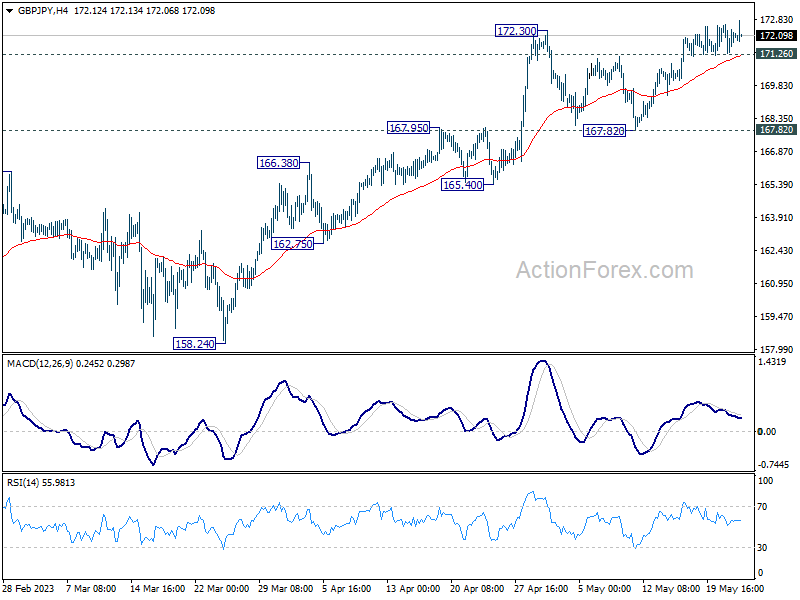
Intraday bias in GBP/JPY stays mildly on the upside despite loss of upside momentum as seen in 4H MACD. Current rally should target 100% projection of 148.93 to 172.11 from 155.33 at 178.51. Nevertheless, break of 171.26 minor support will delay the bullish case, and turn bias to the downside for deeper retreat.
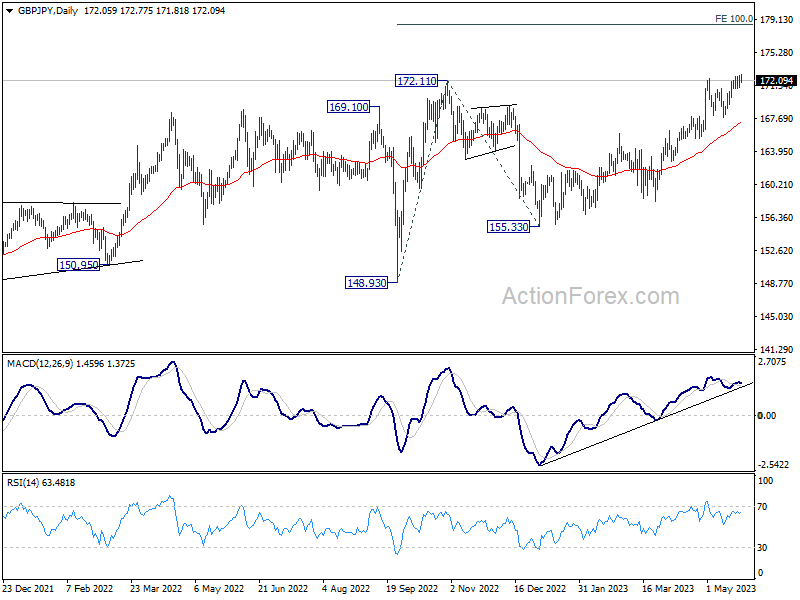
In the bigger picture, focus stays on 172.11 resistance (2022 high). Decisive break there will resume whole up trend from 123.94 (2020 low). Next target will be 161.8% projection of 122.75 (2016 low) to 156.59 (2018 high) from 123.94 at 178.69. Nevertheless, firm break of 165.40 support will indicate rejection by 172.11 and extend the corrective pattern from there with another falling leg.
EUR/GBP Daily Outlook
Daily Pivots: (S1) 0.8657; (P) 0.8688; (R1) 0.8707; More...
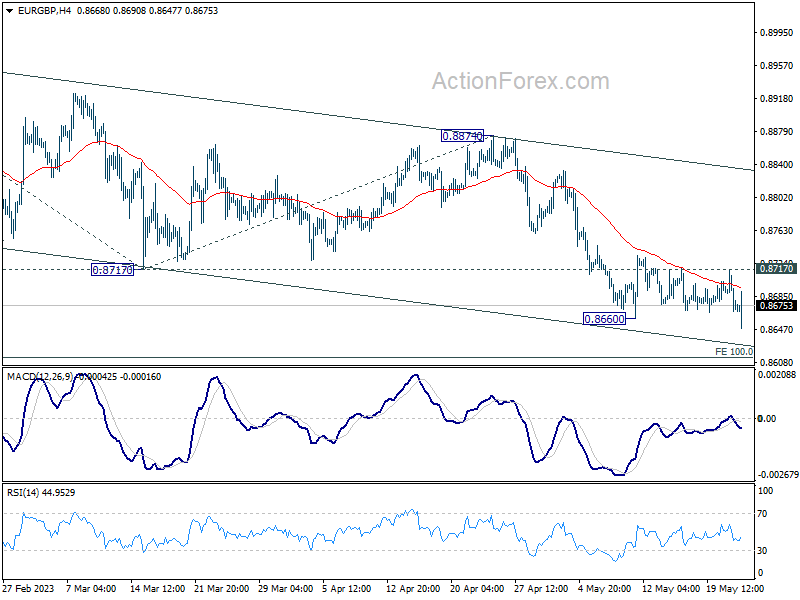
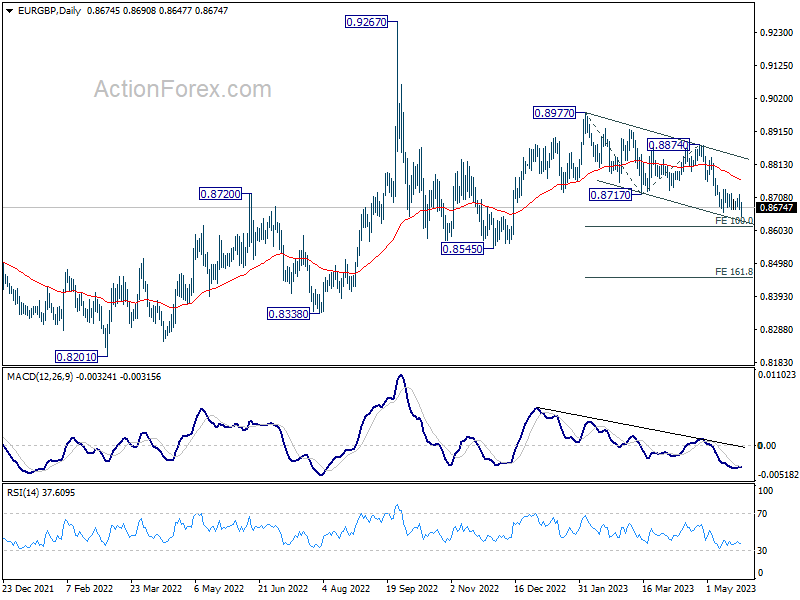
EUR/GBP's fall from 0.8977 is trying to resume by breaking 0.8660 support. Intraday bias is back on the downside for 100% projection of 0.8977 to 0.8717 from 0.8874 at 0.8614. On the upside, however, break of 0.8717 will indicate short term bottoming, and turn bias back to the upside for stronger rebound.
In the bigger picture, current development argues that whole decline from 0.9267 (2022 high) is still in progress. This is part of the long term range pattern from 0.9499 (2020 high). Deeper fall would be seen through 0.8545 support. This will now remain the favored case as long as 0.8874 resistance holds.
EUR/AUD Daily Outlook
Daily Pivots: (S1) 1.6246; (P) 1.6278; (R1) 1.6326; More...
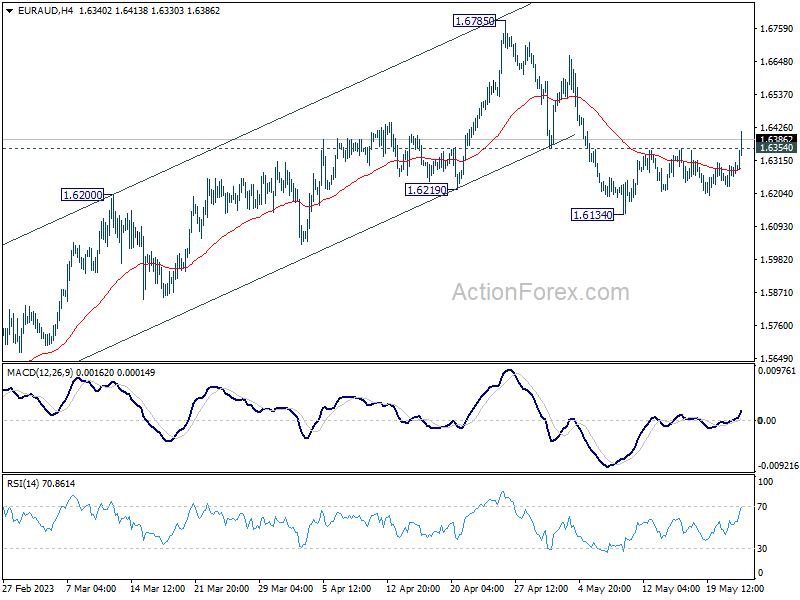
EUR/AUD's break of 1.6354 resistance argues that fall from 1.6785 has completed at 1.6134, after drawing support from 55 D EMA (now at 1.6222). Intraday bias is back on the upside for retesting 1.6785 high. On the downside, however, break of 1.6134 will resume the decline to 38.2 retracement of 1.4281 to 1.6785 at 1.5828
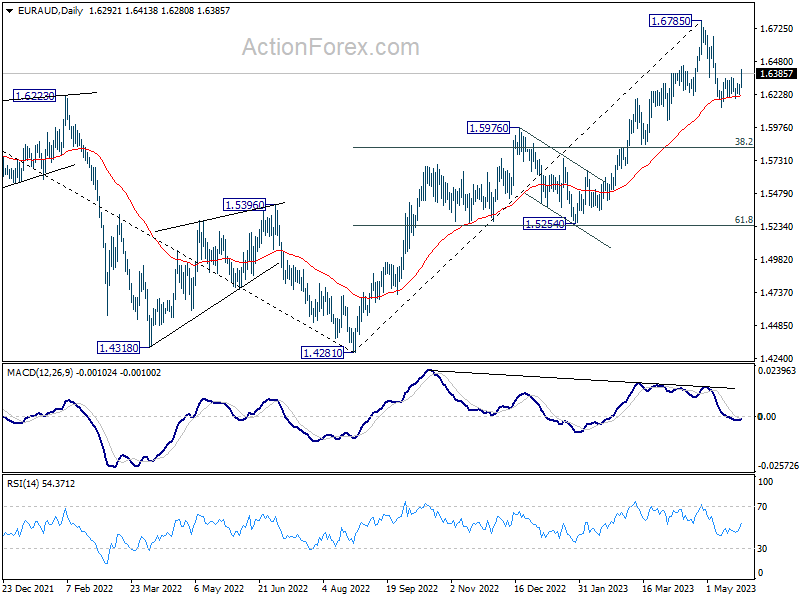
In the bigger picture, whole down trend from 1.9799 (2020 high) should have completed at 1.4281 (2022 low). Further rise should be seen to 61.8% retracement of 1.9799 to 1.4281 at 1.7691 next. For now, outlook will stay bullish as long as 1.5976 resistance turned support holds, even in case of deep pull back.
EUR/CHF Daily Outlook
Daily Pivots: (S1) 0.9699; (P) 0.9710; (R1) 0.9720; More...
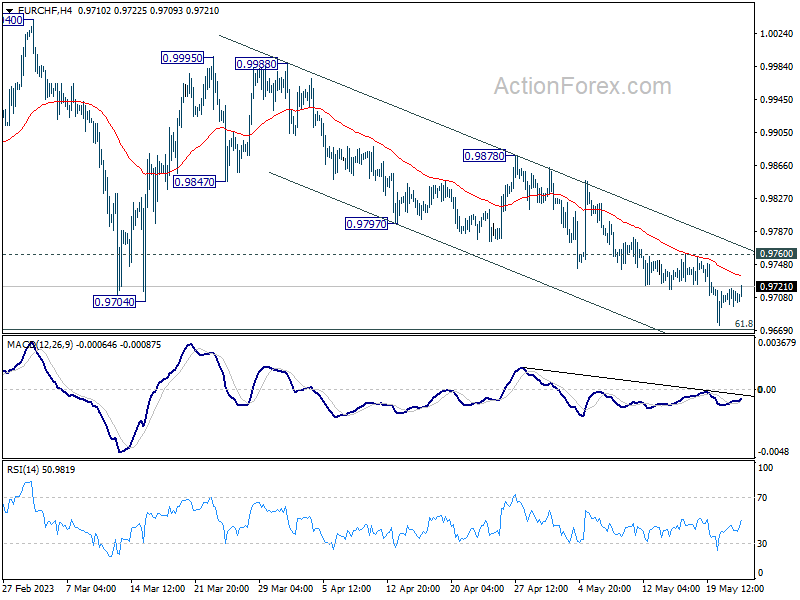
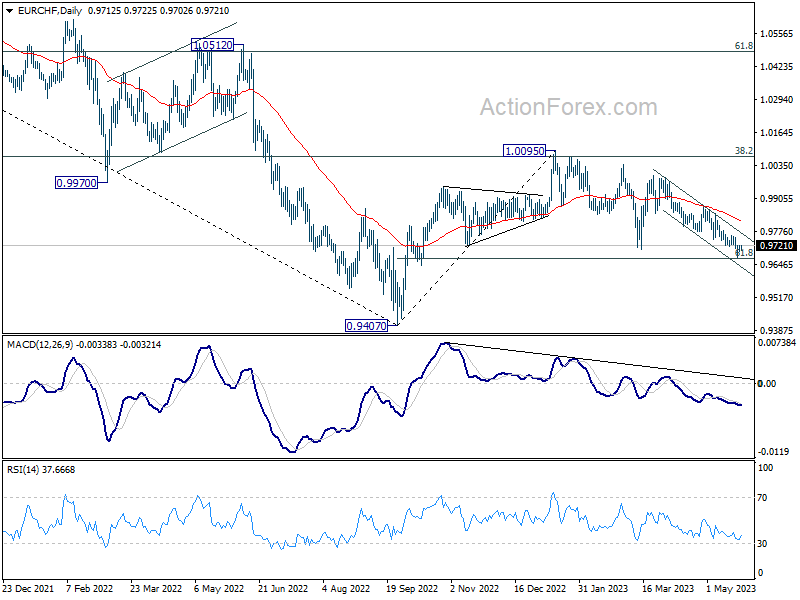
Intraday bias in EUR/CHF is turned neutral with current recovery. On the upside, firm break of 0.9760 resistance will confirm short term bottoming, just ahead of 61.8% retracement of 0.9407 to 1.0095 at 0.9670. Intraday bias will be back on the upside for 0.9878 resistance next. However, sustained break of 0.9670 will pave the way back to 0.9407 low.
In the bigger picture, prior rejection by 38.2% retracement of 1.1149 to 0.9407 at 1.0072 suggests that medium term outlook is staying bearish. The pair is also capped below 55 W EMA (now at 0.9963). Down trend from 1.2004 is not completed yet and is in favor to resume through 0.9407 at a later stage. However, decisive break of 1.0095 resistance will raise the chance of bullish trend reversal. Rise from 0.9407 should then target 1.0505 cluster resistance (2020 low at 1.0505, 61.8% retracement of 1.1149 to 0.9407 at 1.1484).
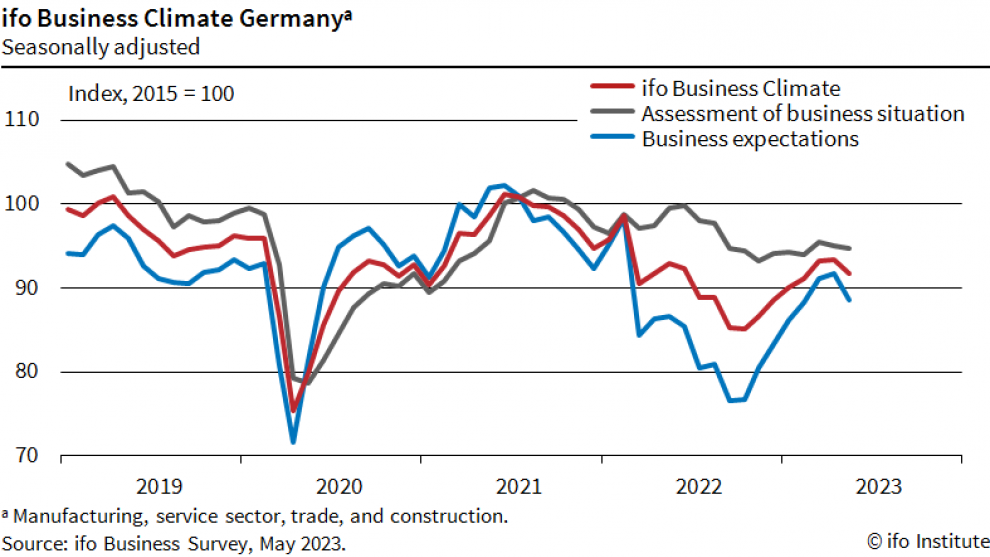
Germany Ifo dropped to 91.7, businesses skeptical about upcoming summer
Germany Ifo Business Climate dropped from 93.4 to 91.7 in may, below expectation of 93.4. This also marked the first decline in the index after six increases in a row. Current Assessment Index dropped from 95.1 to 94.8, worse than expectation of 95.2. Expectations Index, also dropped from 91.7 to 88.6, below expectation of 91.7.
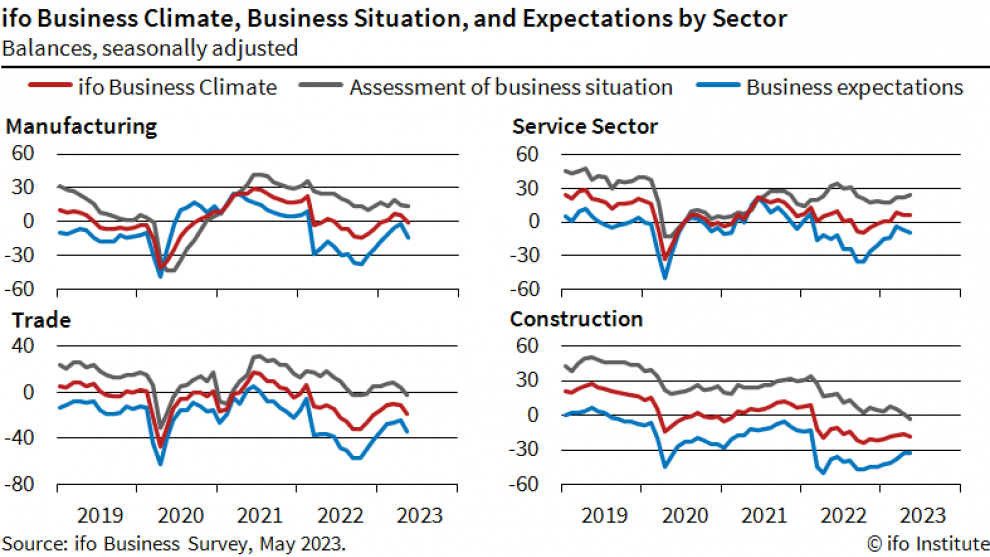
By sector, manufacturing dropped sharply from 6.3 to -0.3. That's the largest decrease since March 2022, after the start of the war in Ukraine. Services ticked down from 6.9 to 6.8. Trade tumbled from -10.7 to -19.1. Construction also dropped from -16.6 to -18.2.
Ifo said: "Sentiment in the German economy has suffered a setback..... Driving this development are the significantly more pessimistic expectations. Managers are somewhat less satisfied with their current situation. German companies are skeptical about the upcoming summer."
Spotlight on PCE Inflation and Fed Minutes after Powell Hints at Pause
As Fed officials contemplate whether to pause or not, some vital inflation data will be watched on Friday (12:30 GMT) in the form of the core PCE price index, while the minutes of the May FOMC meeting (Wednesday, 18:00 GMT) might further stir things up in the pause debate. One thing is clear though – the Fed has never been so data dependent and the June decision will likely be a very close call. So what should we expect from the incoming data and are there more gains in store for the US dollar?
More rate hikes to come?
Markets just can’t seem to make up their minds about a rate hike in June amid some conflicting views lately from policymakers about where they stand on the matter. Expectations had been low to begin with, but the hawkish bets started to gather steam when a majority of Fed speakers appeared to back another rate increase despite the Fed having opened the door to a pause at the last meeting.
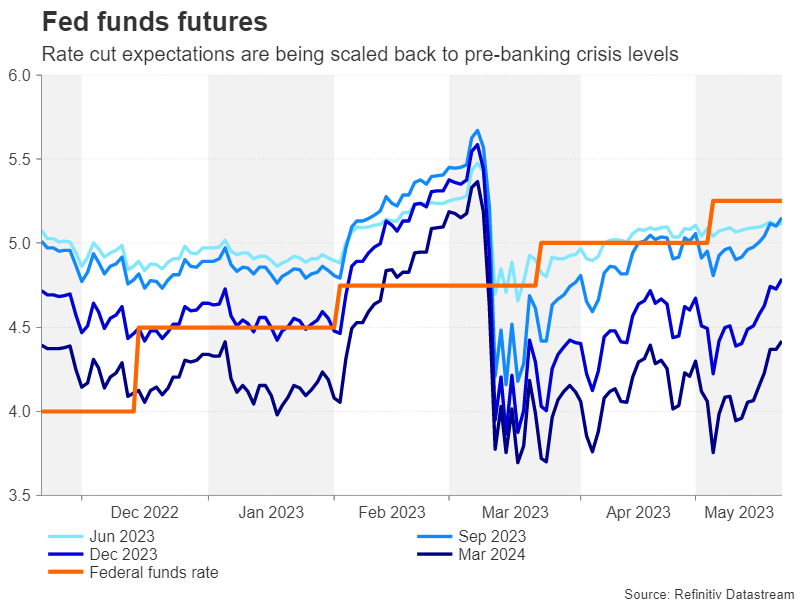
However, not everyone is convinced that there is a strong enough argument to continue tightening, with Fed chief Powell being among those that have demonstrated a preference to pause. Powell and a few others at the Fed are wary about raising rates further given the lags in policy transmission and perhaps more importantly, the possibility that tighter lending standards following the banking stress may yet lead to some sort of a credit crunch.
The data-dependent Fed
The minutes of the May meeting might reveal more on just how much of a concern a credit squeeze is for the Fed. But aside from those discussions, the minutes are unlikely to offer any fresh insight for traders on where rates are headed.
In truth, policymakers don’t seem to have decided how they will vote in June and will therefore be looking at the next batch of data very closely to guide them. Some of the releases on the agenda this week are the second estimate of Q2 GDP growth on Thursday and April durable goods orders on Friday. But investors will mostly be fixated on the PCE inflation and personal income and spending numbers, which will be crucial for the Fed to see whether or not underlying inflation is moderating and how well consumption is holding up.
The stickiness of inflation
There can be no denying that headline inflation globally has come down substantially in 2023 as energy and other commodity prices have fallen, but core inflation is turning out to be a lot stickier than what central banks anticipated. In the US, the all-important core PCE price index has been stuck between 4.6% and 4.7% since December and the forecast does not point to any improvement in April.
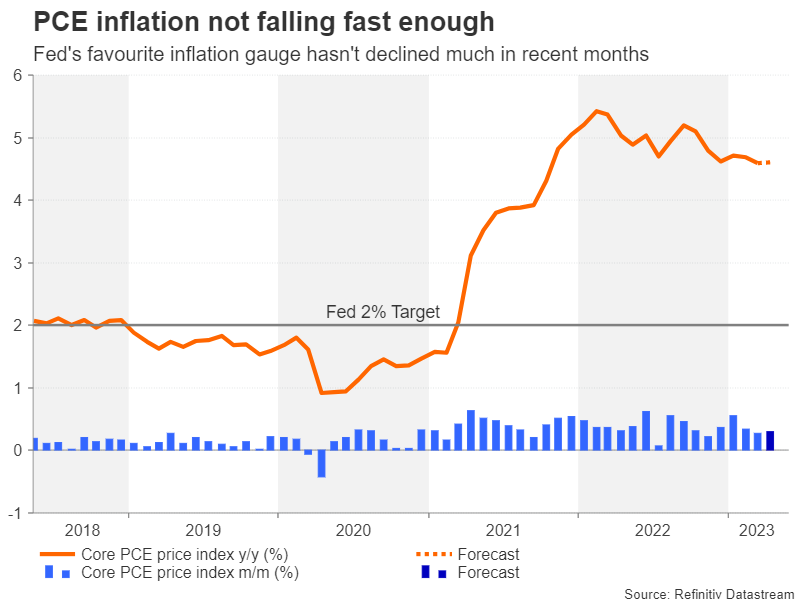
It is expected to have stayed unchanged at 4.6% y/y. But the Fed might take some comfort from the monthly increase remaining at a reasonable 0.3% pace. One of the reasons why businesses have been able to continue passing on higher prices onto consumers is that households are still flush with cash as highlighted by the Fed’s Bullard this week.
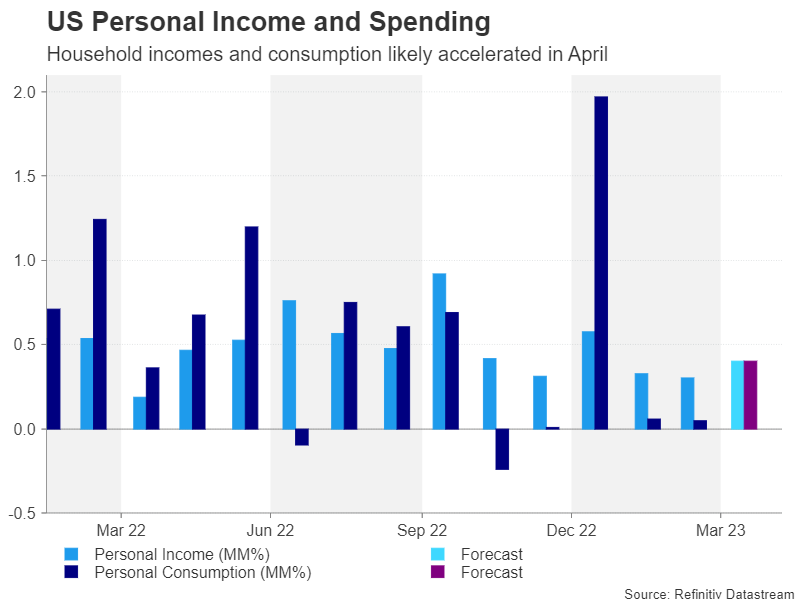
Personal consumption is projected to have grown by 0.4% m/m in April, on the back of a similar increase in personal income.
US dollar: more upside, limited downside
With so many policymakers sitting on the fence, the above numbers are more likely to sway them towards a hike rather than a pause and add more wind to the dollar’s sails.
The dollar index is currently heading towards the 38.2% Fibonacci retracement of the September 2022-April 2023 downtrend at 104.09, having recently crossed above its 50-day moving average (MA). A break above the 23.6% Fibonacci would open the way for the 200-day MA at 105.77, not far below the 38.2% Fibonacci of 106.13.
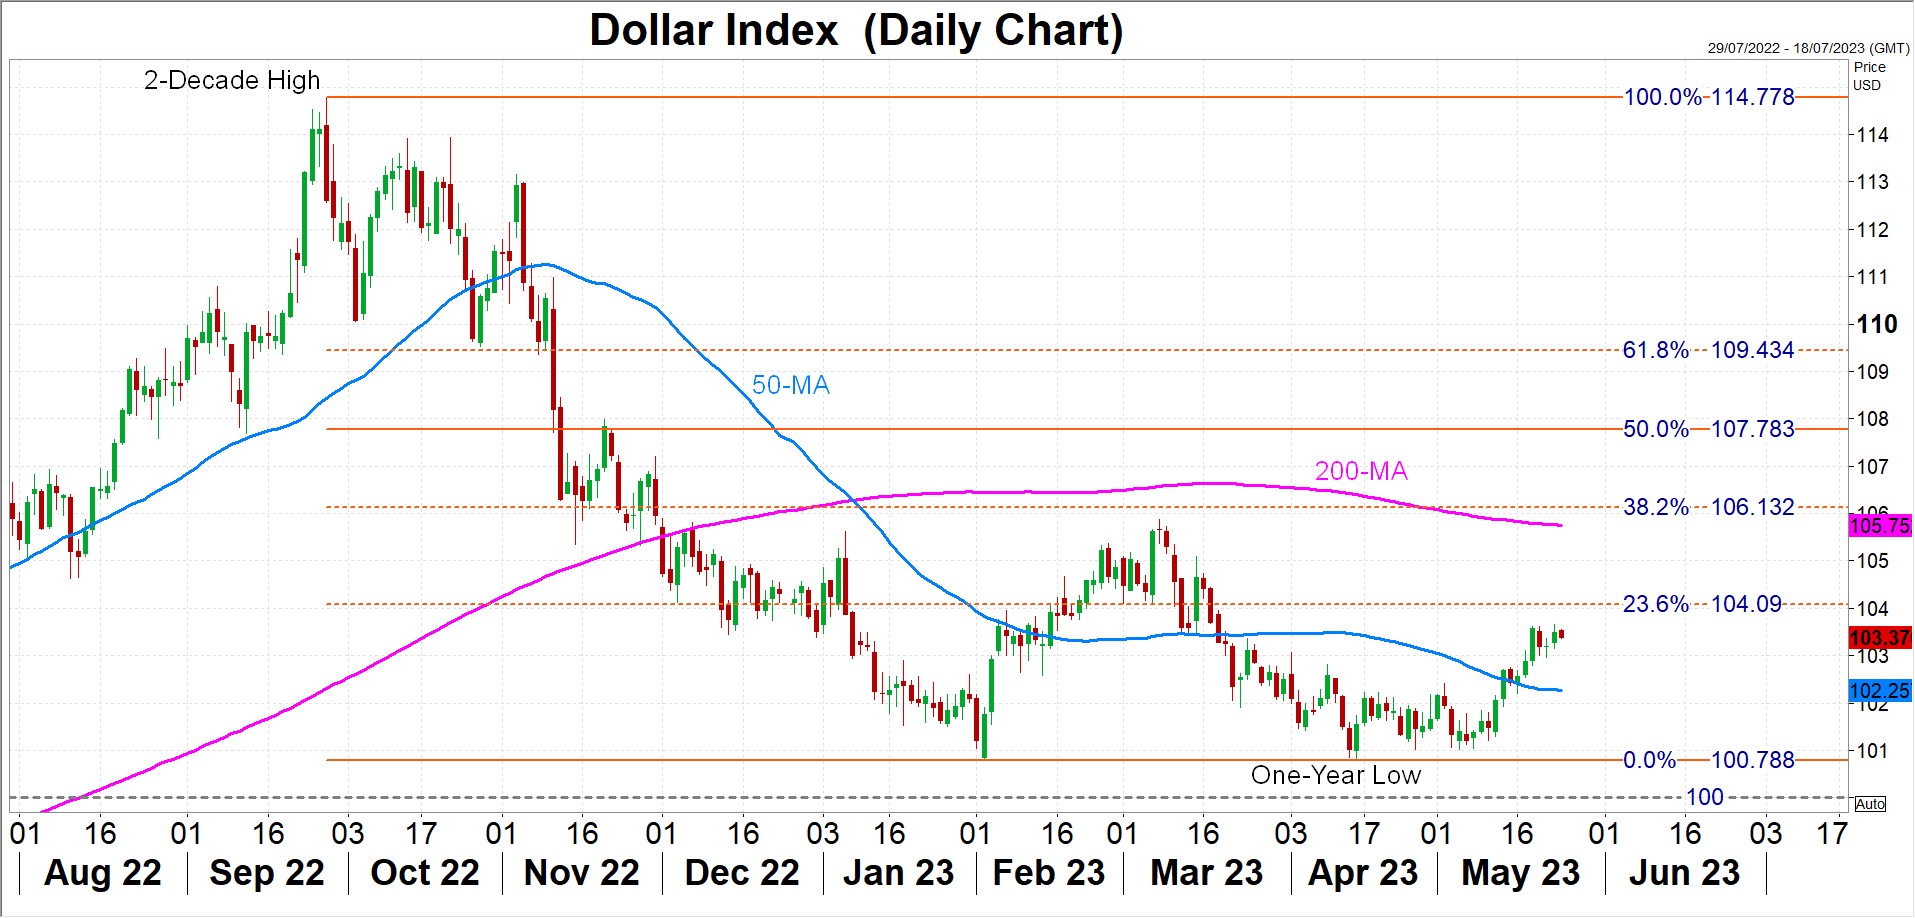
However, a surprise drop in core PCE could spark a selloff in the dollar crosses, pushing the trade-weighted index back towards the 50-day MA, a breach of which would pave the way for a retest of the 100 level.
It’s worth noting, though, that expectations for rate cuts in the second half of the year have been scaled back significantly over the past week, mainly because the Fed will probably want to maintain a tightening bias after it’s paused, and that should support the greenback even if the data does not bolster the case for a June hike.
NZDUSD Plummets after RBNZ Rate Decision
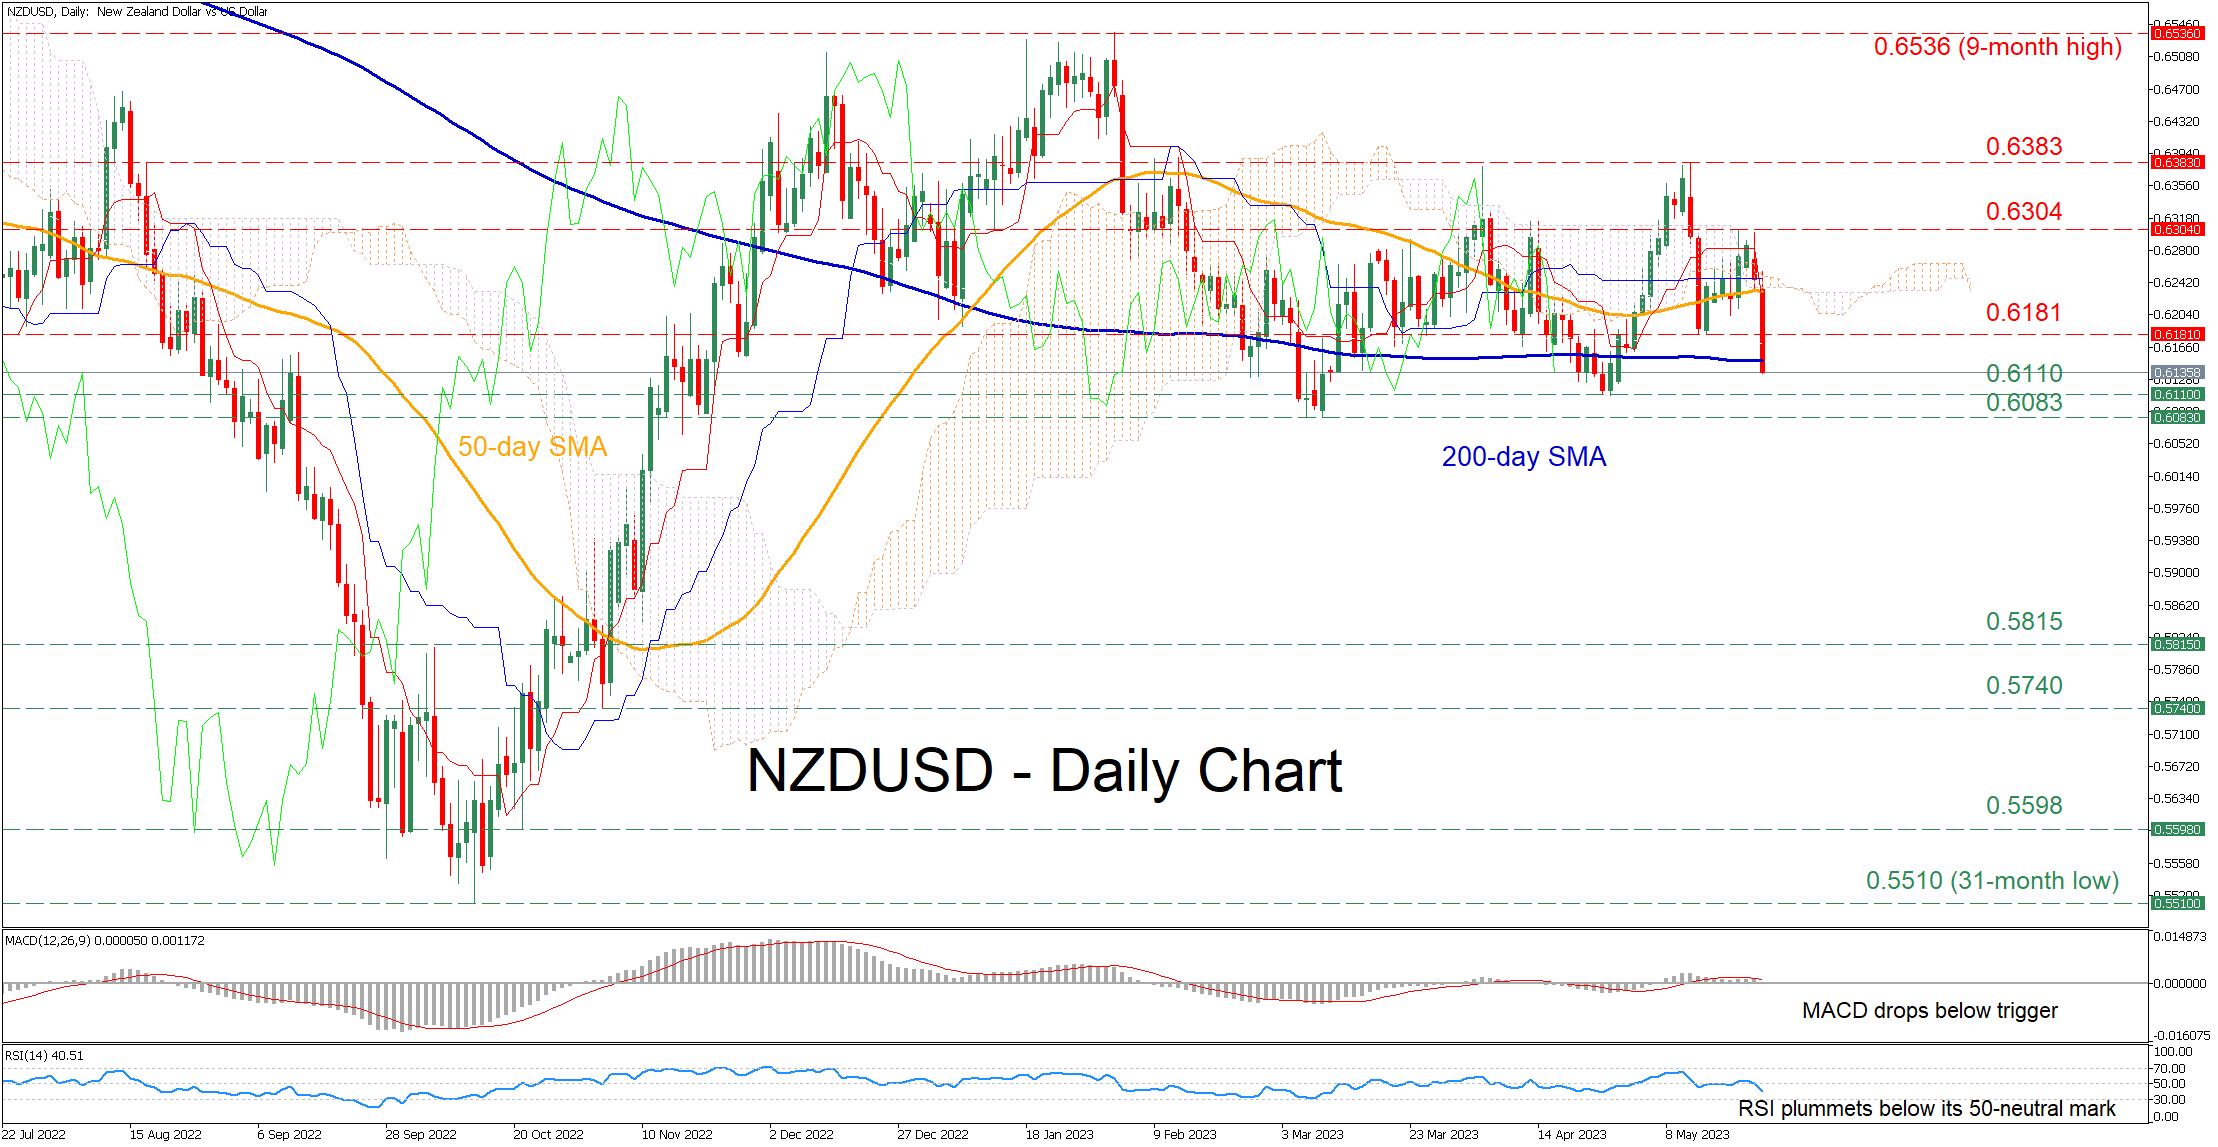
NZDUSD was steadily regaining ground after experiencing a pullback from its three-month peak of 0.6383. However, the pair retraced lower on the back of the RBNZ’s signal of a potential end to its monetary tightening cycle, with the price temporarily pausing its drop around the 200-day simple moving average (SMA).
The momentum indicators currently suggest that bearish forces are intensifying. Specifically, the MACD dropped beneath its red signal line but remains above zero, while the RSI is ticking downwards after crossing below its 50-neutral mark.
Should the selling interest persist and the price violates the 200-day SMA, the April low of 0.6110 could provide downside protection. A break below that region may open the door for the 2023 bottom of 0.6083. Further declines might then cease at the 0.5815 hurdle.
On the flipside, if the pair attempts to recoup some losses, the previous support of 0.6181 may act as initial resistance. Surpassing that zone, the price might ascend towards 0.6304 or higher to challenge the three-month high of 0.6383. Conquering this crucial barricade, the bulls could attack the 2023 peak of 0.6536.
Overall, NZDUSD has sliced through important technical levels such as the 50-day SMA and the Ichimoku cloud following the RBNZ’s dovish statements. Nevertheless, things could get even worse, with the retreat potentially expanding in the case that the price closes beneath its 200-day SMA.
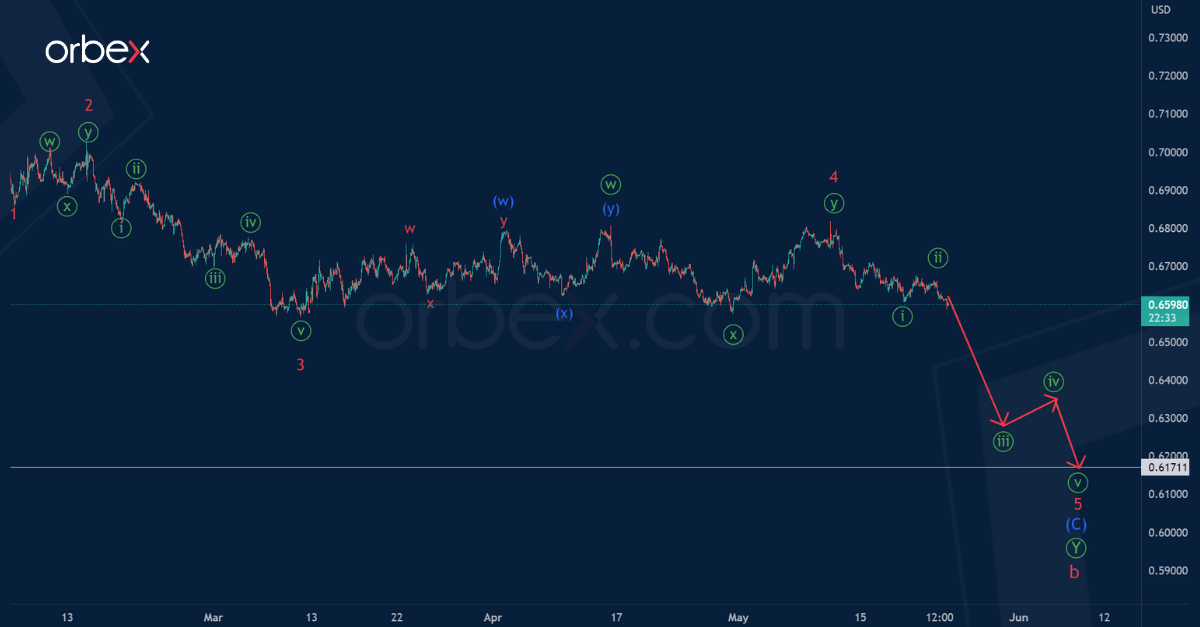
AUD/USD: The Pair May Depreciate to the Level of 0.617
The AUDUSD pair is probably building a large cycle correction b, which has the structure of a primary double zigzag Ⓦ-Ⓧ-Ⓨ.
Two parts can be completed inside the actionary wave Ⓨ. The current chart shows the structure of the last part, i.e. wave ©.
The intermediate wave (C) consists of minor sub-waves 1-2-3-4-5. There is a high probability that the impulse (C) will end at a minimum of 0.617, which was marked by the impulse wave (A).
An approximate scheme of possible future movement is shown on the chart.
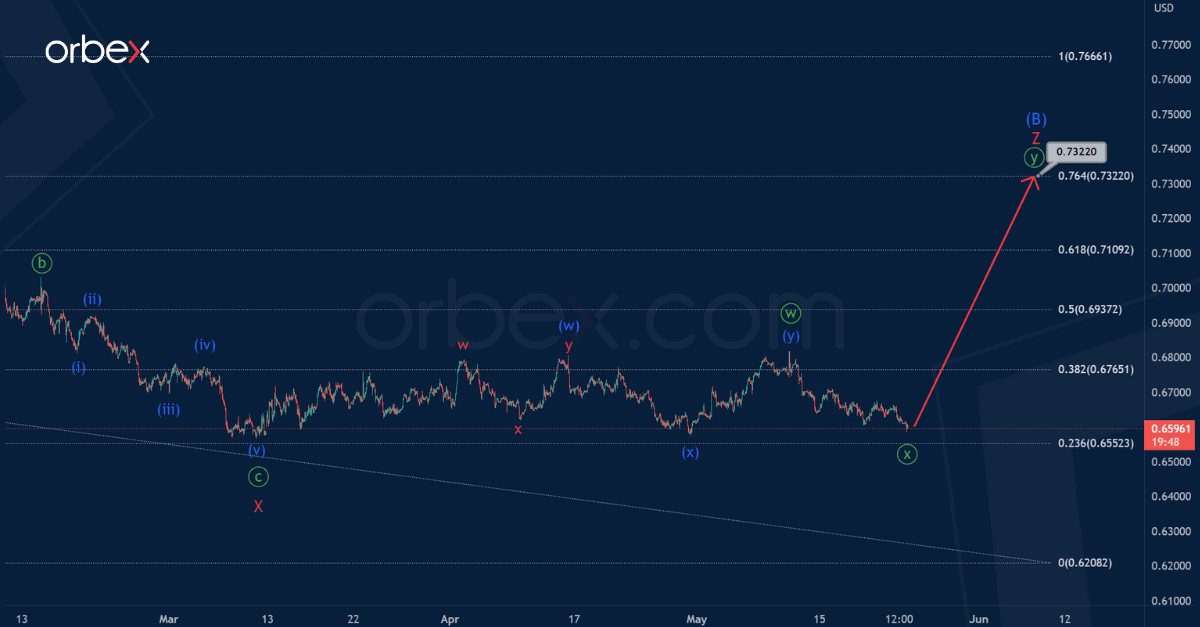
Let's consider an alternative scenario. On the current chart, we see an incomplete intermediate correction (B).
The bullish correction (B) has a complex internal structure of the triple zigzag W-X-Y-X-Z, as in the main version, but its finale awaits us a little higher.
There is a high probability that in the last section we see the construction of a minor wave Z. This wave may end in the form of a minute double zigzag near 0.732.
At the level of 0.732, correction (B) will be at 76.4% of impulse (A).
USD/CAD Daily Outlook
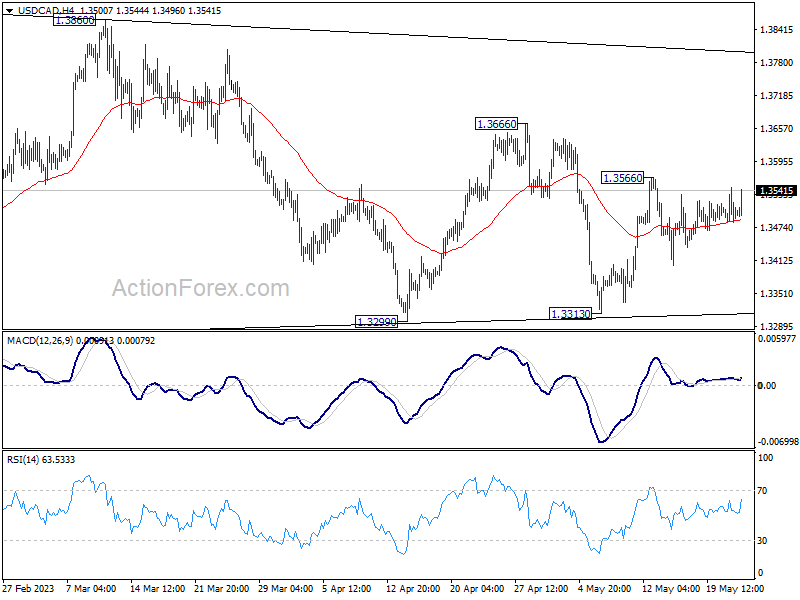
Daily Pivots: (S1) 1.3475; (P) 1.3512; (R1) 1.3539; More....
Intraday bias in USD/CAD stays neutral at this point. Overall, the pair is seen as extending the triangle consolidation pattern from 1.3976. Above 1.3566 will resume the rebound from 1.3313 towards 1.3666 resistance and then 1.3860. However, firm break of 1.3313 support will invalidate this view and indicate that deeper correction is underway.
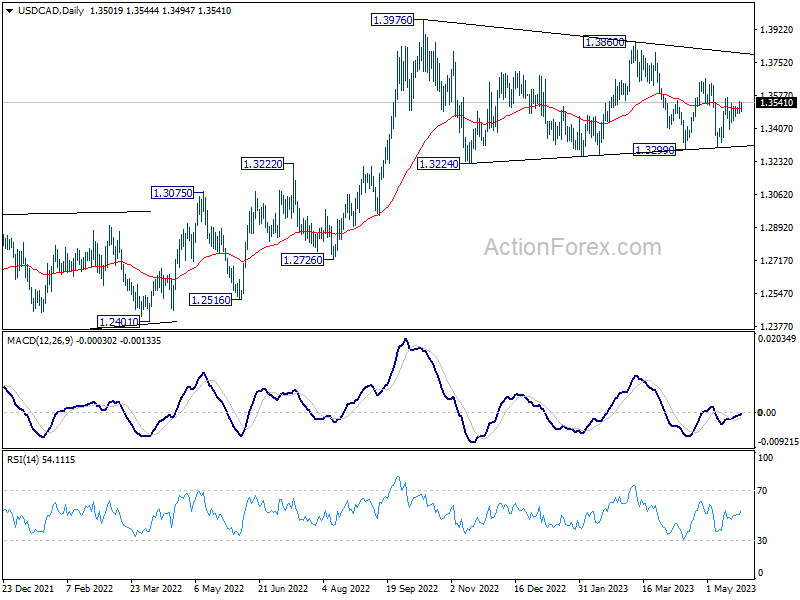
In the bigger picture, as long as 55 W EMA (now at 1.3333) holds, up trend from 1.2005 (2021 low) is still in favor to resume through 1.3976 at a later stage. However, sustained trading below the EMA and 38.2% retracement of 1.2005 to 1.3976 at 1.3233 will raise the chance of bearish reversal. Deeper should then be seen to 61.8% retracement at 1.2758 next.
AUD/USD Daily Report
Daily Pivots: (S1) 0.6591; (P) 0.6626; (R1) 0.6646; More...
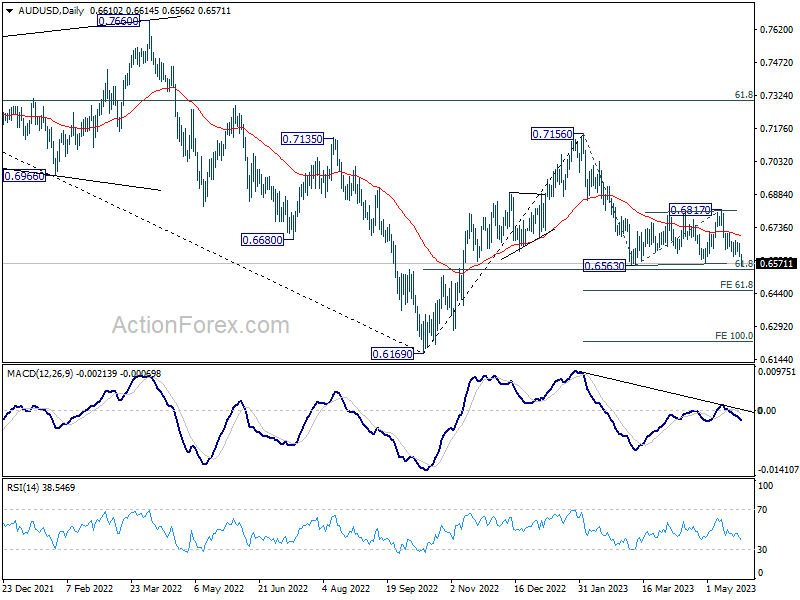
Intraday bias in AUD/USD is back on the downside with break of 0.6604 temporary lo, to 0.6563. Decisive break there will resume larger decline from 0.7156 to 61.8% projection of 0.7156 to 0.6563 from 0.6817 at 0.6451. On the upside, above 0.6674 minor resistance will delay the bearish case, and extend the corrective pattern from 0.6563 with another rising leg.
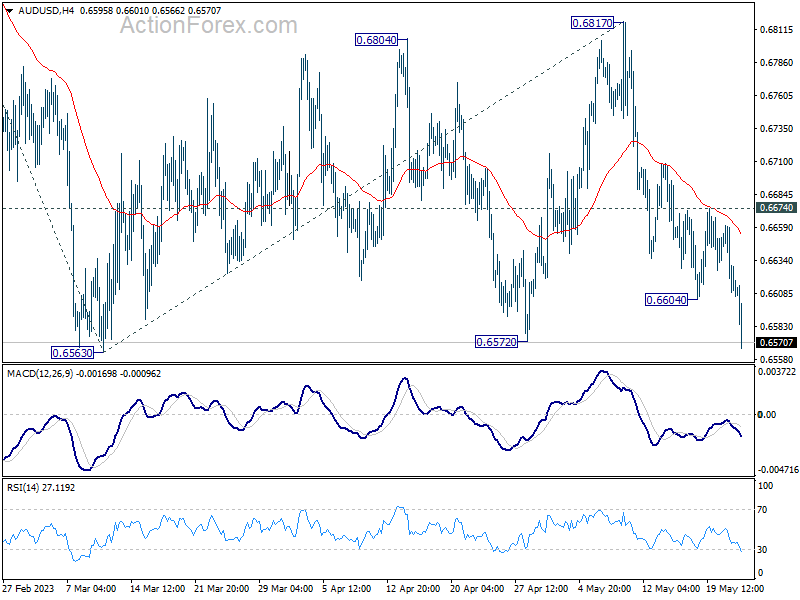
In the bigger picture, the failure to break through 55 W EMA (now at 0.6822) keeps medium term outlook bearish. Firm break of 61.8% retracement of 0.6169 to 0.7156 at 0.6546 will raise the chance of long term down trend resumption through 0.6169 low. This will now be the favored case as long as 0.6817 resistance holds.