Sample Category Title
EUR/JPY Daily Outlook
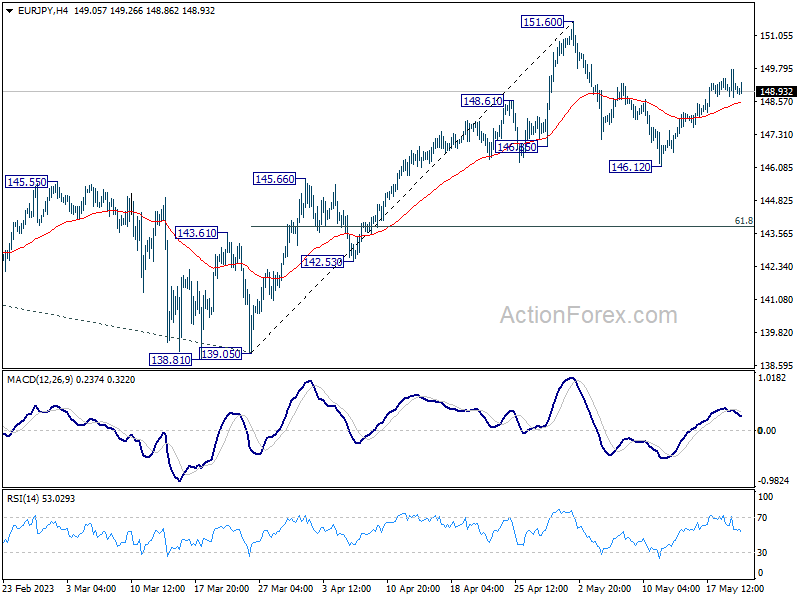
Daily Pivots: (S1) 148.61; (P) 149.20; (R1) 149.69; More....
Further rise is mildly on the upside in EUR/JPY for retesting 151.60 high. Decisive break there will resume larger up trend. On the downside, however, break of 146.12 will resume the fall to 61.8% retracement of 139.05 to 151.60 at 143.84.
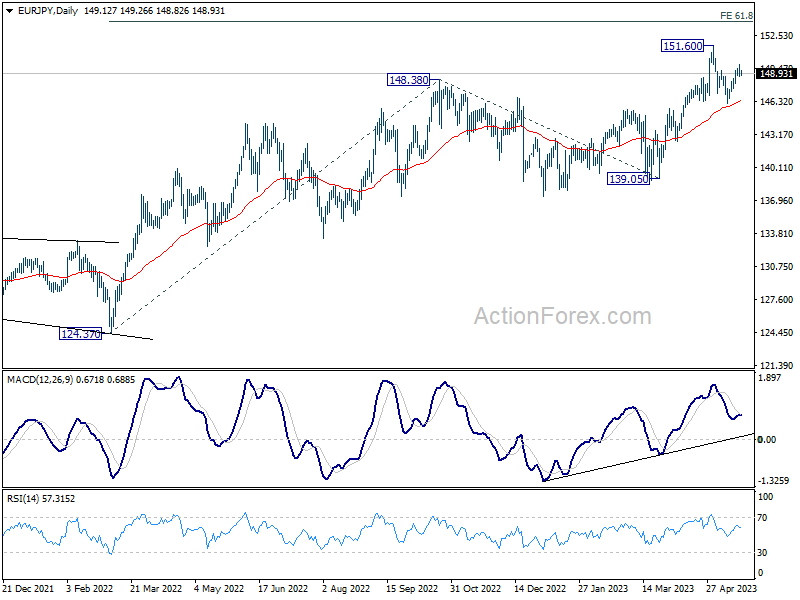
In the bigger picture, rise from 114.42 (2020 low) is in progress. Next target is 61.8% projection of 124.37 to 148.38 from 138.81 at 153.64. Sustained break there will pave the way to 100% projection at 162.82. For now, medium term outlook will remain bullish as long as 139.05 support holds, even in case of deep pull back.
EUR/GBP Daily Outlook
Daily Pivots: (S1) 0.8669; (P) 0.8682; (R1) 0.8696; More...
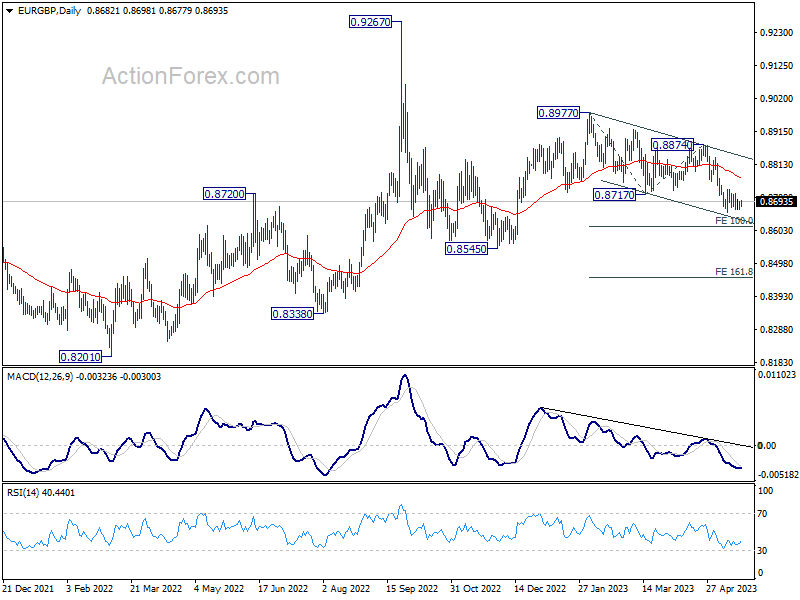
Intraday bias in EUR/GBP remains neutral for the moment. Further decline is expected as long as 0.8758 resistance holds. On the downside, break of 0.8660 will resume recent decline from 0.8977 to 100% projection of 0.8977 to 0.8717 from 0.8874 at 0.8614. Nevertheless, break of 0.8758 minor resistance will turn bias back to the upside for stronger rebound.
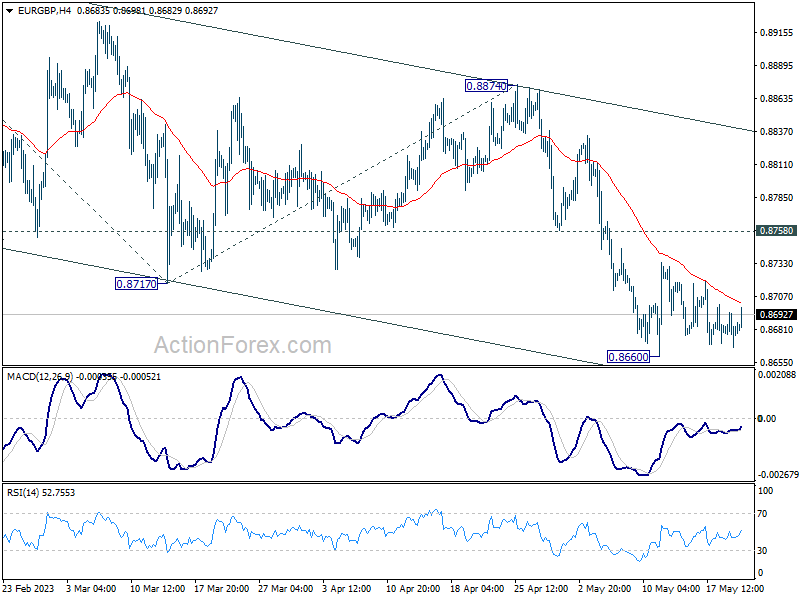
In the bigger picture, current development argues that whole decline from 0.9267 (2022 high) is still in progress. This is part of the long term range pattern from 0.9499 (2020 high). Deeper fall would be seen through 0.8545 support. This will now remain the favored case as long as 0.8874 resistance holds.
EUR/AUD Daily Outlook
Daily Pivots: (S1) 1.6206; (P) 1.6242; (R1) 1.6285; More...
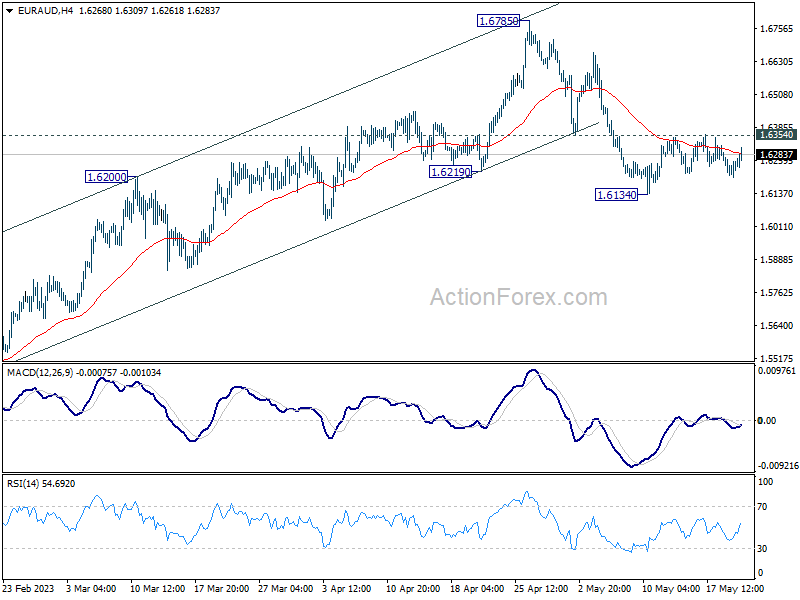
Intraday bias in EUR/AUD remains neutral at this point. Fall from 1.6785 might be a correction to whole up trend from 1.4281. Break of 1.6134 will target 38.2 retracement of 1.4281 to 1.6785 at 1.5828, which is inside 1.5254/5976 support zone. Nevertheless, sustained break of 1.6354 minor resistance will turn bias back to the upside for retesting 1.6785 high instead.
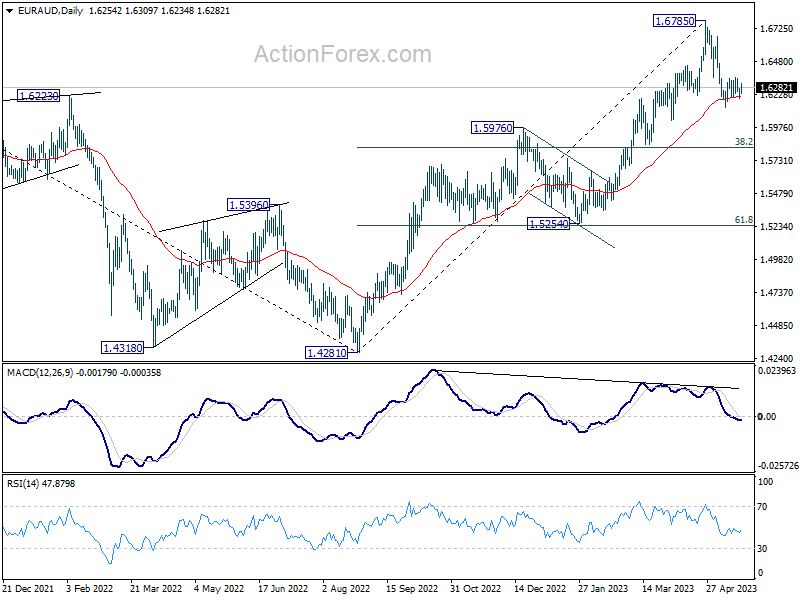
In the bigger picture, whole down trend from 1.9799 (2020 high) should have completed at 1.4281 (2022 low). Further rise should be seen to 61.8% retracement of 1.9799 to 1.4281 at 1.7691 next. For now, outlook will stay bullish as long as 1.5976 resistance turned support holds, even in case of deep pull back.
EUR/CHF Daily Outlook
Daily Pivots: (S1) 0.9705; (P) 0.9728; (R1) 0.9744; More...
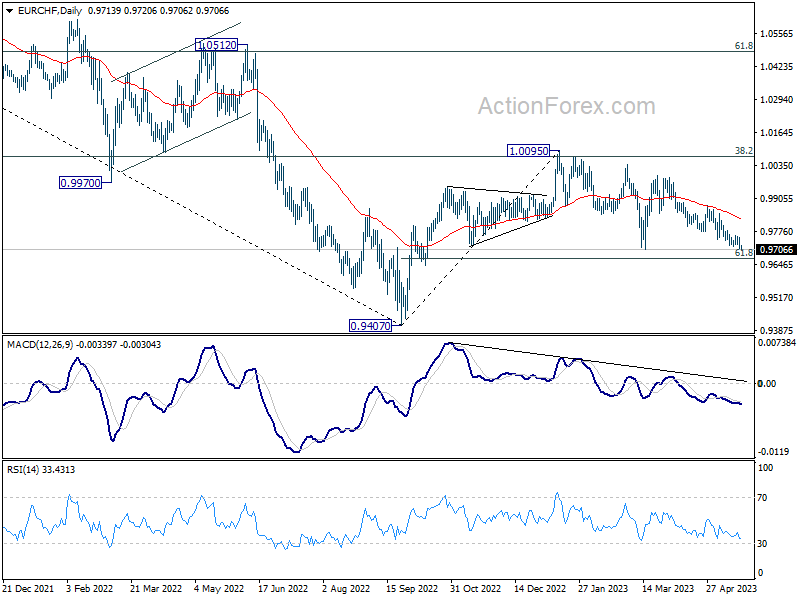
Intraday bias in EUR/CHF remains on the downside at this point. Choppy decline from 0.9995 is likely part of the whole corrective pattern from 1.0095. But even so, considering bullish convergence condition in 4H MACD, downside should be contained by 61.8% retracement of 0.9407 to 1.0095 at 0.9670. On the upside, break of 0.9760 resistance should confirm short term bottoming and turn bias back to the upside for stronger rebound.
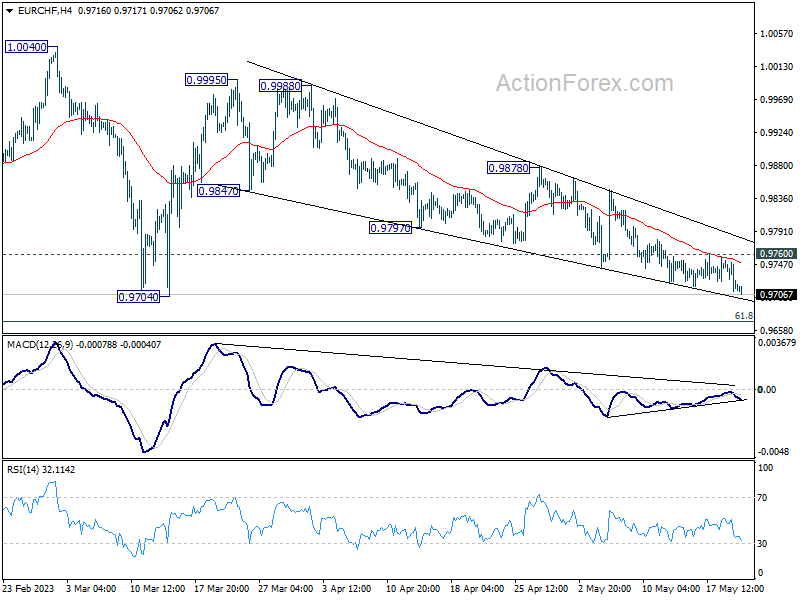
In the bigger picture, prior rejection by 38.2% retracement of 1.1149 to 0.9407 at 1.0072 suggests that medium term outlook is staying bearish. The pair is also capped below 55 W EMA (now at 0.9963). Down trend from 1.2004 is not completed yet and is in favor to resume through 0.9407 at a later stage. However, decisive break of 1.0095 resistance will raise the chance of bullish trend reversal. Rise from 0.9407 should then target 1.0505 cluster resistance (2020 low at 1.0505, 61.8% retracement of 1.1149 to 0.9407 at 1.1484).
JPY Still Under Pressure
USD/CAD bounces back
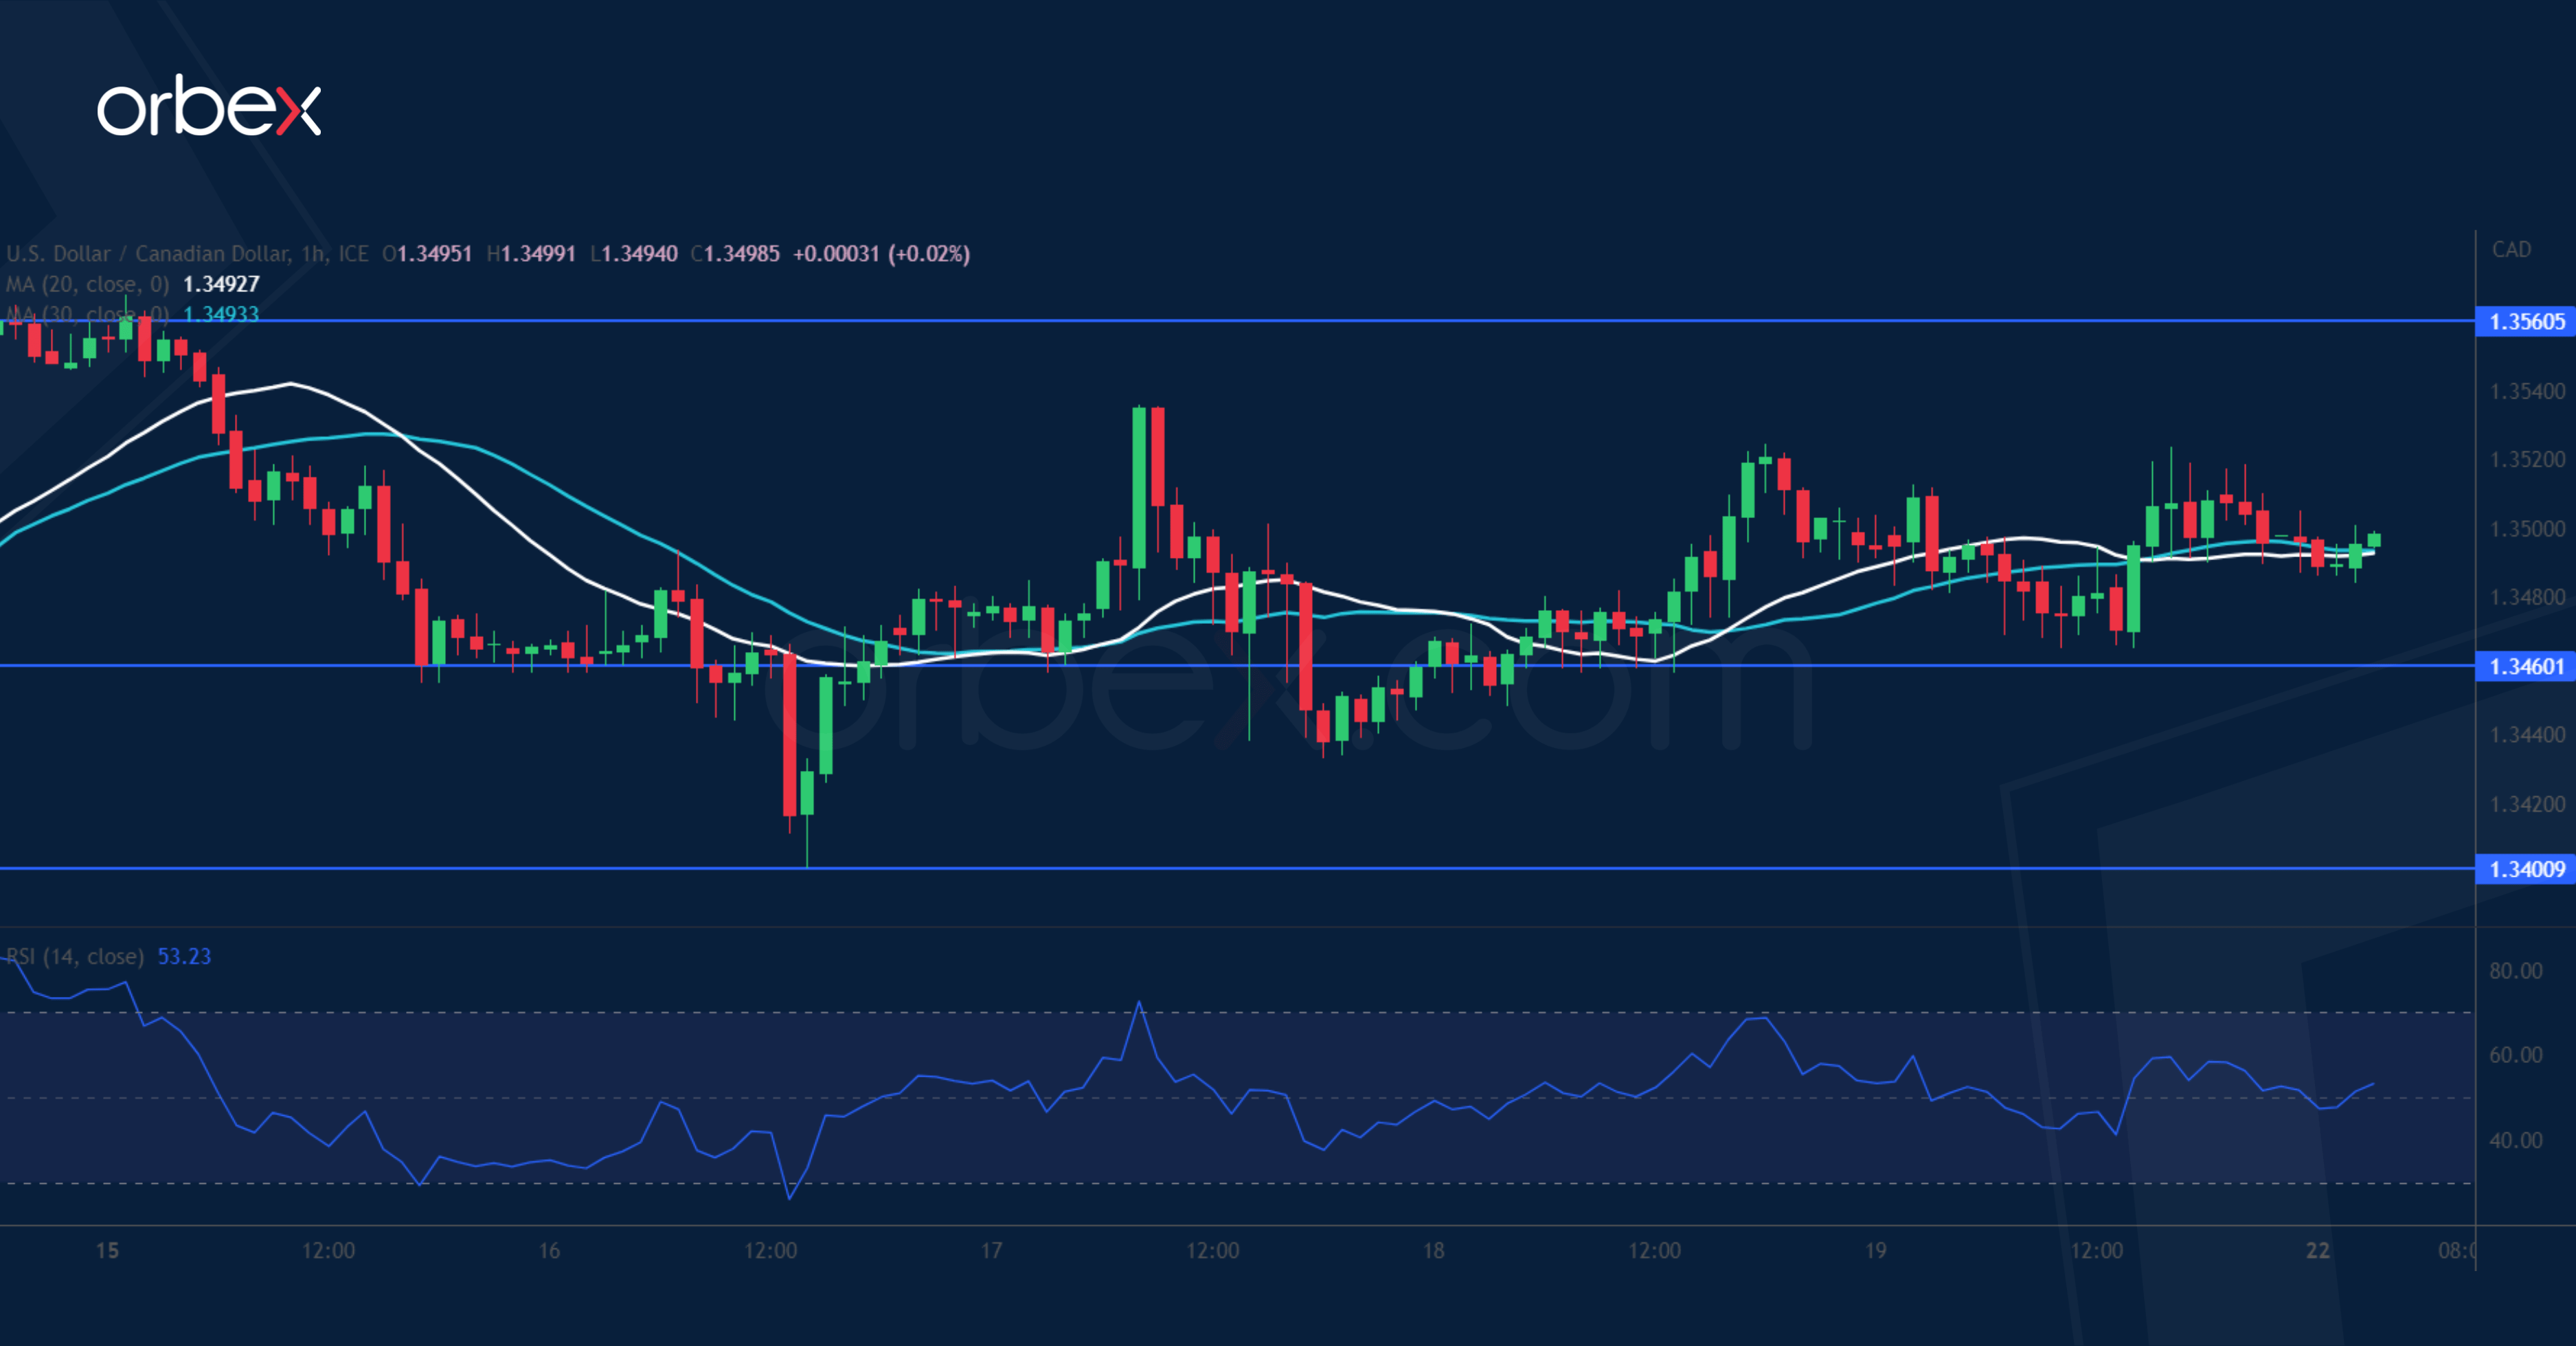
The Canadian dollar held as the March retail sales showed a smaller-than-expected contraction. The pair is in a narrowing consolidation between 1.3400 and 1.3560. A bullish breakout would be a decisive signal that the upside has prevailed and the greenback may enjoy an extended recovery to this year’s high of 1.3850 where a follow-through breakout would resume the uptrend in the medium-term. 1.3460 is the first support in case of prolonged hesitation and 1.3400 an effective floor to maintain the upward skew.
EUR/JPY consolidates gains
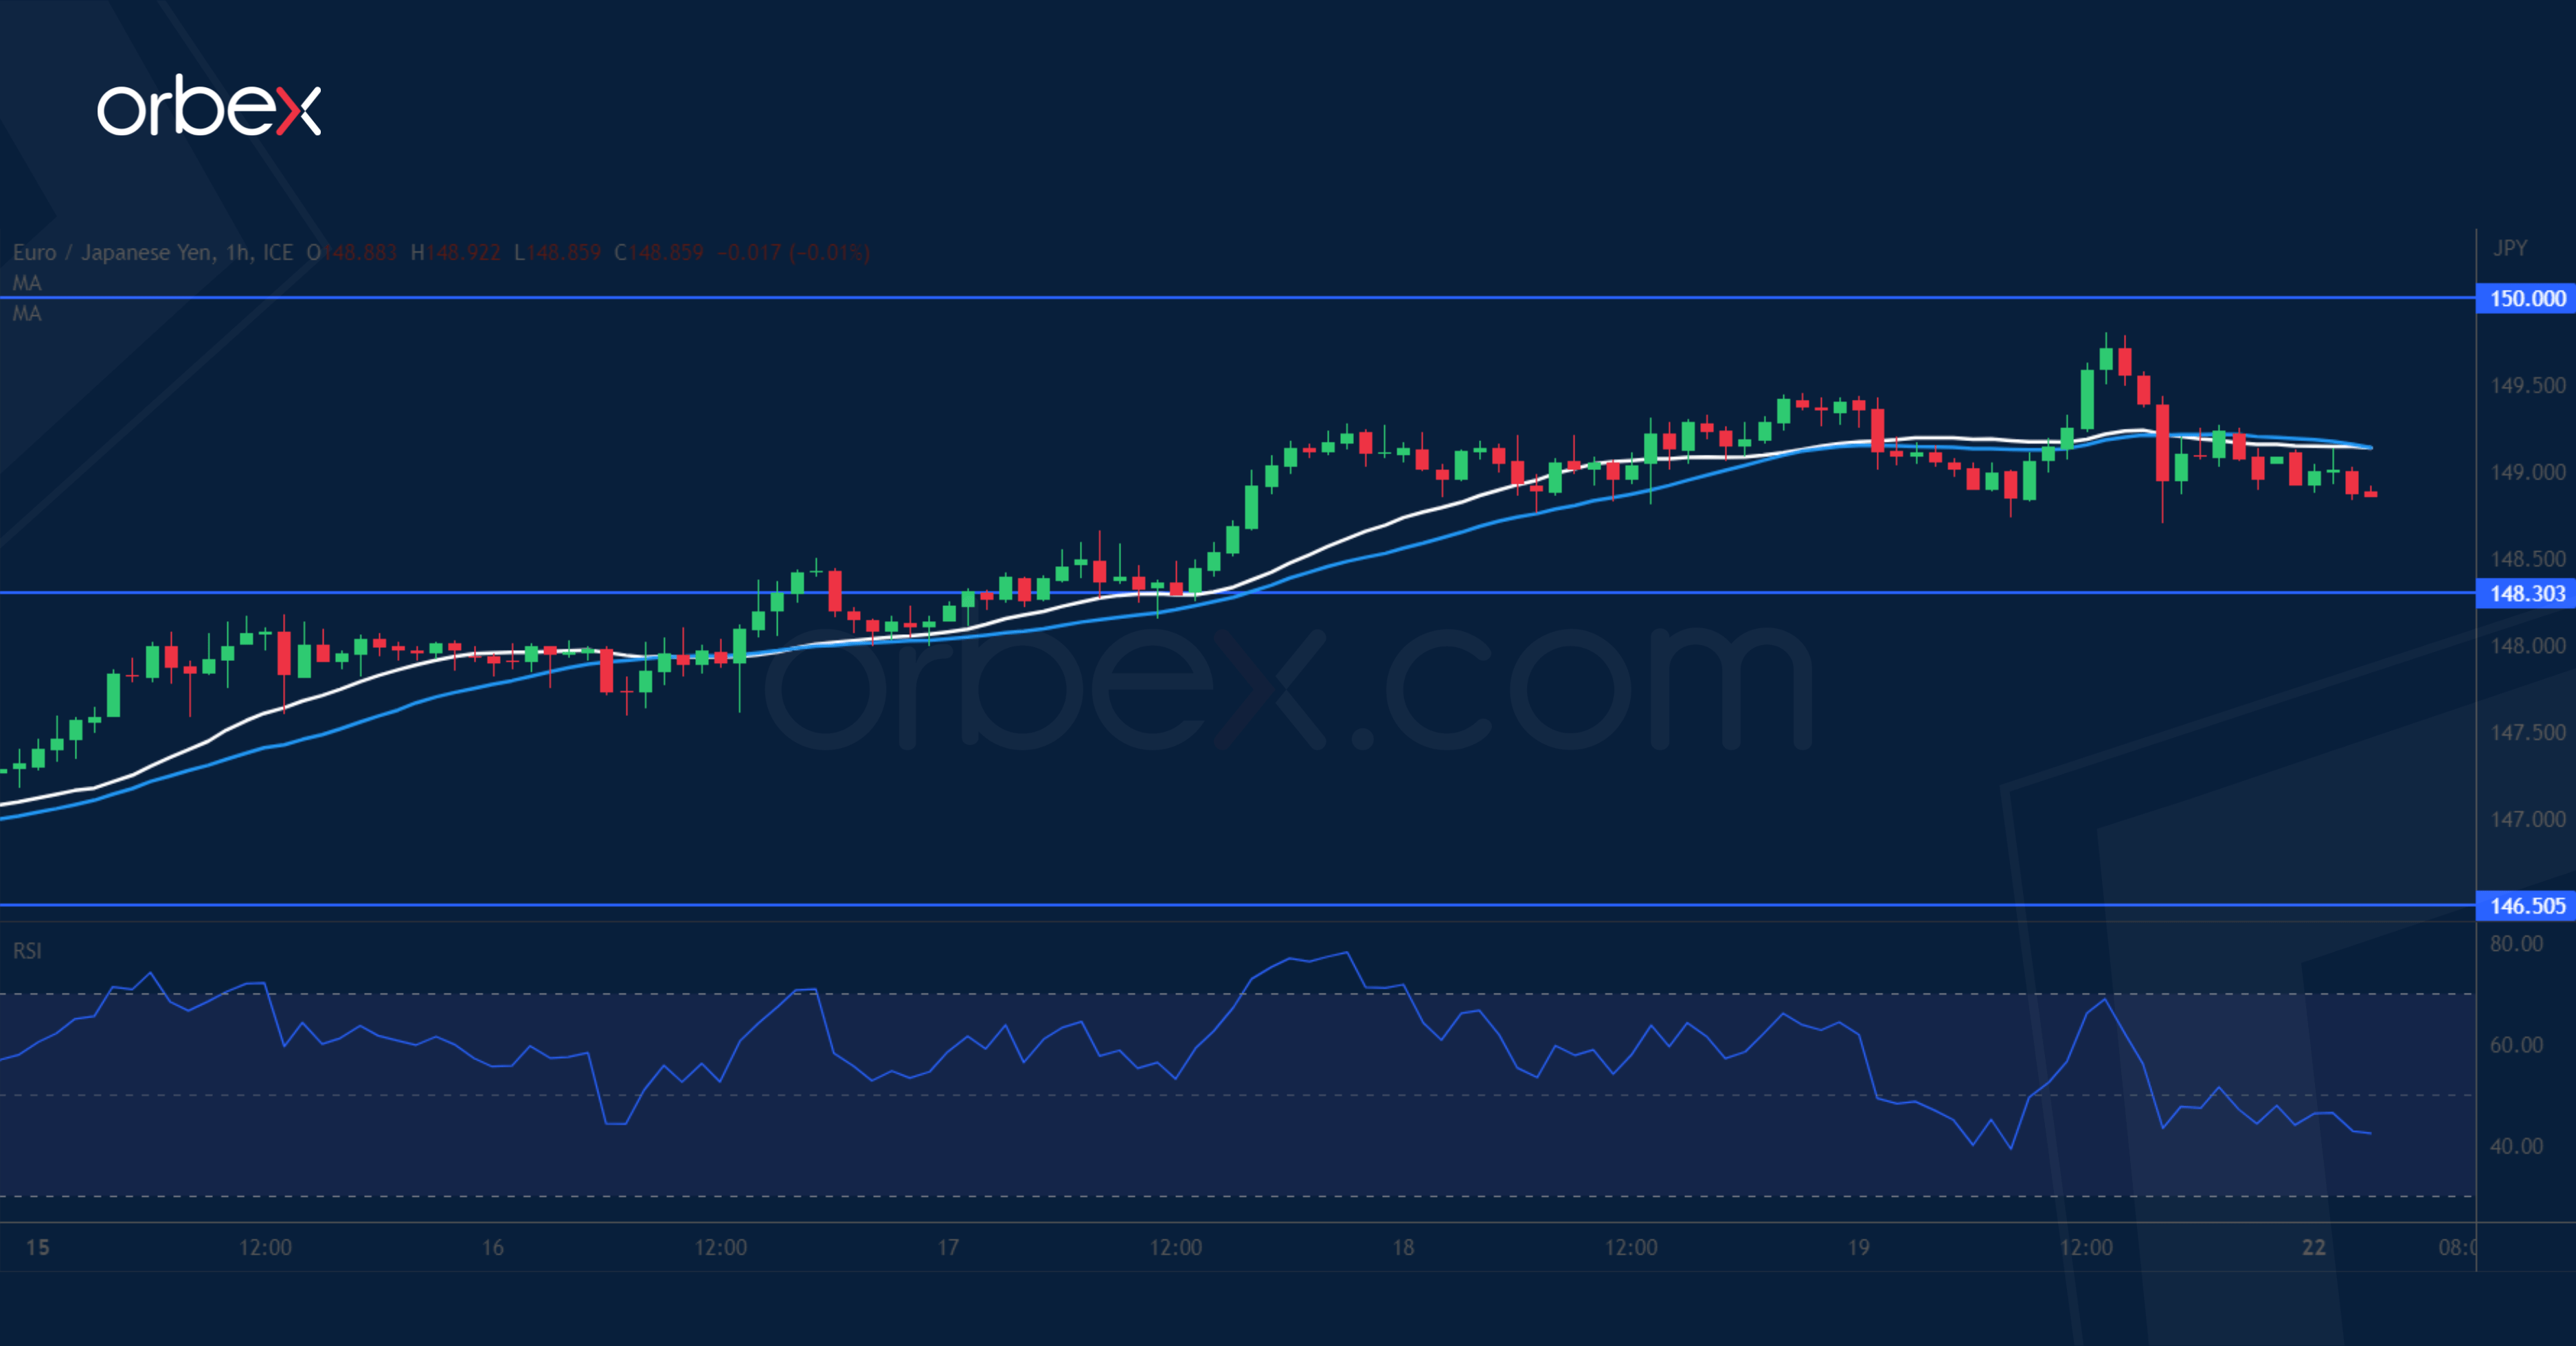
Improved risk appetite continues to depress the Japanese yen. Sentiment has remained upbeat after the pair bounced off the 30-day SMA (146.50). A close above the previous swing high of 149.20 has forced short-term sellers out, leaving the door open to a potential broader rebound with the round number of 150.00 as the next hurdle. Its breach would carry the euro back to the recent peak of 151.50. 148.30 at the base of the bullish breakout is the first support in case the bulls need to consolidate their gains.
GER 40 rises to all-time high
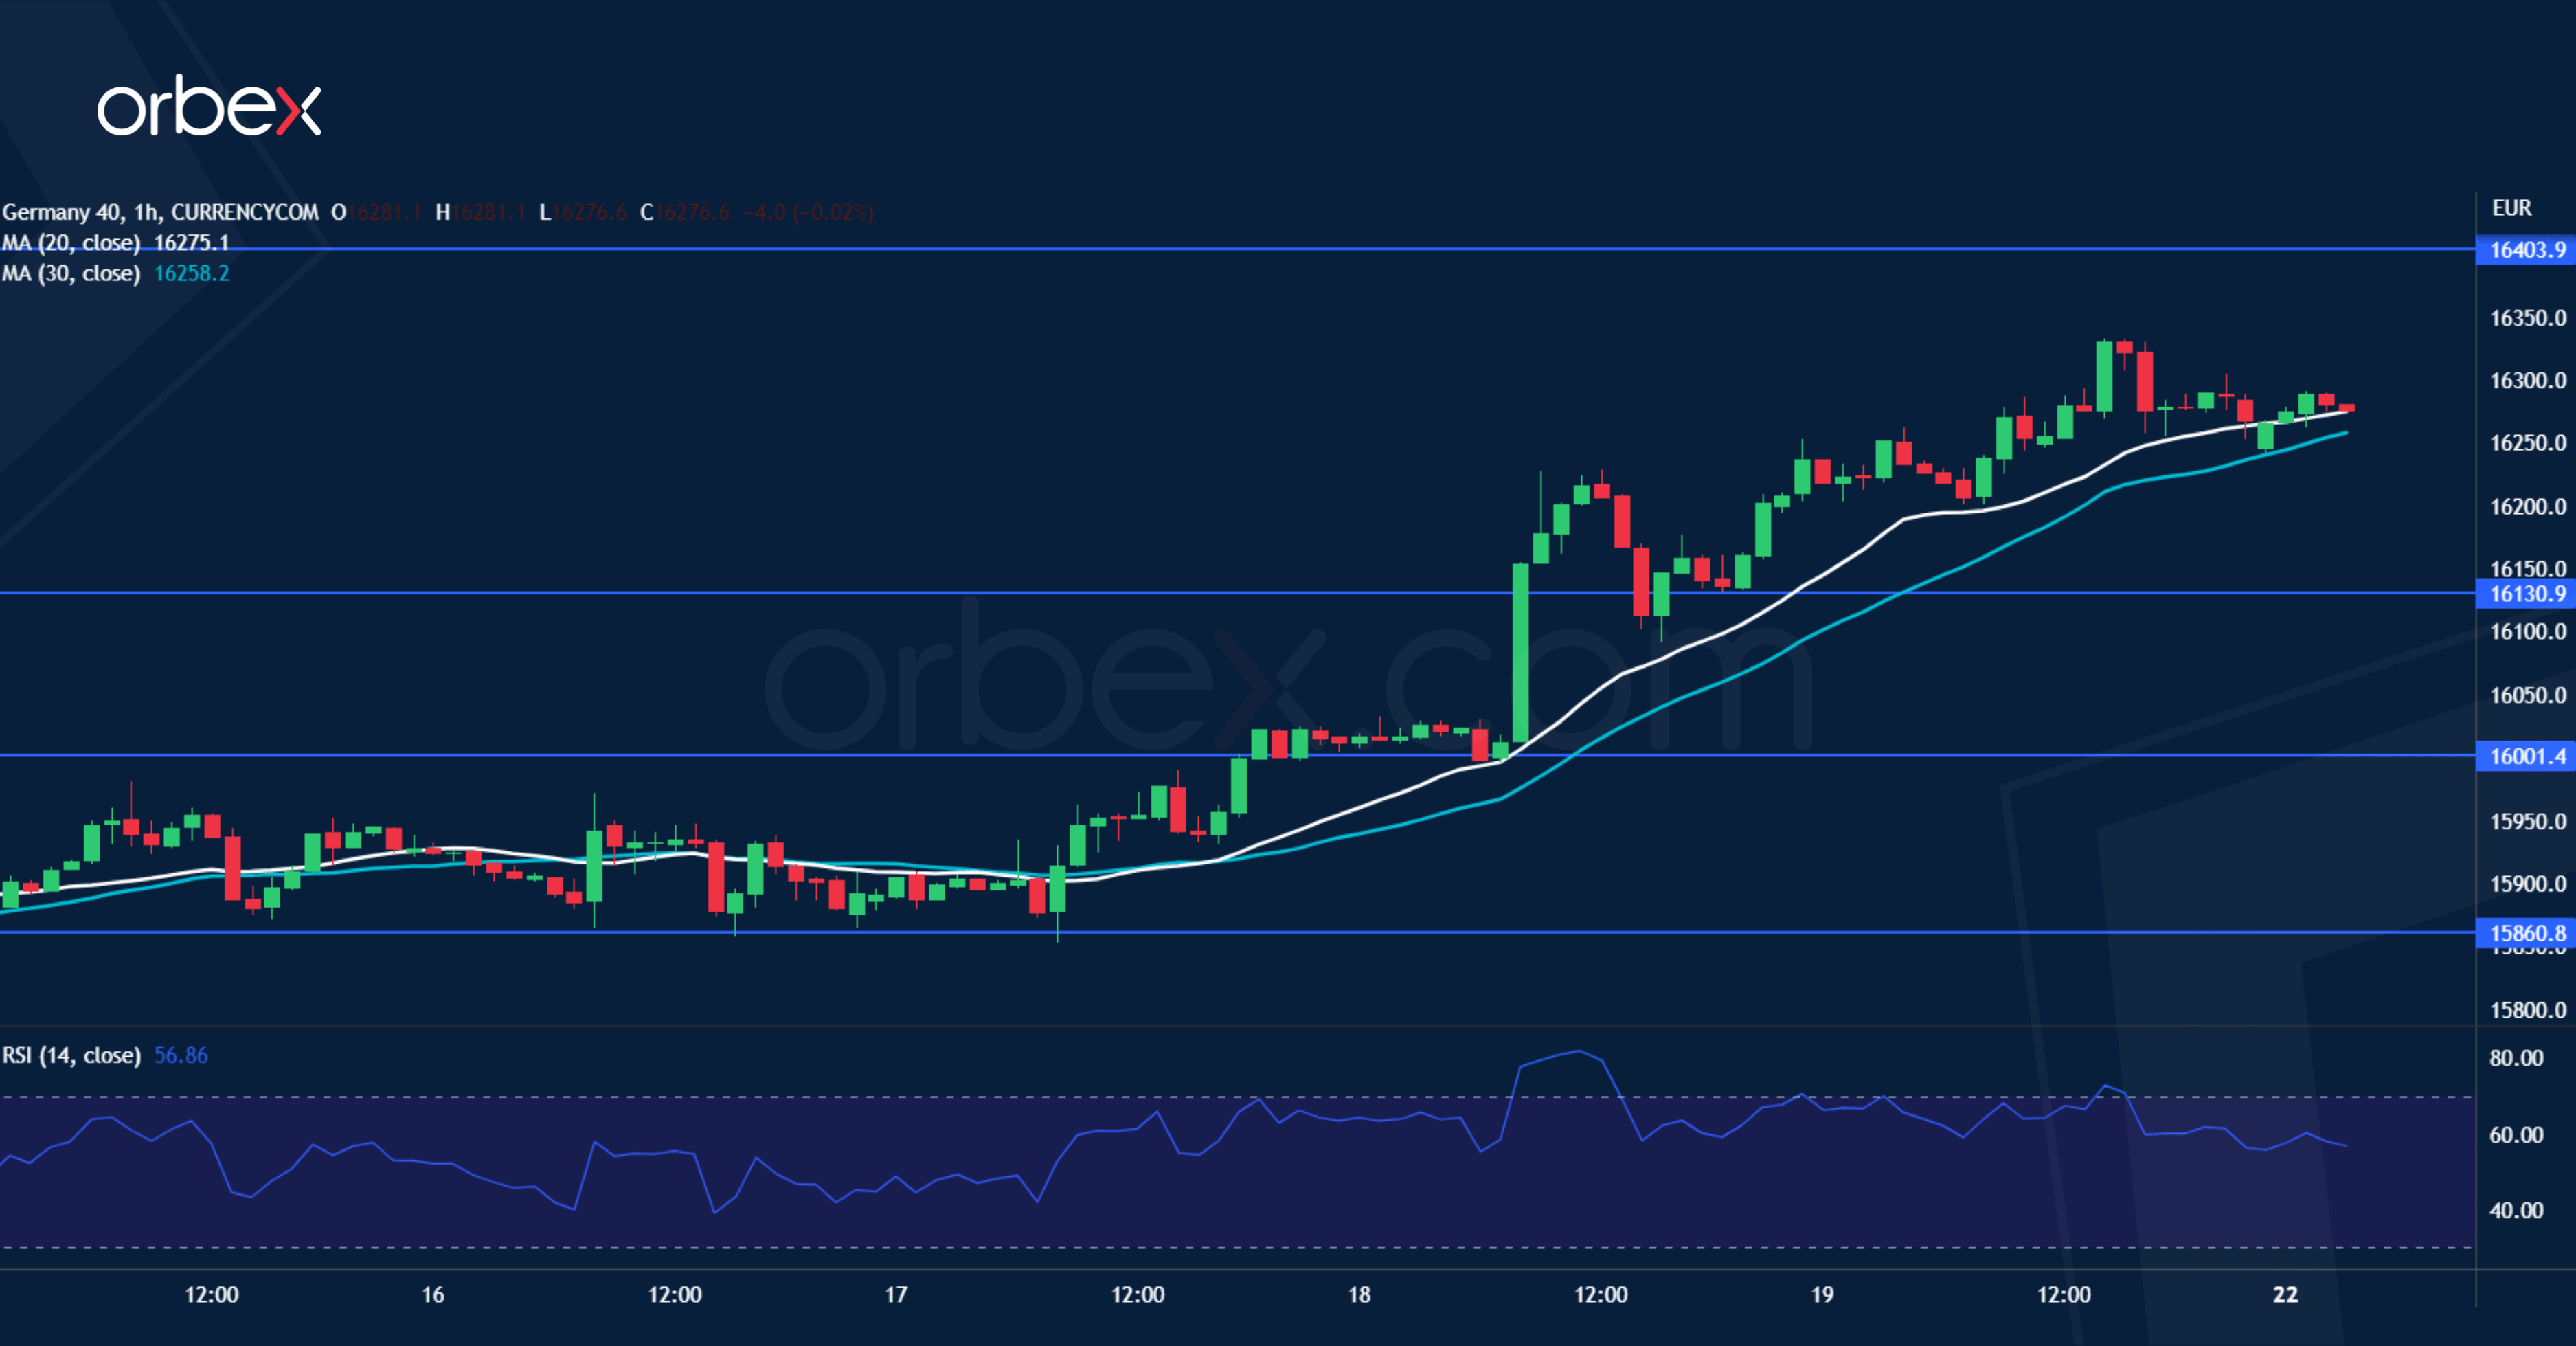
The Dax 40 reached a fresh peak after a strong earnings season from European companies. The index has recovered back to its all-time high of 16290 which suggests a relentless bullish drive. 16400 is the next target ahead. Though the RSI’s overbought condition in this significant supply area may lead to a fallback if buyers start to bag some of their profits. 16130 is the closest support while the psychological level and resistance-turned-support of 16000 would be a second layer of defence in case of a deeper retreat.
Technical Outlook and Review
DXY:
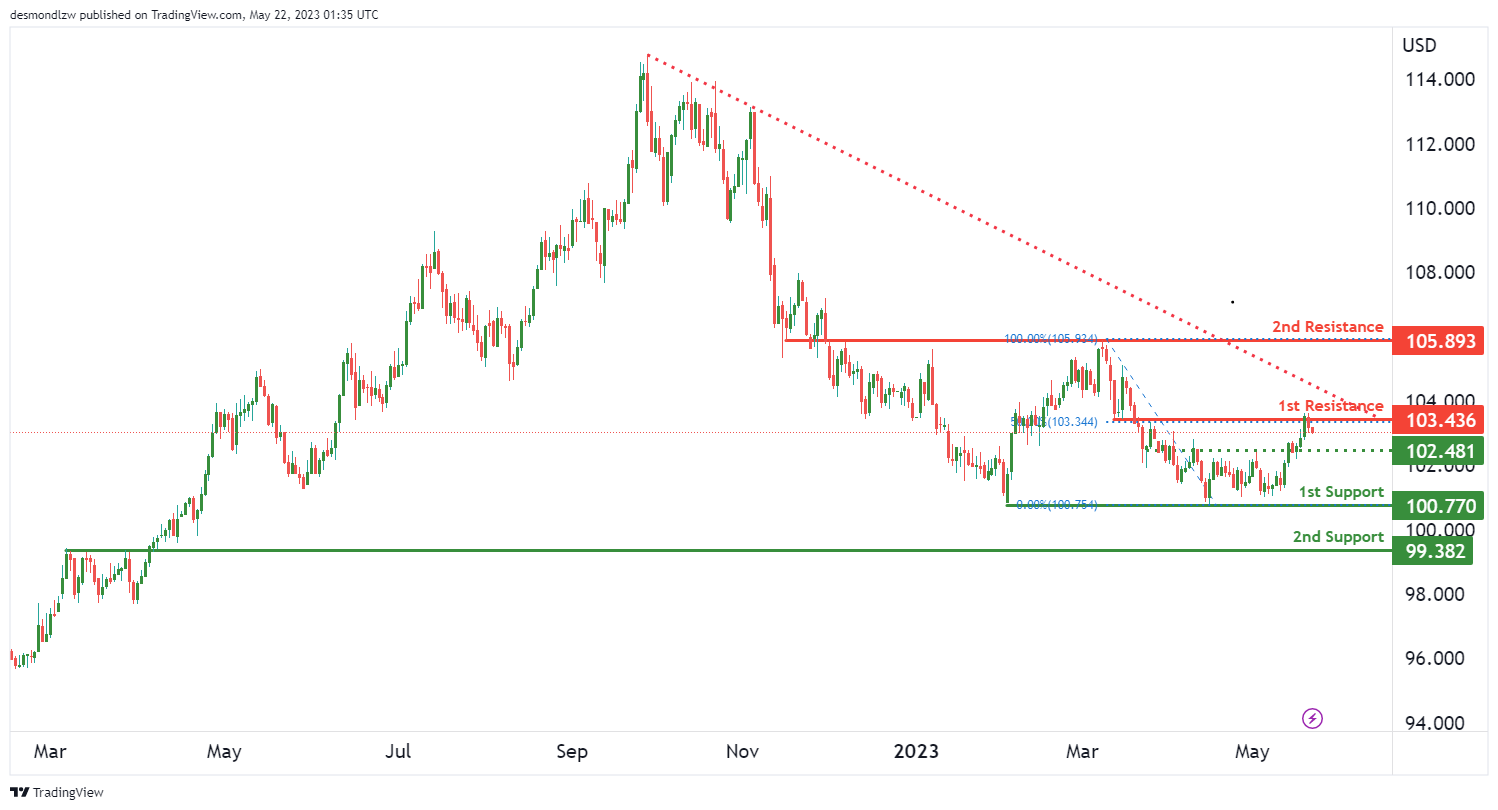
The DXY chart is currently bearish, with the price trading below a major descending trend line, suggesting further bearish momentum could be on the cards.
The price could potentially continue downwards to the 1st support level. The 1st support is at 100.77, serving as a multi-swing low support, which could be a strong level of buying interest.
Below that, the 2nd support is found at 99.38, acting as a pullback support level that might provide additional buying pressure to prevent further declines.
On the upside, the 1st resistance is located at 103.43. This overlap resistance, also coinciding with the 50% Fibonacci retracement level, may provide a significant barrier for any bullish attempts.
Above that, the 2nd resistance is found at 105.89. This overlap resistance might also serve as a potential barrier to the price if it tries to move upward.
In a bearish environment, these resistance levels might act as potential reversal points, while support levels might act as areas where the price could bounce or slow its bearish momentum.
EUR/USD:
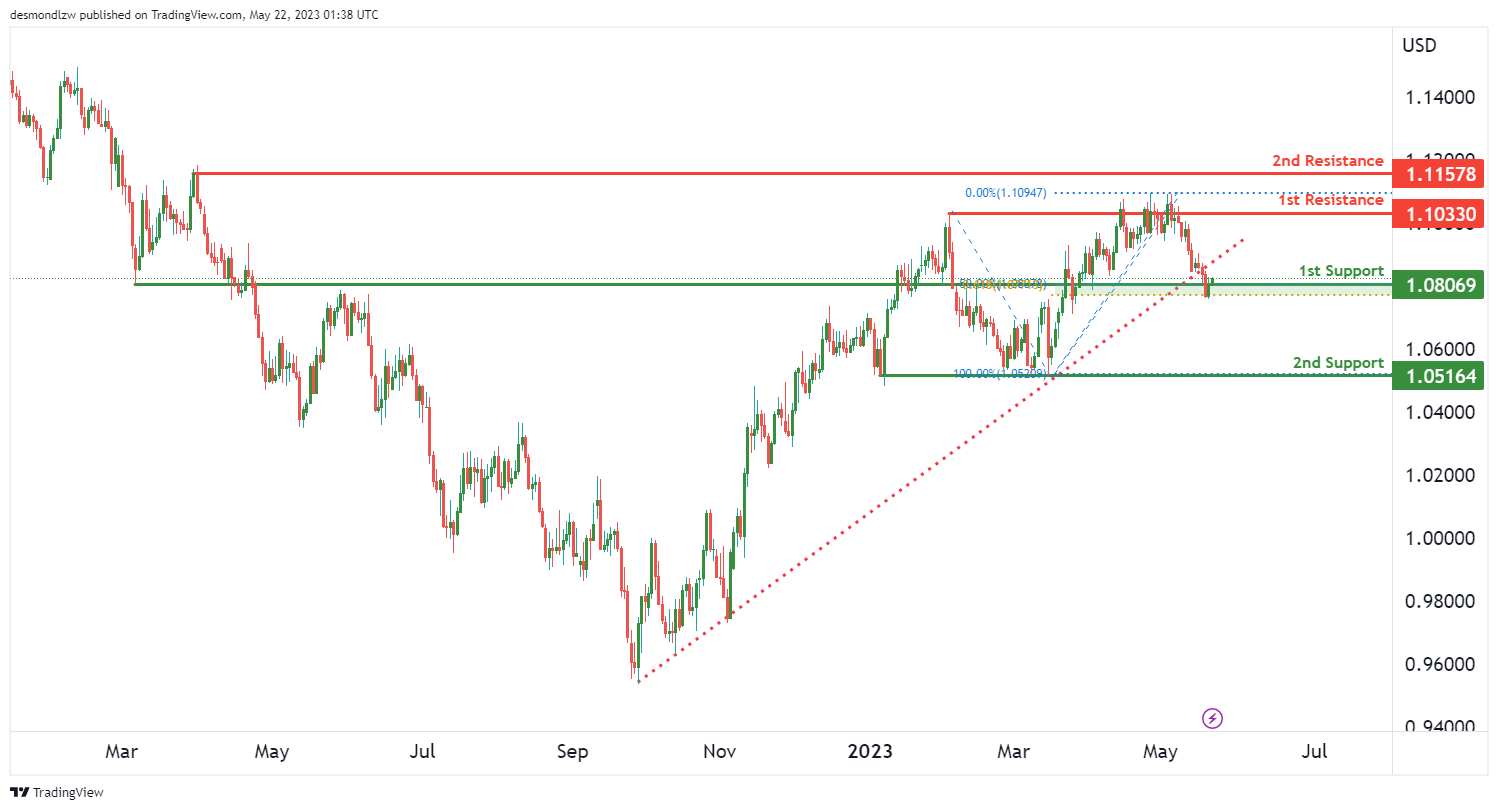
The EUR/USD pair appears to be on a bearish trend, as indicated by a break below an ascending support line, which suggests a potential bearish move.
The pair may potentially break further downward off the first support at 1.0806, leading to a drop towards the second support. This first support level is particularly strong as it represents a significant Fibonacci confluence, being both a 50% Fibonacci retracement and a 61.80% Fibonacci projection. These Fibonacci levels often act as strong psychological levels of support or resistance in the market.
The second support level is at 1.0516, which stands as a multi-swing low support. This suggests that this level has been tested multiple times in the past as a support level and could potentially hold up against further price declines.
On the upside, if the pair begins to reverse its bearish trend, it could face resistance at 1.1033. This level acts as an overlap resistance and could potentially hinder bullish momentum.
Further up, the second resistance level is at 1.1157, which could act as a swing high resistance. This means it has previously been a level at which price has reversed, indicating it could serve as a barrier to further price increases.
GBP/USD:
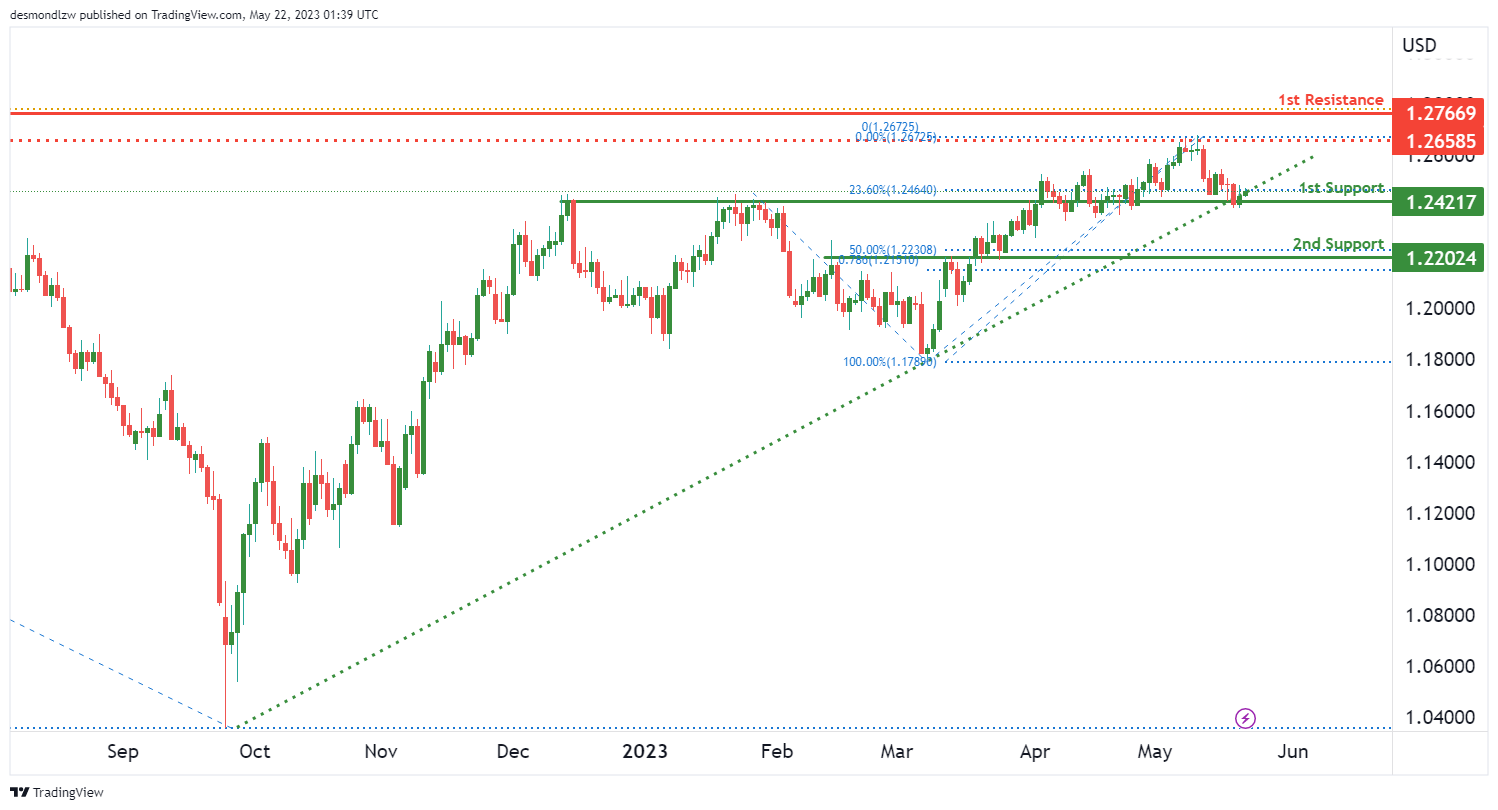
The GBP/USD pair currently displays a bullish trend, which is supported by the fact that the price is above a major ascending trend line. This suggests that further bullish momentum may be expected.
Potential price action could see a bullish bounce off the first support, and an upward move towards the first resistance.
The first support level is located at 1.2421 and it acts as an overlap support, indicating it has been a significant level in the past, both as support and resistance.
The second support is found at 1.2202 and acts as a pullback support, meaning it has proven to support price action during a pullback within the overall upward trend.
On the upside, the first resistance level to watch is at 1.2766, acting as a swing high resistance, a level where price has historically reversed and moved lower.
An intermediate resistance level has also been identified at 1.2658. This level acts as a multi-swing high resistance, suggesting it has served as a price ceiling multiple times in the past.
USD/CHF:
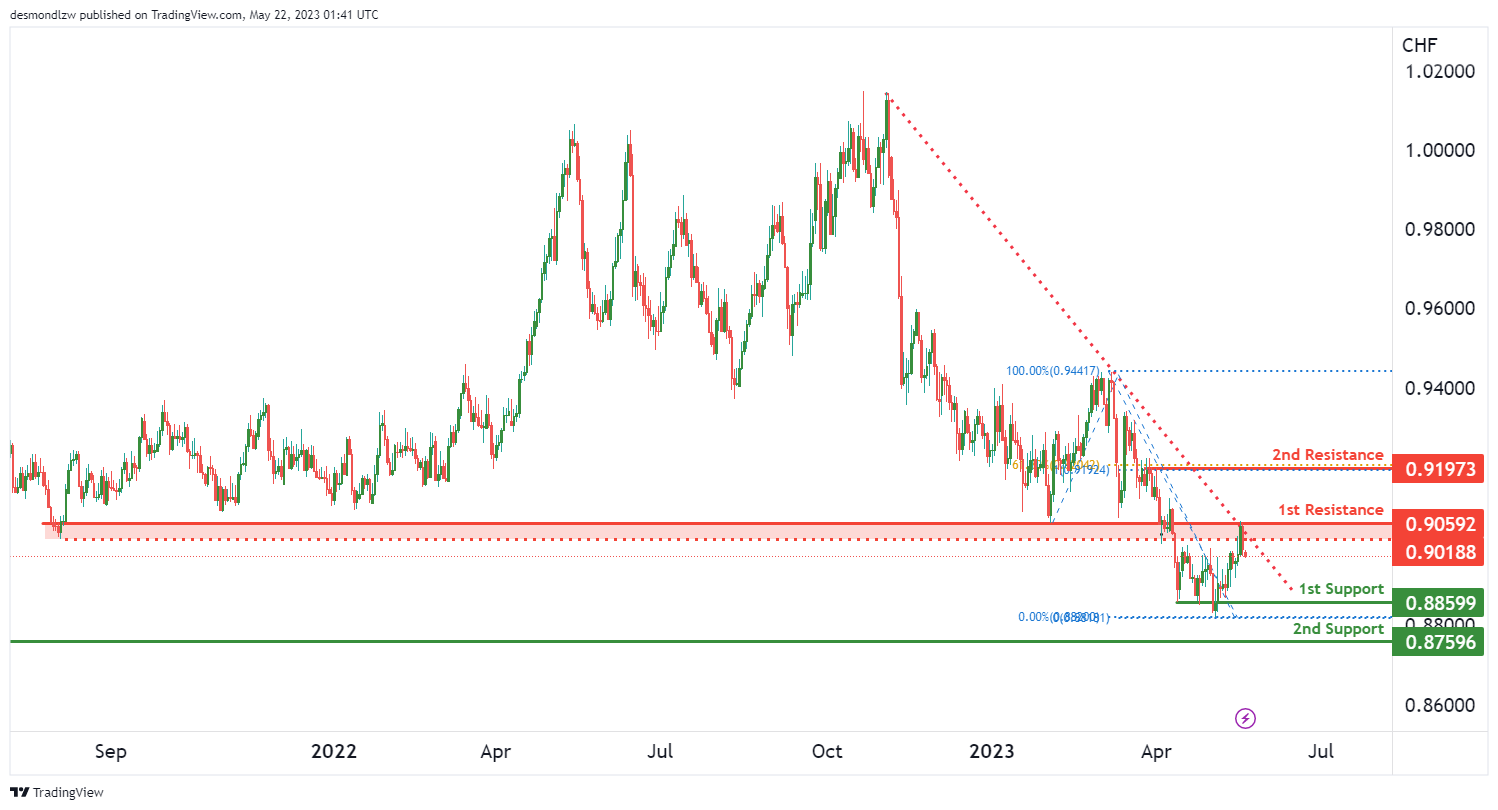
The USD/CHF pair is currently on a bearish trend, indicated by the price movement being below a major descending trend line.
Given this trend, it is possible that the price could continue to move bearishly towards the first level of support.
The first support level is identified at 0.8859, which has acted as a multi-swing low support in the past, signifying its importance as a floor level in this downtrend.
The second support level is at 0.8759, and this acts as a swing low support. This level has previously acted as a turning point for the price.
On the other hand, if the price reverses upwards, the first resistance level is seen at 0.9059. This level serves as an overlap resistance, indicating it has acted as both a support and resistance level in the past.
The second resistance is at 0.9197, and this level is considered a significant one since it represents a multi-swing high resistance. Additionally, it corresponds with the 61.8% Fibonacci retracement and the 100% Fibonacci projection, suggesting that it may act as a substantial barrier for upward movements.
An intermediate resistance level is also identified at 0.9018, which is considered a pullback resistance, highlighting its potential to halt short-term price increases during this overall downtrend.
USD/JPY:
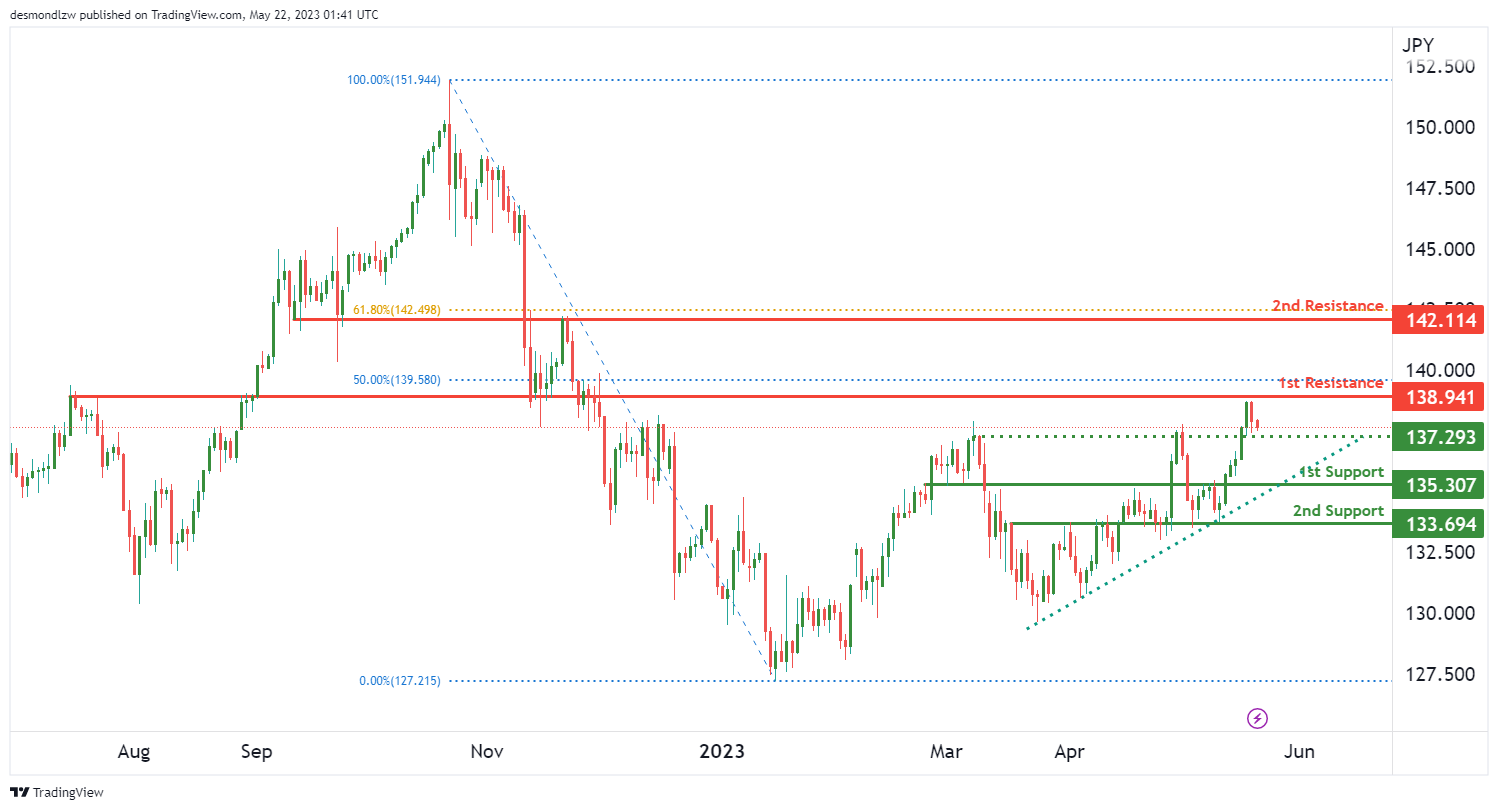
The USD/JPY pair is currently experiencing a bearish trend, despite the price being above a major ascending trend line. This could suggest that there may be a potential reversal or consolidation on the horizon.
However, considering the current bearish momentum, it’s plausible that the price could continue this downtrend towards the first level of support.
The first level of support is at 135.30, acting as a pullback support. This is where the price has previously bounced back after a downturn, potentially indicating its significance as a psychological level for market participants.
The second level of support is located at 133.69, acting as an overlap support. This level has acted as both a support and resistance level in the past, indicating its potential importance.
Should the price reverse, the first resistance level is at 138.94. This level serves as an overlap resistance and aligns with the 50% Fibonacci retracement level, indicating a significant hurdle for the price if it starts to increase.
The second resistance level is at 142.11, also acting as an overlap resistance. In addition, it corresponds with the 61.8% Fibonacci retracement, which is often considered a key level in market retracements.
There is an intermediate level of support at 137.29, which has previously acted as a pullback support, further highlighting its potential to halt short-term price decreases during this overall downtrend.
AUD/USD:
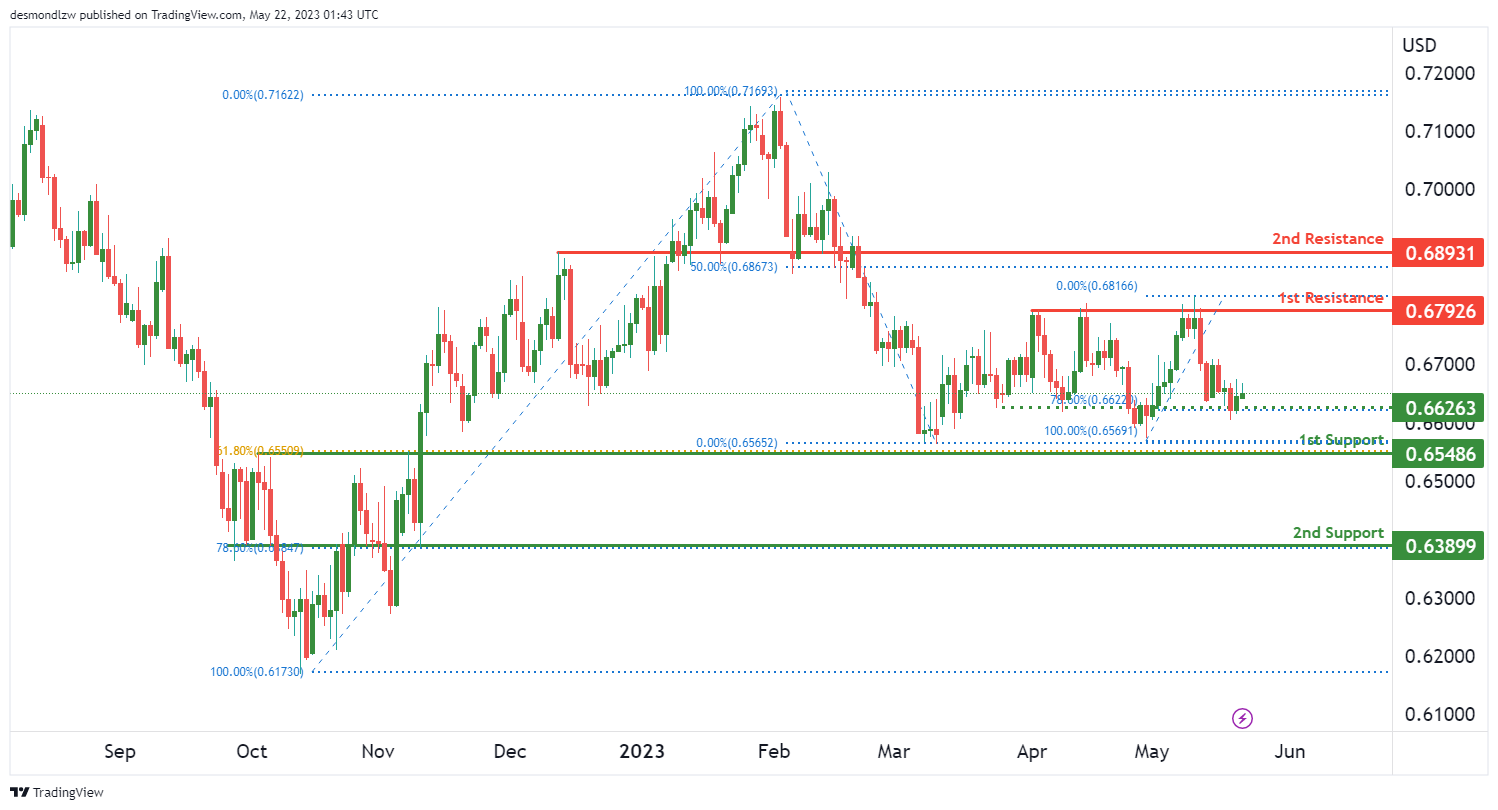
The AUD/USD pair is currently experiencing a bearish trend. This suggests that the pair might continue to decrease towards the first level of support.
The first support level is at 0.6548, which acts as an overlap support. This level is significant as it aligns with the 61.8% Fibonacci retracement level, which is often considered a key level in market retracements.
The second support level is at 0.6389, which also serves as an overlap support and aligns with the 78.6% Fibonacci retracement level. This level has also shown to be significant in market retracements and could potentially halt further price decrease.
On the upside, if the price reverses, the first resistance level is at 0.6792, which has previously acted as a multi-swing high resistance. This means the price has hit this level multiple times in the past and struggled to break above it.
The second resistance level is at 0.6893 and serves as a pullback resistance. This indicates it’s a level where the price has previously rebounded after a brief retracement.
In between, there is an intermediate level of support at 0.6626. This level serves as a pullback support and is also at the 78.6% Fibonacci retracement level, highlighting its significance in potentially stopping the price from falling further.
NZD/USD
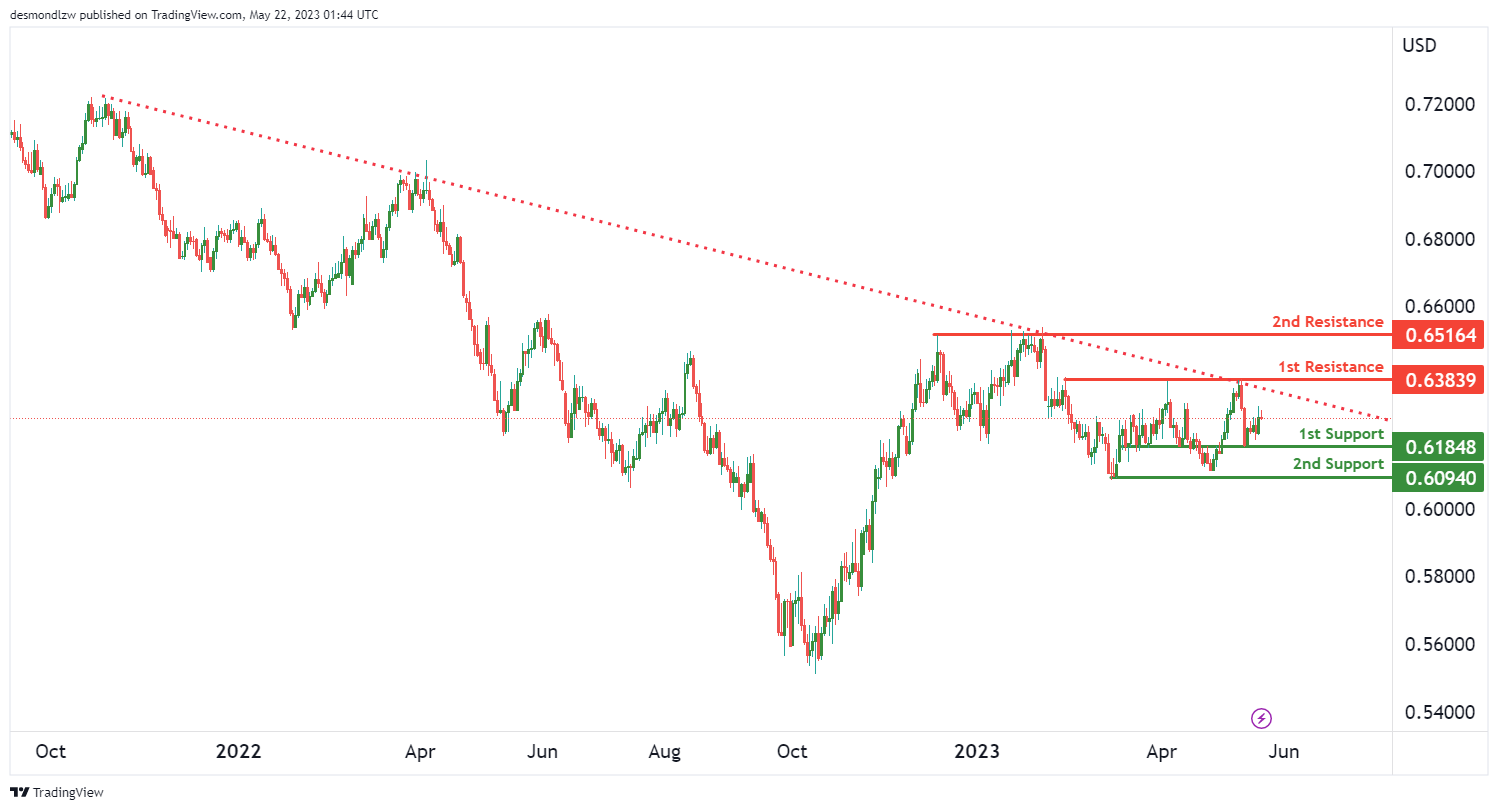
The NZD/USD pair currently has a bearish trend, and the price might continue to decrease towards the first level of support.
The first support level is at 0.6184, which is considered an overlap support, a price level that has acted as both resistance and support in the past. This could be a level where the price may pause or rebound.
The second support level is at 0.6094, representing a multi-swing low support. This is a level where the price has bottomed out multiple times in the past, indicating a strong level of demand.
On the upside, the first resistance level is at 0.6383. This level has acted as a multi-swing high resistance in the past, a price level that the market has failed to exceed after several attempts, which may lead to a price reversal.
The second resistance is at 0.6516, acting as a pullback resistance. This is a level where the price has rebounded after a brief retracement.
USD/CAD:
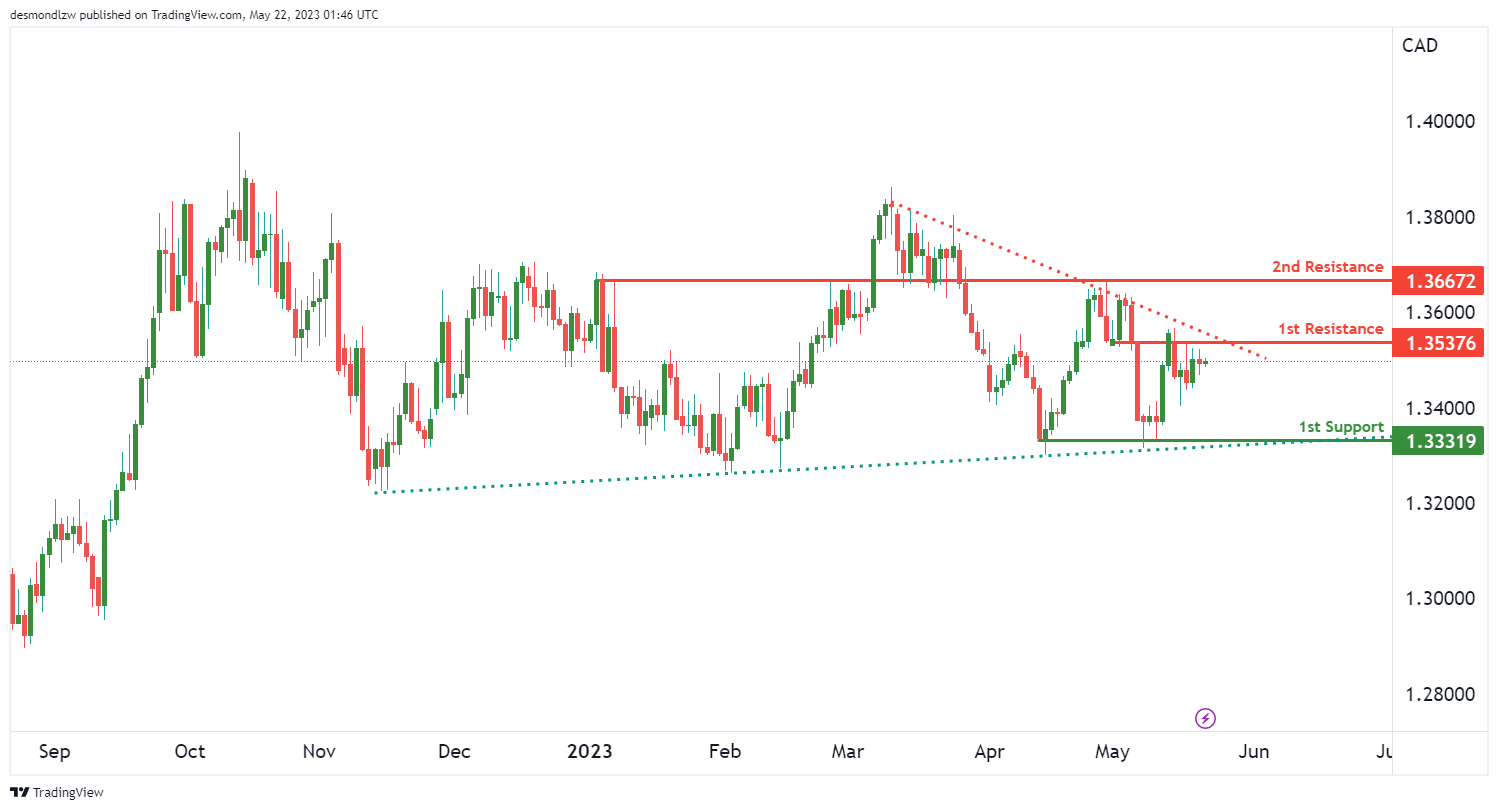
The USD/CAD pair currently shows a bearish trend, with potential for continuation towards the first support level.
The first support level is at 1.3331, considered a multi-swing low support. This is a level where the price has bottomed out multiple times in the past, indicating a strong level of demand.
In case of a potential reversal or pullback, the first resistance level to consider is at 1.3537, identified as an overlap resistance. This means that this level has served as both support and resistance in the past.
The second resistance level is at 1.3667, another overlap resistance. This level, like the first, has seen price action flip between support and resistance, making it a significant level to watch for potential price reactions.
DJ30:
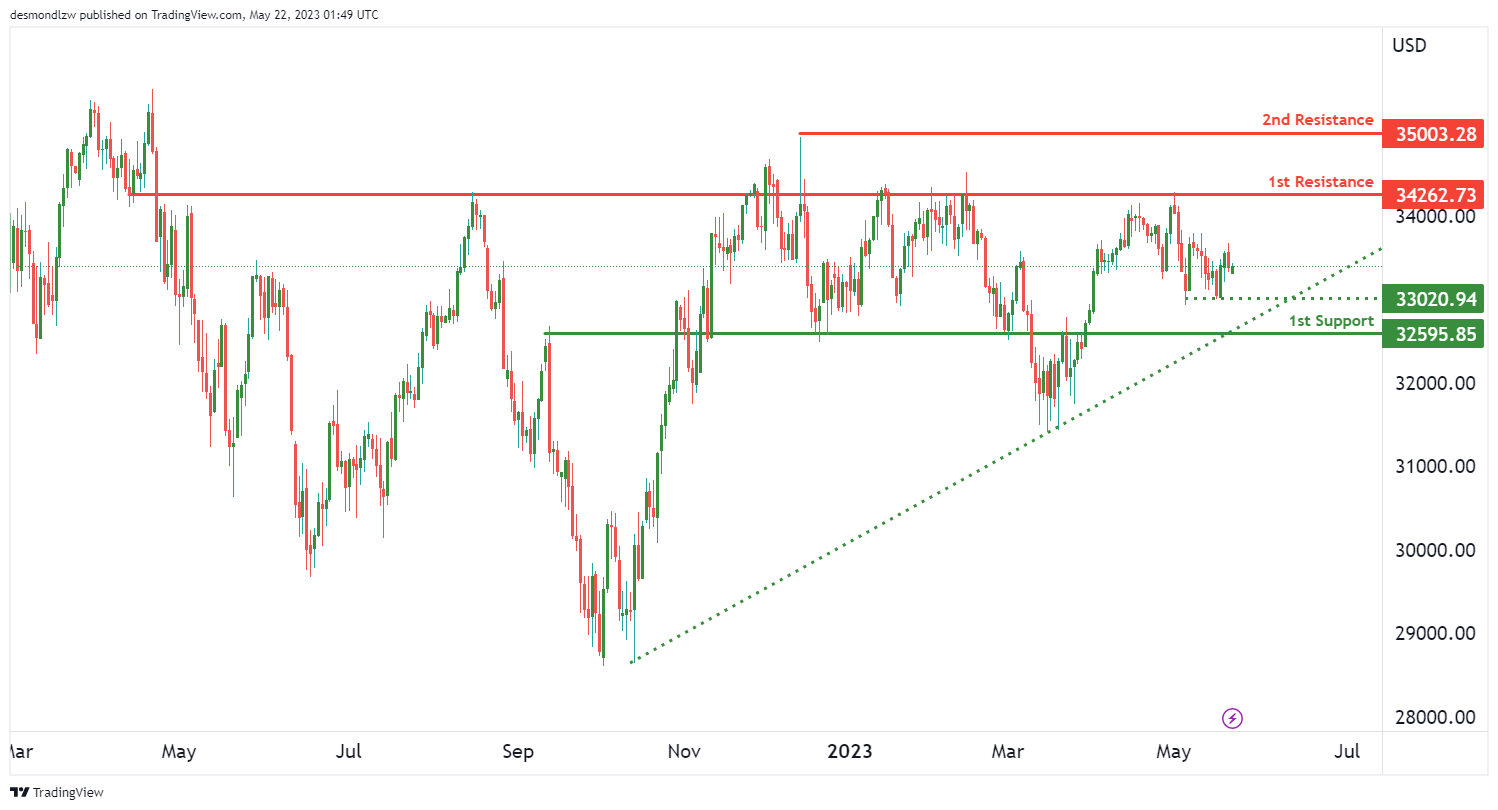
The DJ30 (Dow Jones Industrial Average) currently shows a bullish trend, with potential for continuation towards the first resistance level.
The first support level is at 32595.85, considered a multi-swing low support. This is a level where the price has bottomed out multiple times in the past, indicating a strong level of demand.
The intermediate support is at 33020.94, which also functions as a multi-swing low support level, adding another layer of demand before the price reaches the first support level.
The first resistance level is at 34262.73, identified as an overlap resistance. This means that this level has served as both support and resistance in the past.
The second resistance level is at 35003.28. This level is a multi-swing high resistance point, indicating that it has capped the price advances multiple times in the past and may pose a challenge for bulls.
GER30:
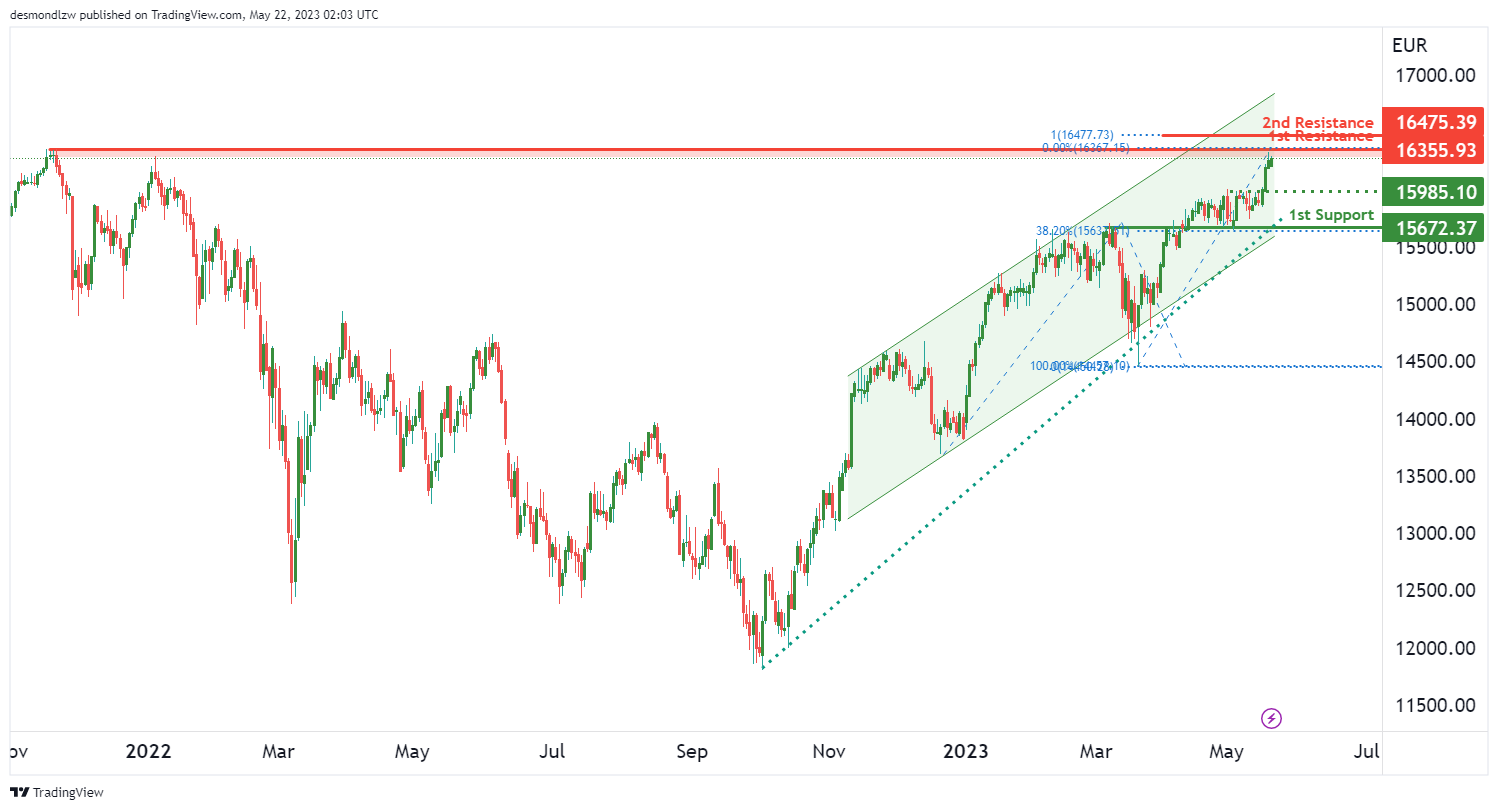
The GER30 (DAX Index) currently presents a bullish outlook, suggesting that the price could break through the first resistance level and rise towards the second resistance level.
The first support level is identified at 15672.37, which serves as an overlap support, indicating that this level has previously acted as both support and resistance. This level could potentially halt a price decline.
The intermediate support is noted at 15985.10. This level is seen as a pullback support, which could provide a cushion for the price if it were to retrace from its recent advances.
The first resistance level is found at 16355.93. This level serves as a multi-swing high resistance, which means it has capped the price advances multiple times in the past, presenting a hurdle for continued bullish price action.
The second resistance level is at 16475.39, which is also where the 100% Fibonacci projection is located. This level could potentially be a target for the bulls if the price were to break through the first resistance.
BTC/USD:
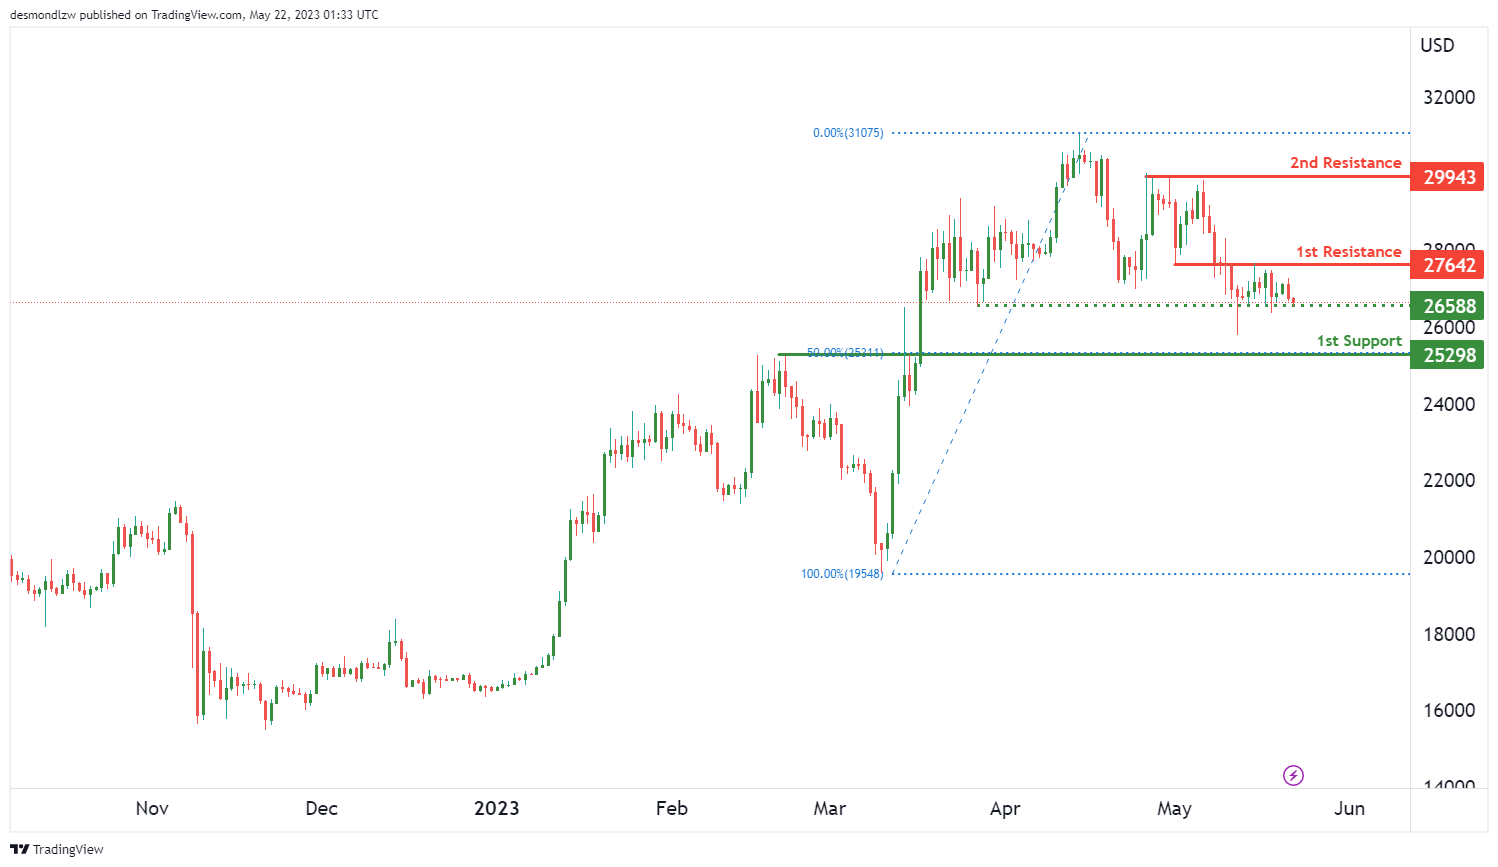
The GER30 (DAX Index) is currently showing a bearish momentum, suggesting a possible continuation of the price decline towards the first support level.
The first support level is found at 25298, serving as a pullback support, a level that the price has previously rebounded from. Additionally, this level is also at the 50% Fibonacci retracement level, making it a significant level to watch as prices could potentially bounce back.
The intermediate support level is at 26588, acting as a multi-swing low support. This level has served as the low point for multiple price swings and might provide a strong support in the event of further price declines.
The first resistance level is at 27642, acting as an overlap resistance. This level has previously served as both support and resistance, making it a significant hurdle for price advances.
The second resistance level is at 29943, which has acted as a multi-swing high resistance, capping price advances multiple times in the past. This could be a target for any bullish reversals.
US500
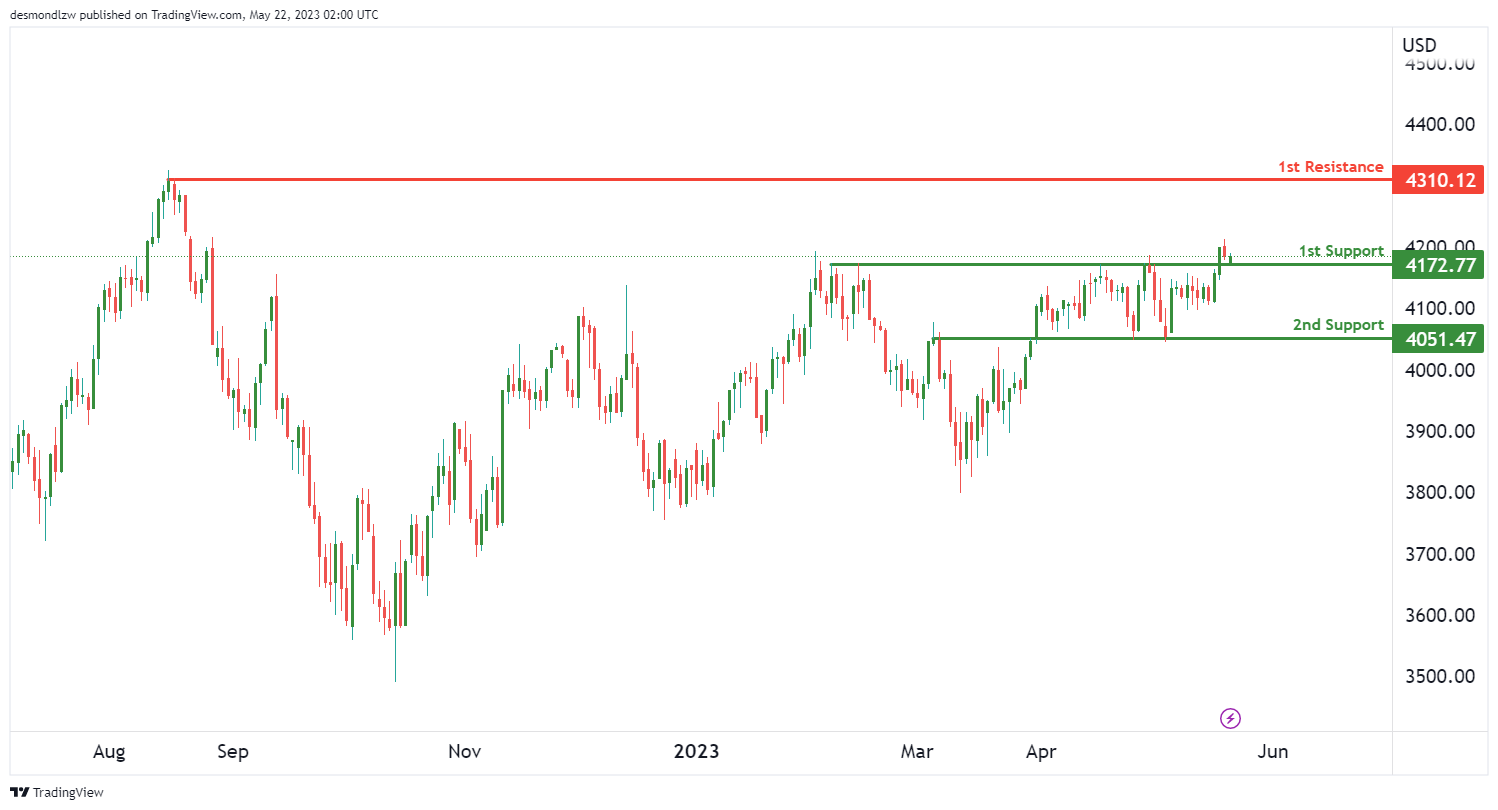
The US500 (S&P 500 Index) is currently showing a bullish momentum, suggesting potential for further upside.
The first support level is at 4172.77, which serves as a pullback support, where the price has previously rebounded from. Moreover, this level coincides with the 50% Fibonacci retracement level, further increasing its significance as a potential area where prices might bounce back.
The second support level is at 4051.47. This level acts as an overlap support, meaning it has previously served as both support and resistance, thereby making it a key level to watch.
On the upside, the first resistance level is at 4310.12. This is a swing high resistance level, indicating that it has previously capped price advances. Therefore, it could be a target for any bullish moves.
ETH/USD:
The ETH/USD (Ethereum to US Dollar) pair is currently showing a bullish momentum, suggesting potential for further upside.
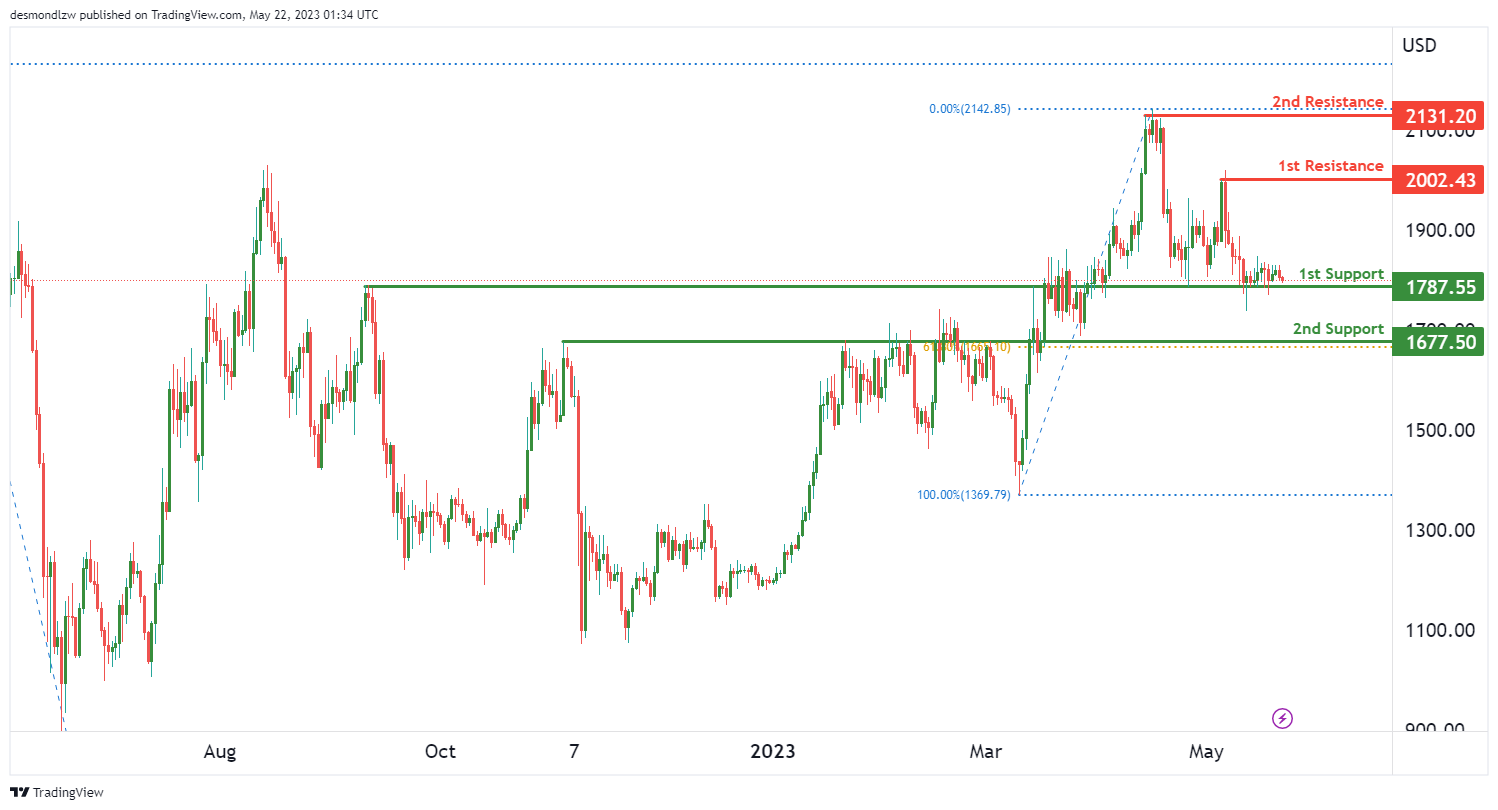
The first support level is at 1787.55, which serves as an overlap support. This level has acted as both support and resistance in the past, and it could potentially hold as a strong support again.
The second support level is at 1677.50. This is another overlap support, but notably, it also coincides with the 61.80% Fibonacci retracement level. This adds more significance to this level as a potential area where prices might bounce back.
On the upside, the first resistance level is at 2002.43. This is a swing high resistance level, indicating that it has previously capped price advances. Therefore, it could be a target for any bullish moves.
The second resistance level is at 2131.20. This is a multi-swing high resistance level, indicating that it has been a difficult level to break through multiple times in the past. If price can break this level, it could suggest more upside for the pair.
WTI/USD:
The WTI (West Texas Intermediate) is showing a bearish momentum, suggesting a potential continuation of a downtrend.
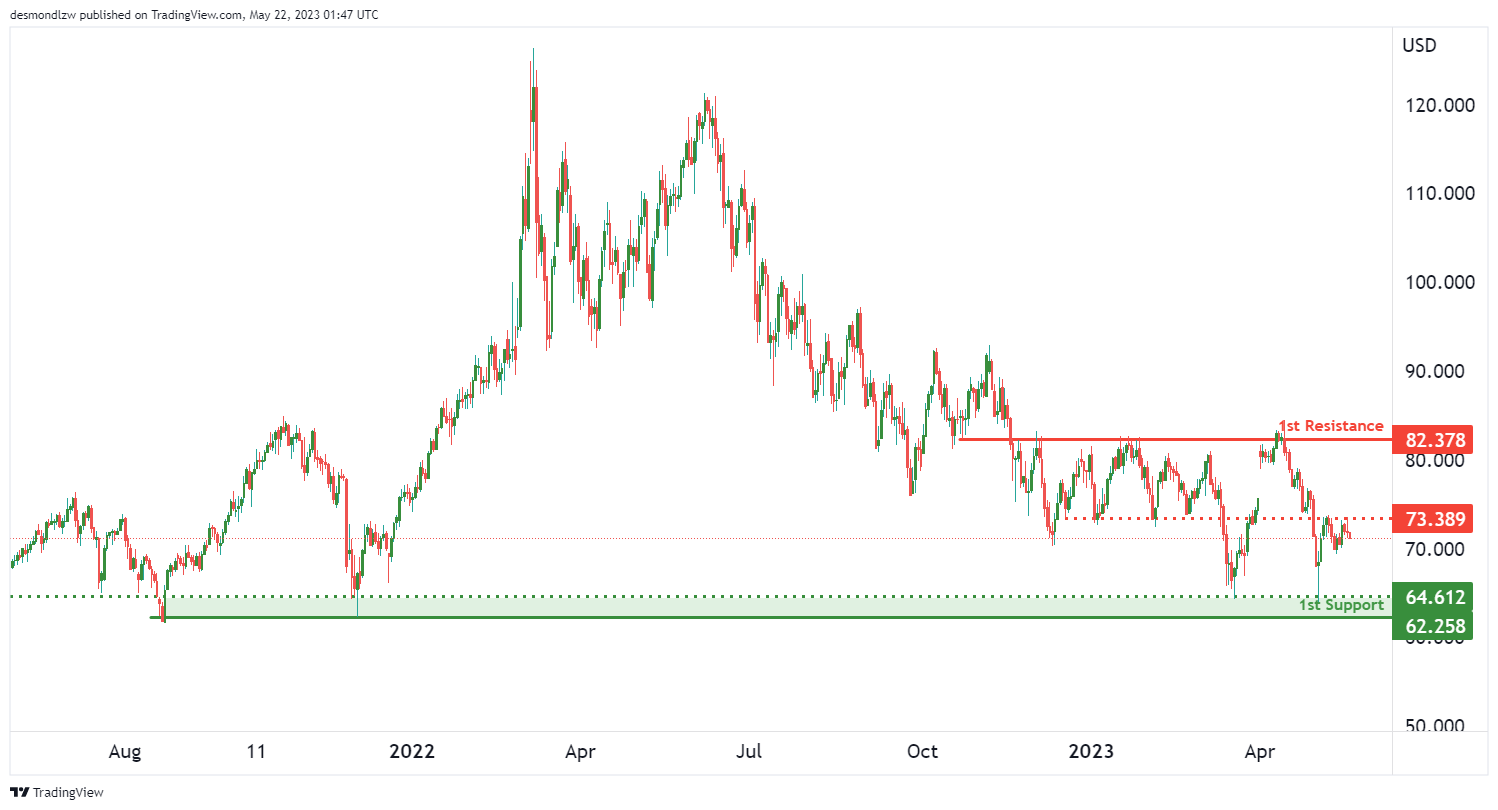
The first support level is at 62.25, which is a multi-swing low support. This means that the price has bounced off this level multiple times in the past, making it a potentially strong support level where the price could bounce back.
An intermediate support level is at 64.61. This is also a multi-swing low support level, indicating that the price has bounced from this level on more than one occasion. It could potentially act as a cushion for any further declines.
On the upside, the first resistance level is at 82.37. This is an overlap resistance level, meaning that the price has faced resistance at this level in the past. It could potentially cap any upside moves.
An intermediate resistance level is at 73.38. This is another overlap resistance level where the price could face some resistance.
XAU/USD (GOLD):
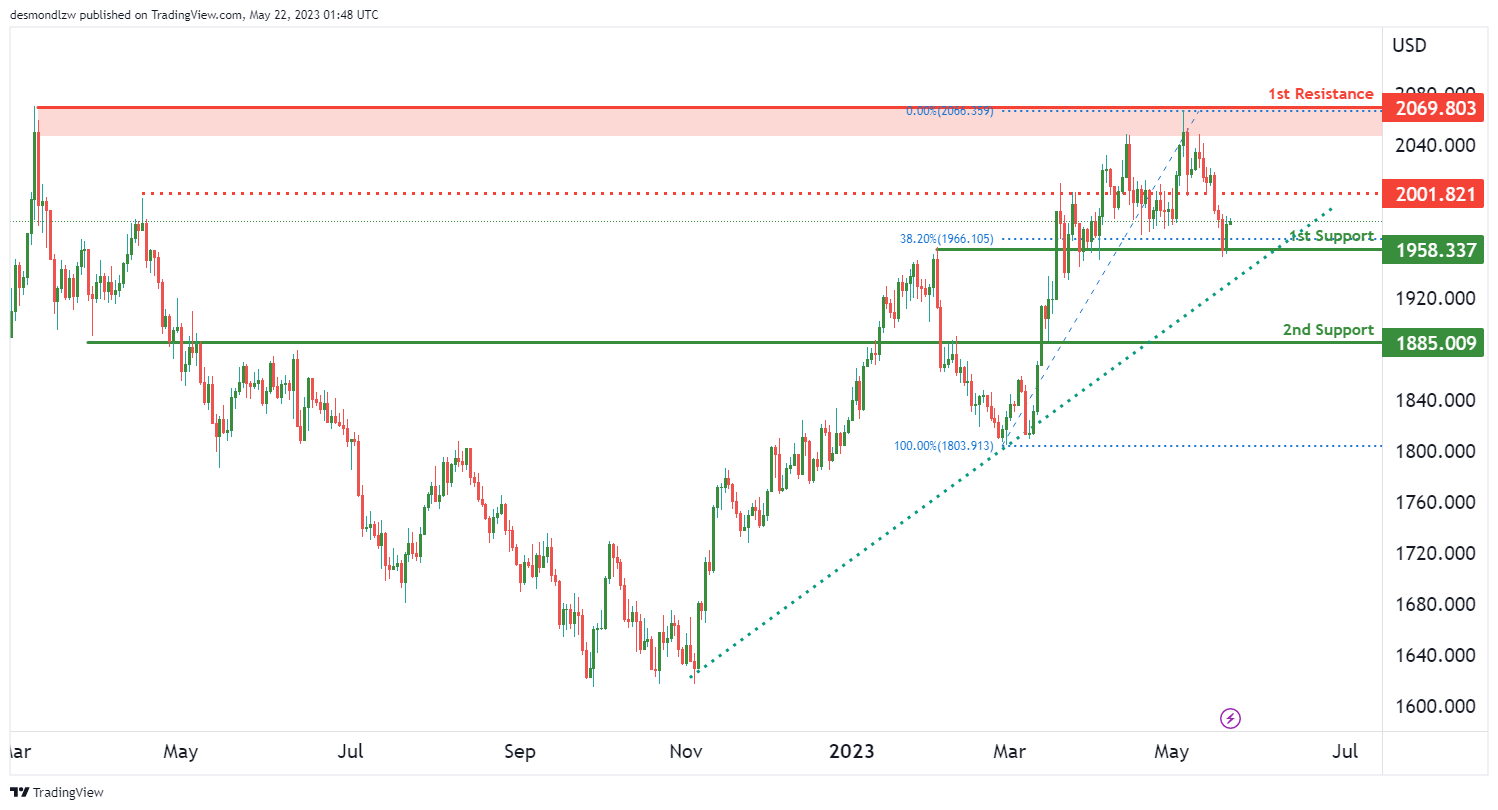
The XAU/USD chart demonstrates bullish momentum, with the price positioned above a major ascending trend line, suggesting the potential for further upward movement.
In line with this bullish momentum, there is a possibility of a bullish continuation towards the first resistance level at 2069.80.
To support this potential upward movement, there are two levels of support. The first support level at 1958.33 is identified as an overlap support and coincides with a 38.20% Fibonacci retracement, indicating its significance as a potential price floor.
The second support level at 1885.00 is recognized as an overlap support, contributing to the overall bullish sentiment.
On the resistance side, the first resistance level at 2069.80 represents a multi-swing high resistance. Additionally, there is an intermediate resistance level at 2001.82, which is identified as a pullback resistance.
These levels of support and resistance indicate potential areas where the price may find support or encounter resistance as it continues its bullish momentum.
Gold Stuck Below the 2,000 Mark as Bulls Try to Mount Their Defense
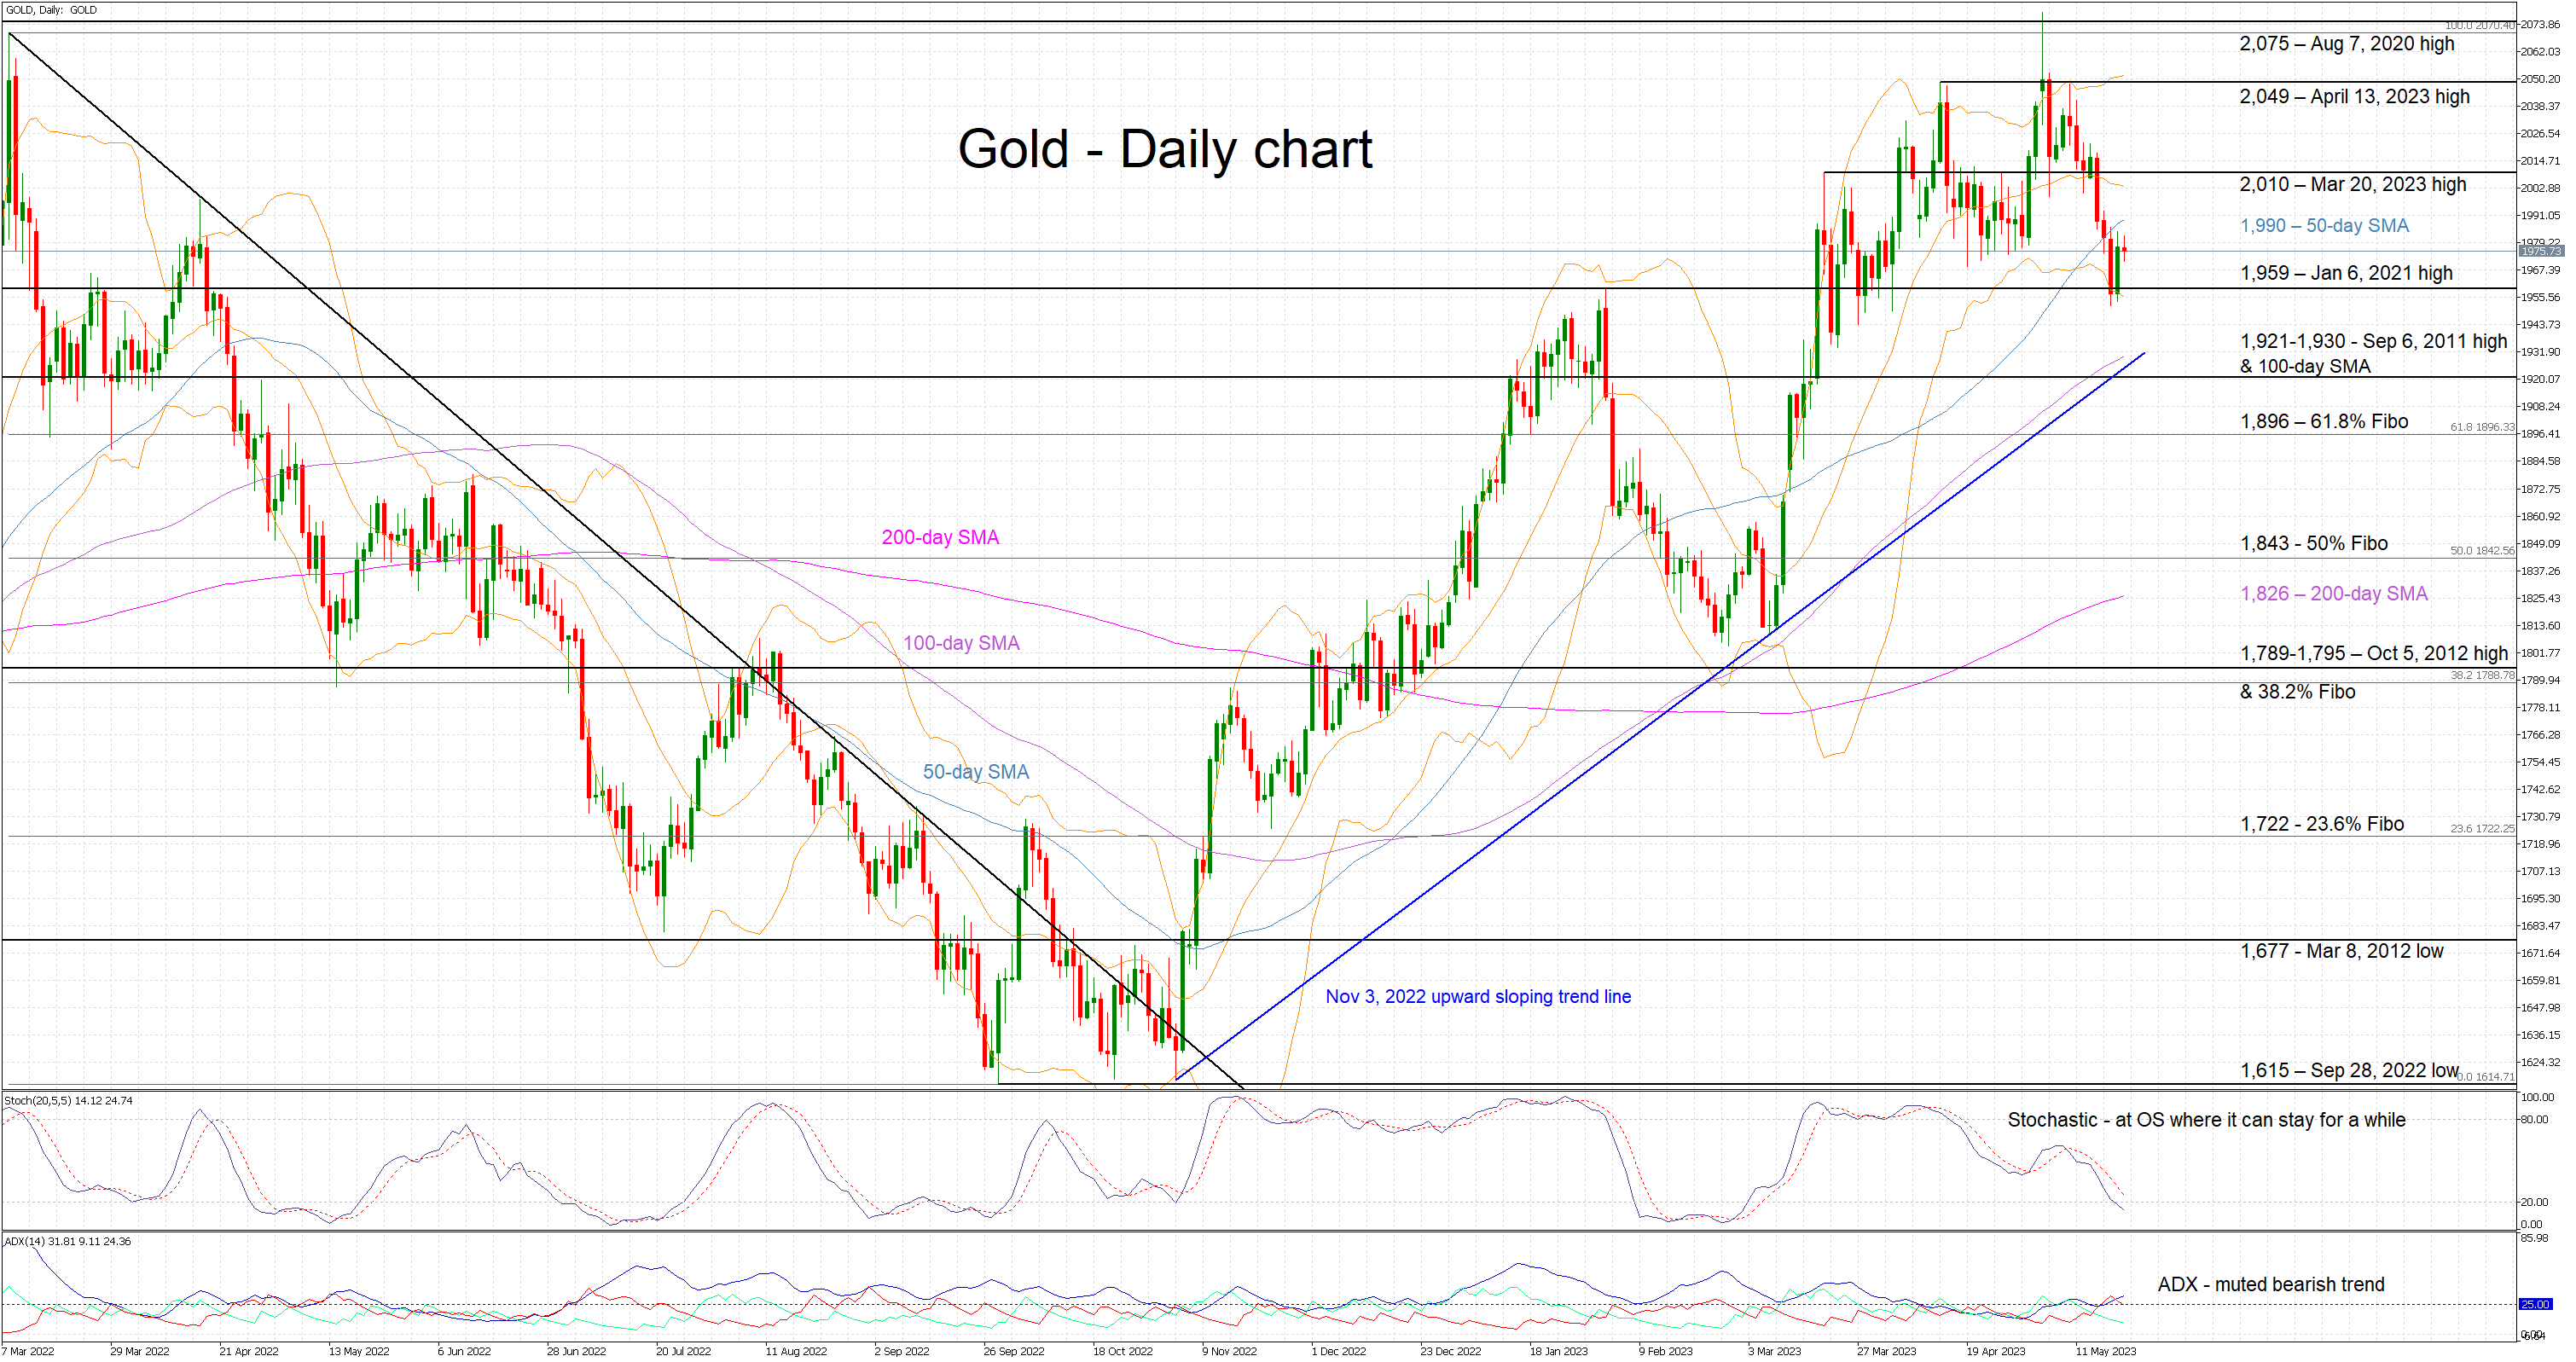
Gold remains comfortably below the 2,000 psychological level, a significant drop from the May 4, 2023 high of 2,079. This is probably the bulls’ first serious defeat since the start of the strong upleg in October 2022. They are currently trying to recover some of their recent losses and appear to have heavily invested in holding the 1,959 level. This is key for market sentiment.
The momentum indicators are mostly still on the bears’ side. The Average Directional Movement Index (ADX) is clearly pointing to a muted bearish trend, and the stochastic is edging aggressively lower. However, it has just entered its oversold territory (OS) where it can stay for a while. This means that bearish pressure could continue to affect gold, but with the potential next downleg being less aggressive than currently envisaged by the bears.
Should the bears muster the courage and take advantage of these bearish signals, they would aim for a break of the January 6, 2021 high at 1,959. Lower, the 1,921-1,930 area defined by the September 6, 2011 high, the 100-day simple moving average (SMA) and the November 3, 2022 upward sloping trend line respectively could prove tougher to crack.
On the other hand, the bulls would love to hold the 1,959 level, quickly break the 50-day SMA at 1,990 and then try to recapture the 2,000 mark. The March 20, 2023 high at 2,010 would be the first test of their resolve. If successful, the April 13, 2023 high of 2,049 would then be the next target.
To sum up, the bulls are trying to put a temporary stop to gold’s freefall by defending the 1,959 level, but the bears feel confident that there is still some gas left in the tank.
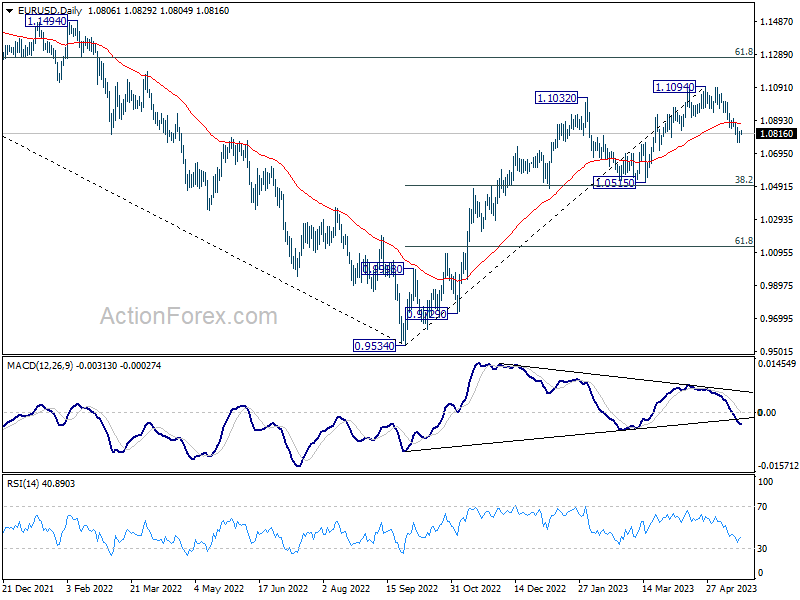
EURUSD Extends Retreat Below Key Trendline
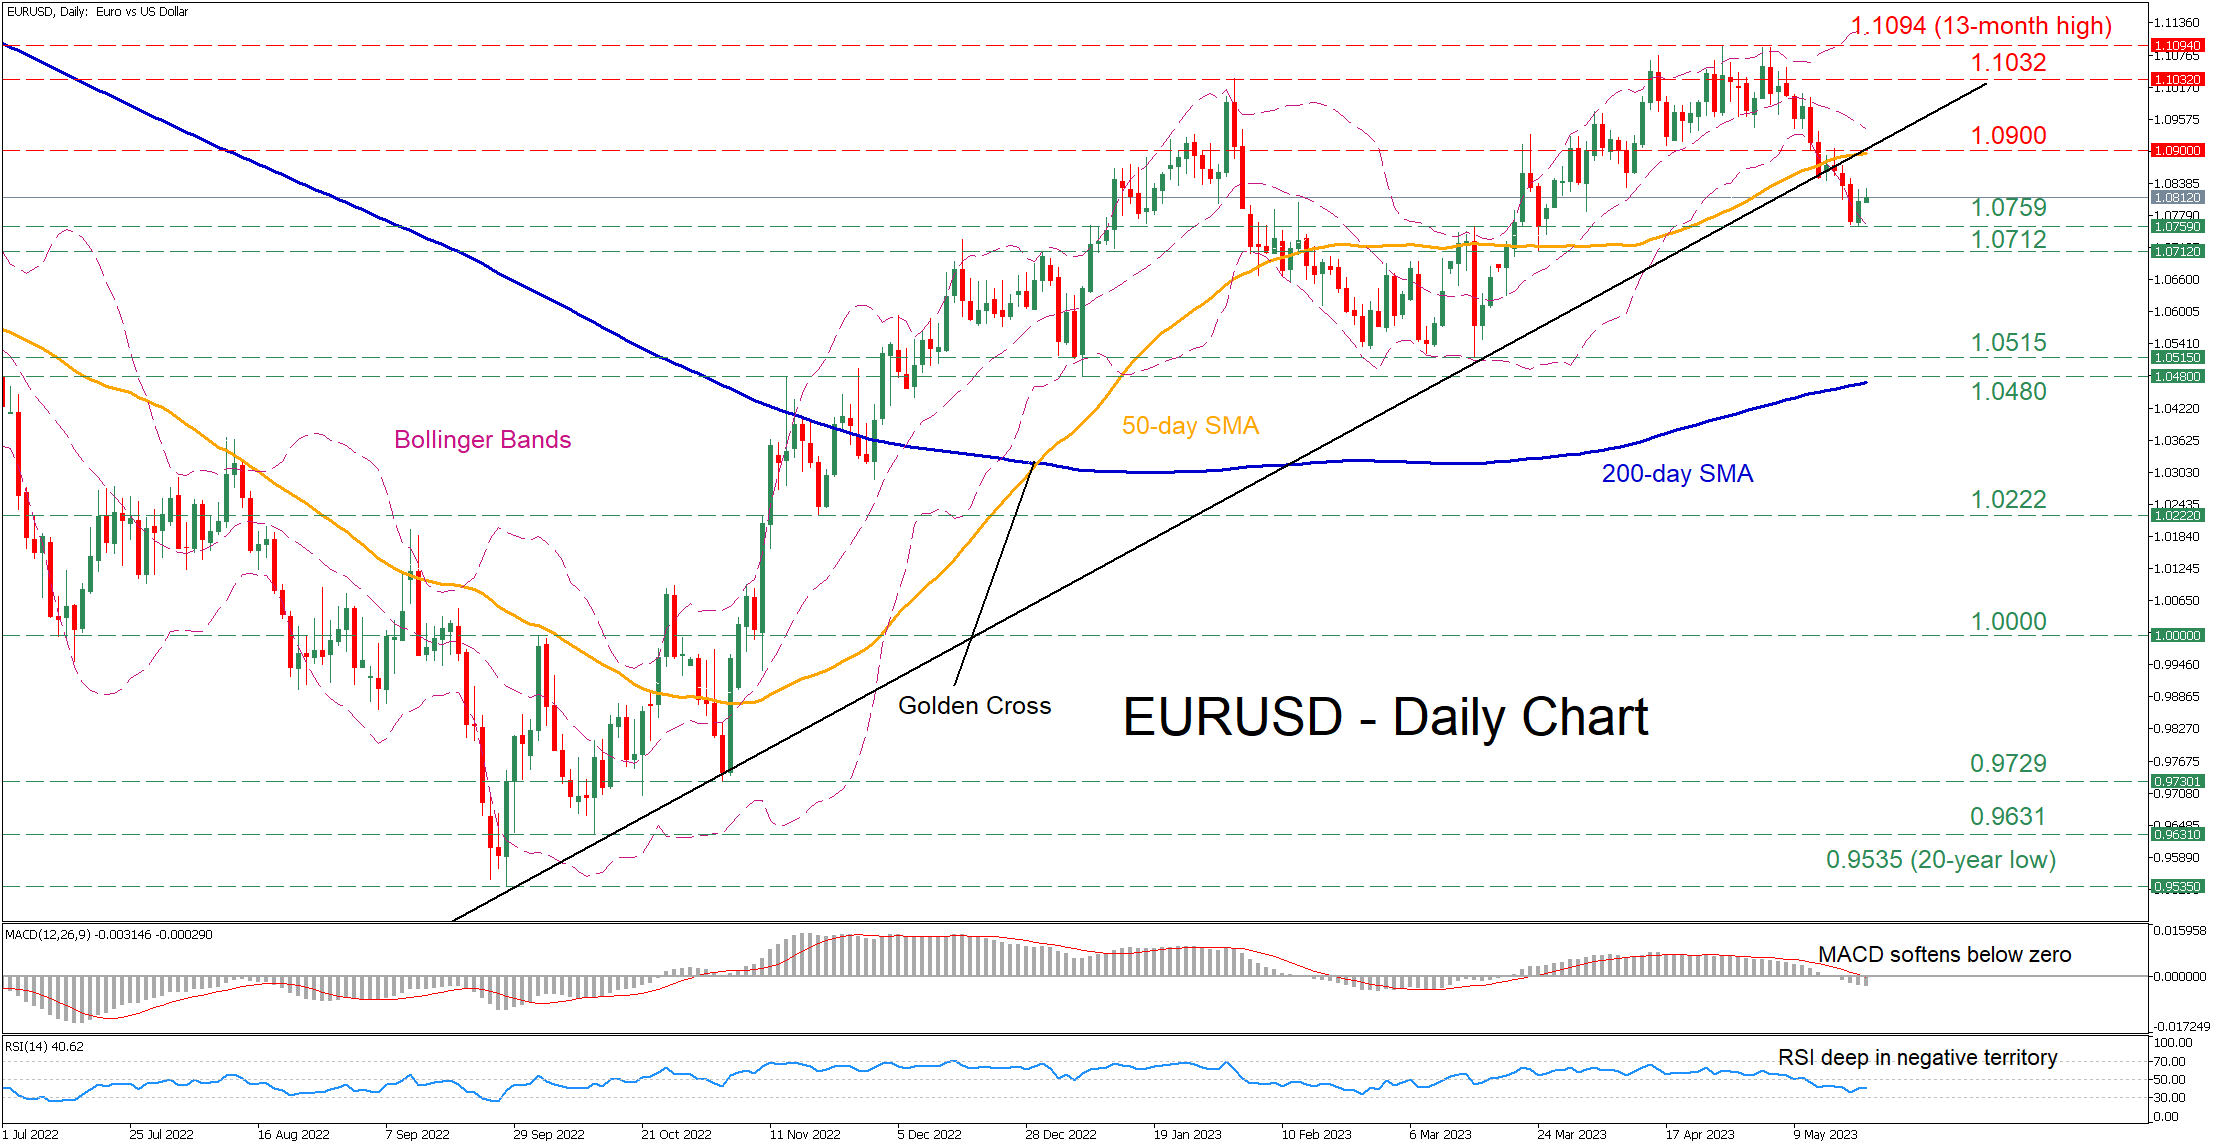
EURUSD has been stuck in a clear downtrend after peaking at the 13-month high of 1.1094 in late April. In addition, the pair has sliced through crucial technical levels such as the 50-day simple moving average (SMA) and the ascending trendline that connected its higher lows since September 2022.
The short-term oscillators are endorsing this bearish near-term bias. Specifically, the MACD is retreating further below both zero and the red signal line, while the RSI has flatlined below its 50-neutral mark.
Should the decline resume, the recent low of 1.0759 could act as the first line of defense. Sliding beneath that floor, the pair could descend to form fresh lower lows, where the 1.0712 hurdle might curb further declines. A violation of that territory could turn the spotlight to the March bottom of 1.0515.
On the flipside, if the price reverses higher, the 1.0900 psychological mark, which coincides with the 50-day SMA, could prove to be the first obstacle for buyers to clear. Breaking above this zone, the price may advance towards the February peak of 1.1032. Failing to halt there, the pair could then challenge the 13-month high of 1.1094.
In brief, EURUSD has been constantly losing ground after failing to generate a fresh higher high in late April. Nevertheless, the price is currently trading near its lower Bollinger band, indicating that the market could have reached oversold conditions and hinting at a potential upside correction.
Aussie Eyeing US Debt Talks and RBNZ Decision
AUD/USD kept to tight ranges last week even as market pricing for another RBA hike increased. In the week ahead, US debt negotiations will be watched each day, while on crosses, AUD/NZD is under pressure ahead of the RBNZ decision on Wednesday.
AUD/USD traded a tight 0.6605 to 0.6710 range last week, another week of daily closes with either a 0.66 or 0.67 handle, which has prevailed since early March. One-month realised daily volatility is down to around 9%, lows since April 2022 and compared to highs above 20% in November 2022.
While these ranges are very familiar, economic data flow over the week ensured that the Aussie traded mostly at the lower end of ranges. On Tuesday, China’s April activity data fell well short of expectations. Given that activity in April 2022 in China was depressed by Covid lockdowns, the annual changes showed sizeable growth, 5.6%yr for industrial production, 18.4%yr for retail sales. But the monthly changes were weak: 0.5% for retail sales and a -0.5% contraction in industrial production.
This sluggish start to Q2 in China prompted some forecasters to revise down their 2023 GDP growth forecasts. The median forecast on Bloomberg is 5.7%yr, after just 3.0% in 2022. Westpac looks for 6.2% growth this year.
Australia’s key data also didn’t help the currency’s cause, though the overall view remains that the labour market is resilient. The Q1 wage price index rose 0.8%qtr, 3.7%yr. The 0.8% quarterly rise matched Q4, both printing below consensus. But the 3.7% annual wages growth was a high since 2012 and leaves the series on track for Westpac’s forecast of a cycle peak at 4.0%yr in Q4 2023.
Australian consumers reacted to the RBA’s surprise May rate hike with a near-8% monthly fall in confidence in the Westpac survey. More surprising was the April labour force survey, which showed a -4k dip in employment (after a revised 61k jump in March) and a rise in the unemployment rate to 3.7% from 3.5%. However, the details offer hope that seasonality (the timing of Easter) explains some of the weakness.
Despite the mostly soft local data, markets are taking seriously the RBA’s hawkish turn in May, pricing around a two-thirds chance of another 25 basis point rate rise by the 1 August meeting. This increased yield support has helped the AU-US 2-year bond spread consolidate around a -75bp discount, still a substantial weight on the A$ by historical standards, but it has narrowed from around -115bp mid-April.
Australia’s calendar is nearly empty until April retail sales on Friday. US data is worth noting as always, along with the FOMC minutes, but Fed Chair Powell has probably set the tone for the FOMC for now, making clear to a conference on Friday that he judges a pause in June as prudent. Westpac believe the funds rate has peaked at 5.00-5.25%.
On A$ crosses, AUD/GBP will be sensitive to UK April CPI, where base effects are expected to help inflation finally roll over from above 10% to nearer 8%yr. But AUD/NZD surely has the most at stake as the RBNZ delivers its policy decision on Wednesday. Most economists expect a 25bp hike to 5.50%, a handful look for +50bp to 5.75% and market pricing is also somewhat split, at 5.58% to start the week.
Westpac expects 25bp this week and a cash rate peak of 6%. Such an outlook is increasingly evident in AUD/NZD, which has slipped below 1.0600 to levels last seen in December 2022.
Event risk
US debt ceiling negotiations continue (no fixed date), S&P Global flash May manufacturing and services PMIs including Australia, Japan, Eurozone, UK, US (Tue), RBNZ policy decision, NZ Q1 real retail sales, Germany May IFO business survey, UK Apr CPI, FOMC May meeting minutes (Wed), Aust Apr retail sales, UK Apr retail sales, US Apr personal income and spending, US final May U Michigan consumer sentiment (Fri)
EUR/USD Daily Outlook
Daily Pivots: (S1) 1.0768; (P) 1.0798; (R1) 1.0837; More...
Intraday bias in EUR/USD remains neutral for consolidation above 1.0759 temporary low. But deeper decline is expected as long as 1.0903 resistance holds. Fall from 1.1094 is seen as correcting whole up trend from 0.9534. Below 1.0759 will target 1.0515 cluster support, 38.2% retracement of 0.9534 to 1.1094 at 1.0498. On the upside, though, firm break of 1.0903 will bring stronger rebound back to retest 1.1094 high instead.
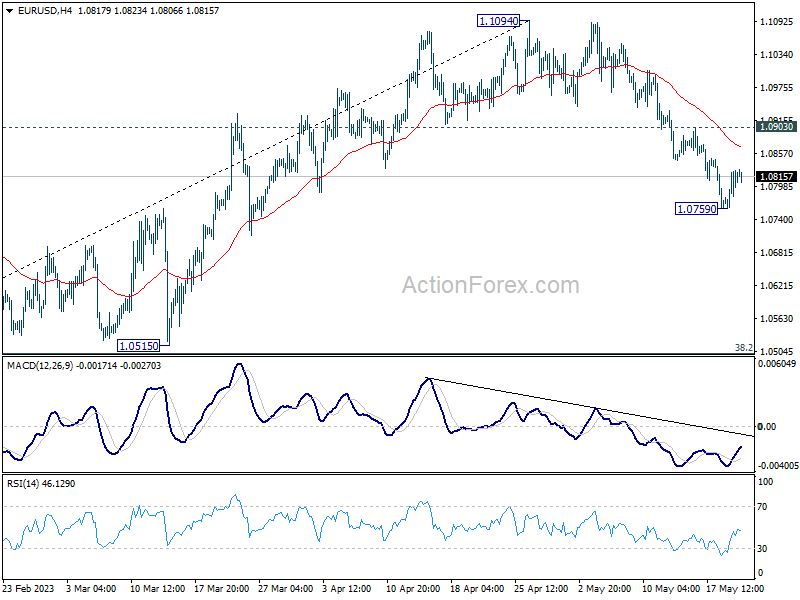
In the bigger picture, as long as 1.0515 support holds, rise from 0.9534 (2022 low) would still extend higher. Sustained break of 61.8% retracement of 1.2348 (2021 high) to 0.9534 at 1.1273 will solidify the case of bullish trend reversal and target 1.2348 resistance next (2021 high).