Sample Category Title
RBNZ shadow board divided on rate hike this week
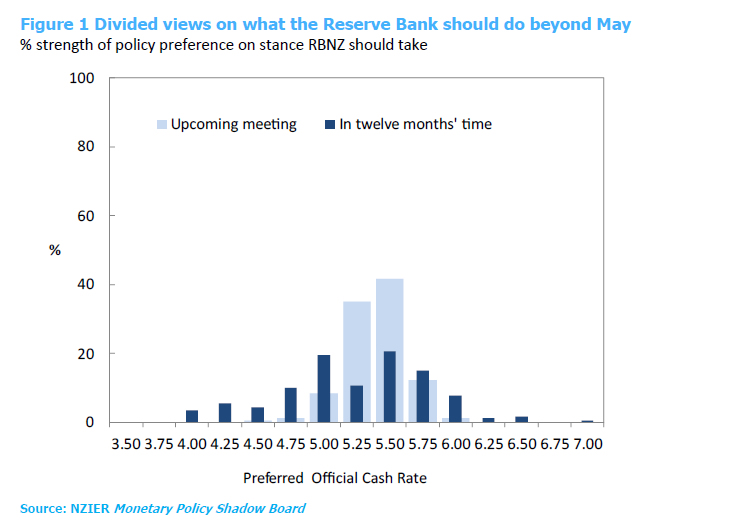
NZIER disclosed that its RBNZ Shadow Board is in disagreement over whether RBNZ should raise OCR the Official Cash Rate (OCR) this week. A "large number" of the Shadow Board members viewed a 25bps to 5.50% as "warranted". But "the rest" recommended to hold at 5.25%.
This discord was extended to future projections, as NZIER noted a divergence of opinion regarding where OCR should stand in twelve months.
The Shadow Board acknowledged several recent economic developments that indicated a slowing pace in New Zealand economy, including weaker government tax revenue, decreased consumer spending, and ongoing declines in business profitability.
However, members also recognized potential inflation risks from rising net migration inflows and any new fiscal stimulus in the new Budget.
Fed’s Kashkari: Skipping a meeting is different from “we’re done”
Minneapolis Fed President Neel Kashkari, in an interview with Wall Street Journal, suggested that Fed could afford to adopt a slower pace in its current policy trajectory, while emphasizing that this should not be construed as the end of their monetary tightening efforts.
Expressing his openness to a slower approach, Kashkari stated, "I'm open to the idea that we can move a little bit more slowly from here,". However, he strongly disagreed with any sentiment that suggested the Fed's task was complete. "I would object to any kind of declaration that we're done," he clarified.
Kashkari went on to argue that skipping a meeting to gather more data could be a sensible decision. "If the committee chooses to skip a meeting because we want to get more information, I could make the argument why that makes sense," he explained.
He further distinguished this action from an implied cessation of the Fed's work, saying, "A skip to get more information is very different in my mind than [saying], 'Hey, we think we're done.'"
ECB’s Lagarde:We are not done yet, we are not pausing
In am interview on the Buitenhof TV show, ECB President Christine Lagarde discussed the bank's progress in tackling inflation, but refrained from giving forward guidance on the monetary policy.
Lagarde noted significant strides have been made in controlling inflation and bringing it in line with ECB's target. However, she cautioned that the journey isn't over yet. "I think we covered a large chunk of the journey toward taming inflation and bringing it back to our target," she said.
Despite this progress, she made it clear "We are not done yet, we are not pausing based on the information I have today." And, "inflation outlook is too high and for too long."
When asked about providing forward guidance, Lagarde expressed caution, citing the potential for various unforeseen factors that could disrupt the economic outlook. "So many things can go wrong that we cannot give what we call forward guidance," she said. "I don't have a predetermined number in my mind."
Lagarde also addressed the ongoing US debt ceiling standoff, emphasizing its potential consequences for both the US and the global economy. "If the United States was to default on its debt it would be a catastrophic development for its economy and for the global economy because of the size of the US economy, because of the depth of its financial sector and because of the totally unpredictable situation that they are facing," she explained.
Despite these risks, Lagarde expressed optimism that common sense would prevail among US leaders, thus avoiding a severely negative economic development. "I have trust in the common sense and the civic sense of the leaders to reach an agreement — which otherwise would take us into a very, very negative development," she said.
Forex and Cryptocurrencies Forecast
EUR/USD: Why the Dollar Continues to Rise
We titled our last week's review "Why the Dollar Rose" and detailed the reasons for the strengthening of the American currency. It's fitting to name today's fresh review "Why the Dollar Continues to Rise," and naturally, we will answer this question.
The DXY dollar index has been on the rise for the past two weeks, reaching a mark of 103.485 on May 18. This is the highest it's been since March 2023. This coincides with increasing chances of a new interest rate hike at the upcoming Federal Open Market Committee (FOMC) meeting of the U.S. Federal Reserve on June 14.
A potential U.S. government debt default could have dampened the hawkish sentiment of the American Central Bank. However, firstly, the Federal Reserve has developed a system of measures since 2011 to mitigate the effects of a U.S. default on its obligations. Secondly, and most importantly, it's unlikely they will have to resort to such quantitative easing (QE). President Joe Biden has expressed confidence in reaching a deal with the Republicans. Additionally, the Republican House Speaker, Kevin McCarthy, has confirmed that a vote on the debt ceiling will take place next week.
Markets have responded to this with optimism and confidence that an economic and financial market crisis can be averted. This has boosted not only the dollar but also the S&P500, Dow Jones, and Nasdaq stock indices (noting that such a combination is extremely rare). As a result, the likelihood of raising the key interest rate to 5.5% has reached 33% (the chances were close to 0% at the beginning of May).
Lorie Logan, the president of the Federal Reserve Bank (FRB) of Dallas, and her colleague from St. Louis, James Bullard, are prepared to vote for monetary tightening. Raphael Bostic, the head of the FRB of Atlanta, does not rule out that after a pause in June, the rate could be raised at the July meeting. Neil Kashkari, the president of the FRB of Minneapolis, has also made hawkish statements. He agreed that a banking crisis could be the source of the economic slowdown. However, in his view, the labor market remains quite strong, inflation, although somewhat weakened, still significantly exceeds the target level of 2.0%, so it's too early to talk about easing monetary policy.
EUR/USD fell to a level of 1.0760 on Friday, May 19, after which the decline ceased. This slowdown was aided by a statement from European Central Bank President Christine Lagarde, who said that like the Fed, the ECB "will boldly make the necessary decisions to return inflation to 2%". Clearly, this will require further tightening of credit and monetary policy (QT) and a rate hike, as inflation (CPI) in the Eurozone is reluctant to decrease. Statistics published on Wednesday, March 17, showed that in annual terms it had increased over the month from 6.9% to 7.0%.
Economists from the Canadian investment bank TD Securities (TDS) believe that the deposit rate for the euro will rise from the current 3.25% to 4.00% by September and will be maintained at this level until mid-2024. Accordingly, after a rise of 75 basis points (bps), the key interest rate will reach 4.5%.
The picture of the past week would be incomplete without the final part, aptly titled "Why the Dollar Fell." This happened on the evening of Friday, May 19, thanks to the same Fed. More precisely, its chairman Jerome Powell. Earlier in the day, he stated that inflation was much higher than the target, this created significant difficulties, and therefore it needed to be brought back to 2%. This speech had no impact on market participants as it completely aligned with their expectations. However, in his second speech at the end of the trading week, Powell managed to shock the market. According to him, the recent banking crisis, which led to a tightening of credit standards, has reduced the need for interest rate hikes. "Our rate may not need to rise as much as we would like," Powell said, adding that "the markets have priced in a different rate hike scenario than what the Fed is forecasting."
Following these words, EUR/USD rallied north, closing the past week at a level of 1.0805. As for the near future, as of the evening of May 19, when this review was written, most analysts (55%) expect the dollar to continue strengthening. Northward corrections are expected by 30%, and the remaining 15% have taken a neutral position. Among the oscillators on D1, 100% are coloured red (although a quarter of them are signalling that the pair is oversold). Among the trend indicators, 75% point south, and 25% look north. The nearest support for the pair is located around 1.0740-1.0760, followed by zones and levels of 1.0680-1.0710, 1.0620, and 1.0490-1.0525. Bulls will meet resistance around 1.0820-1.0835, then 1.0865, 1.0895-1.0925, 1.0985, 1.1045, 1.1090-1.1110, 1.1230, 1.1280, and 1.1355-1.1390.
Noteworthy events for the upcoming week include the publication of Germany's business activity (PMI) and business climate (IFO) indices on May 23 and 24, respectively. Also, the minutes of the last FOMC meeting will be released, on Wednesday, May 24. We will know the GDP values of Germany and the US (preliminary) for Q1 2023, as well as data from the US labour market, on Thursday, May 25. To round off the working week, we are expecting data on US core durable goods orders and personal consumption expenditures on Friday, May 26.
GBP/USD: BoE Hints at a Dovish Turn
The plunge on May 11 and 12 resulted in GBP/USD being unable to maintain its position above the strong 1.2500 support level. On the past week of May 18, the pair reached the next, no less significant, support level, but couldn't break through it. After several attempts to drop below 1.2391, the pair reversed and headed north, ending the week at 1.2445.
The economy of the United Kingdom currently, to put it mildly, doesn't look good. Inflation is still measured in double digits. And while general inflation slowed down a bit over the month, dropping from 10.4% to 10.1%, food inflation, on the other hand, is soaring: it has already reached 19.1% and may soon cross into the third decade.
In terms of bankruptcies, the United Kingdom ranked third in the world in March, after Switzerland and Hong Kong. Moreover, the wave of compulsory liquidations could turn into a full-blown tsunami as the Electricity Bill Assistance Program comes to an end. And if the government doesn't extend it, many more businesses will be buried under new bills. The only slightly reassuring thing is that the industry's share of the country's GDP is less than 20%. The service sector, which consumes significantly less energy, contributes about 75% of GDP.
The pound could have been supported by further tightening of the Bank of England's (BoE) monetary policy. However, judging by the recent statements of its leaders, the cycle of rate hikes is coming to an end, with the last increase most likely in June. Deputy Governor of the BoE, Dave Ramsden, speaking before the UK Parliament's Treasury Select Committee, stated that while quantitative tightening (QT) does have some effect on the economy, it is quite insignificant. Another Deputy Governor, Ben Broadbent, announced a reduction in QT volumes to disrupt market liquidity. However, he was only talking about the volumes of bond sales, but overall, the direction of movement is evident.
Commerzbank strategists rightly believe that the BoE's indecision in combating inflation is putting heavy pressure on the pound. Their colleagues from the Internationale Nederlanden Groep (ING) talk about the possibility that if the Bank of England maintained its hawkish stance, GBP/USD could advance to the 1.3300 mark by the end of the year. But will it maintain this stance?
At present, talking about the near-term prospects for the pair, 35% of experts maintain a bullish outlook, 55% prefer bears, and the remaining 10% prefer to abstain from forecasts. Among oscillators on D1, 75% recommend selling (20% are in the oversold zone), 10% are set to buy and 15% are painted in neutral gray. Trend indicators, as a week ago, have a 50% to 50% ratio of forces between red and green. Support levels and zones for the pair are 1.2390-1.2420, 1.2330, 1.2275, 1.2200, 1.2145, 1.2075-1.2085, 1.2000-1,2025, 1.1960, 1.1900-1.1920, 1.1800-1.1840. When the pair moves north, it will meet resistance at the levels of 1.2480, 1.2510, 1.2540, 1.2570, 1.2610-1.2635, 1.2675-1.2700, 1.2820 and 1.2940.
Key events for the coming week in the calendar include Tuesday, May 23, when preliminary business activity (PMI) data will arrive from various sectors of the UK economy. The next day will reveal the value of one of the main indicators of inflation levels, the Consumer Price Index (CPI) in the country, followed by two speeches by the Bank of England's head, Andrew Bailey. Finally, the volume of retail sales in the UK will be disclosed on Friday, May 26.
USD/JPY: The Yen Gets Knocked Down
In April, the yen was the worst currency in the DXY basket. On ultra-dovish statements from the new Bank of Japan (BoJ) Governor Kazuo Ueda, USD/JPY soared to a height of 137.77 by May 2. After that, the banking crisis in the United States came to the aid of the yen, playing the role of a safe haven, and the pair turned downwards. But not for long…
Ueda once again struck at the national currency, commenting on Japanese inflation data. He stated that "the current inflation increase is due to external factors and rising costs, not a strengthening of demand", that "inflation in Japan is likely to slow to below 2% in the middle of the current fiscal year" and that "tightening monetary policy would harm the economy". The yen was also undermined by the GDP data for Japan published on May 17. If the country's economy fell in the third and fourth quarters of 2022, then in the first quarter of 2023, it showed an increase of 1.6% YoY.
So, if inflation falls even below 2.0% by the middle of the year, and GDP grows, why should the central bank change anything in its monetary policy and raise the interest rate? Let it stay at the previous negative level of -0.1%. That's exactly what the market participants thought, sending the yen into the abyss, and USD/JPY into flight. As a result, it updated a six-month high, reaching the height of 138.74 on May 18. The speech by the Fed Chair on the evening of Friday, May 19, slightly weakened the dollar, and the end of the week the pair met at the level of 137.93.
Of course, this flight would not have been possible without a strengthening dollar and U.S. Treasury bonds. It is known that there is traditionally a direct correlation between ten-year treasuries and USD/JPY. If the yield on securities goes up, so does the pair. And last week, against the backdrop of the hawkish mood of the Fed, the yield rose by 8%. Another piece of not very pleasant news for the Japanese currency is that SWIFT data showed that in April, the use of the dollar in cross-border payments increased from 41.74% to 42.71%, while the share of the yen, on the contrary, fell from 4.78% to 3.51%.
Regarding the near-term prospects for USD/JPY, the votes of analysts are distributed as follows. At the moment, 35% of analysts vote for the strengthening of the Japanese currency. 45% of experts expect a continuation of the flight to the Moon, 20% remain neutral. Among the indicators on D1, the absolute advantage is on the side of the dollar: 100% of trend indicators and oscillators point north (although among the latter 20% signal the pair is overbought). The nearest support level is in the 137.30-137.50 zone, followed by levels and zones at 136.70, 135.95-136.30, 134.85-135.15, 134.40, 133.60, 132.80-133.00, 132.00, 131.25, 130.50-130.60, 129.65, 128.00-128.15 and 127.20. The nearest resistance is 138.30-138.75, then the bulls will need to overcome barriers at levels 139.05, 139.60, 140.60, 142.25, 143.50 and 144.90-145.10.
There is no significant economic information related to the Japanese economy expected to be released in the upcoming week.
CRYPTOCURRENCIES: Bitcoin Has No Intention of Retreating
Bitcoin has been under pressure from sellers for the ninth consecutive week. However, despite the difficulty, it manages to hold on, relying on strong support in the $26,500 zone, preventing it from falling to $25,000 and lower. The bearish attack attempt on Friday, May 12, was unsuccessful: after dropping to $25,800, BTC/USD reversed course and reached a local high of $27,656 on May 15. According to some experts, investors seem willing to buy. However, there are no triggers for a bullish impulse. Market participants are focused on the prospects of a US debt default on June 1, which is causing them to refrain from any significant activity. At the same time, there is an atypical situation where both the Dollar Index (DXY) and stock indices are rising simultaneously. This preservation of investor risk appetite undoubtedly provided support to the cryptocurrency market.
According to a survey conducted by Bloomberg, in the event of a default, 7.8% of professional investors and 11.3% of retail investors will choose the first cryptocurrency as a safe haven, while 7.8% and 10.2% will rely on the US dollar, respectively.
Gold remains in the first place on the list of safe-haven assets. Even though the price of the precious metal is currently near its historical high ($2,000 per ounce), it was chosen by about half of the surveyed investors from both categories. The Bloomberg report highlights the existing deficit of alternative assets to hedge against gold.
US Treasury bills became the second most popular asset (purchased by 14-15% of respondents). Bloomberg journalists see some irony in this, as these debt instruments may potentially default. Bitcoin comes in third place, slightly behind the dollar, followed by the Japanese yen and the Swiss franc.
The debates in the US Congress regarding the debt ceiling were relatively lacklustre last week. Influencers' statements on the ceiling (and the "bottom") for bitcoin were equally sluggish and uncertain. For example, venture billionaire Chamath Palihapitiya stated that, on one hand, the devaluation of the dollar certainly stimulates the US economy, and the dominant position of the dollar in the global economy remains undisputed. However, on the other hand, he believes that in the long term, the US government is likely to face currency devaluation, and therefore, it is advisable to invest in risky assets such as stocks and cryptocurrencies.
Paul Tudor Jones, the head of hedge fund Tudor Investment Corporation, who has always been a proponent of investing in bitcoin, has now stated that the leading cryptocurrency has become less attractive in the current regulatory and economic situation. He noted that bitcoin is currently facing real problems because the entire regulatory apparatus in the United States is against cryptocurrencies. Furthermore, the billionaire expects a decrease in inflation in the US, which makes hedging assets less appealing. Bitcoin is often perceived as an asset for protection against inflation.
Paul Tudor Jones himself continues to hold a small amount of bitcoin and has no intention of selling the cryptocurrency even in the distant future. However, it appears that he has abandoned his previous plans to invest up to 5% of his wealth in BTC. Perhaps he has decided to wait out these uncertain times.
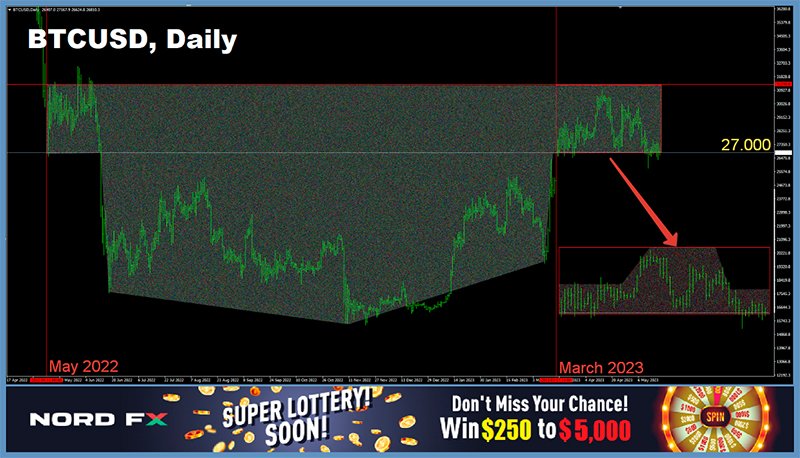
Mark Yusko, the founder and CEO of cryptocurrency hedge fund Morgan Creek Digital, has reiterated his prediction of an inevitable bull rally in the digital asset market. He believes that the "crypto summer" is likely to begin in mid-June. According to him, bitcoin could already make a significant breakthrough as a technical reversal pattern is forming on the chart. "If you look at the chart [starting from May 2022], you'll see that it's a beautiful inverted head and shoulders pattern at the $27,000 level," Yusko writes. "It's a really interesting technical pattern. And you know, I think we need some good news to give it a boost." (Regarding the need for good news, one can only agree with Mark Yusko. However, if you look at the chart starting from March 17-18, 2023, the head and shoulders pattern would point in the opposite direction).
Glassnode, too, anticipates the arrival of the first summer month. "We are confident in our medium-term target of $35,000 as external pressures ease. The Federal Reserve will pause its interest rate hike in June [...] - optimal for upward movement [of bitcoin] throughout the summer. The dollar index has crossed below a significant moving average - explosive movements are ahead," analysts from the agency explain.
Even though summer is approaching, it has not yet arrived. As of the evening of Friday, May 19, BTC/USD is currently trading at $26,850. The total market capitalization of the crypto market stands at $1.126 trillion ($1.108 trillion a week ago). The Crypto Fear & Greed Index has remained relatively unchanged over the past seven days and is in the Neutral zone at 48 points (49 points a week ago).
And to conclude the review, in order to liven up the tranquil state of the crypto market, let's discuss a sensation. Debates have ignited online regarding the first purchase made with BTC. It turns out that the legendary pizza may not have been the actual first purchase. It has been discovered that in 2010, a user named Sabunir attempted to sell a JPEG image for 500 bitcoins, which was worth about $1 at the time. As evidence, a screenshot indicating the date of January 24, 2010, has been presented, which is four months prior to Laszlo Hanyecz's famous pizza purchase of 10,000 BTC. It is also claimed that a user named Satoshi Nakamoto even attempted to participate in the buying/selling process.
However, doubts remained as to whether it was merely an attempted sale or if the transaction actually took place. To dispel the doubt, Matt Lohstroh, co-founder of Gige Energy, conducted his own investigation. According to the obtained on-chain data, on January 24, 2010, 500 BTC (equivalent to approximately $13.3 million at the current exchange rate) were indeed received in Sabunir's wallet. This means that the transaction did take place, and therefore, this image is indeed the world's first item purchased with BTC.
So now, instead of celebrating the annual Pizza Day on May 22, will crypto enthusiasts have to mark January 24 as the Day of the JPEG Image? But what about the "Bitcoin Pizza" pizzeria owned by Morgan Creek co-founder Anthony Pompliano? It seems that "JPEG Pizza" doesn't sound quite as appetizing.
Yen Struggled as Global Stock Markets Shone, Kiwi Reigned Supreme
Last week, the financial markets made a dramatic U-turn, as many key global stock indexes recorded substantial gains. Despite underlying concerns, the looming issue of US debt ceiling seems on track to be resolved, thus avoiding a default. US Treasury Secretary Janet Yellen's explicit warnings appear to have had the intended effect.
Simultaneously, NASDAQ's significant gains suggest that investors are betting heavily on a future propelled by generative AI. It is evident that the world is entering an AI era, where massive productivity gains and profit growth come from embracing these transformative technologies.
This optimistic sentiment has overshadowed concerns about protracted policy tightening by major central banks and the prospect of a long-term high-interest-rate environment. Even fears of a potential recession, whether in the US or globally, seem to have been temporarily set aside.
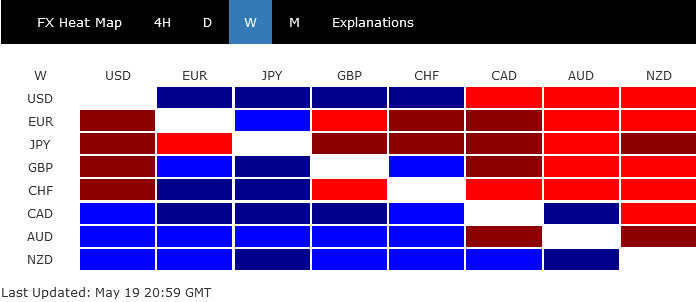
In the forex arena, commodity currencies stole the show as they closed the week on a high note, as the best performers. New Zealand Dollar emerged as a frontrunner, outpacing its counterparts, Canadian and Australian Dollars.
On the flip side, the Japanese Yen found itself on shaky ground, earning the unenviable title of the week's weakest currency. Trailing close behind Yen, European majors had lackluster performance.
Dollar, meanwhile, attempted to uncouple itself from its conventional inverse relationship with risk trends. Despite these efforts, it struggled to sustain any substantial follow-through, indicating the continued influence of global risk sentiment on the currency's performance.
NASDAQ, DAX and Nikkei made impressive gains
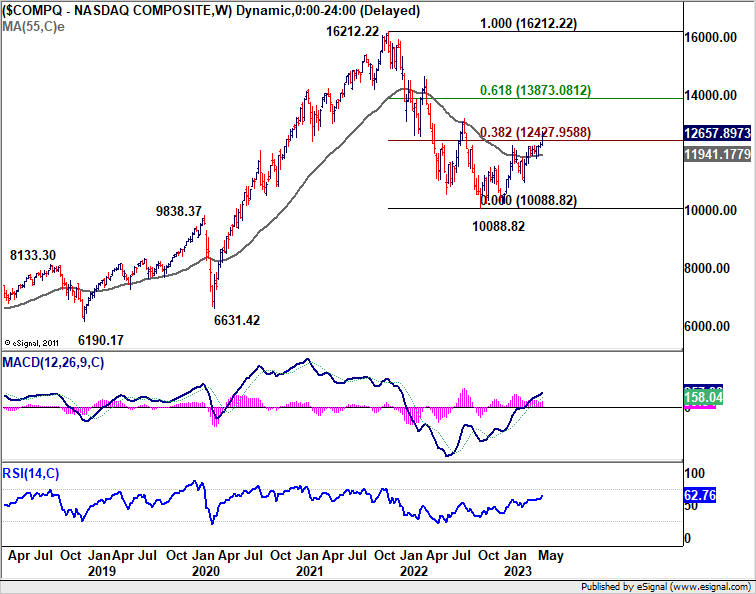
NASDAQ's rally from 10088.82 extended sharply higher last week to close at 12657.89. Near term outlook will stay bullish as long as 12209.57 support holds. Next target is key resistance zone around 13181.08, 50% retracement of 16212.22 to 10088.82 at 13150.52, and 100% projection of 10088.82 to 12269.55 from 10982.80 at 13163.53.
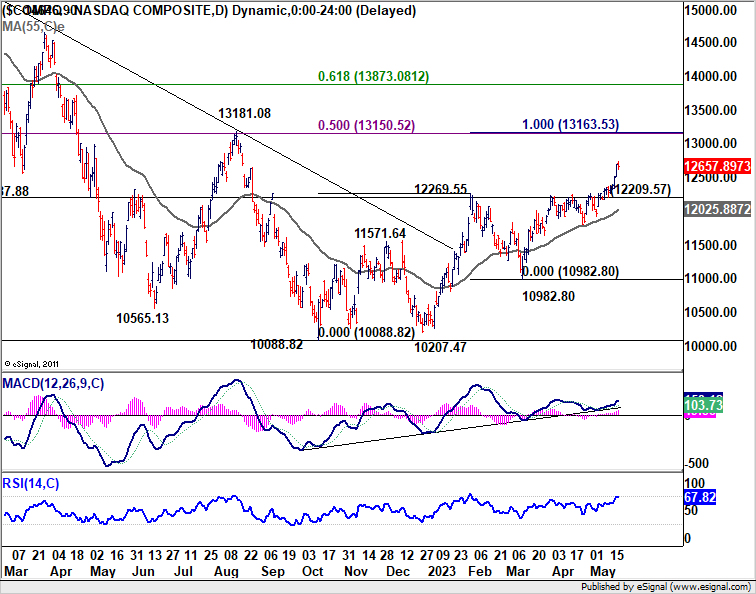
Strong resistance could be seen from this 13150/81 cluster zone to complete the rebound from 10088.82. However, sustained break of this level would carry larger bullish implication, and could prompt further upside acceleration through 61.8% retracement at 13873.08.
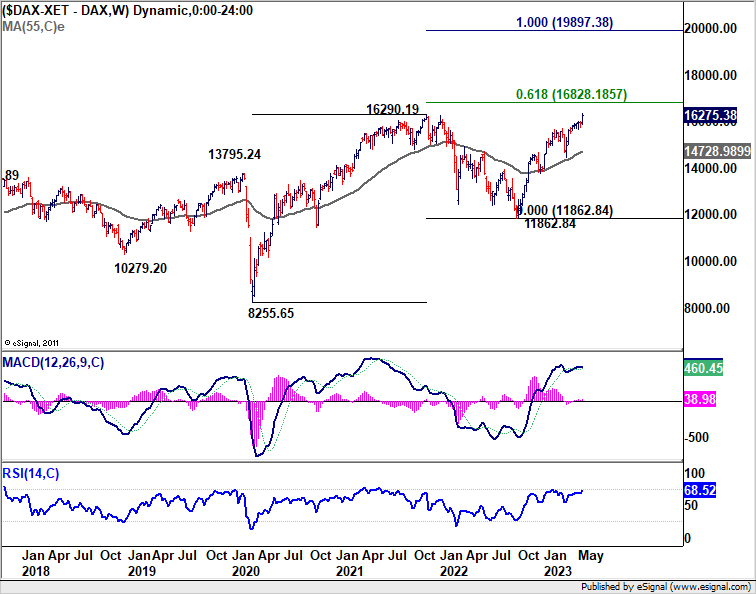
In Europe, Germany's DAX was last week's standout performer, reaching a new record intraday high of 16331.94. It's expected to maintain this bullish stance, with 15754.76 serving as a support level. Next near term target is 61.8% projection of 11862.84 to 15658.56 from 11458.39 at 16804.14. Decisive break there could prompt further upside acceleration to 100% projection at 18301.92 later in the year.
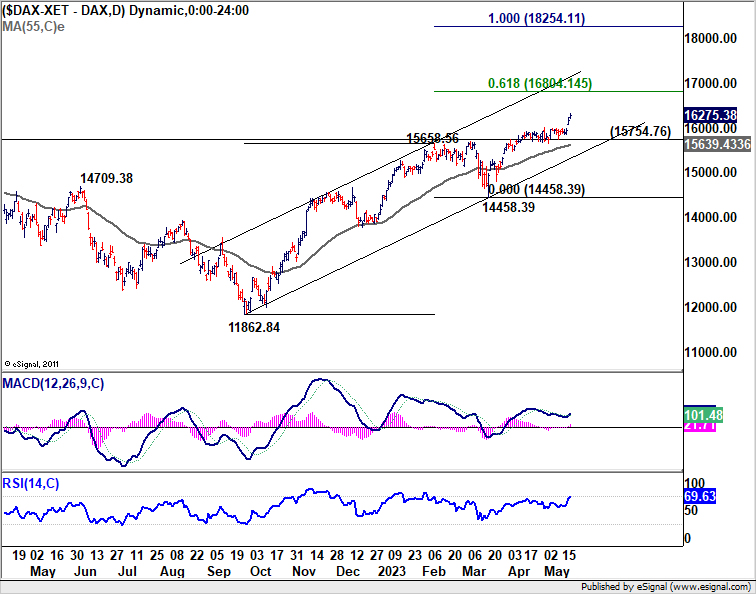
In the larger picture, it should also be noted that 16804.14 is close to 61.8% projection of 8255.65 to 16290.19 from 11862.84 at 16828.18. So, this is really a hurdle to overcome for DAX. Yet, sustained break of this region will also be a strong long term bullish sign.
Over to Japan, Nikkei also hit the highest level in 33 years, driven by a series of strong corporate earnings. Yen's depreciation due to rebound in global treasury yields has also been beneficial. But it could also be argued that the solid risk-on sentiment and selloff in Yen are reinforcing each other's trend.
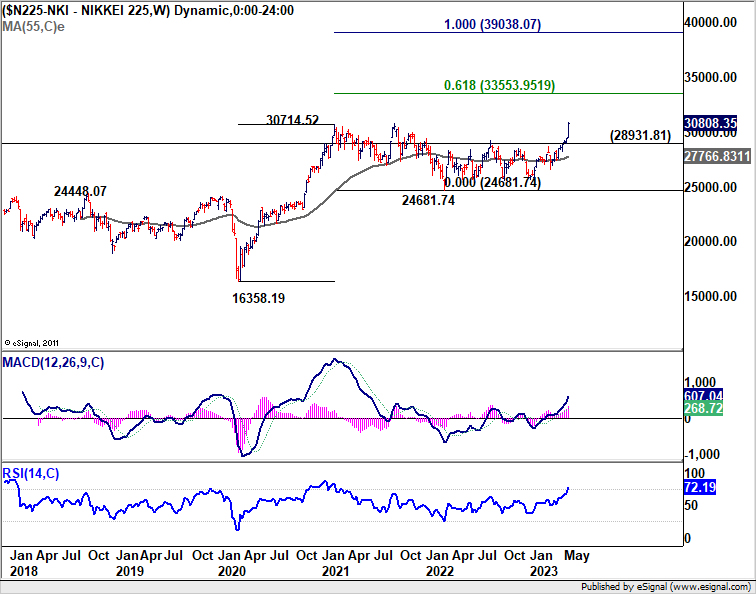
From a medium-term perspective, Nikkei's outlook remains bullish as long as 28931.81 support level holds, with next target set at 61.8% projection of 16358.19 to 30714.52 from 24681.74 at 33553.95.
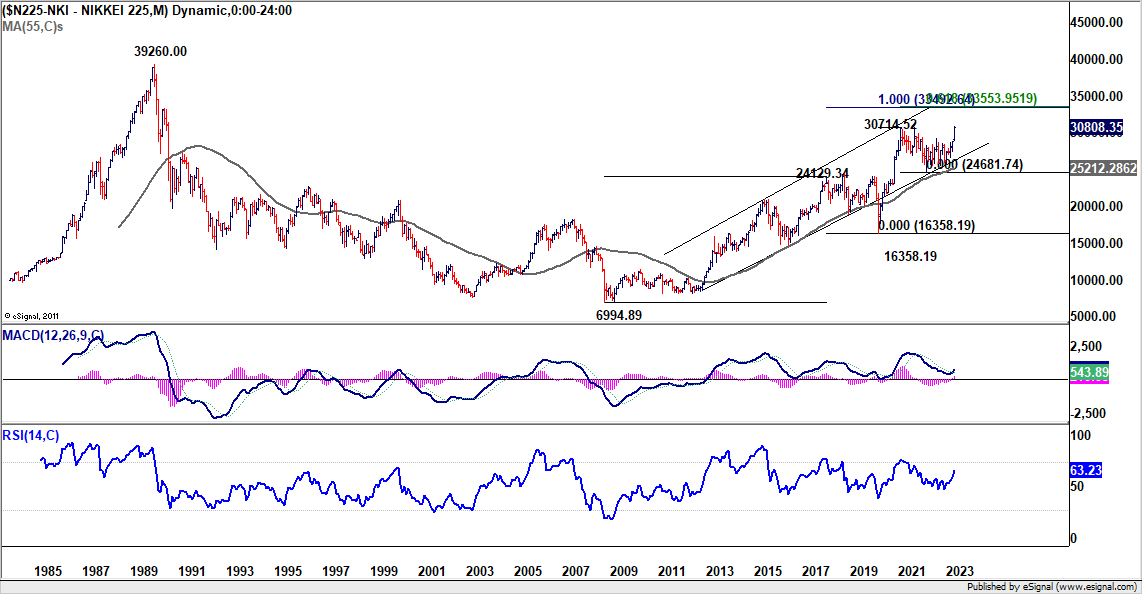
However, it's essential to acknowledge that 33553.95 is close in proximity to 100% projection of 6994.89 to 24129.34 from 16358.19 at 33492.64. Hence, 33500 handle is a key level to overcome for Nikkei, before it's in a position to challenge the record high of 39260 set in 1990.
10-year yield broke 55 D EMA decisively, more upside in favor
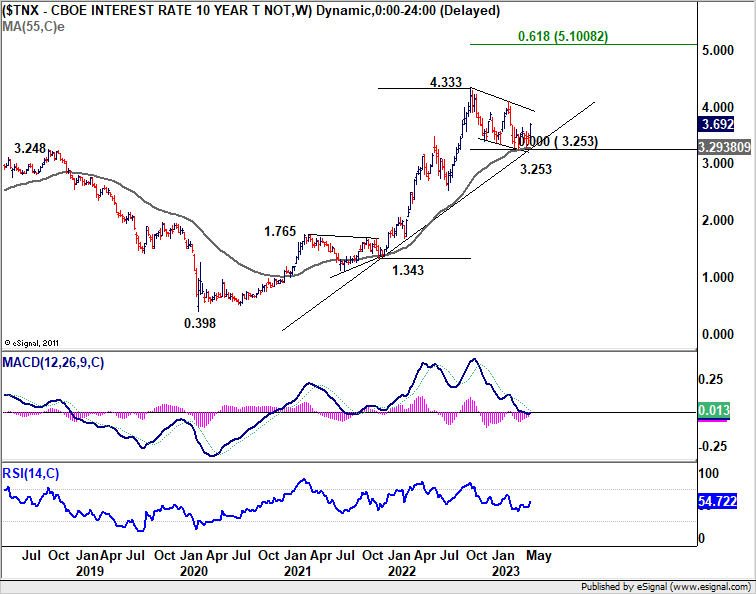
US 10-year yield staged a strong rally last week and took out both 55 D EMA (now at 3.5414) and 3.639 resistance decisively. There is also sign of upside acceleration as seen in D MACD. Further rise is now in favor as long as 55 D EMA holds, towards 4.091 resistance.
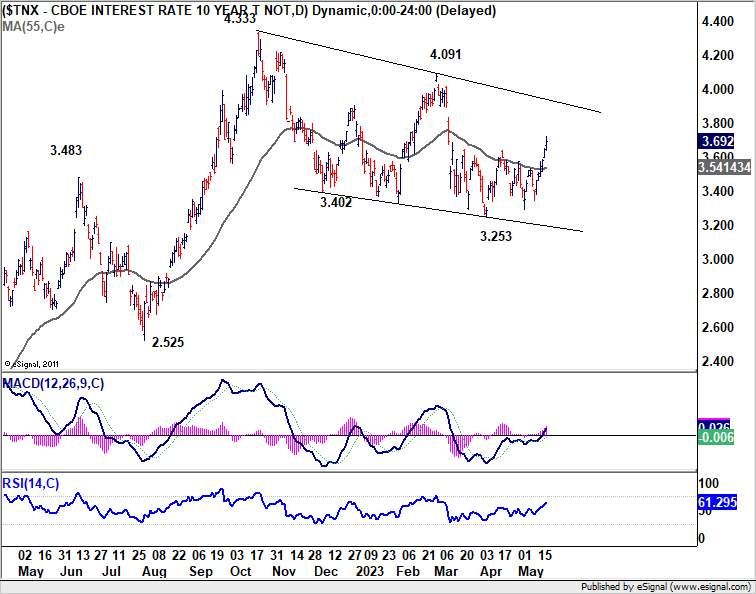
The correction from 4.333 might have completed with three waves down to 3.253, after drawing support from 55 W EMA (now at 3.2938). Sustained break of 4.091 will bolster the case for up trend resumption through 4.333. If realized, that would help lift USD/JPY for a genuine test on 151.93 high.
Dollar index rebounded further in third leg of consolidation pattern
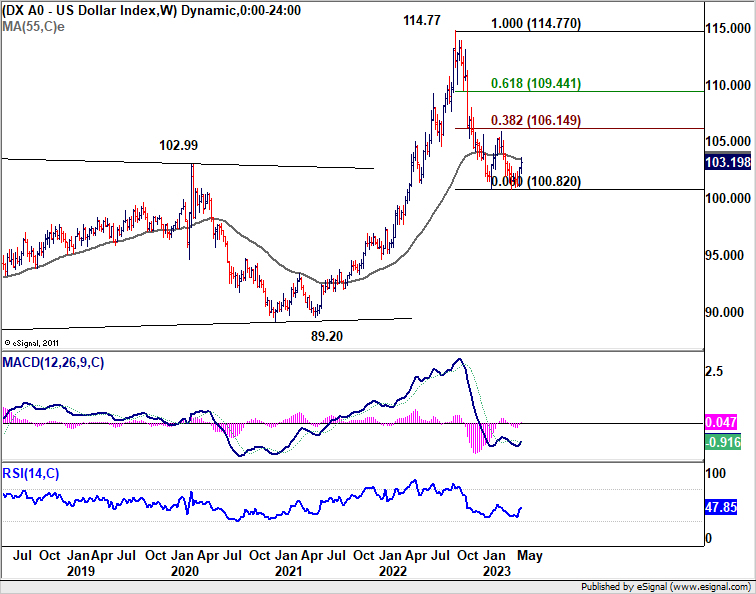
Dollar index surged notably last week and broke decisively through 102.80 resistance. The development should confirm short term bottoming at 100.78, just ahead of 100.82 support. Further rally is now in favor as long as 55 D EMA (now at 102.51) holds, towards 105.88 resistance.
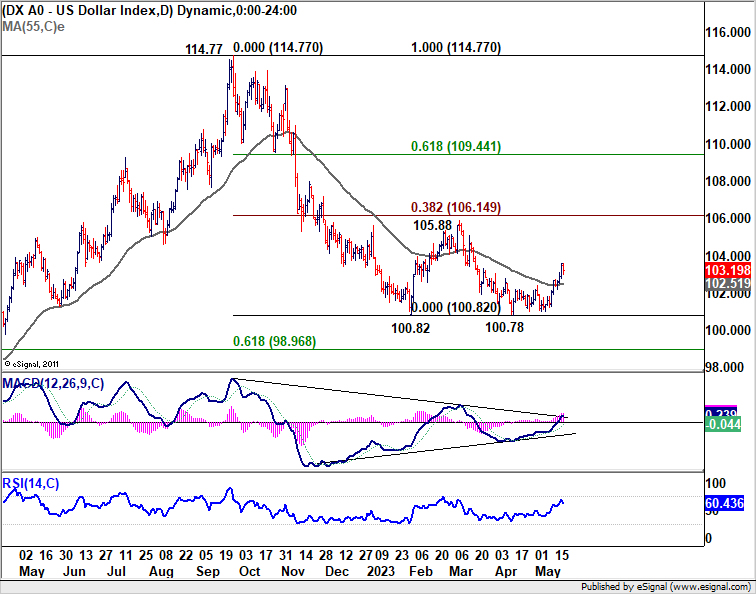
Nevertheless, it should be noted again that even though further rally is expected, bullish trend reversal is not warranted yet. Rise from 100.78 is seen as the third leg of the corrective pattern from 100.82 for now. Hence, strong resistance should be seen from 38.2% retracement of 114.77 to 100.82 at 106.14 to limit upside, at least on first attempt. This view will be maintained unless DXY shows clear sign of upside acceleration.
Kiwi ended as best performer, upside potential on hawkish RBNZ
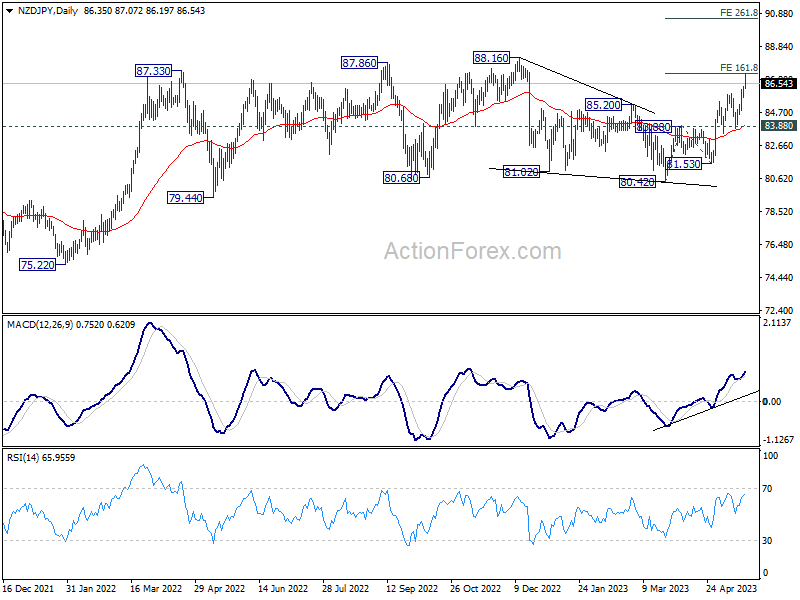
NZD/JPY surged sharply higher as last week's top mover, and just missed 161.8% projection of 80.42 to 83.88 from 81.53 at 87.12. Some volatility is likely in the coming days with RBNZ rate decision featured. Any hawkish surprise there could prompt another round of acceleration through 88.16 high to 261.8% projection at 90.58. Meanwhile, even in case of a pull back, outlook will stay cautiously bullish as long as 83.88 resistance turned support holds.
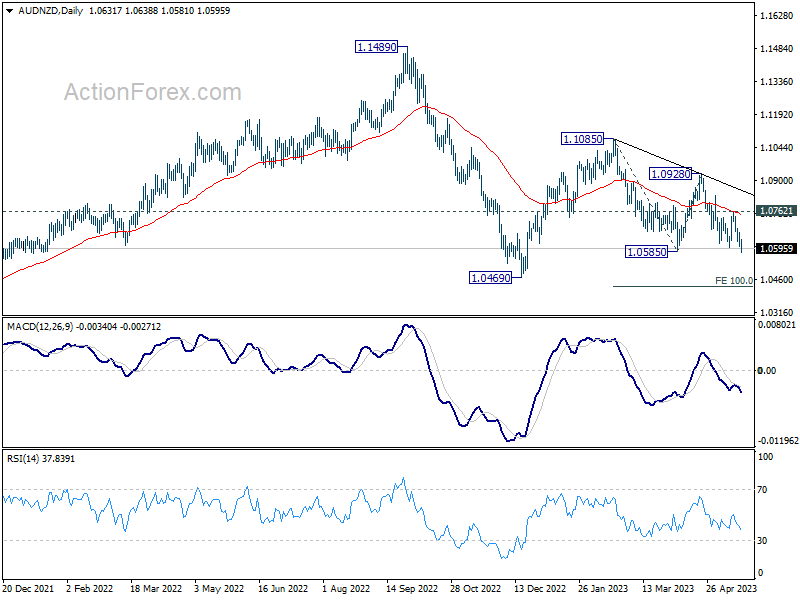
Kiwi also continued to outperform Aussie for the near term. AUD/NZD is set to resume the down trend from 1.1085. Immediate focus is on 1.0585 in the coming days. Decisive break there could trigger downside acceleration even through 1.0469 low to 100% projection of 1.1085 to 1.0585 from 1.0928 at 1.0428. And outlook will stay bearish as long as 1.0762 resistance holds, in case of recovery.
USD/JPY Weekly Outlook
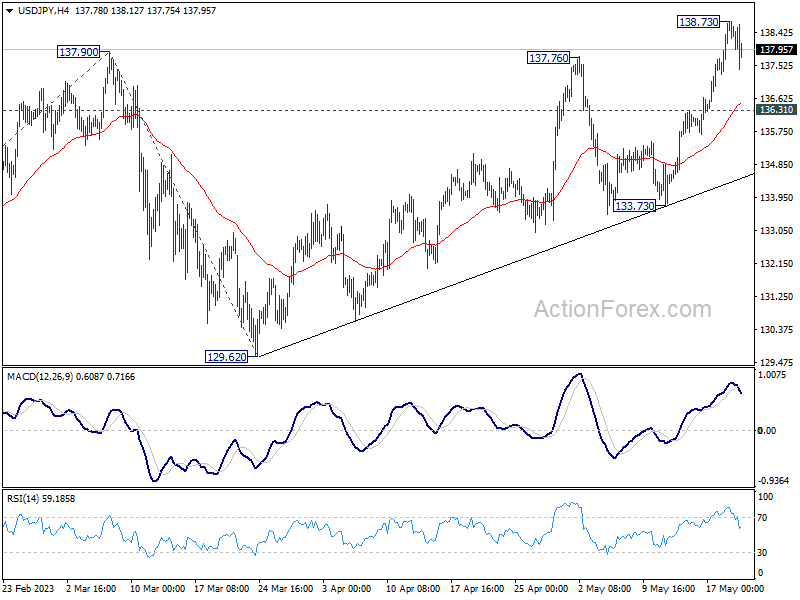
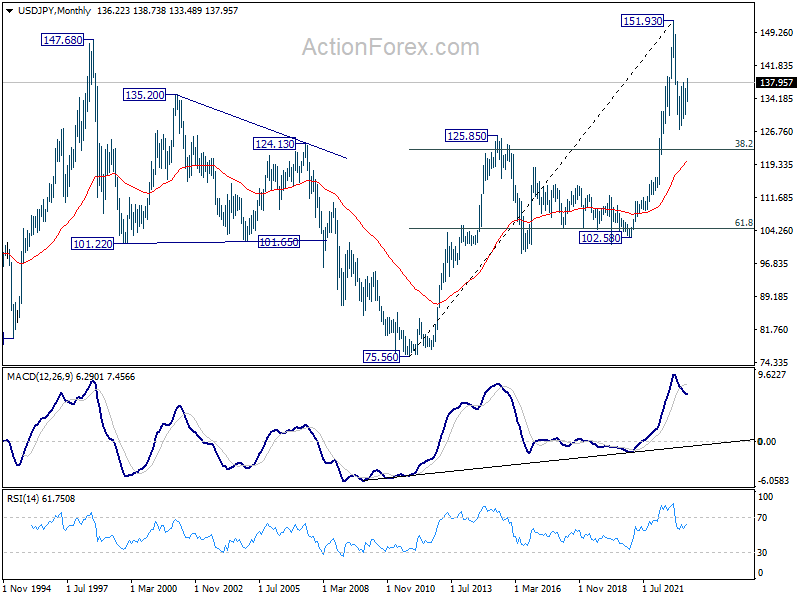
USD/JPY's rise from 127.20 resumed last week by breaking through 137.90 resistance. But as a temporary top was formed at 138.73, initial bias is turned neutral this week first. Downside of retreat should be contained by 136.31 support to bring another rally. Break of 138.73 will turn bias back to the upside for 100% projection of 127.20 to 137.90 from 129.62 at 140.32. Break there will target 142.48 fibonacci level.
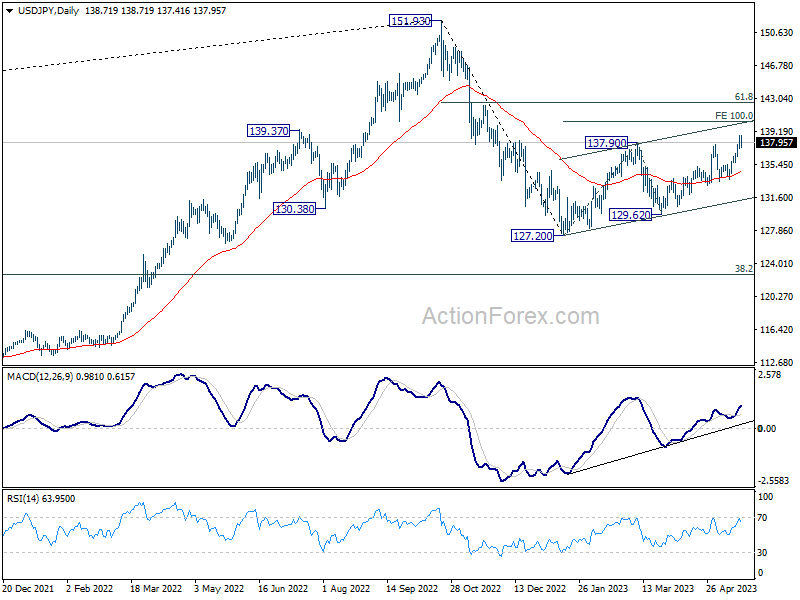
In the bigger picture, rise from 127.20 is seen as the second leg of the corrective pattern from 151.93 high. Stronger rally would be seen to 61.8% retracement of 151.93 to 127.20 at 136.34. Sustained break there will pave the way back to retest 151.93. On the downside, however, break of 133.73 support will argue that the pattern could have started the third leg through 127.20 low.
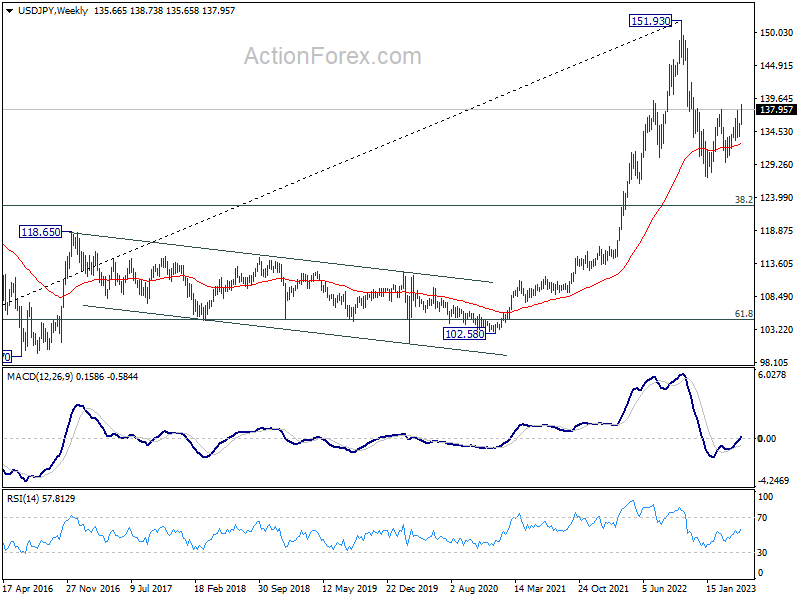
In the long term picture, price action from 151.93 is seen as developing into a corrective pattern to up trend from 75.56 (2011 low). While deeper decline cannot be ruled out, downside should be contained by 38.2% retracement of 75.56 to 151.93 at 122.75.
EUR/USD Weekly Outlook
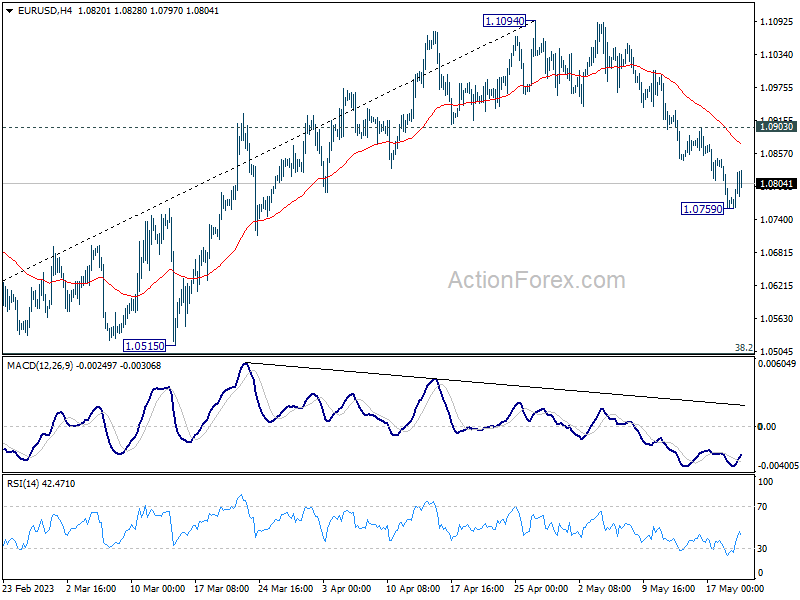
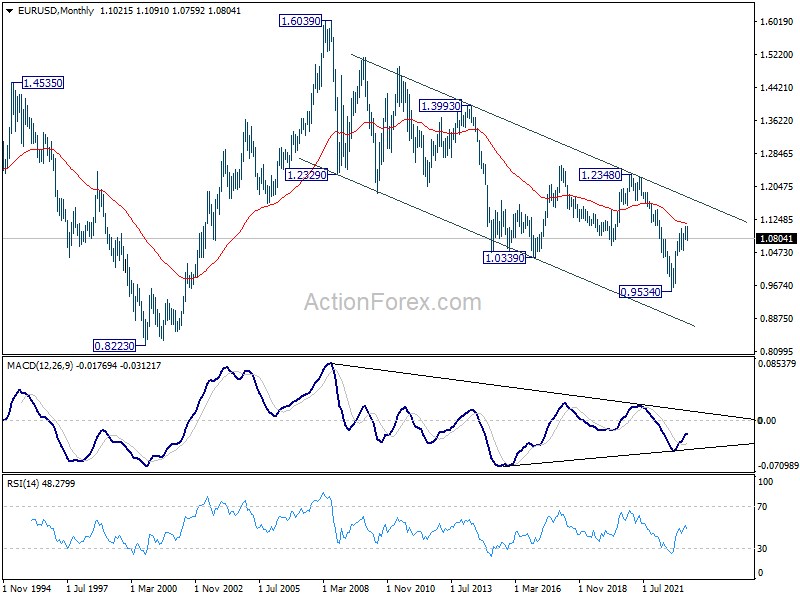
EUR/USD fell further to 1.0759 last week but recovered since then. Initial bias remains neutral this week first. But deeper decline is expected as long as 1.0903 resistance holds. Fall from 1.1094 is seen as correcting whole up trend form 0.9534. Below 1.0759 will target 1.0515 cluster support, 38.2% retracement of 0.9534 to 1.1094 at 1.0498. On the upside, though, firm break of 1.0903 will bring stronger rebound back to retest 1.1094 high instead.
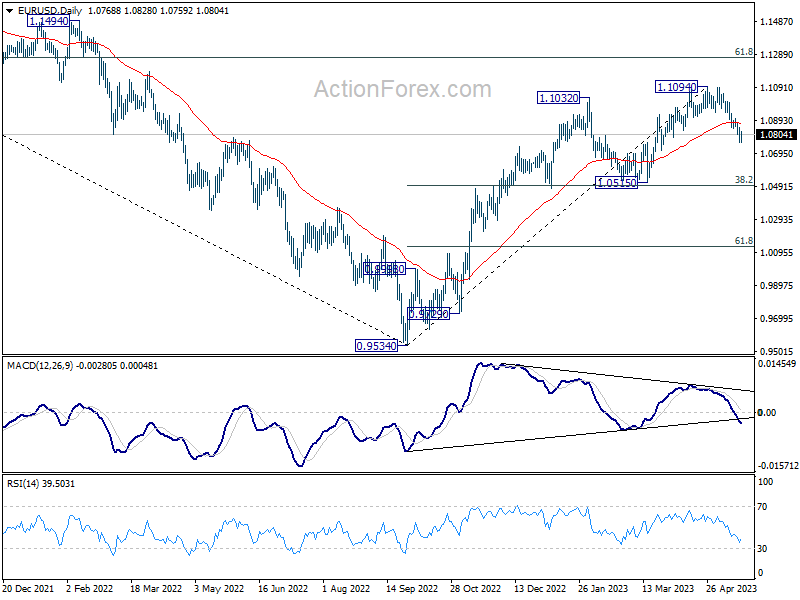
In the bigger picture, as long as 1.0515 support holds, rise from 0.9534 (2022 low) would still extend higher. Sustained break of 61.8% retracement of 1.2348 (2021 high) to 0.9534 at 1.1273 will solidify the case of bullish trend reversal and target 1.2348 resistance next (2021 high).
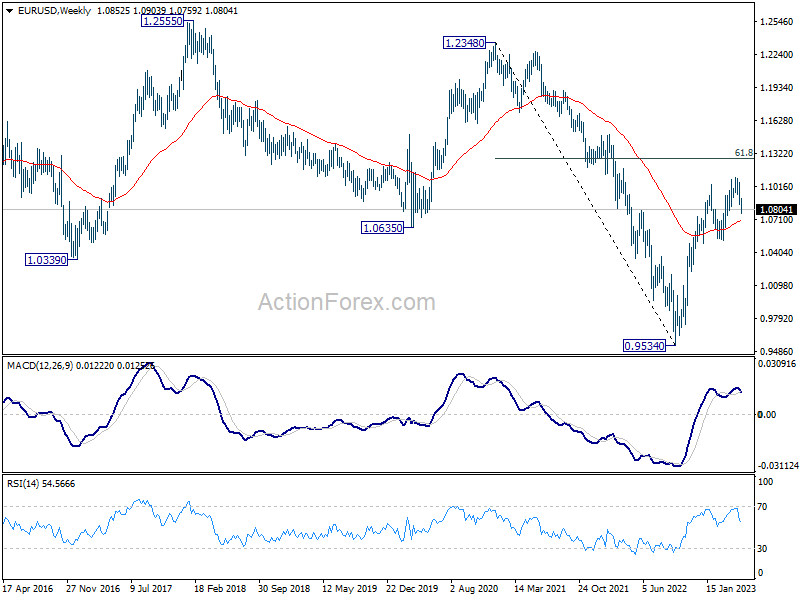
In the long term picture, focus is now on 55 M EMA (now at 1.1156). Rejection by this EMA will revive long term bearishness. However, sustained break above here will be affirm the case of long term bullish reversal and target 1.2348 resistance next.
USD/JPY Weekly Outlook
USD/JPY's rise from 127.20 resumed last week by breaking through 137.90 resistance. But as a temporary top was formed at 138.73, initial bias is turned neutral this week first. Downside of retreat should be contained by 136.31 support to bring another rally. Break of 138.73 will turn bias back to the upside for 100% projection of 127.20 to 137.90 from 129.62 at 140.32. Break there will target 142.48 fibonacci level.
In the bigger picture, rise from 127.20 is seen as the second leg of the corrective pattern from 151.93 high. Stronger rally would be seen to 61.8% retracement of 151.93 to 127.20 at 136.34. Sustained break there will pave the way back to retest 151.93. On the downside, however, break of 133.73 support will argue that the pattern could have started the third leg through 127.20 low.
In the long term picture, price action from 151.93 is seen as developing into a corrective pattern to up trend from 75.56 (2011 low). While deeper decline cannot be ruled out, downside should be contained by 38.2% retracement of 75.56 to 151.93 at 122.75.
GBP/USD Weekly Outlook
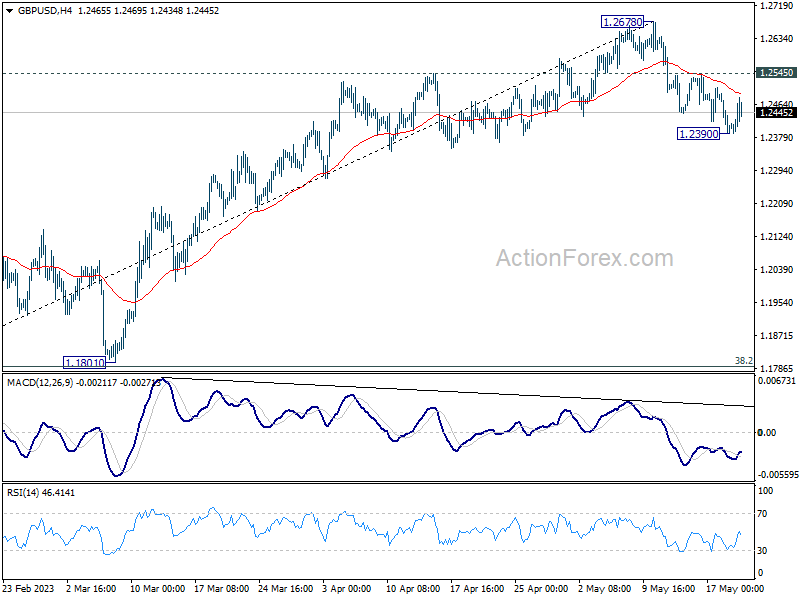
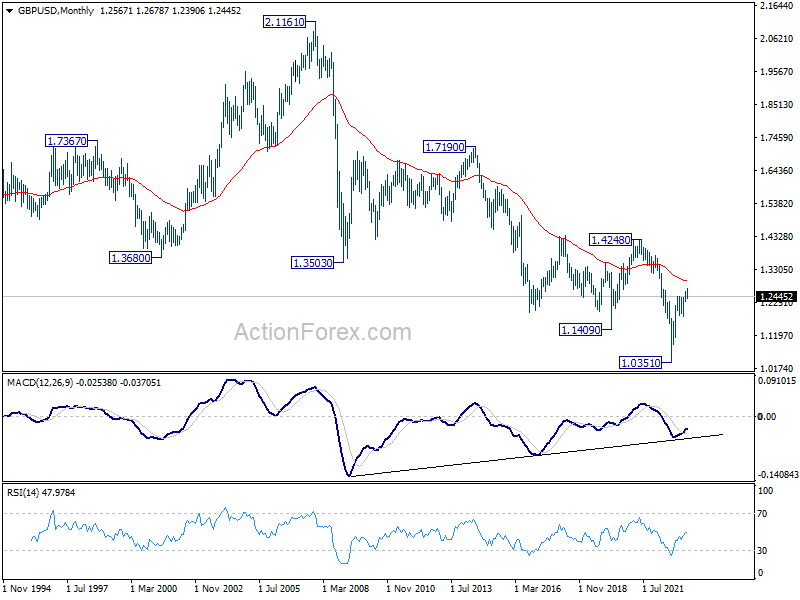
GBP/USD dropped to 1.2390 last week but recovered since then. Initial bias is neutral this week first, but further fall is expected as long as 1.2545 resistance holds. On the downside, sustained trading below 55 D EMA (now at 1.2392) should confirm that it's already in correction to whole up trend form 1.0351. Deeper fall should then be seen to 1.1801 cluster support (38.2% retracement of 1.0351 to 1.2678 at 1.1789). On the upside, however, break of 1.2545 will bring stronger rebound back to retest 1.2678 high.
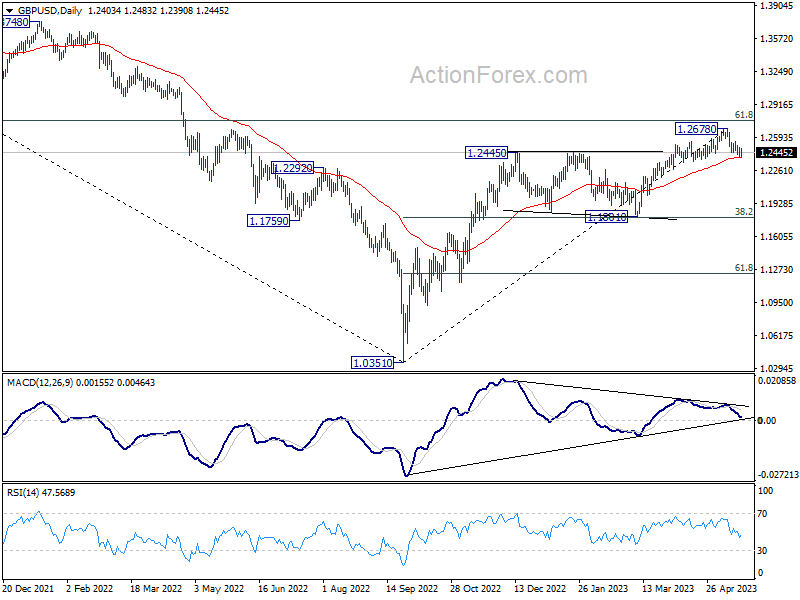
In the bigger picture, as long as 1.1801 support holds, rise from 1.0351 medium term bottom (2022 low) is expected to extend further. Sustained break of 61.8% retracement of 1.4248 (2021 high) to 1.0351 at 1.2759 will add to the case of long term bullish trend reversal. However, firm break of 1.1801 will indicate rejection by 1.2759, and bring deeper decline, even as a correction.
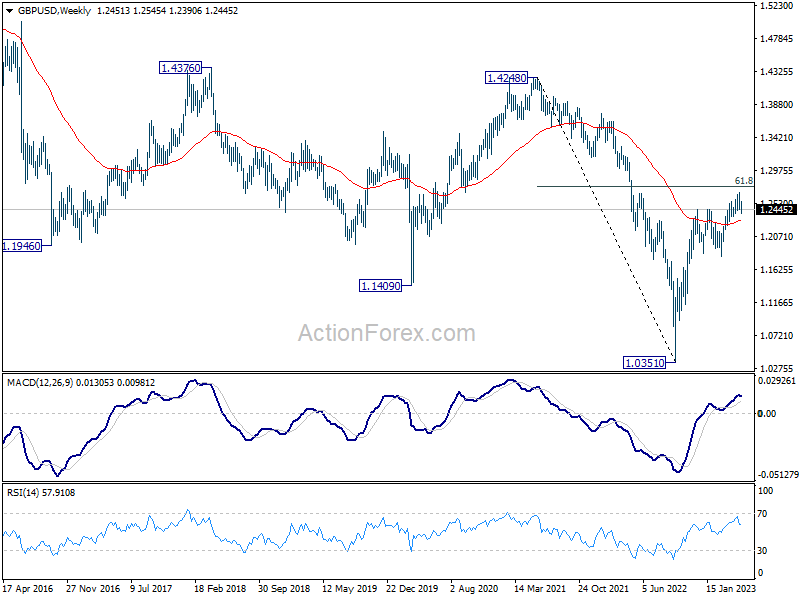
In the long term picture, while the rise from 1.0351 (2022 low) has been strong, there is no clear indicate of long term trend reversal yet. As long as 1.4248 resistance holds (2021 high), long term outlook will remain neutral at best.
USD/CHF Weekly Outlook
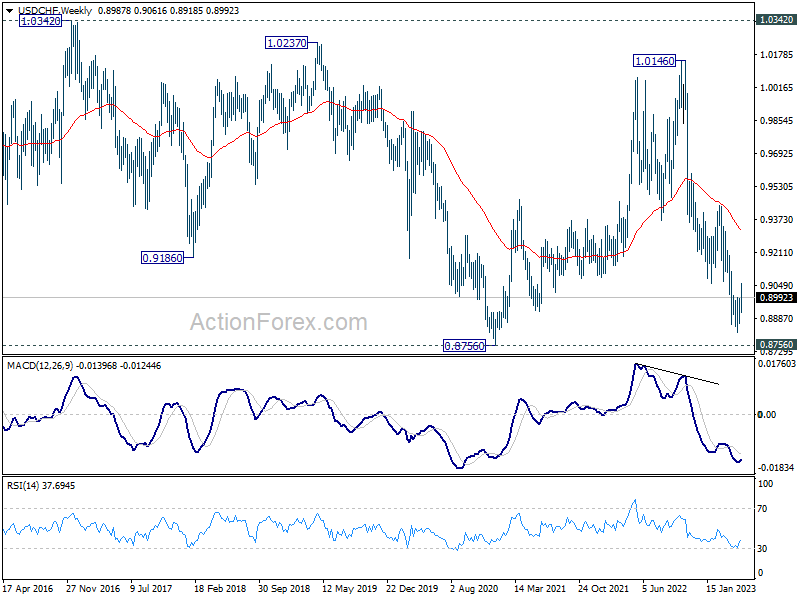
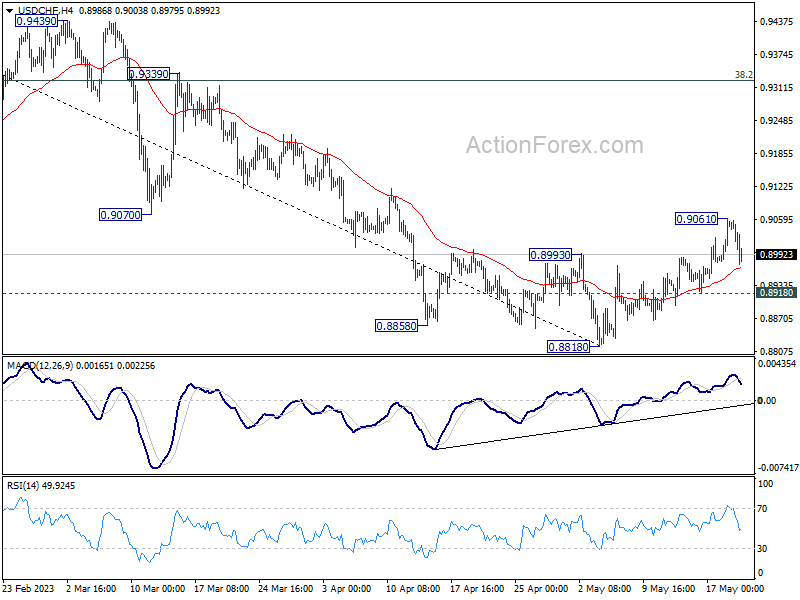
USD/CHF rebounded further to 0.9061 last week but retreated since then. Initial bias stays neutral this week first, but further rally is in favor as long as 0.8918 support holds. On the upside, sustained trading above 55 D EMA (now at 0.9042) should confirm that current rally is at least correcting whole down trend from 1.0146. Further rise should then be seen to 38.2% retracement of 1.0146 to 0.8818 at 0.9325. On the downside, though, break of 0.8918 will bring retest of 0.8818 low instead.
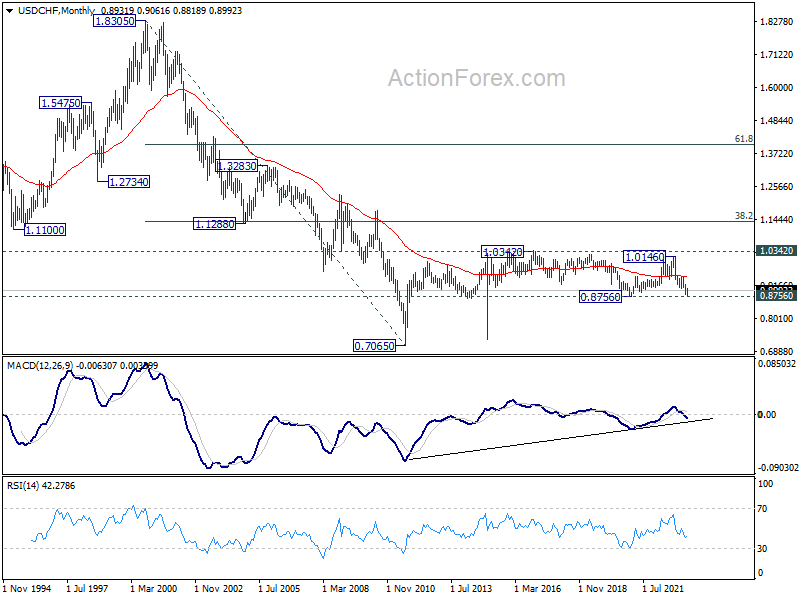
In the bigger picture, fall from 1.1046 (2022 high) is seen as a leg in the long term range pattern from 1.0342 (2016 high). So, downside should be contained by 0.8756 to bring reversal. Sustained break of 0.9058 support turned resistance will be the first sign of medium term bottoming. However, decisive break of 0.8756 will carry larger bearish implications.
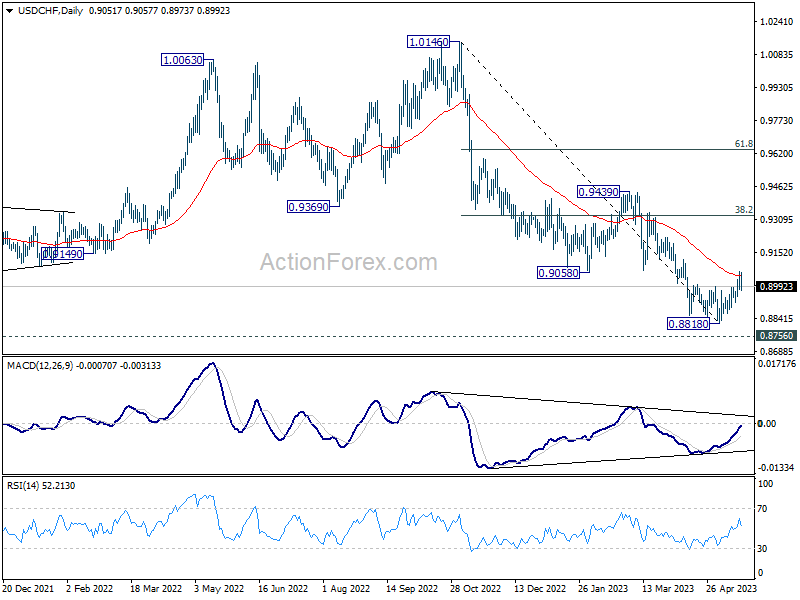
In the long term picture, long term sideway pattern from 1.0342 (2016 high) is expected to continue between 0.8756/1.0342. However, sustained break of 0.8756 will open up deeper fall back towards 0.7065 (2011 low).