Sample Category Title
GBP/USD Mid-Day Outlook
Daily Pivots: (S1) 1.2369; (P) 1.2432; (R1) 1.2471; More...
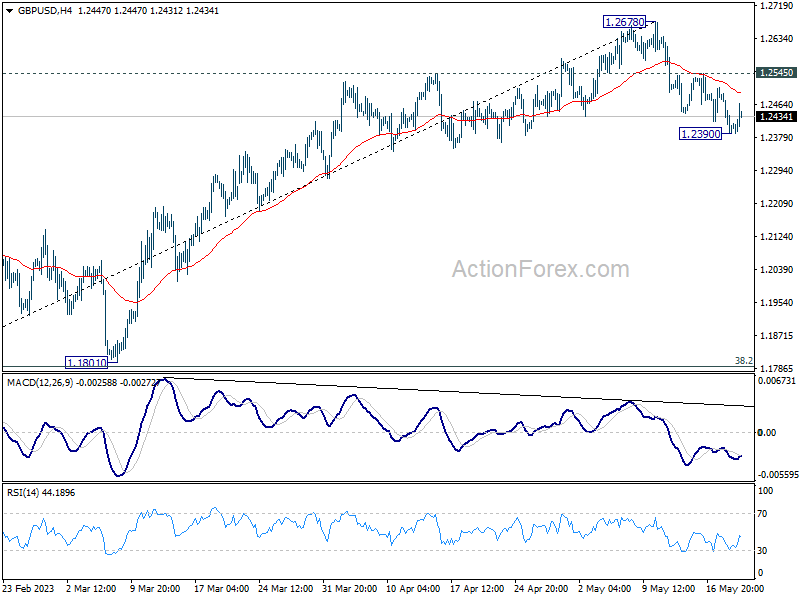
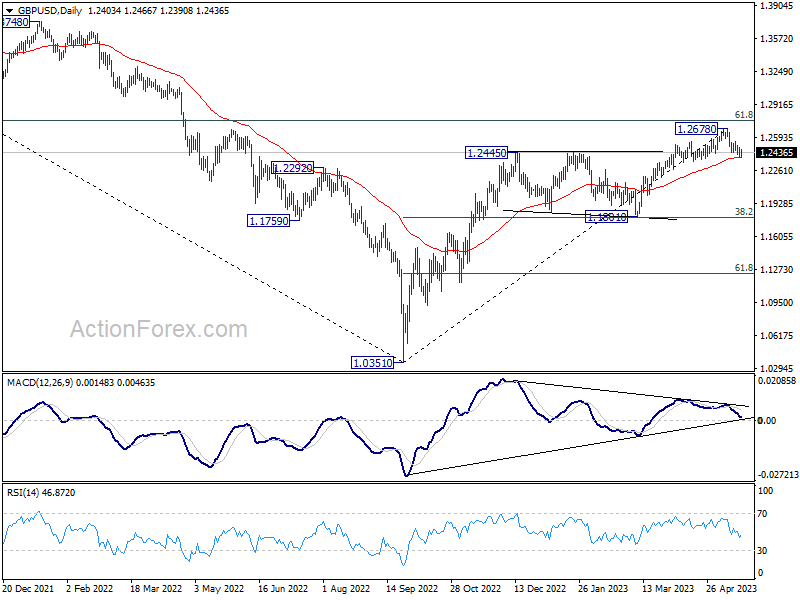
Intraday bias in GBP/USD is turned neutral first with current recovery. Deeper decline is in favor as long as 1.2545 resistance holds. Fall from 1.2678 is seen as correcting whole up trend from 1.0351. Sustained trading below 55 D EMA (now at 1.2392) will affirm this case, and pave the way to 1.1801 cluster support (38.2% retracement of 1.0351 to 1.2678 at 1.1789). On the upside, however, break of 1.2545 will bring stronger rebound back to retest 1.2678 high.
In the bigger picture, as long as 1.1801 support holds, rise from 1.0351 medium term bottom (2022 low) is expected to extend further. Sustained break of 61.8% retracement of 1.4248 (2021 high) to 1.0351 at 1.2759 will add to the case of long term bullish trend reversal. However, firm break of 1.1801 will indicate rejection by 1.2759, and bring deeper decline, even as a correction.
EUR/USD Mid-Day Outlook
Daily Pivots: (S1) 1.0739; (P) 1.0794; (R1) 1.0824; More...
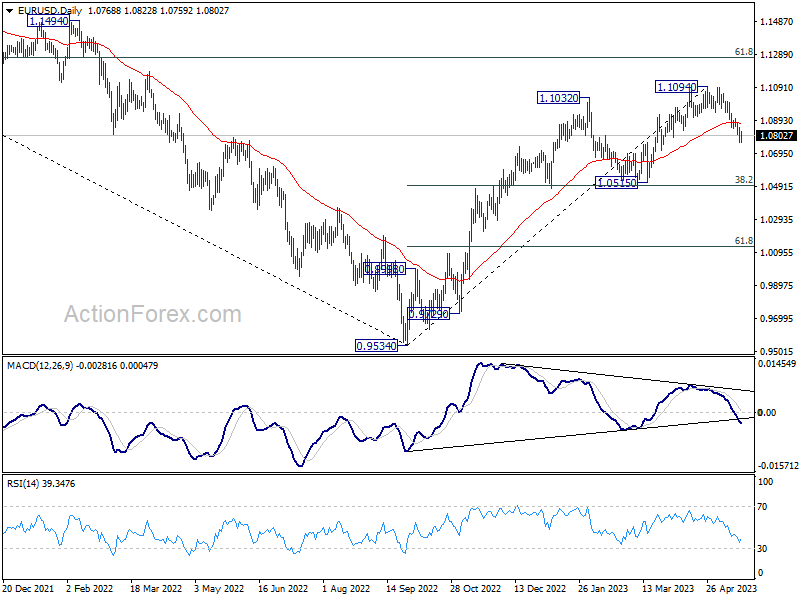
Intraday bias in EUR/USD is turned neutral first with today's recovery. But further decline will remain in favor as long as 1.0903 resistance holds. Fall from 1.1094 is seen as a correction to whole up trend from 0.9534. Below 1.0759 will resume the decline to 1.0515 cluster support, 38.2% retracement of 0.9534 to 1.1094 at 1.0498. On the upside, though, firm break of 1.0903 will bring stronger rebound back to retest 1.1094 high instead.
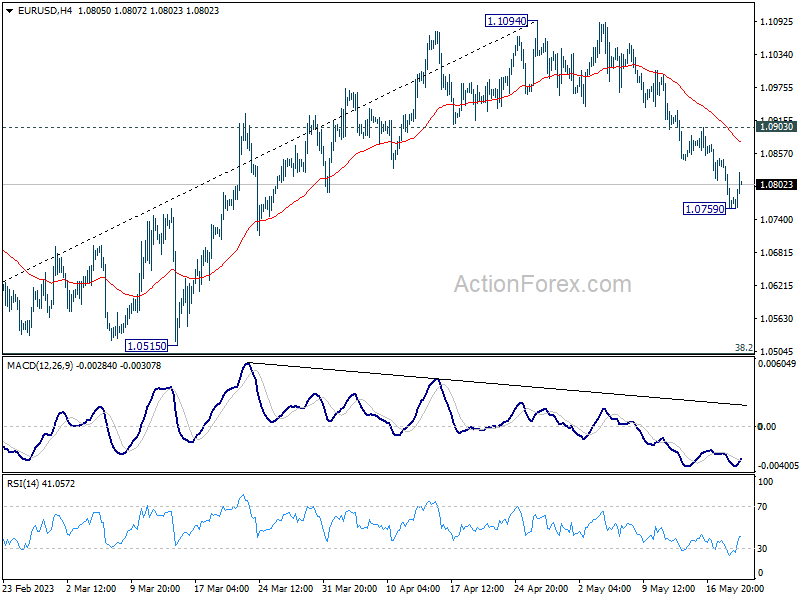
In the bigger picture, as long as 1.0515 support holds, rise from 0.9534 (2022 low) would still extend higher. Sustained break of 61.8% retracement of 1.2348 (2021 high) to 0.9534 at 1.1273 will solidify the case of bullish trend reversal and target 1.2348 resistance next (2021 high).
Dollar and Risk Sentiment Revert to Inverse Relationship as Week Ends
As we wind down the week, dollar seems to have resumed its inverse relationship with risk sentiment. Major European stock indices are trending upwards, with Germany's DAX reaching hitting a new record high. Meanwhile, Euro and other European currencies are registering notable gains against Yen and the greenback. However, these European majors are trailing behind commodity currencies, with New Zealand dollar standing firm as this week's strongest performer.
Earlier today, Yen's brief and weak recovery came to an abrupt halt and selling pressure has once again taken hold. Barring any last-minute changes, the Japanese currency is poised to end the week as the most underperforming currency.
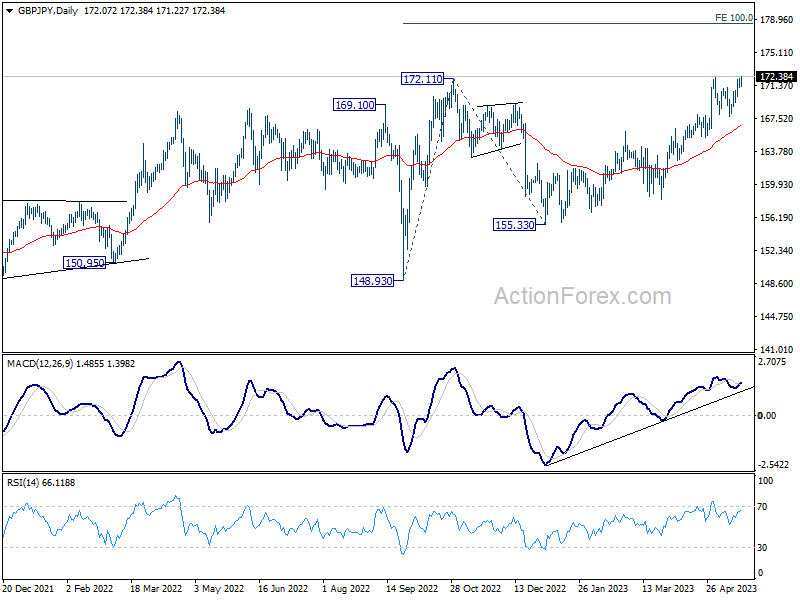
Technically, GBP/JPY's breach of 172.30 resistance today suggests that recent up trend is ready to resume for 100% projection of 148.93 to 172.11 from 155.33 at 178.51. CHF/JPY also looks ready to break through 153.93 towards 161.8% projection of 137.40 to 147.58 from 140.21 at 156.68. The question is when EUR/JPY would follow and break through 151.60 resistance too.
In Europe, at the time of writing, FTSE is up 0.42%. DAX is up 0.74%. CAC is up 0.76%. Germany 10-year yield is up 0.0397 at 2.488. Earlier in Asia, Nikkei rose 0.77%. Hong Kong HSI dropped -1.40%. China Shanghai SSE dropped -0.42%. Singapore Strait Times rose 0.63%. Japan 10-year JGB yield closed up 0.0222 at 0.407.
Canada retail sales down -1.4% mom in March
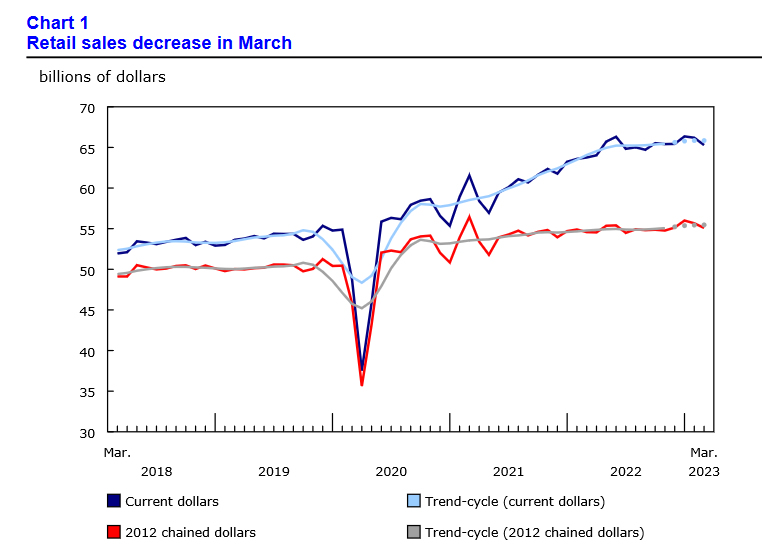
Canada retail sales decreased -1.4% mom to CAD 65.3B in March, slightly worse than expectation of -1.3% mom. Sales decreased in 5 of the 9 subsectors, representing 55.5% of retail trade, led by decreases at motor vehicle and parts dealers (-4.4%) and gasoline stations and fuel vendors (-3.9%). Core retail sales—which exclude gasoline stations and fuel vendors and motor vehicle and parts dealers—increased 0.3% mom. In volume terms, retail sales decreased -1.0% mom.
Advance estimate suggests that sales increased 0.2% mom in April.
BoJ Ueda: It's necessary to continue with monetary easing
BoJ Governor Kazuo Ueda said in a speech today, "At present, it's necessary to continue with monetary easing," as Japan's economy faces risks from slowing global growth and uncertainty on whether wage rises will be sustained.
"The cost of prematurely shifting policy, and nipping the bud towards achieving 2% inflation, is extremely large," Ueda he said. "It's appropriate to take time judging (when to) tweak ultra-easy policy toward a future exit."
Earlier today, Ueda told the parliament that U.S. debt default could trigger market turmoil, and will likely have a huge impact on the global economy. "There's a chance it would cause turmoil in various markets ... and affect a vast array of financial transactions."
"The Bank of Japan will strive to maintain market stability based on its pledge to respond flexibly with an eye on economic, price and financial developments," he said.
Japan CPI core rose back to 3.5% in April, core-core hit 42-yr high
April saw Japanese consumer prices accelerating, with CPI accelerated from 3.2% yoy to 3.5% yoy. That put a halt to the slowdown of headline inflation from 4.3% in January.
Even more significantly, core CPI (which excludes fresh food) rose from 3.1% yoy to 3.4%. This metric has been above BoJ's 2% target for an uninterrupted 13 months, signifying persistent inflationary pressure.
In the realm of core-core CPI, which excludes both fresh food and energy, the increase is even starker, rising from 3.8% yoy to 4.1%. This figure is the highest it has been since September 1981, marking a nearly 42-year peak.
Looking at some details, services inflation increased from 1.5% yoy to 1.7%, the highest in 28 years since 1995 (excluding the impact of sales tax hikes). Durable goods prices soared 9.8% yoy, and food prices accelerated from 8.2% yoy to 9.0%, hitting the highest level in almost 47 years since 1976. Energy prices, however, bucked the trend with a yoy decrease of -4.4% yoy.
Despite these inflationary pressures, there is no clear indication that BoJ is preparing to exit its ultra-loose monetary policy. The bank projected CPI to average 1.8% and core CPI at 2.5% for the current fiscal year, but given the current data, it is likely that these projections will be revised upward in the next release.
New Zealand exports rise 10% yoy with China leading, EU tops 12% imports growth
New Zealand's trade balance in April reported a surplus of NZD 427m, defying expected deficit of NZD -1310m. Both imports and exports experienced significant year-on-year growth, with exports rising 10% yoy (NZD 641m) to NZD 6.8B and imports increasing 12% yoy (NZD 683m) to NZD 6.4B.
In the export sector, notable growth was observed in shipments to China, Australia, and the US. Specifically, total exports to China rose by NZD 259m (16% yoy), to Australia by NZD 67m (10% yoy), and to the US by NZD 109m (17% yoy). However, exports experienced a slight downturn to the EU, falling by NZD -2.2m (-0.4% yoy), and a more substantial drop to Japan, decreasing by NZD -53m (-12% yoy).
On the import side, the European Union led the surge with total imports up by NZD 108m (13% yoy). Imports from the US also experienced growth, with an increase of NZD 46m (7.6% yoy). Conversely, imports from China, Australia, and South Korea all fell, with decreases of NZD -29m (-2.4% yoy), NZD -37m (-5.1% yoy), and NZD -28m (-8.3% yoy) respectively.
EUR/USD Mid-Day Outlook
Daily Pivots: (S1) 1.0739; (P) 1.0794; (R1) 1.0824; More...
Intraday bias in EUR/USD is turned neutral first with today's recovery. But further decline will remain in favor as long as 1.0903 resistance holds. Fall from 1.1094 is seen as a correction to whole up trend from 0.9534. Below 1.0759 will resume the decline to 1.0515 cluster support, 38.2% retracement of 0.9534 to 1.1094 at 1.0498. On the upside, though, firm break of 1.0903 will bring stronger rebound back to retest 1.1094 high instead.
In the bigger picture, as long as 1.0515 support holds, rise from 0.9534 (2022 low) would still extend higher. Sustained break of 61.8% retracement of 1.2348 (2021 high) to 0.9534 at 1.1273 will solidify the case of bullish trend reversal and target 1.2348 resistance next (2021 high).
Economic Indicators Update
| GMT | Ccy | Events | Actual | Forecast | Previous | Revised |
|---|---|---|---|---|---|---|
| 22:45 | NZD | Trade Balance (NZD) Apr | 427M | -1310M | -1273M | -1586M |
| 23:01 | GBP | GfK Consumer Confidence May | -27 | -30 | ||
| 23:30 | JPY | National CPI Y/Y Apr | 3.50% | 3.20% | ||
| 23:30 | JPY | National CPI Core Y/Y Apr | 3.40% | 3.40% | 3.10% | |
| 23:30 | JPY | National CPI Core-core Y/Y Apr | 4.10% | 3.80% | ||
| 04:30 | JPY | Tertiary Industry Index M/M Mar | -1.70% | -0.10% | 0.70% | 1.70% |
| 06:00 | EUR | Germany PPI M/M Apr | 0.30% | -0.50% | -2.60% | -1.40% |
| 06:00 | EUR | Germany PPI Y/Y Apr | 4.10% | 4.00% | 7.50% | 6.70% |
| 08:00 | EUR | ECB Economic Bulletin | ||||
| 12:30 | CAD | Retail Sales M/M Mar | -1.40% | -1.30% | -0.20% | |
| 12:30 | CAD | Retail Sales ex Autos M/M Mar | -0.30% | -0.80% | -0.70% |
Chinese Yuan Moves Have Global Implications
This week, the yuan broke above the 7.0000 handle against the dollar and continued to rise. Generally, the Chinese currency isn't a popular trade because it's officially kept within a trading band. The government allowed that band to drift above the technically and psychologically important level for the first time since late last year.
The weakness in the yuan is seen as another indicator that the expected boom following lifting of covid restrictions has not arrived. The currency initially gained against the dollar back in December because many traders were anticipating the Chinese economy to grow substantially. But, Q1 results have been lackluster, and the latest PMIs show the industrial sector is falling back into contraction. But, this appears to be a more global story.
The dollar is still king
The Chinese Ministry of Finance blamed the latest move in their currency to strength in the dollar. The greenback has been appreciating most of the week despite the ongoing political debate over raising the debt ceiling. While politicians make dire warnings about the US potentially falling into default, no one in the markets actually thinks that's a real possibility. The possibility of economic uncertainty around how the debt ceiling issue is resolved might cause some weakness in the markets, however. Which, in turn, has raised demand for the dollar as a safe-haven.
The other factor is that more and more traders are coming around to the idea that the Fed might raise rates at the next meeting. At the start of the month, the narrative was a broad expectation that the FOMC would pause, but that view has now dropped to just 60%, from 85% just a week ago.
Beyond China
Turning to the inflation issue, a weaker yuan could contribute to lowering costs in most economies. As the largest manufacturing center in the world, the strength of the Chinese currency correlates with the cost of goods imported from China. If the currency weakens, it implies goods made in China become cheaper, which could help filter through to lower consumer prices. That would be particularly relevant for the US in Europe which import more from China.
On the other hand, a weaker yuan means it's more expensive for Chinese firms to buy imported goods, such as from Japan, Australia, New Zealand and Germany. Those economies could feel a pinch if the yuan keeps trending in its current direction. Although the Euro has also weakened in the last few days as traders have speculated the ECB might not be as aggressive at the next meeting. But the latest data suggests that the RBNZ and RBA might be in line for more hikes, which could improve their currencies in the short term at the cost of lower economic performance in the long term.
Hiding a recession
But what could be the biggest worry for most market participants is that a weaker yuan implies weaker demand for Chinese exports. That would be one of the first expected signs of an impending global slowdown, if not outright recession.
Chinese state banks have been buying up yuan on the offshore market in an effort to prop up the currency. While this is in line with the domestic policies of the Chinese government, it means that had the yuan been left to its own, it might have become even weaker. That would be an even bigger sign that global demand was falling and mask a warning sign of just how much of a global recession could be coming.
Canada retail sales down -1.4% mom in March
Canada retail sales decreased -1.4% mom to CAD 65.3B in March, slightly worse than expectation of -1.3% mom. Sales decreased in 5 of the 9 subsectors, representing 55.5% of retail trade, led by decreases at motor vehicle and parts dealers (-4.4%) and gasoline stations and fuel vendors (-3.9%).
Core retail sales—which exclude gasoline stations and fuel vendors and motor vehicle and parts dealers—increased 0.3% mom.
In volume terms, retail sales decreased -1.0% mom.
Advance estimate suggests that sales increased 0.2% mom in April.
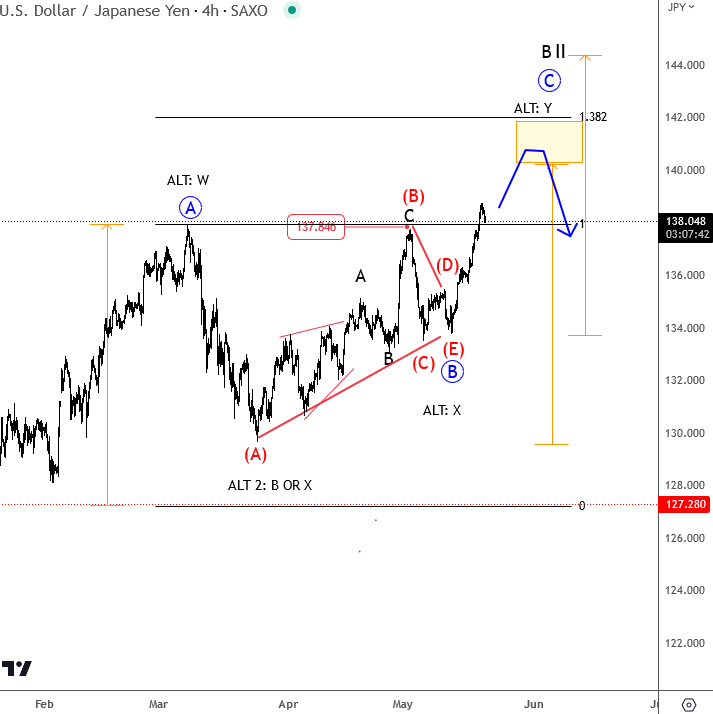
USD/JPY Headed into Big 140-142 Area
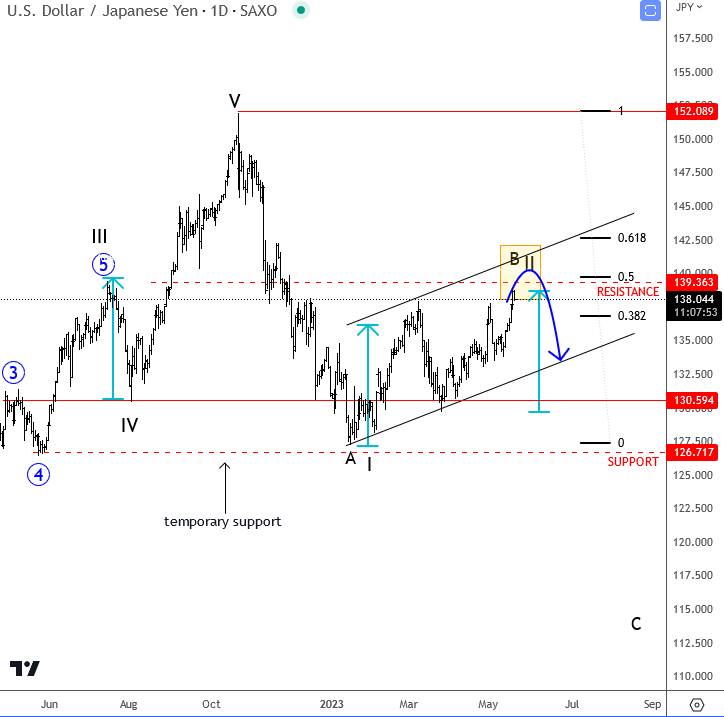
BoJ Ueda is fine with the current policy and he highlighted that they will continue easing with yield curve control. At the same time we have higher US yeilds and higher stocks which are bearish for JPY. As result USDJPY is trading higher.
USDJPY made a sharp reversal in 2022 on a daily chart, and touched 126-130 area after BoJ policy YCC adjustment back in December. However that drop appears completed as we have seen rally in the 4h chart, but it's just another corrective recovery that is still in progress now. Ideally, its going to be an A-B-C move up to 140-142 resistance area where we will expect a bearish turn still this year. Alternatively, this can even be W-X-Y from 127 lows, but still a corrective and temporary higher degree pause for wave B/II.
GBP/USD: Bears to Position for Attack at Key Supports
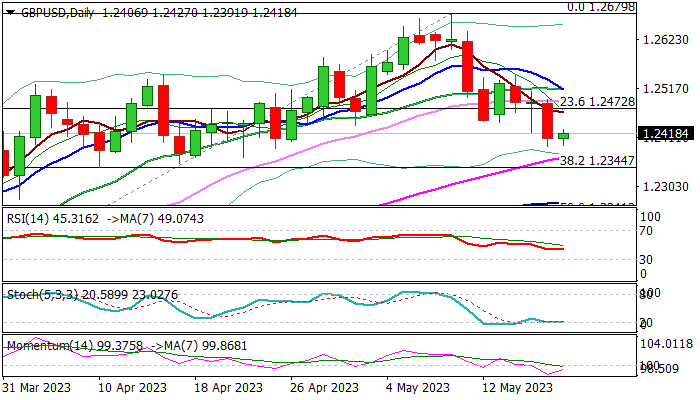
Cable is consolidating after 0.6% drop on Thursday, as bears faced headwinds at 1.2400 zone, prompting some profit-taking.
Upticks seen as price adjustment ahead of fresh push lower and expected to stall under 1.2470 zone (5DMA / broken Fibo 23.6% of 1.1802/1.2679), to offer better levels for attack at strong supports at 1.2344/35 (Fibo 38.2% / top of rising daily cloud).
Bearishly aligned daily studies support scenario as 14-d momentum is still in negative territory and MA’s (5/10/20) formed multiple bear-crosses.
Caution on close above 1.2470, which would weaken bears, but lift through 1.2514 (converged 10/20DMA) is needed to confirm signal and bring bulls back to play.
Res: 1.2444; 1.2470; 1.2514; 1.2546.
Sup: 1.2391; 1.2344; 1.2335; 1.2268.
Will Retail Sales Weigh on Canadian Dollar?
- Canadian retail sales expected to decline
- Fed Chair and two FOMC members will speak later
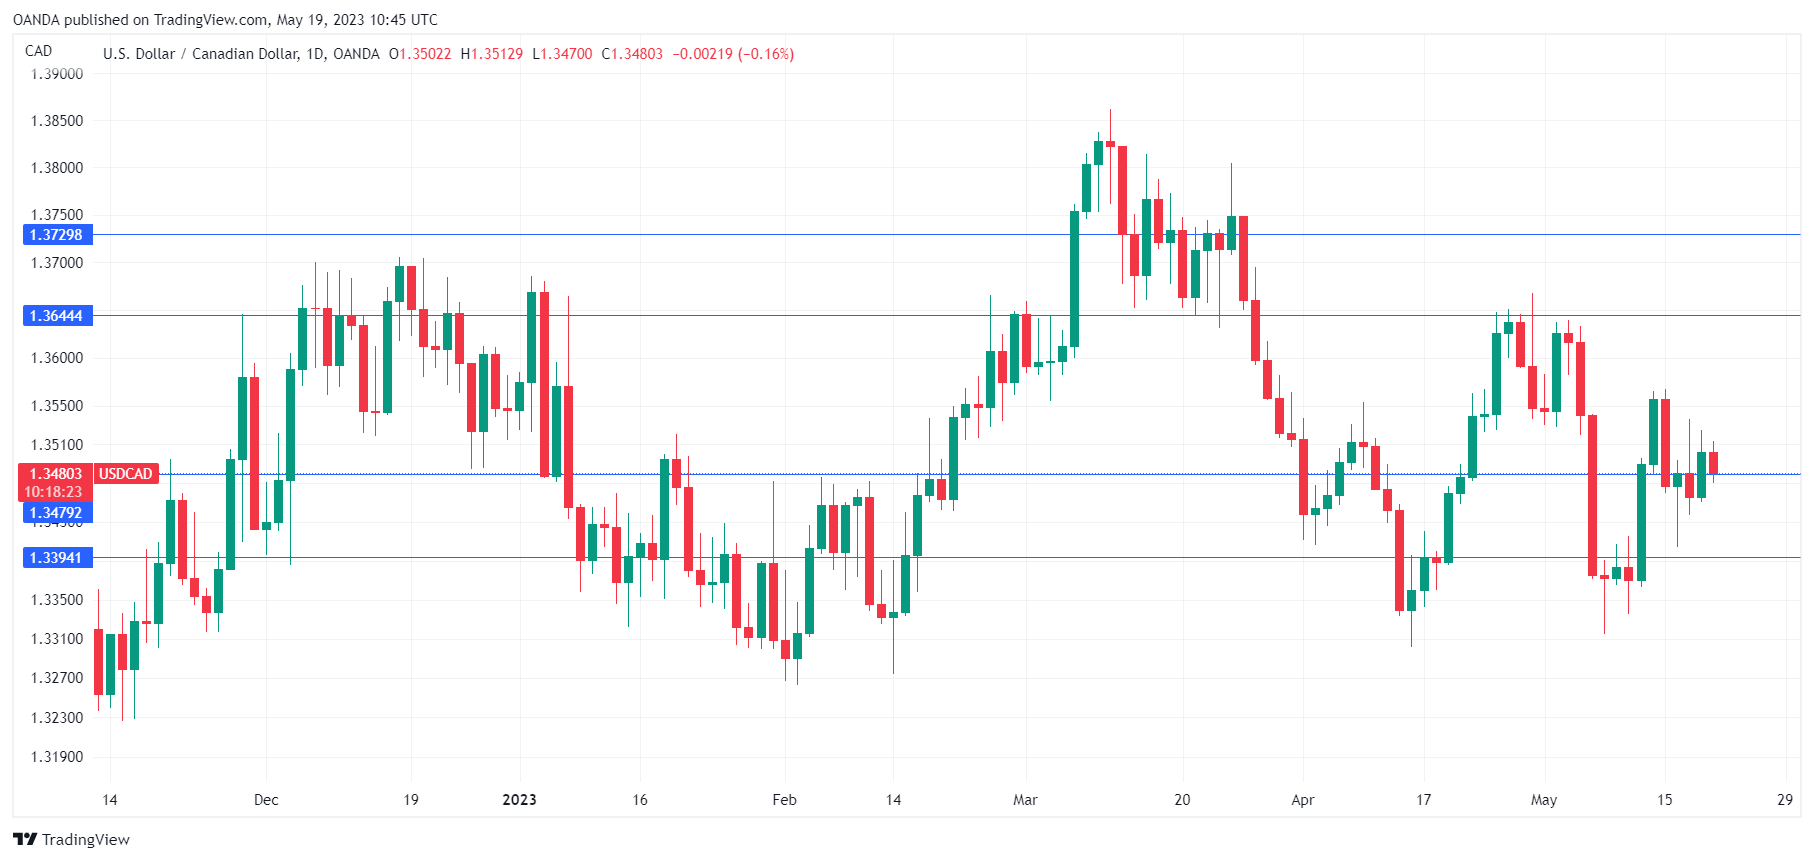
The Canadian dollar is trading quietly ahead of a key retail sales report later today. USD/CAD is trading in Europe at 1.3484, down 0.13%.
Markets brace for soft Canadian retail sales
The Canadian consumer is holding tightly to their wallet, which is not all that surprising in the current economic climate. Inflation ticked higher in April, rising from 4.3% to 4.4%. Add in high interest rates and it’s not hard to sympathize with consumers who are struggling with the cost of living.
The April retail sales report may show that things are getting worse – headline retail sales is expected to slow to -1.4%, down from -0.2% in March, and the core rate is expected to fall from -0.7% to -0.8%. Not exactly a winning recipe for economic growth. A decline in today’s report could unnerve investors and send the Canadian dollar lower.
The Bank of Canada will not be pleased with the slight increase in inflation, although the core rate, which is a more reliable gauge of inflation trends, did move lower. The BoC meets next on June 7th and there is only one more tier-1 release before the meeting, that being GDP. If retail sales contracts for a second straight month as expected, there will be more support for the BoC to continue to hold rates at 4.50%, where they have been pegged since March.
It’s a bare economic calendar in the US today, with no data releases. The markets will have a chance to focus on Fedspeak, with Jerome Powell and two FOMC members delivering public remarks. Just a few weeks ago, the markets had priced in a pause at the June meeting at over 90%. That has changed to a 66% chance of a pause and a 33% chance of a hike of 25 basis points, according to CME’s FedWatch. That downward revision is due to a consistently hawkish message from the Fed and a solid US economy.
USD/CAD Technical
- USD/CAD is testing support at 1.3479. Below, there is support at 1.3394
- 1.3644 and 1.3729 are the next resistance lines
Nikkei 225 Heading Towards the Peak of the 1990s Bubble
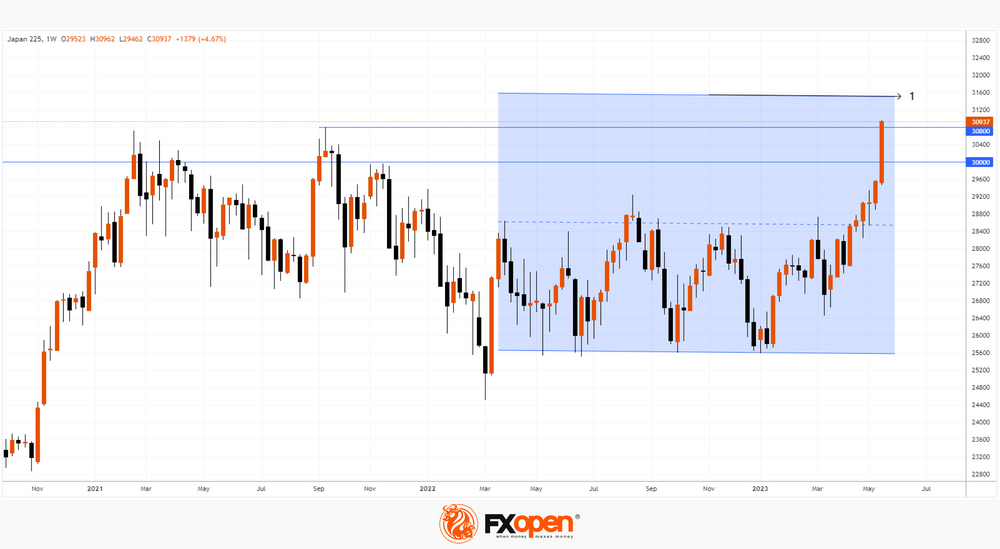
On Friday, the Japanese stock market index Nikkei 225 once again updated the maximum of the year. During this week, the bulls have overcome:
→ the psychological level of USD 30k;
→ the 2022 high around 30,800.
The strong momentum in the Nikkei 225 market is driven by:
→ the weak yen;
→ a strong reporting season for Japanese companies;
→ the news about foreign investment, including Warren Buffett's.
Today's bullish momentum is supported by the latest news that US lawmakers may reach an agreement on a debt ceiling. A bipartisan deal is scheduled to be voted on in the coming days to prevent a default in the US.
The Nikkei 225 chart shows that in case of further growth, the index value may encounter resistance in the 31,500 area — here lies the line (1) of the parallel channel, which is built on a series of important extremes in 2022-2023. At the same time, reasonable investors can take advantage of optimism to take profits on longs.
AUDUSD in Tight Range; Decisive Breakout Needed
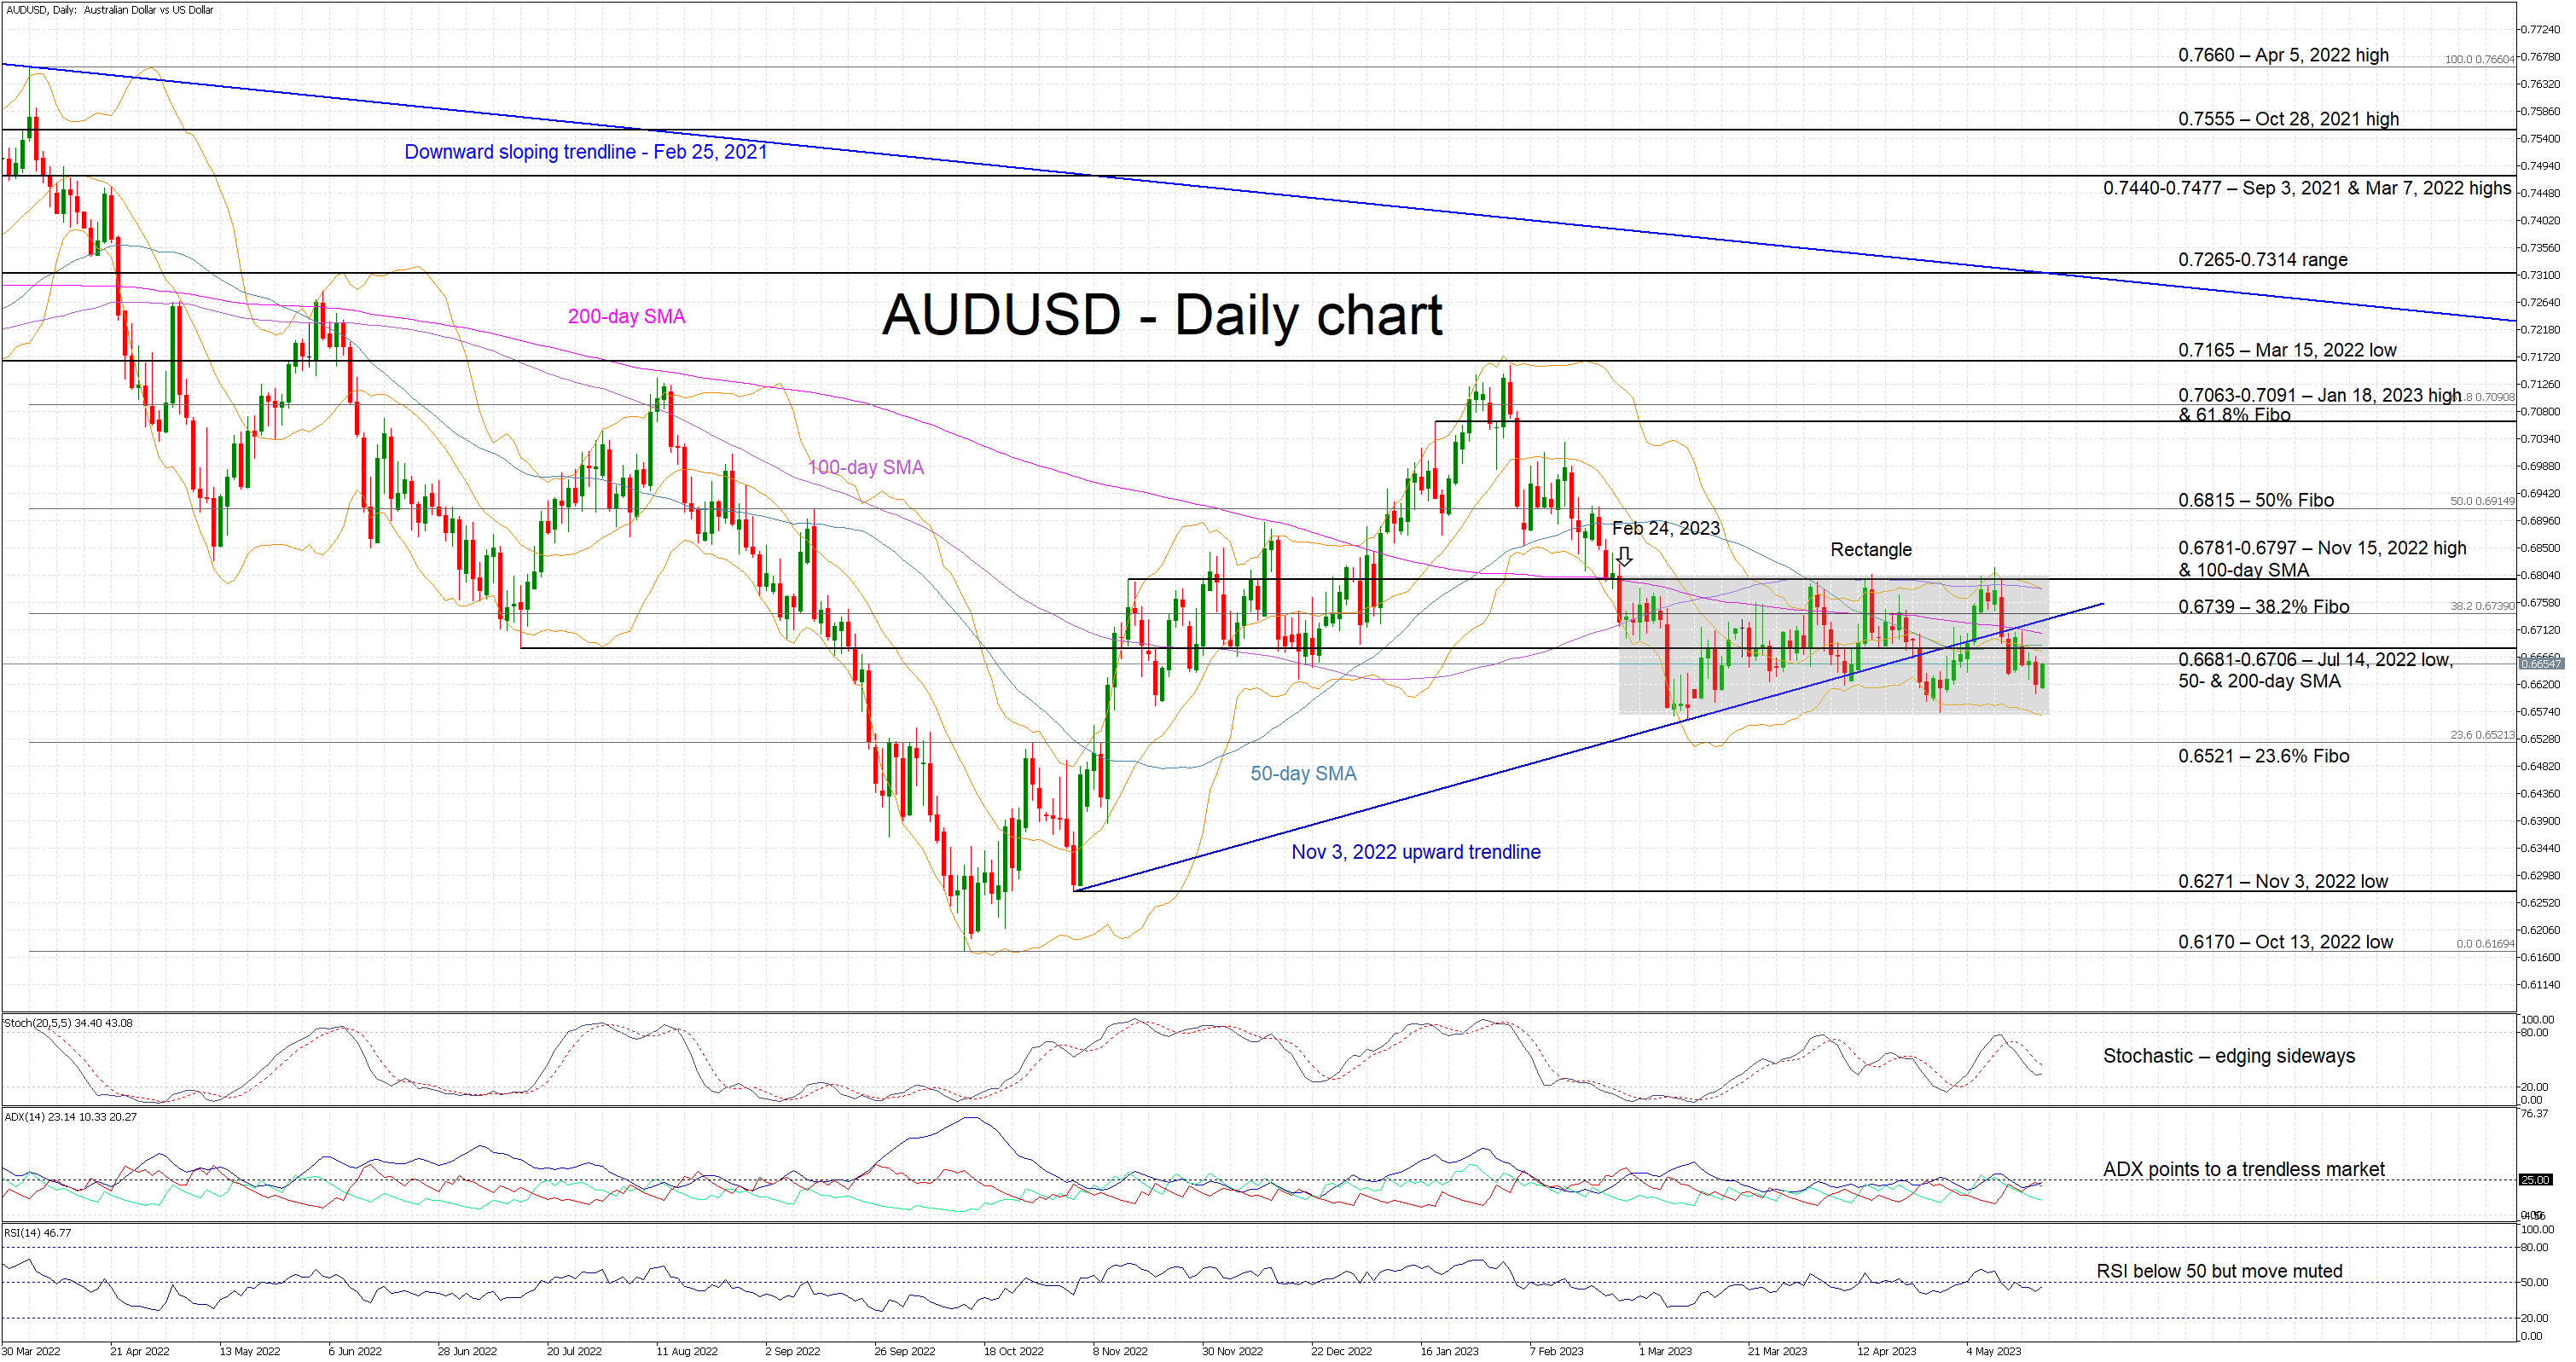
AUDUSD is edging higher today but remains well inside the rectangle that has formed since February 24. This recent range-trading is a depiction of the indecisiveness of market participants to commit to a specific move. As the direction of the breakout is unknown ahead of time, the focus turns to the momentum indicators for valuable information.
However, the subdued Average Directional Movement Index (ADX) confirms the current range-trading theme, and the RSI is just a tad below its 50-threshold. In addition, the usually volatile stochastic oscillator is hovering below its moving average but appears to be moving sideways now. More interestingly, there is a convergence of the simple moving averages (SMAs), just above the current AUDUSD pricing, that is usually associated with an imminent move.
Should the bears manage to break the current rectangle, they would quickly come up against the 23.6% Fibonacci retracement of the April 5, 2022 – October 13, 2022 downtrend at 0.6521. The path then appears to be clear until the November 3, 2022 low of 0.6271.
On the other hand, if the bulls decide to take market control, they will try to clear the busy 0.6681-0.6706 area populated by the 50- and 200-day SMAs, and the July 14, 2022 low. They would then aim for 0.6739, before setting their eyes on the key 0.6781-0.6797 range, where the upper boundary of the rectangle lies.
To conclude, AUDUSD range-trading continues as market participants remain on the sidelines. A sizeable move appears to be on the cards, but a rectangle breakout is needed first.