

Sample Category Title
AUD/USD and NZD/USD Weekly Chart Outlook
AUD/USD struggled to stay above 0.7000 and corrected lower. Similarly, NZD/USD is facing strong resistance near 0.6540.
Important Takeaways for AUD/USD and NZD/USD Analysis
- The Aussie Dollar started a downside correction from the 0.7150 zone against the US Dollar.
- There is a crucial bearish trend line forming with resistance near 0.6900 on the weekly chart of AUD/USD at FXOpen.
- NZD/USD also started a steady increase above the 0.5750 and 0.6000 levels.
- There is a key bearish trend line forming with resistance near 0.6365 on the weekly chart at FXOpen.
AUD/USD Technical Analysis
On the weekly chart of AUD/USD at FXOpen, the pair climbed higher above the 0.6540 and 0.6900 resistance levels. However, the Aussie Dollar failed to clear the 0.7150 zone against the US Dollar.
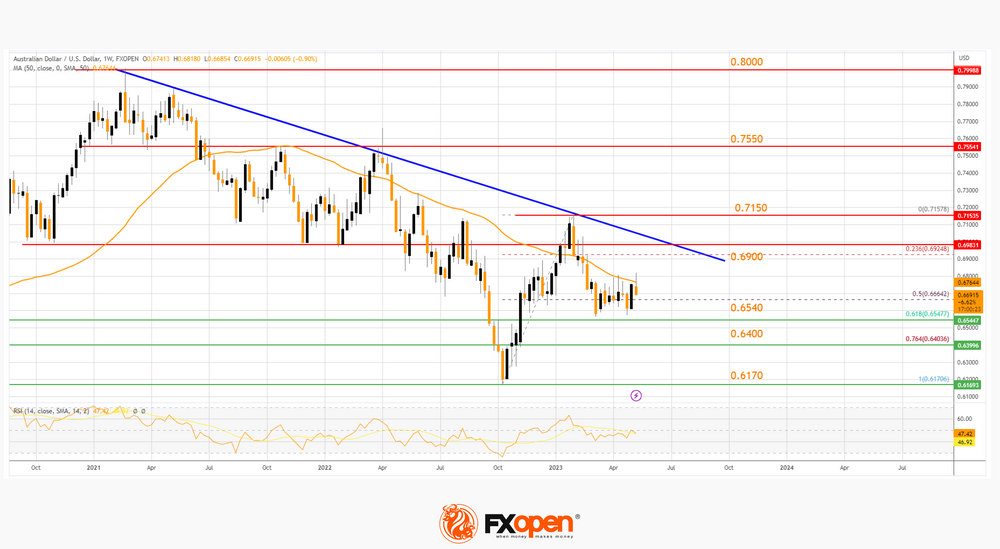
As a result, there was a bearish reaction from the 0.7150 zone. The pair corrected lower below the 0.6900 pivot level and the 50-week simple moving average. Besides, there was a spike below the 50% Fib retracement level of the upward move from the 0.6170 swing low to the 0.7157 high.
On the AUD/USD chart, the pair is now showing bearish signs below the 50-week simple moving average and a crucial bearish trend line with resistance near 0.6900. Only a successful daily close above 0.6900 might start a strong recovery toward the 0.7150 level.
Any more gains might send the pair toward the 0.7550 level. The next major resistance sits near the 0.8000 resistance. On the downside, the first major support is near the 61.8% Fib retracement level of the upward move from the 0.6170 swing low to the 0.7157 high at 0.6540.
The next major support is near the 0.6400 level, below which the pair may perhaps extend its decline toward the 0.6170 level. Any more losses might call for a move toward the 0.6000 level.
NZD/USD Technical Analysis
On the weekly chart of NZD/USD at FXOpen, the pair started a steady increase from the 0.5510 zone. The New Zealand Dollar was able to surpass the 0.5750 and 0.6025 resistance levels. There was also a close above the 50-week simple moving average and RSI settled above 50.
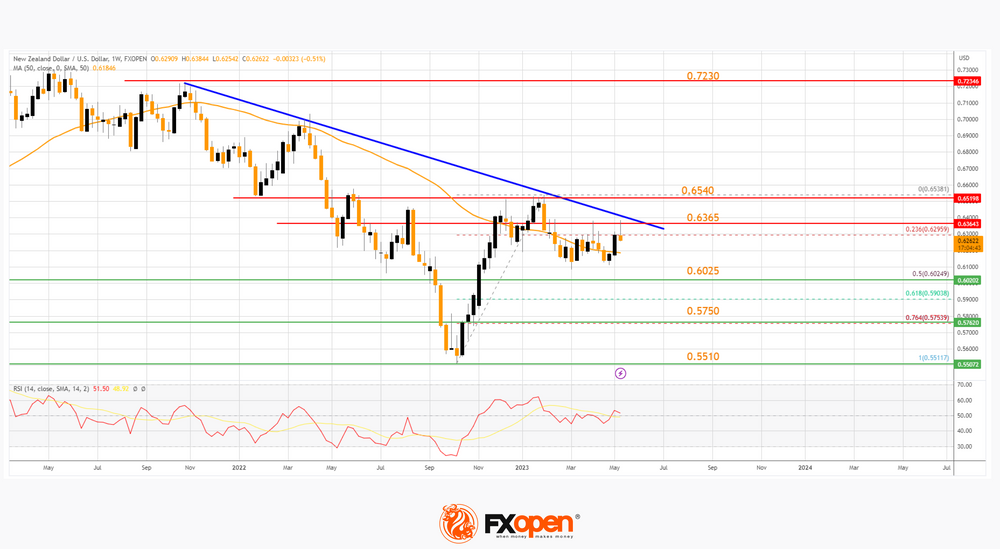
However, the pair failed to clear the 0.6540 level. A high is formed near 0.6538 and the pair is now showing a few bearish signs. It moved below the 23.6% Fibonacci retracement level of the upward move from the 0.5511 swing low to the 0.6538 high.
On the downside, the 0.6025 level is a decent support on the NZD/USD chart since it coincides with the 50% Fibonacci retracement level of the upward move from the 0.5511 swing low to the 0.6538 high.
The next major support is near 0.5750, below which NZD/USD might decline toward the 0.5510 support zone. Any more losses could open the doors for a drop toward the 0.5200 level.
Immediate resistance on the upside is near a key bearish trend line at 0.6365. The first major resistance on the upside is near the 0.6540 level. A successful close above 0.6540 could start a solid upward move toward the 0.7000 resistance. Any more gains might send the pair toward the 0.7230 level.
USDCAD Range-Trading; Next Break Key for Market Sentiment
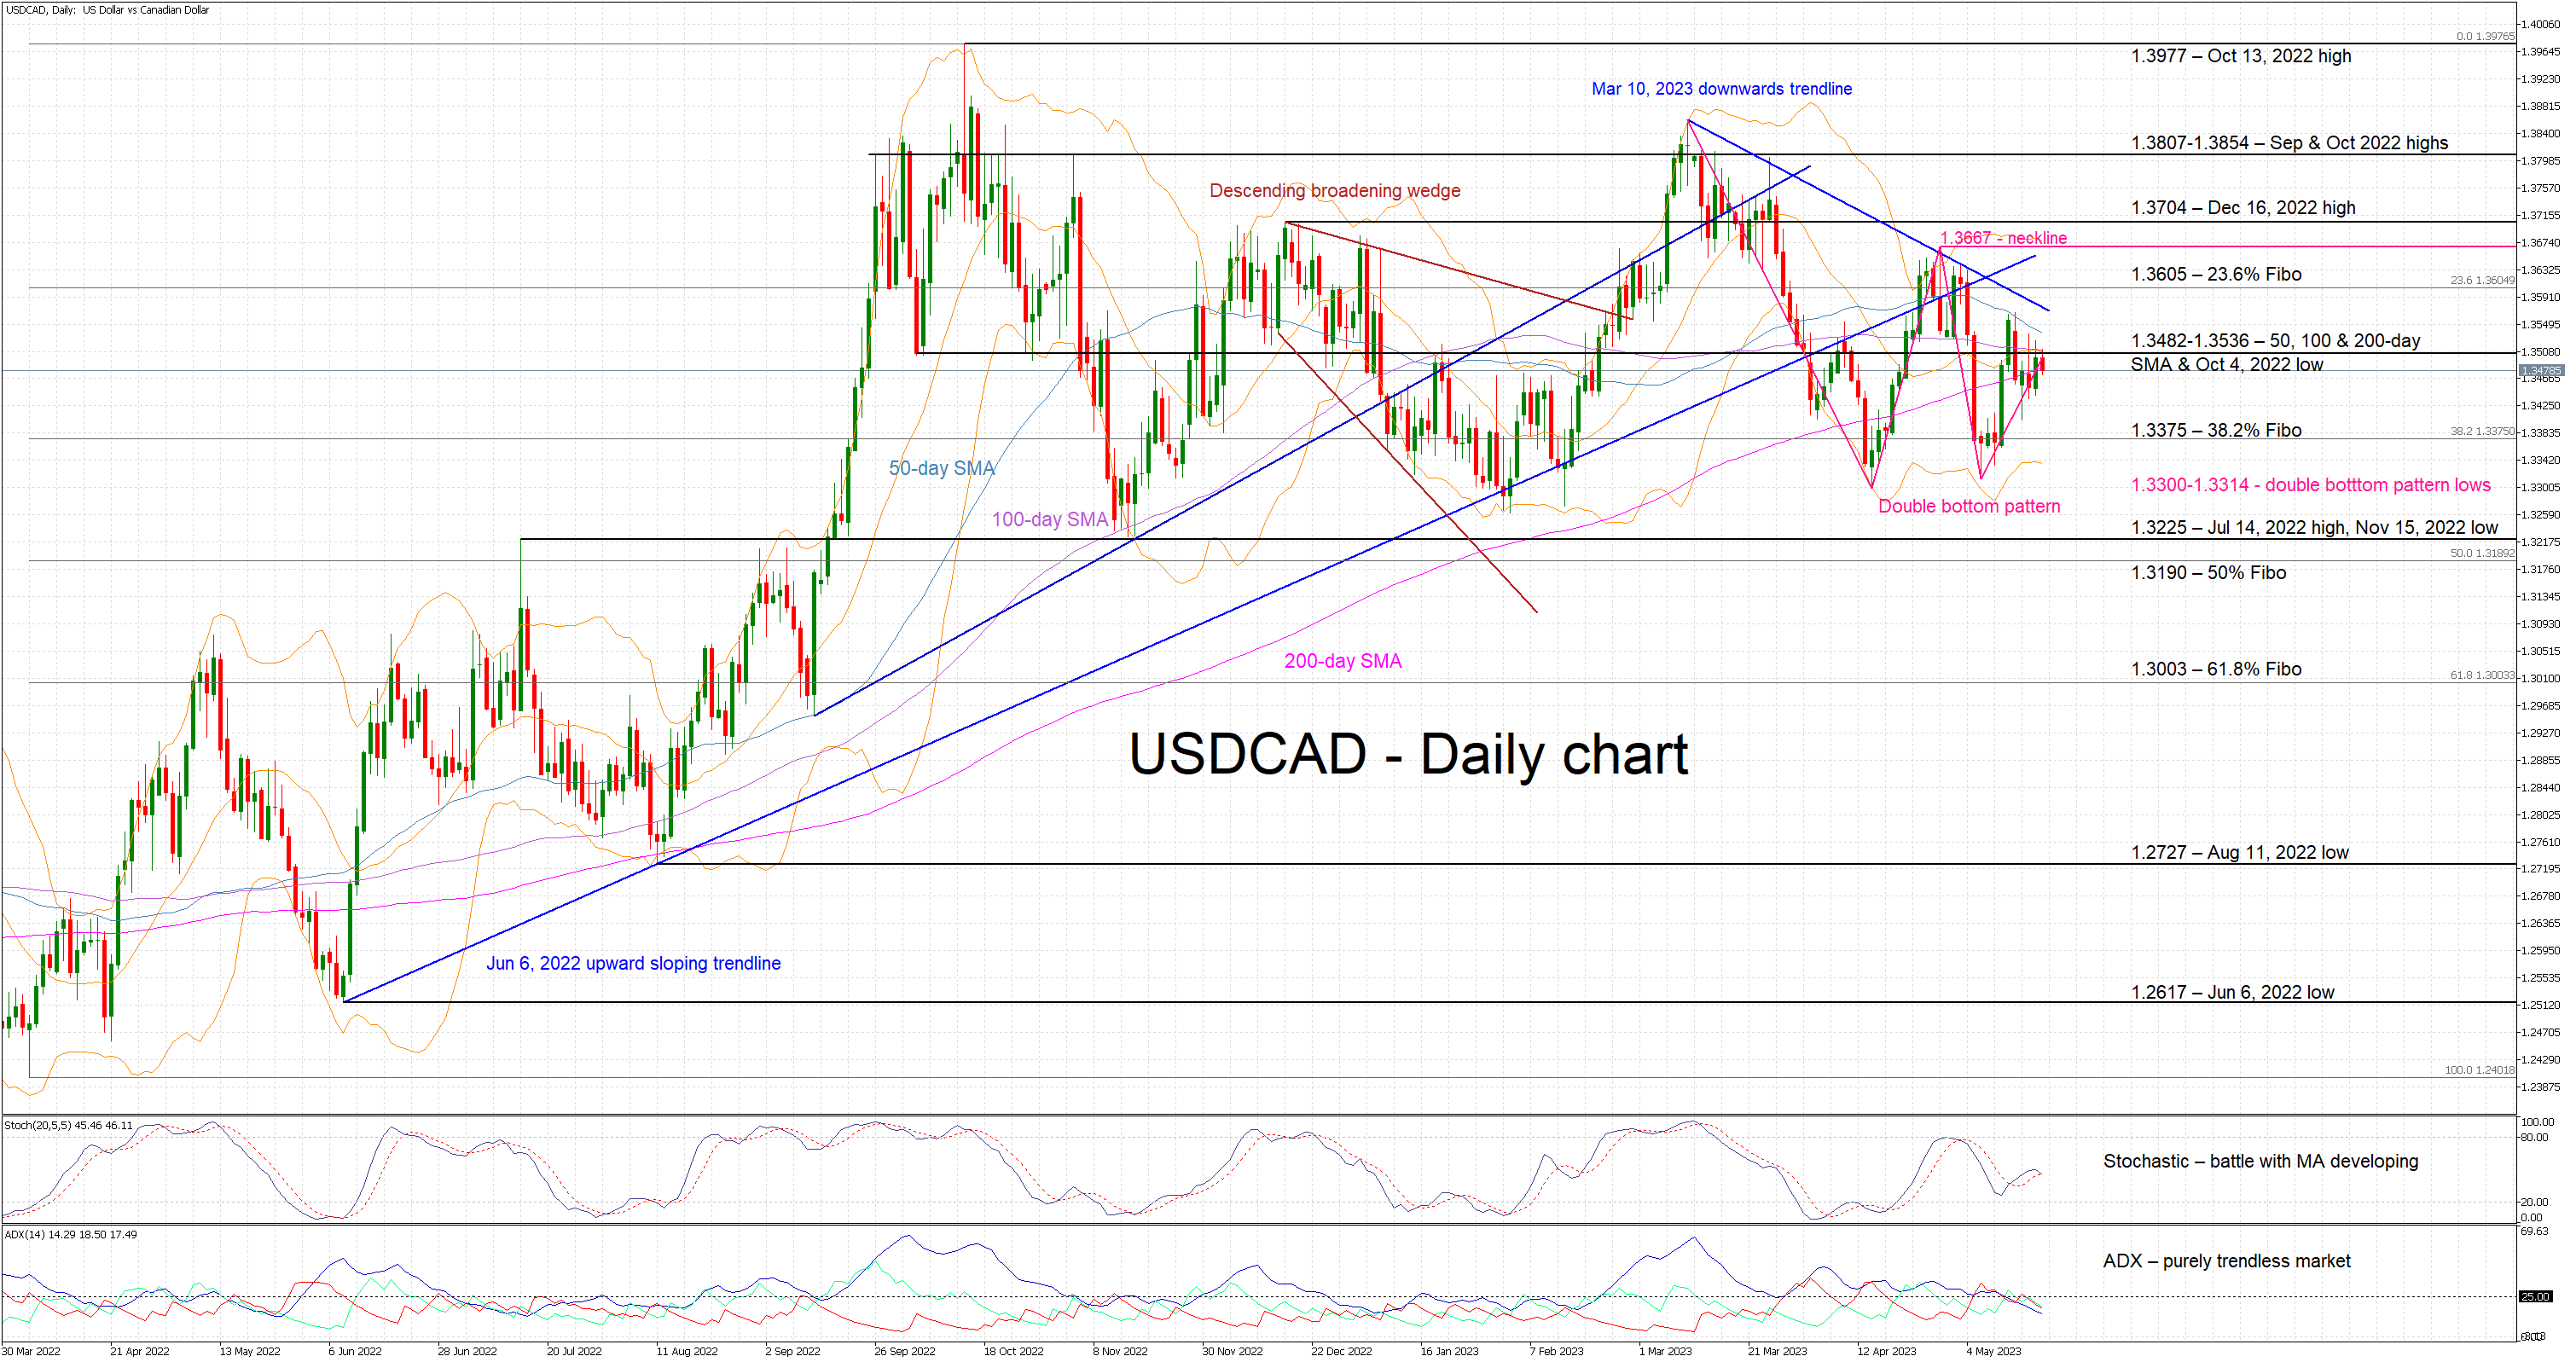
USDCAD is edging lower today but it appears to be in a delicate balance. It is hovering inside the rather busy 1.3482-1.3536 area, as the pair seems to be taking a breather from the downward move that commenced on March 10, 2023. The aggressive convergence of the simple moving averages (SMAs) employed here and the trendless Average Directional Movement Index (ADX) confirm the current range-trading phase.
The stochastic oscillator could offer a potential way out of the current deadlock. It is hovering at its 50-midpoint, but it is also testing the support set by its moving average. A break lower could encourage the bears to push for another lower low in USDCAD. Their first aim would be to break the current 1.3482-1.3536 range populated by the 50-, 100- and 200-day SMAs and the October 4, 2022 low respectively. They would then set their eyes on the 38.2% Fibonacci retracement of the April 5, 2022 – October 13, 2022 uptrend at 1.3375, a tad ahead of the double bottom pattern lows at the 1.3300-1.3314 area.
On the other hand, a bounce higher by the stochastic oscillator could assist the bulls into staging a new rally and limit the recent losses. In addition, there is a bullish double-bottom pattern (bottoms on April 14 and May 8) developing in USDCAD. However, the bulls should avoid jumping the gun as, for the pattern to be valid, the 1.3667 neckline has to be broken first. Should this occur, the potential upside target from this pattern is in the 1.3900 region.
Provided that they clear the much talked about 1.3428-1.3536 area, the bulls would then look for a retest of the 23.6% Fibonacci retracement at 1.3605. Even higher, the double bottom neckline at 1.3667 and the December 16, 2022 high at 1.3704 respectively could prove tougher to crack.
To sum up, USDCAD is at a critical point. The bears appear to have the upper hand due to the downward move since the March 10 high, but the bulls are itching for the completion of the double bottom pattern.
Elliott Wave View: S&P 500 (SPX) Has Started Wave 5 Higher
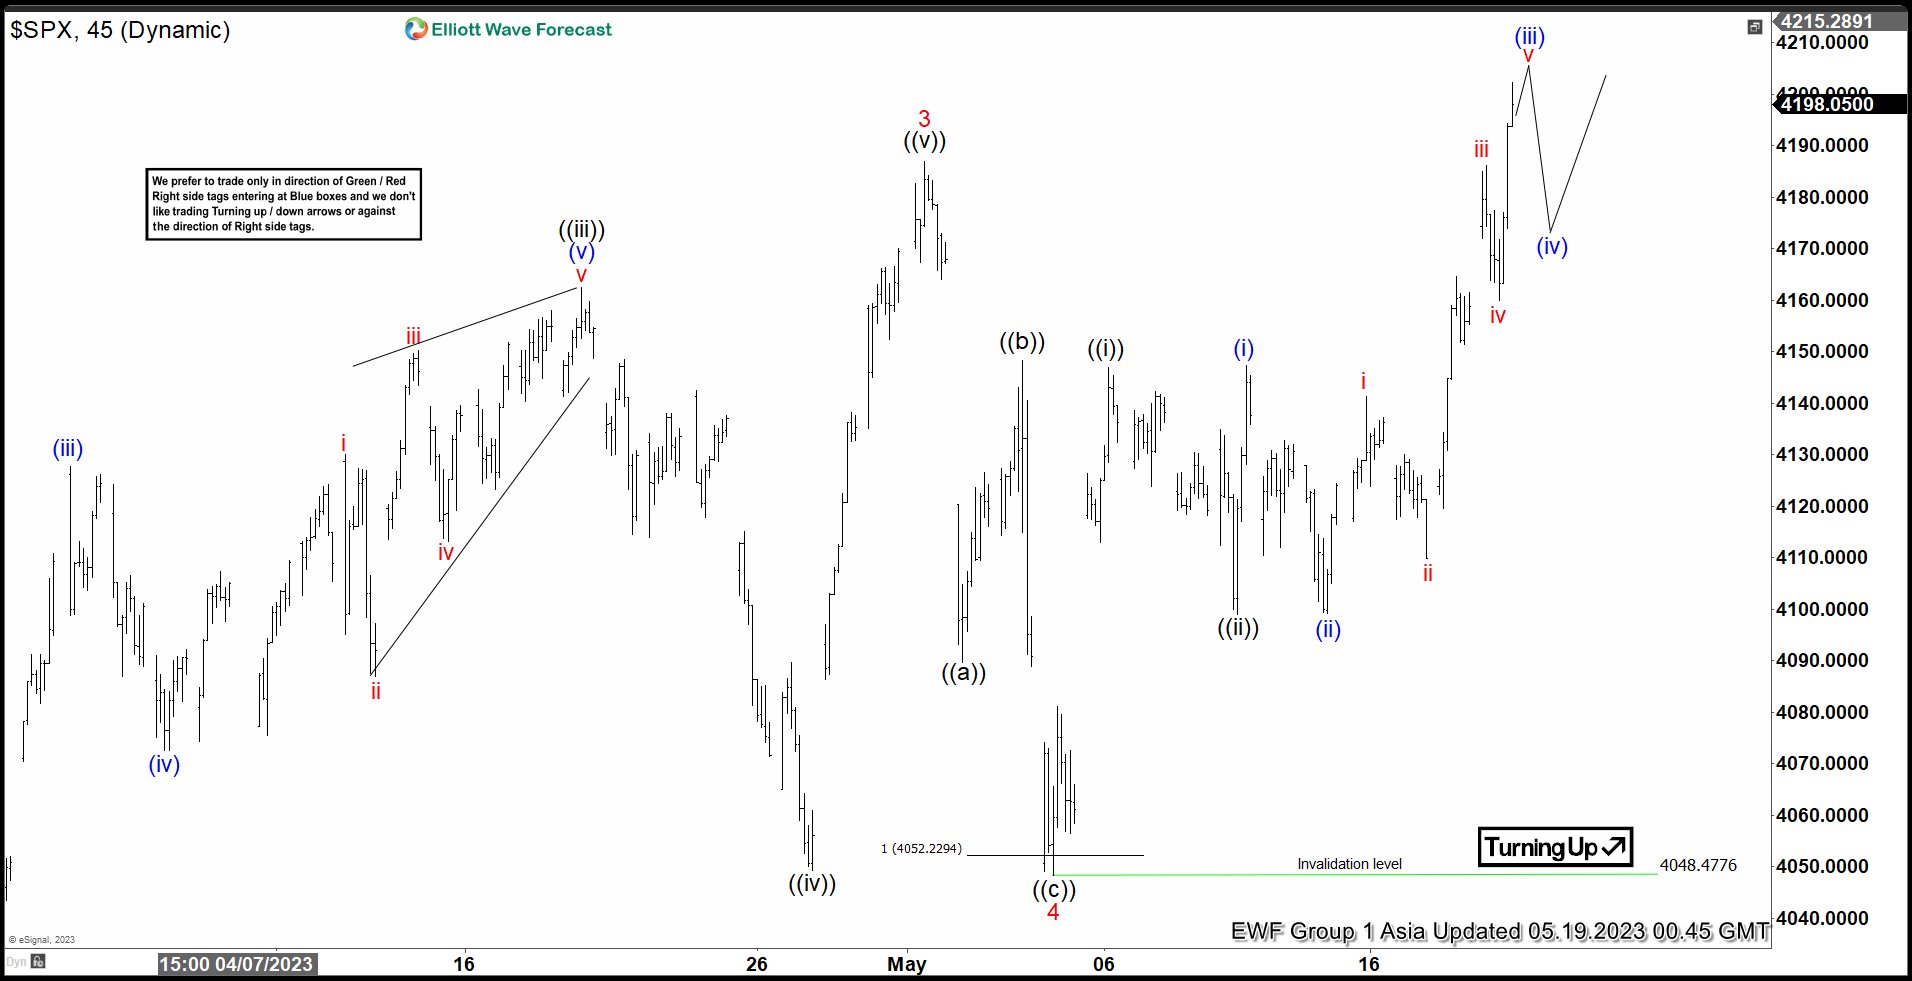
Short term Elliott Wave View in S&P 500 (SPX) shows the Index ended wave 3 at 4186.92 and pullback in wave 4 ended at 4048.4. Internal subdivision of wave 4 unfolded as a zigzag Elliott Wave structure. Down from wave 3, wave ((a)) ended at 4089.72 and rally in wave ((b)) ended at 4148.3. Final leg wave ((c)) lower ended at 4048.47. The Index has resumed higher and broken above wave 3, confirming that wave 5 has started. Wave 5 is unfolding as a 5 waves impulse structure with an extension.
Up from wave 4, wave ((i)) ended at 4147.02 and pullback in wave ((ii)) ended at 4098.92. The Index then resumes higher again in wave ((iii)) in 5 waves of a lesser degree. Up from wave ((ii)), wave (i) ended at 4147.32 and dips in wave (ii) ended at 4099.12. Up from there, wave i ended at 4141.25, wave ii ended at 4109.86. Wave iii ended at 4186.2, wave iv ended at 4160.04. Final leg wave v is expected to end soon which should complete wave (iii). Afterwards, it should pullback in wave (iv) before the rally resumes again. Near term, as far as pivot at 4048.47 low stays intact, expect pullback to find support in 3, 7, 11 swing and Index to resume higher.
S&P 50 (SPX) 45 Minutes Elliott Wave Chart
SPX Elliott Wave Video
https://www.youtube.com/watch?v=_4fAY1PIpmI
USD/CAD Daily Outlook
Daily Pivots: (S1) 1.3459; (P) 1.3492; (R1) 1.3535; More....
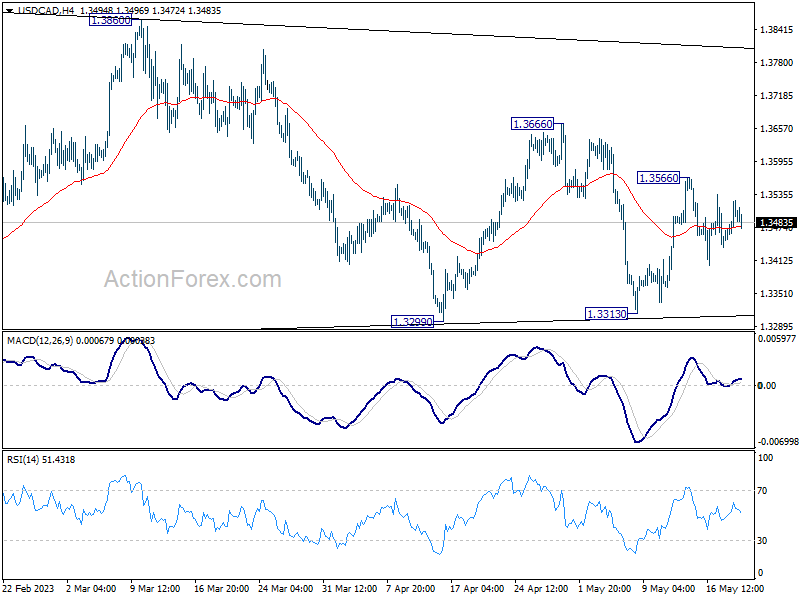
Range trading continues in USD/CAD and intraday bias remains neutral at this point. Overall, the pair is seen as extending the triangle consolidation pattern from 1.3976. Above 1.3566 will resume the rebound towards 1.3666 resistance and then 1.3860. However, firm break of 1.3313 support will invalidate this view and indicate that deeper correction is underway.
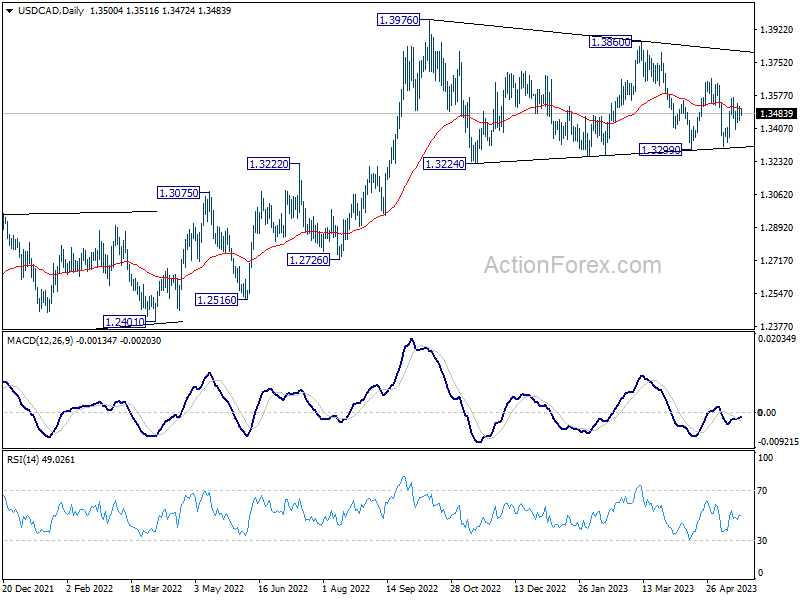
In the bigger picture, as long as 55 W EMA (now at 1.3321) holds, up trend from 1.2005 (2021 low) is still in favor to resume through 1.3976 at a later stage. However, sustained trading below the EMA and 38.2% retracement of 1.2005 to 1.3976 at 1.3233 will raise the chance of bearish reversal. Deeper should then be seen to 61.8% retracement at 1.2758 next.
AUD/USD Daily Report
Daily Pivots: (S1) 0.6595; (P) 0.6632; (R1) 0.6658; More...
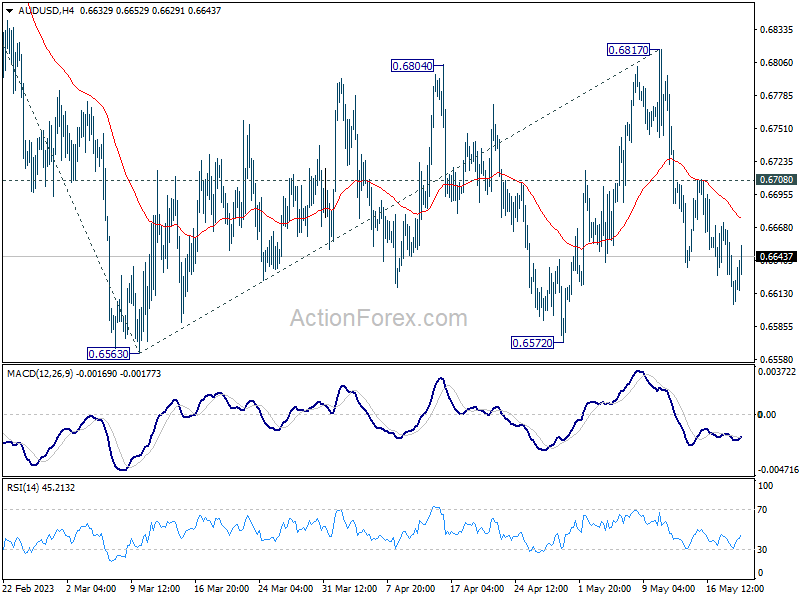
With 0.6708 minor resistance intact, further decline is expected in AUD/USD to retest 0.6563 low. Decisive break there will resume larger decline from 0.7156 to 61.8% projection of 0.7156 to 0.6563 from 0.6817 at 0.6451. On the upside, above 0.6708 minor resistance will delay the bearish case, and probably extend the corrective pattern from 0.6563 with another rising leg.
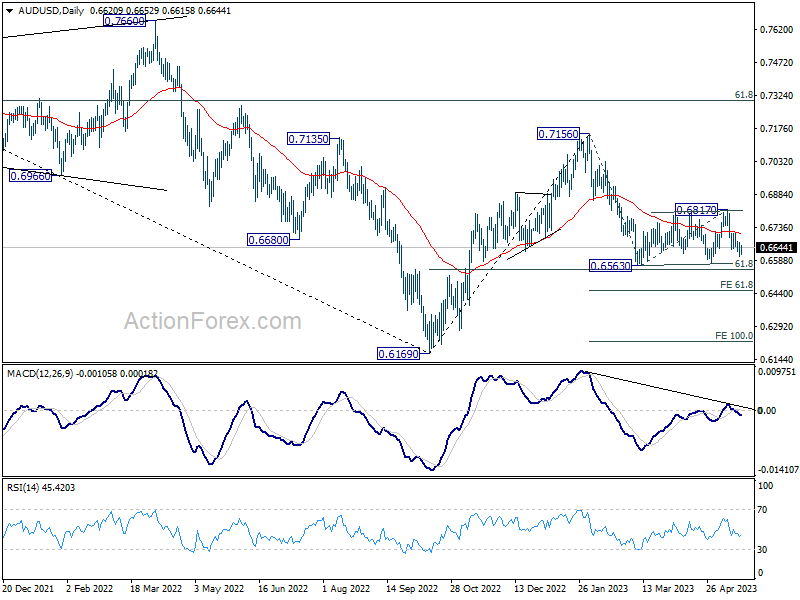
In the bigger picture, the failure to break through 55 W EMA (now at 0.6822) keeps medium term outlook bearish. Firm break of 61.8% retracement of 0.6169 to 0.7156 at 0.6546 will raise the chance of long term down trend resumption through 0.6169 low. This will now be the favored case as long as 0.6817 resistance holds.
EUR/USD Daily Outlook
Daily Pivots: (S1) 1.0739; (P) 1.0794; (R1) 1.0824; More...
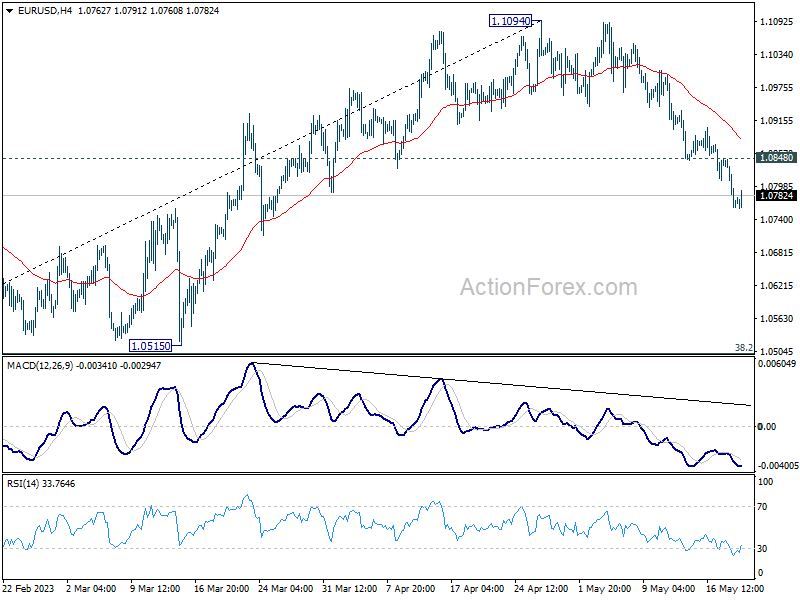
Intraday bias in EUR/USD remains on the downside and outlook is unchanged. As a correction to whole up trend from 0.9534, current fall should target 1.0515 cluster support, 38.2% retracement of 0.9534 to 1.1094 at 1.0498. On the upside, above 1.0848 minor resistance will turn intraday bias neutral first.
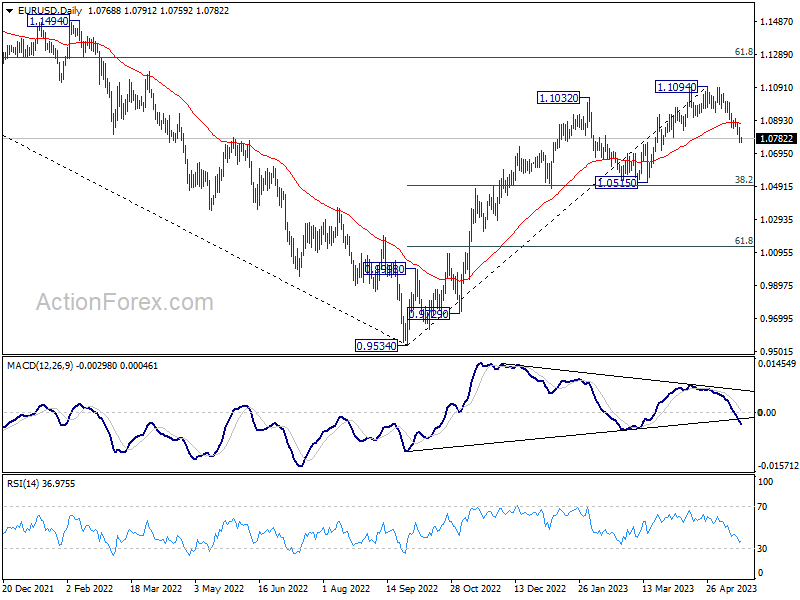
In the bigger picture, as long as 1.0515 support holds, rise from 0.9534 (2022 low) would still extend higher. Sustained break of 61.8% retracement of 1.2348 (2021 high) to 0.9534 at 1.1273 will solidify the case of bullish trend reversal and target 1.2348 resistance next (2021 high).
GBP/USD Daily Outlook
Daily Pivots: (S1) 1.2369; (P) 1.2432; (R1) 1.2471; More...
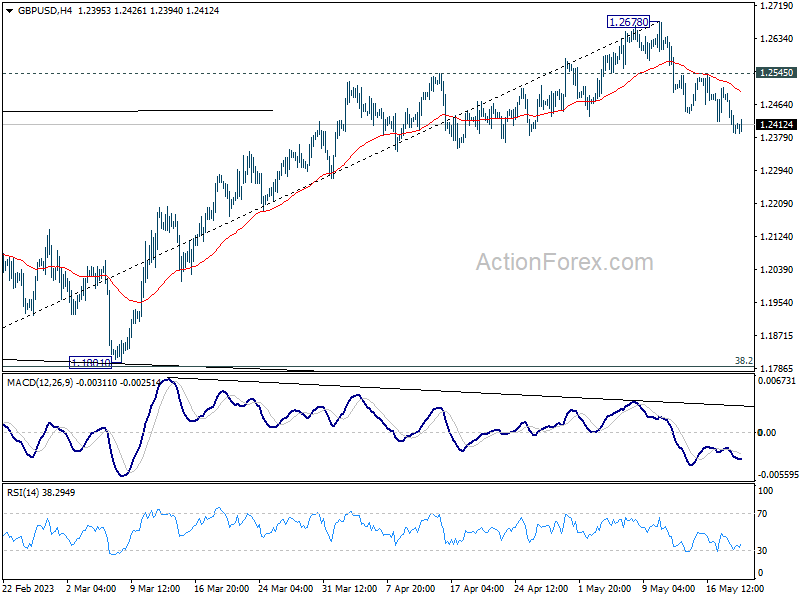
Intraday bias in GBP/USD remains on the downside for the moment. Fall from 1.2678 is seen as correcting whole up trend from 1.0351. Sustained trading below 55 D EMA (now at 1.2392) will affirm this case, and pave the way to 1.1801 cluster support (38.2% retracement of 1.0351 to 1.2678 at 1.1789). On the upside, above 1.2545 minor resistance will turn intraday bias neutral first.
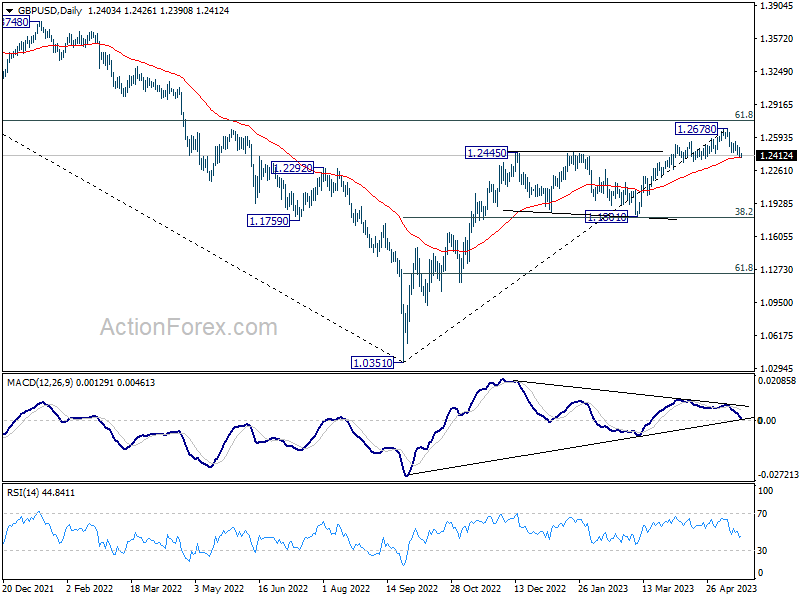
In the bigger picture, as long as 1.1801 support holds, rise from 1.0351 medium term bottom (2022 low) is expected to extend further. Sustained break of 61.8% retracement of 1.4248 (2021 high) to 1.0351 at 1.2759 will add to the case of long term bullish trend reversal. However, firm break of 1.1801 will indicate rejection by 1.2759, and bring deeper decline, even as a correction.
USD/CHF Daily Outlook
Daily Pivots: (S1) 0.8997; (P) 0.9030; (R1) 0.9084; More...
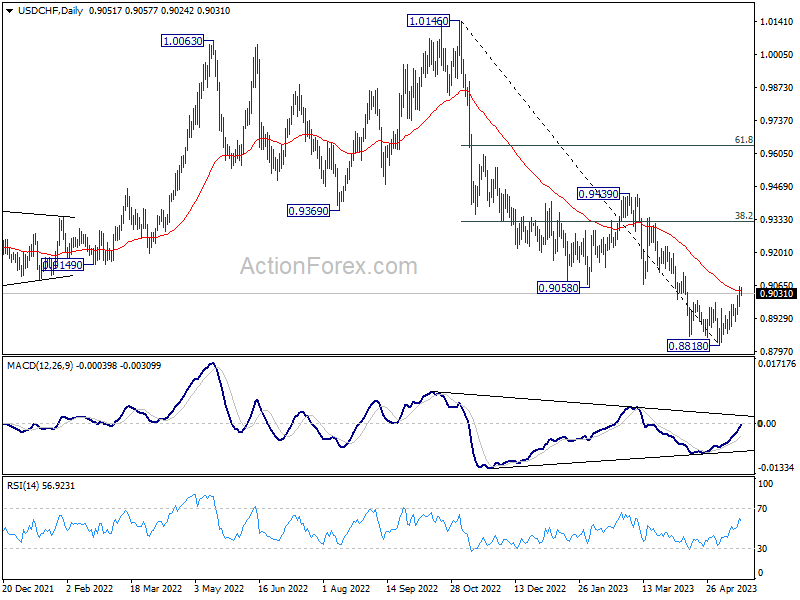
USD/CHF's rebound from 0.8818 short term bottom is in progress. Intraday bias stays on the upside for the moment. Sustained trading above 55 D EMA (now at 0.9042) should confirm that current rally is at least correcting whole down trend from 1.0146. Further rise should then be seen to 38.2% retracement of 1.0146 to 0.8818 at 0.9325. On the downside, below 0.8977 minor support will turn intraday bias neutral first.
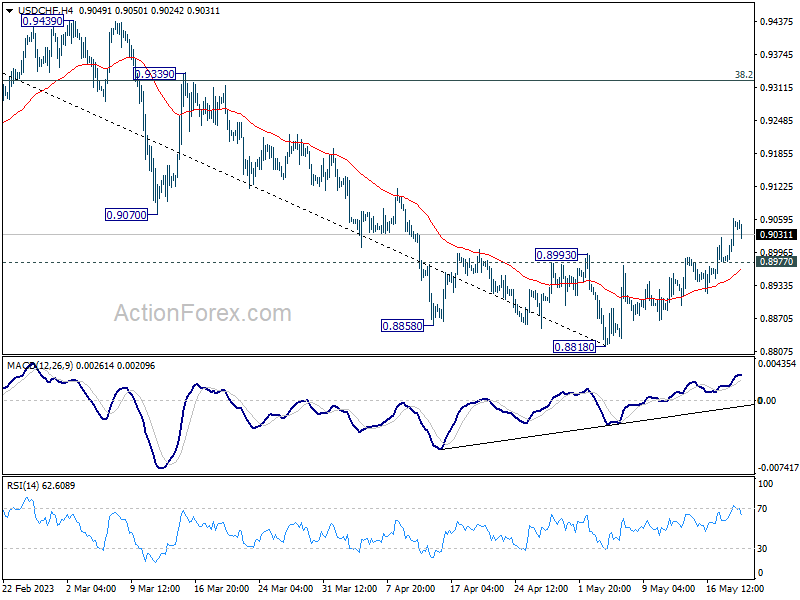
In the bigger picture, fall from 1.1046 (2022 high) is seen as a leg in the long term range pattern from 1.0342 (2016 high). So, downside should be contained by 0.8756 to bring reversal. Sustained break of 0.9058 support turned resistance will be the first sign of medium term bottoming. However, decisive break of 0.8756 will carry larger bearish implications.
USD/JPY Daily Outlook
Daily Pivots: (S1) 137.75; (P) 138.25; (R1) 139.21; More...
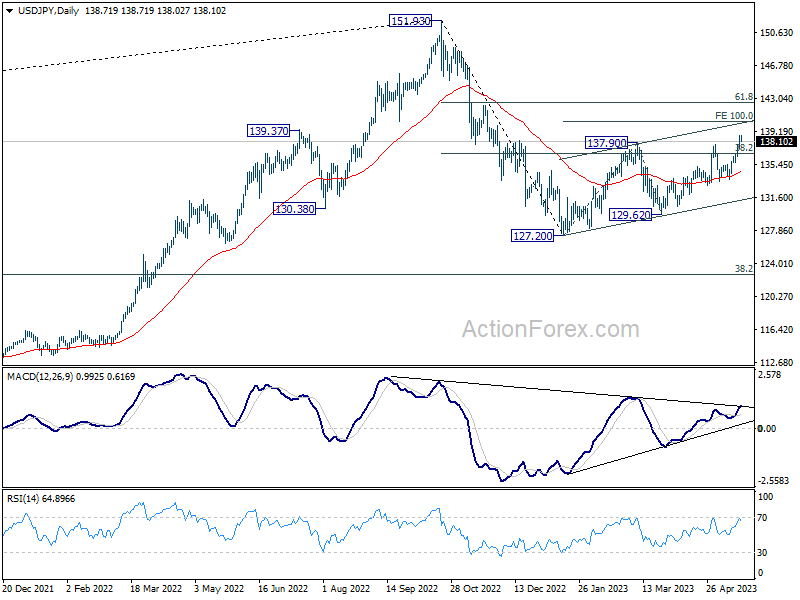
Intraday bias in USD/JPY remains on the upside for now, despite current slight retreat. Current rise is part of the whole rally from 127.20. Next target is 100% projection of 127.20 to 137.90 from 129.62 at 140.32. Break there will target 142.48 fibonacci level. On the downside, below 137.27 minor support will turn intraday bias neutral first.
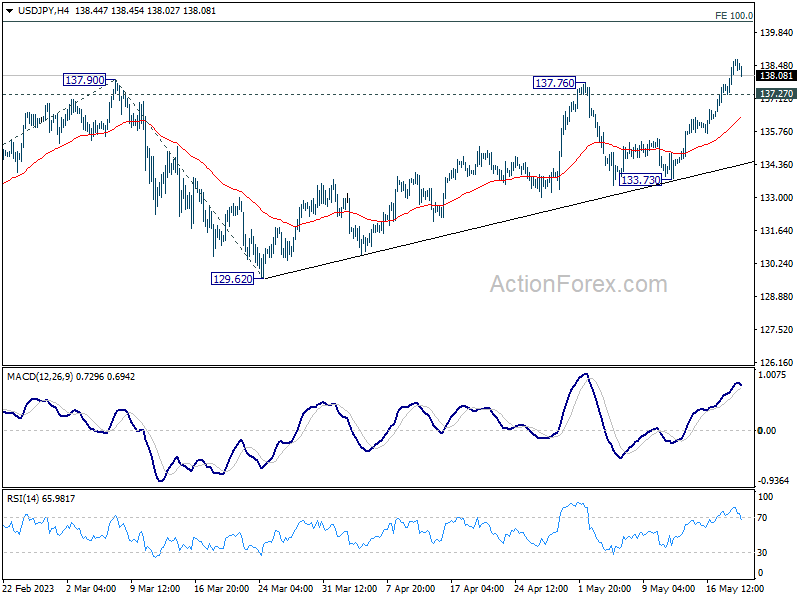
In the bigger picture, price actions from 151.93 high are currently seen as a corrective pattern to the long term up trend. The first leg should have completed at 127.20. Rebound from there is seen as the second leg. Sustained break of 38.2% retracement of 151.93 to 127.20 at 136.34 will bring stronger rise to 61.8% retracement at 142.48. Meanwhile, break of 129.62 will argue that the third leg is starting through 127.20 low.
Yen’s Mild Recovery Overshadowed by Risk-On Sentiment; Euro, Swiss Franc Trail Closely in Underperformance
Japanese yen made a modest recovery today, bolstered by yet another month of robust consumer inflation data. However, this uptick in the currency was held back by strong risk-on sentiment prevalent in Japan, with Nikkei surging to a 33-year high. BoJ's continued commitment to its ultra-loose monetary policy also put a damper on Yen's rise, securing its position as the weakest performer for the week - and by a significant margin at that.
With the week drawing to a close, Euro and Swiss franc are trailing closely behind the Yen as underperformers, followed by Sterling. New Zealand Dollar stands as the week's strongest, receiving a slight boost from promising trade data released today. Canadian dollar, buoyed by earlier in the week's CPI data, anticipates the next move from retail sales figures due later today. Dollar maintains a firm stance, albeit lagging behind Kiwi and Loonie.
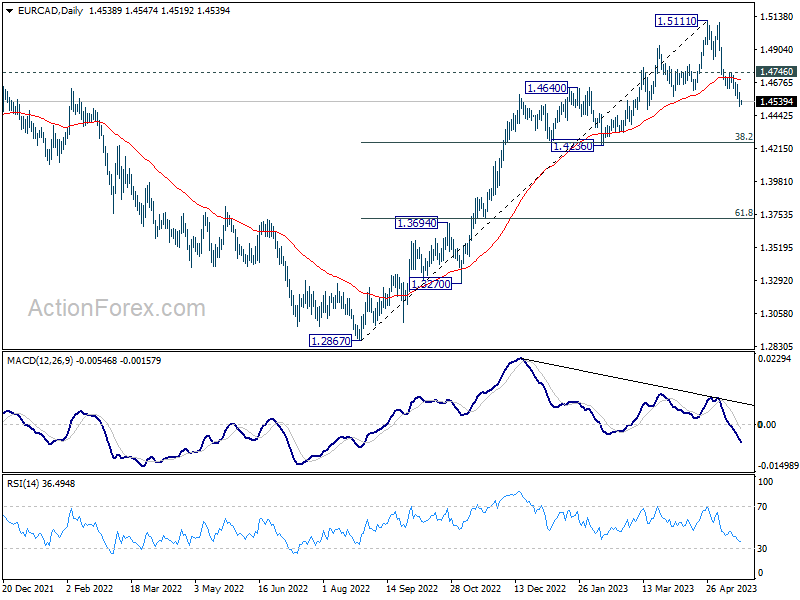
From a technical standpoint, EUR/CAD pair has seen its fall from 1.5111 intensify this week. Given bearish divergence in D MACD, the decline could be viewed as a correction to the overall uptrend from 1.2867. As long as 1.4746 resistance level holds, deeper fall towards 1.4236 cluster support (38.2% retracement of 1.2867 to 1.5111 at 1.4254) is expected. Notably, strong support could emerge here to trigger a rebound, at least on the initial attempt.
In Asia, Nikkei rose 0.77% to 30808.35. Japan 10-year JGB yield rose 0.0177 to 0.403. Hong Kong HSI is currently down -1.28%. China Shanghai SSE is down -0.47%. Singapore Strait Times is up 0.55%. Overnight, DOW rose 0.34%. S&P 500 rose 0.94%. NASDAQ rose 1.51%. 10-year yield rose 0.067 to 3.648.
Japan CPI core rose back to 3.5% in April, core-core hit 42-yr high
April saw Japanese consumer prices accelerating, with CPI accelerated from 3.2% yoy to 3.5% yoy. That put a halt to the slowdown of headline inflation from 4.3% in January.
Even more significantly, core CPI (which excludes fresh food) rose from 3.1% yoy to 3.4%. This metric has been above BoJ's 2% target for an uninterrupted 13 months, signifying persistent inflationary pressure.
In the realm of core-core CPI, which excludes both fresh food and energy, the increase is even starker, rising from 3.8% yoy to 4.1%. This figure is the highest it has been since September 1981, marking a nearly 42-year peak.
Looking at some details, services inflation increased from 1.5% yoy to 1.7%, the highest in 28 years since 1995 (excluding the impact of sales tax hikes). Durable goods prices soared 9.8% yoy, and food prices accelerated from 8.2% yoy to 9.0%, hitting the highest level in almost 47 years since 1976. Energy prices, however, bucked the trend with a yoy decrease of -4.4% yoy.
Despite these inflationary pressures, there is no clear indication that BoJ is preparing to exit its ultra-loose monetary policy. The bank projected CPI to average 1.8% and core CPI at 2.5% for the current fiscal year, but given the current data, it is likely that these projections will be revised upward in the next release.
New Zealand exports rise 10% yoy with China leading, EU tops 12% imports growth
New Zealand's trade balance in April reported a surplus of NZD 427m, defying expected deficit of NZD -1310m. Both imports and exports experienced significant year-on-year growth, with exports rising 10% yoy (NZD 641m) to NZD 6.8B and imports increasing 12% yoy (NZD 683m) to NZD 6.4B.
In the export sector, notable growth was observed in shipments to China, Australia, and the US. Specifically, total exports to China rose by NZD 259m (16% yoy), to Australia by NZD 67m (10% yoy), and to the US by NZD 109m (17% yoy). However, exports experienced a slight downturn to the EU, falling by NZD -2.2m (-0.4% yoy), and a more substantial drop to Japan, decreasing by NZD -53m (-12% yoy).
On the import side, the European Union led the surge with total imports up by NZD 108m (13% yoy). Imports from the US also experienced growth, with an increase of NZD 46m (7.6% yoy). Conversely, imports from China, Australia, and South Korea all fell, with decreases of NZD -29m (-2.4% yoy), NZD -37m (-5.1% yoy), and NZD -28m (-8.3% yoy) respectively.
Looking ahead
ECB will publish monthly economic bulletin today. Canada will release retail sales.
USD/JPY Daily Outlook
Daily Pivots: (S1) 137.75; (P) 138.25; (R1) 139.21; More...
Intraday bias in USD/JPY remains on the upside for now, despite current slight retreat. Current rise is part of the whole rally from 127.20. Next target is 100% projection of 127.20 to 137.90 from 129.62 at 140.32. Break there will target 142.48 fibonacci level. On the downside, below 137.27 minor support will turn intraday bias neutral first.
In the bigger picture, price actions from 151.93 high are currently seen as a corrective pattern to the long term up trend. The first leg should have completed at 127.20. Rebound from there is seen as the second leg. Sustained break of 38.2% retracement of 151.93 to 127.20 at 136.34 will bring stronger rise to 61.8% retracement at 142.48. Meanwhile, break of 129.62 will argue that the third leg is starting through 127.20 low.
Economic Indicators Update
| GMT | Ccy | Events | Actual | Forecast | Previous | Revised |
|---|---|---|---|---|---|---|
| 22:45 | NZD | Trade Balance (NZD) Apr | 427M | -1310M | -1273M | -1586M |
| 23:01 | GBP | GfK Consumer Confidence May | -27 | -30 | ||
| 23:30 | JPY | National CPI Y/Y Apr | 3.50% | 3.20% | ||
| 23:30 | JPY | National CPI Core Y/Y Apr | 3.40% | 3.40% | 3.10% | |
| 23:30 | JPY | National CPI Core-core Y/Y Apr | 4.10% | 3.80% | ||
| 04:30 | JPY | Tertiary Industry Index M/M Mar | -1.70% | -0.10% | 0.70% | 1.70% |
| 06:00 | EUR | Germany PPI M/M Apr | 0.30% | -0.50% | -2.60% | -1.40% |
| 06:00 | EUR | Germany PPI Y/Y Apr | 4.10% | 4.00% | 7.50% | 6.70% |
| 08:00 | EUR | ECB Economic Bulletin | ||||
| 12:30 | CAD | Retail Sales M/M Mar | -1.30% | -0.20% | ||
| 12:30 | CAD | Retail Sales ex Autos M/M Mar | -0.80% | -0.70% |