Sample Category Title
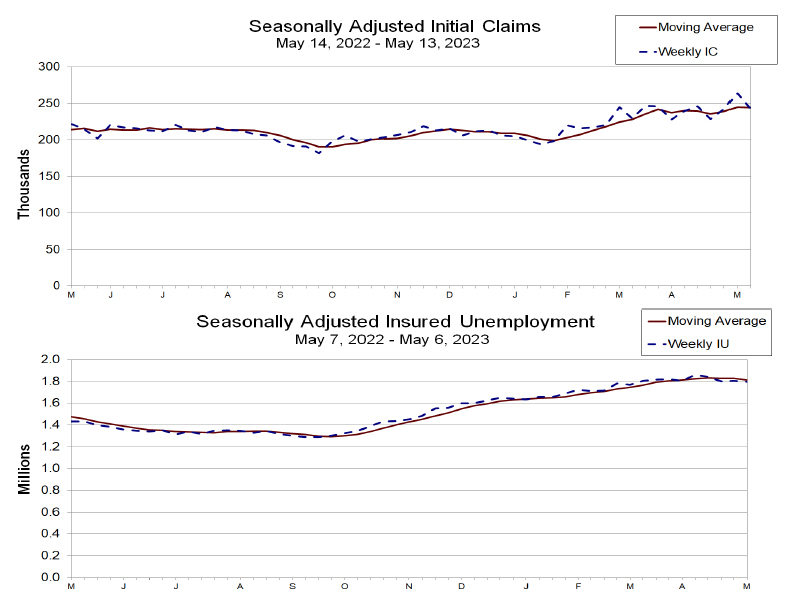
US initial jobless claims dropped back to 242k, below expectation
US initial jobless claims dropped -22k to 242k in the week ending May 13, below expectation of 260k. Four-week moving average of initial claims dropped -1k to 244k.
Continuing claims dropped -8k to 1799k in the week ending May 6. Four-week moving average of continuing claims dropped -15.5k to 1812.5k.
BoE Bailey not seeing balance sheet returning to pre-financial crisis levels
In his remarks to the Treasury Committee, BoE Governor Bailey commented that he does not foresee the BoE's balance sheet returning to pre-financial crisis levels. Instead, he envisages a more proactive adjustment strategy, stating, "The Bank wants to adjust its balance sheet so that it has headroom to do whatever it might need to do in the future. It does not want its balance sheet to simply get larger after every economic shock."
In a rebuttal to critics linking the UK's inflation surge to QE policies, Bailey downplayed the connection, suggesting that the impact of COVID-19 supply chain disruptions was likely time-limited. "If the only shock that the world had experienced was that one [the Covid-19 supply chain disruption] then I think the evidence now suggests it had a limited time period. Unfortunately, of course, Ukraine came along, and there was no gap between these shocks," he explained.
Deputy governor Ben Broadbent supported Bailey's perspective, noting that the UK, along with other regions such as the US and the Eurozone, had engaged in a decade of QE without witnessing an inflation problem or robust money growth.
Addressing concerns about housing prices, Bailey refuted suggestions that the BoE's policies had contributed to a surge. "Actually, the period in which the house price to income ratio rose most was the period of 10 years before 2007. That was the period when it rose most substantially. It hasn't done the same thing since then," he noted.
AUD/USD Under Pressure After Soft Aussie Employment
- Australia’s employment change declines
- Markets lower expectations of a Fed pause in June
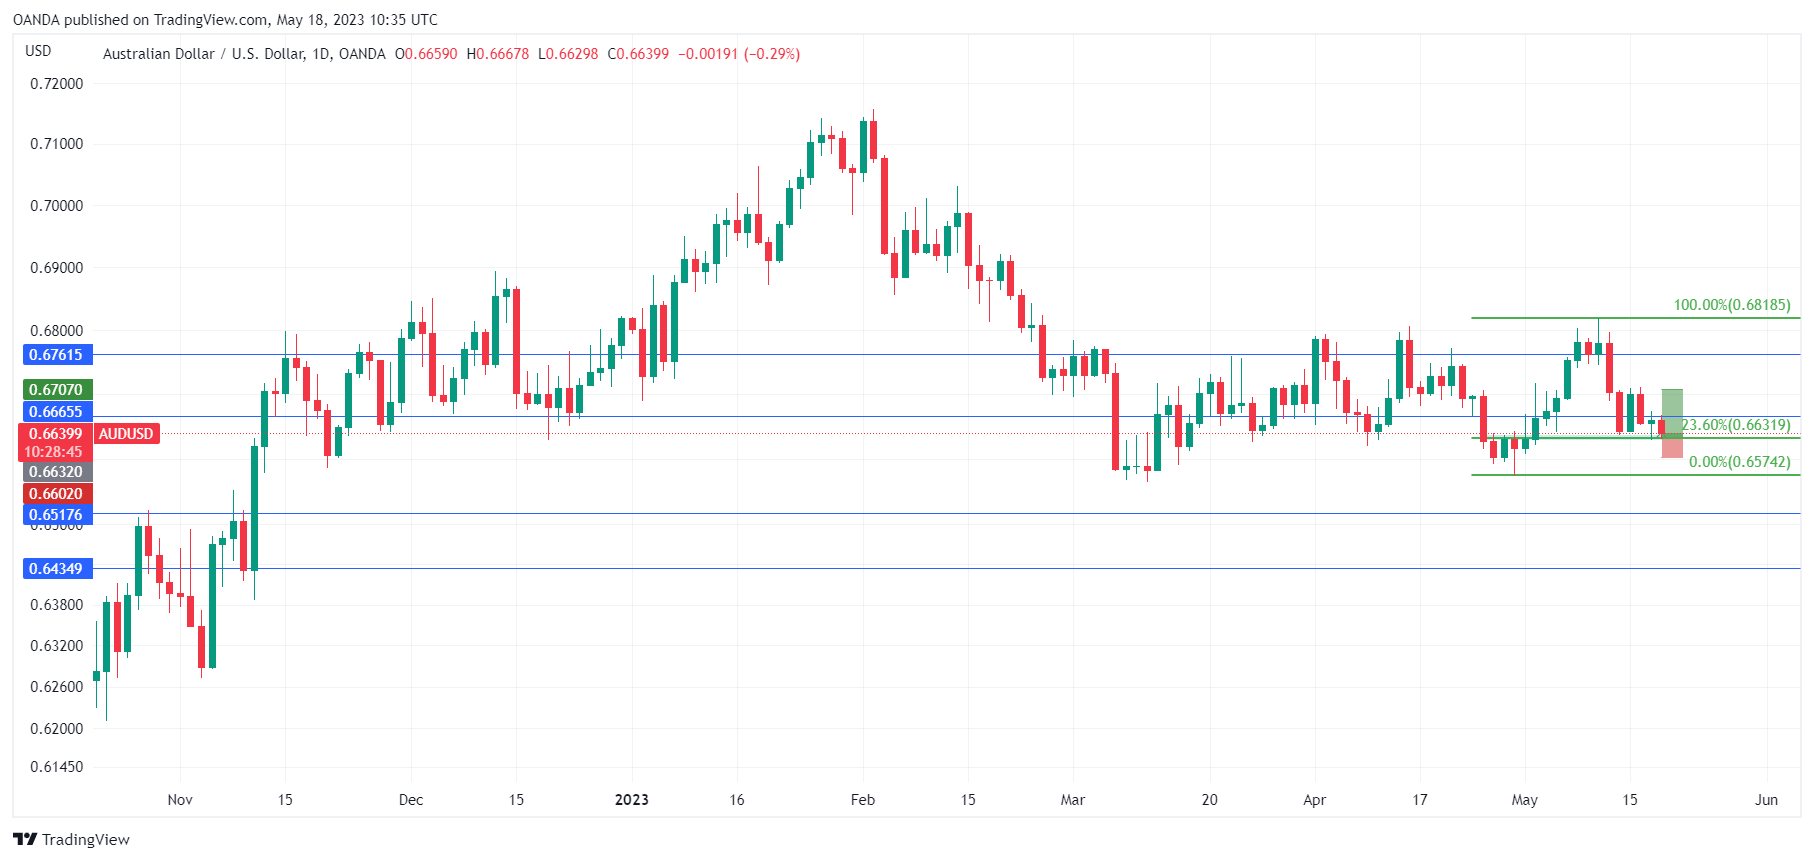
The Australian dollar has resumed its downswing on Thursday after taking a pause a day earlier. AUD/USD is trading at 0.6641 in Europe, down 0.26% on the day.
Australian employment slips
Australia’s April employment report surprised to the downside today, sending the Australian dollar lower. Net employment fell by 4,300 in April, after a gain of 61,100 in March. The market estimate stood at 25,000. What was more disconcerting was the full-time employment decline of 27,100, after a gain of 72,000 in March. As well, unemployment jumped to 3.7% in April, up from 3.5% a month earlier.
The soft job numbers provide support for the Reserve Bank of Australia to pause its rate hikes at the June 6th meeting, after shocking the markets with a 25-basis point hike earlier this month. The markets are confident of a pause, which stands at 100% probability according to the ASX RBA Rate Tracker. The central bank would like to ease up on its rate hikes and guide the economy to a soft landing, and a cooler labour market will certainly help. Still, inflation will have to cooperate and continue to head lower for the RBA to take another pause.
The US dollar is showing gains against the major currencies, as progress was reported in debt ceiling talks between Republicans and Democrats. The US has never defaulted on its debt and there’s every reason to believe that lawmakers will resolve the crisis before the June 1st deadline.
Investors continue to scale back expectations that the Fed will ease up on its rate policy. Only a week ago, the odds of a pause were 89% and a 25-bp rate hike at 11%, according to CME’s FedWatch. This has been revised to a 74% chance of a pause and a 26% chance of a 25-bp increase. The markets have mostly priced in a rate cut in December (71%), despite Jerome Powell and other members stating that no rate cuts are planned. JP Morgan came out in support of the market’s stance earlier in the week, saying that the economy was likely heading into a recession and the Fed would have to respond with rate cuts.
AUD/USD Technical
- AUD/USD is putting pressure on resistance at 0.6665. This is followed by 0.6761
- 0.6517 and 0.6434 are providing support
EUR/GBP Daily Outlook
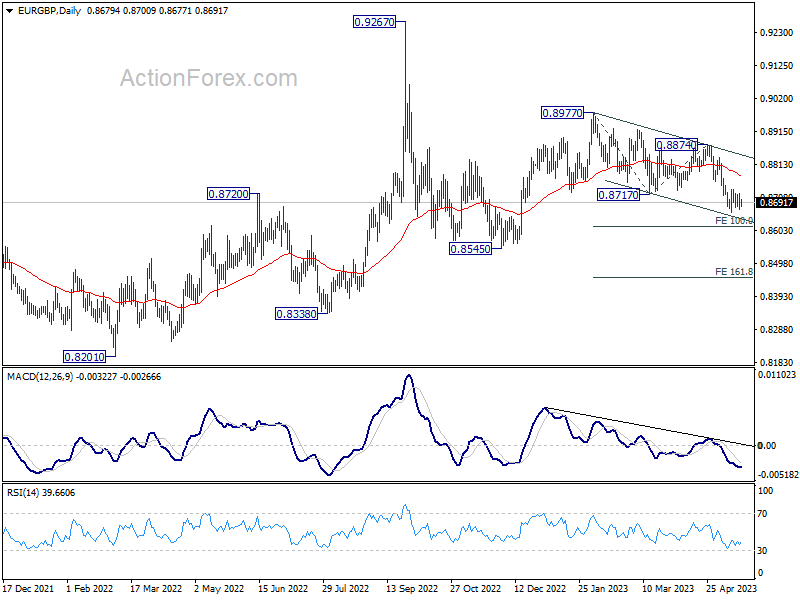
Daily Pivots: (S1) 0.8660; (P) 0.8690; (R1) 0.8711; More...
EUR/GBP is staying in consolidation from 0.8660 and intraday bias remains neutral. Further decline is expected as long as 0.8758 resistance holds. On the downside, break of 0.8660 will resume recent decline to 100% projection of 0.8977 to 0.8717 from 0.8874 at 0.8614. Nevertheless, break of 0.8758 minor resistance will turn bias back to the upside for stronger rebound.
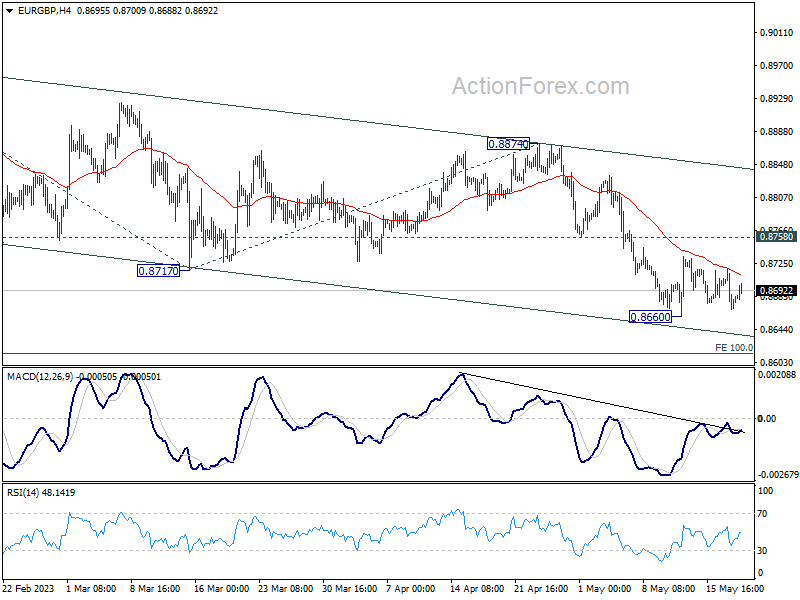
In the bigger picture, current development argues that whole decline from 0.9267 (2022 high) is still in progress. This is part of the long term range pattern from 0.9499 (2020 high). Deeper fall would be seen through 0.8545 support. his will now remain the favored case as long as 0.8874 resistance holds.
EUR/AUD Daily Outlook
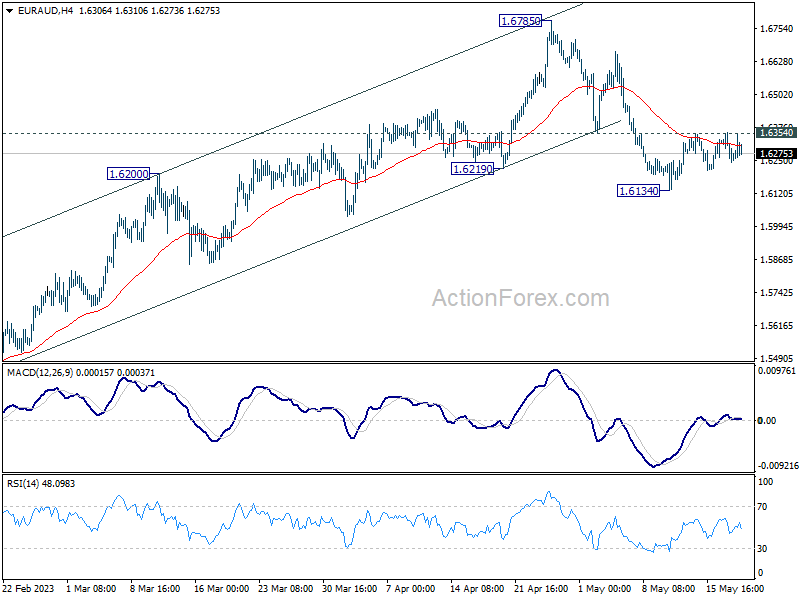
Daily Pivots: (S1) 1.6226; (P) 1.6292; (R1) 1.6342; More...
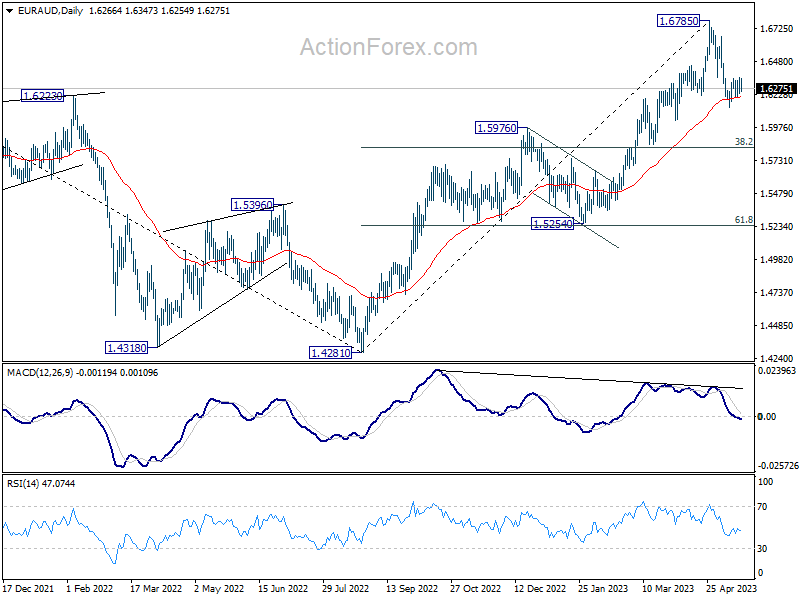
No change in EUR/AUD's outlook and intraday bias stays neutral first. Further decline is expected with 1.6354 minor resistance intact. Considering bearish divergence condition in D MACD, fall from 1.6785 might be a correction to whole up trend from 1.4281. Break of 1.6134 will target 38.2 retracement of 1.4281 to 1.6785 at 1.5828, which is inside 1.5254/5976 support zone. Nevertheless, sustained break of 1.6354 minor resistance will turn bias back to the upside for retesting 1.6785 high instead.
In the bigger picture, whole down trend from 1.9799 (2020 high) should have completed at 1.4281 (2022 low). Further rise should be seen to 61.8% retracement of 1.9799 to 1.4281 at 1.7691 next. For now, outlook will stay bullish as long as 1.5976 resistance turned support holds, even in case of deep pull back.
EUR/JPY Daily Outlook
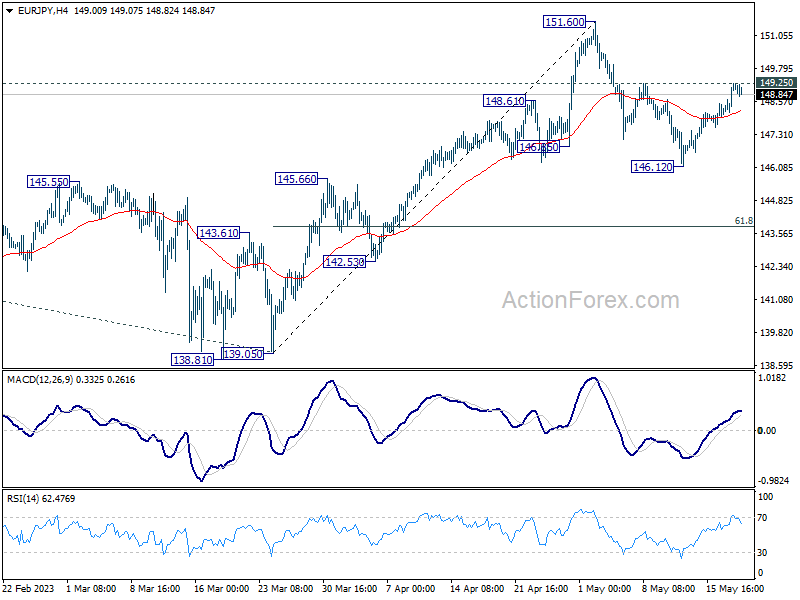
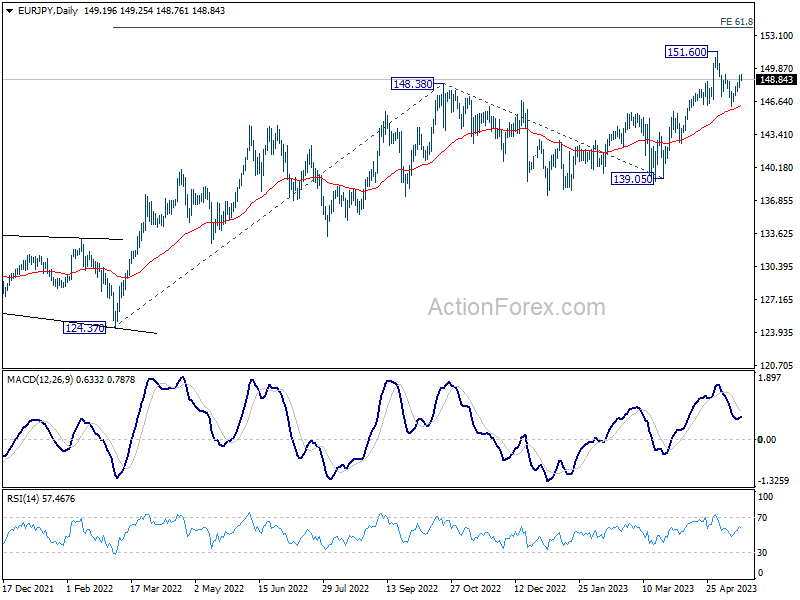
Daily Pivots: (S1) 148.46; (P) 148.86; (R1) 149.65; More....
Intraday bias in EUR/JPY remains neutral first. Firm break of 149.25 resistance will argue that pull back from 151.60 has completed at 146.12 already. Stronger rally should be seen back to retest 151.60. On the downside, however, break of 146.12 will resume the fall to 61.8% retracement of 139.05 to 151.60 at 143.84.
In the bigger picture, rise from 114.42 (2020 low) is in progress. Next target is 61.8% projection of 124.37 to 148.38 from 138.81 at 153.64. Sustained break there will pave the way to 100% projection at 162.82. For now, medium term outlook will remain bullish as long as 139.05 support holds, even in case of deep pull back.
GBP/JPY Daily Outlook
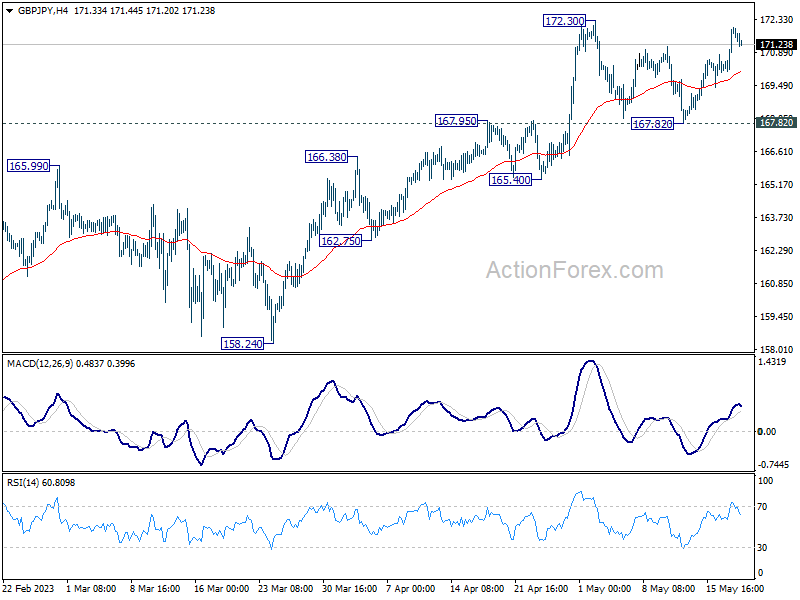
Daily Pivots: (S1) 170.71; (P) 171.36; (R1) 172.60; More...
While GBP/JPY rebounded strongly, upside is limited below 172.30 resistance so far. Intraday bias remains neutral first. On the upside, break of 172.30 will resume larger up trend to 100% projection of 148.93 to 172.11 from 155.33 at 178.51. Nevertheless, firm break of 167.82 support should confirm short term topping, and turn bias back to the downside for deeper pull back to 165.40 support and possible below instead.
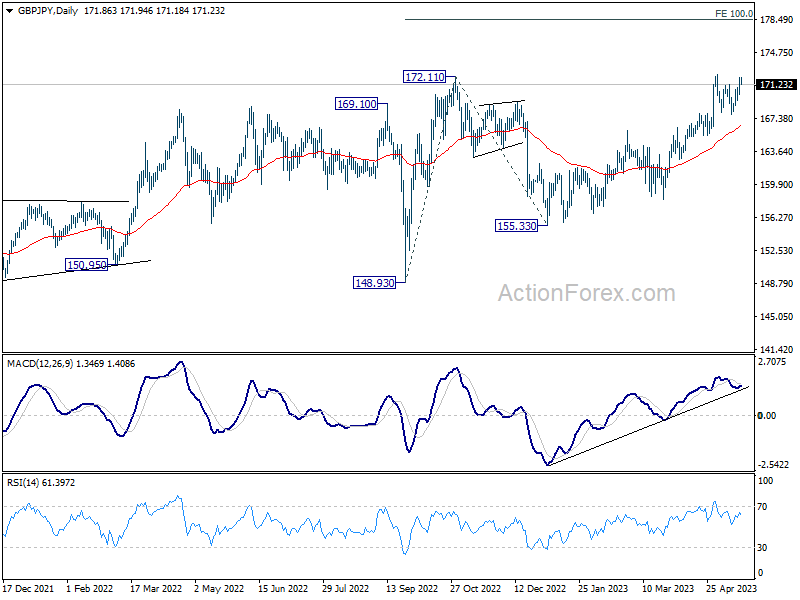
In the bigger picture, focus stays on 172.11 resistance (2022 high). Decisive break there will resume whole up trend from 123.94 (2020 low). Next target will be 161.8% projection of 122.75 (2016 low) to 156.59 (2018 high) from 123.94 at 178.69. Nevertheless, firm break of 165.40 support will indicate rejection by 172.11 and extend the corrective pattern from there with another falling leg.
EUR/CHF Daily Outlook
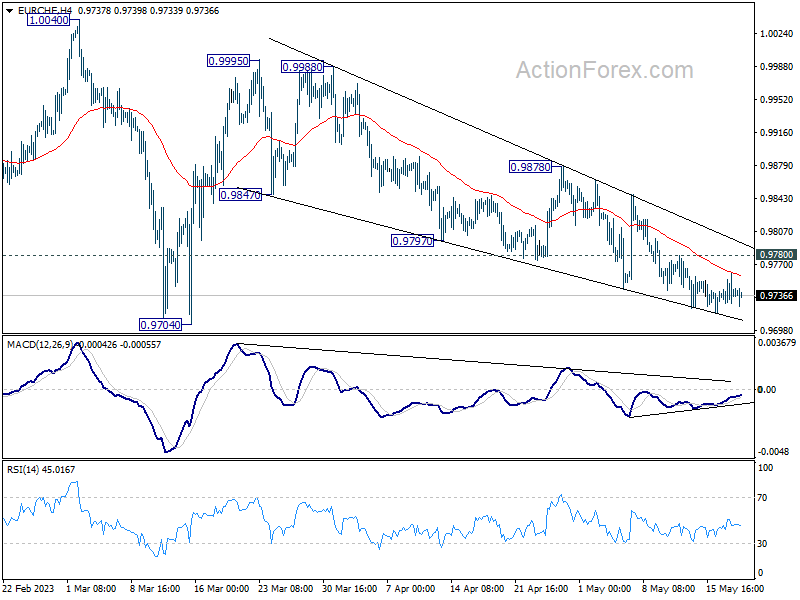
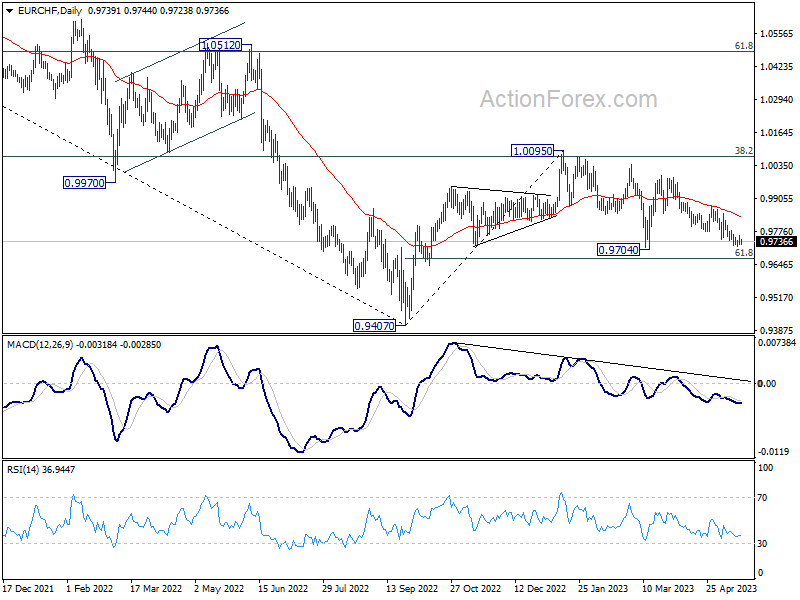
Daily Pivots: (S1) 0.9725; (P) 0.9744; (R1) 0.9759; More...
Outlook in EUR/CHF remains unchanged. Choppy decline from 0.9995 might extend lower. But strong support should be seen from 0.9704 to bring rebound. Break of 0.9847 will argue that the fall has completed and turn bias back to the downside. However, firm break of 0.9704 will resume the whole decline from 1.0095 to 61.8% retracement of 0.9407 to 1.0095 at 0.9670.
In the bigger picture, prior rejection by 38.2% retracement of 1.1149 to 0.9407 at 1.0072 suggests that medium term outlook is staying bearish. The pair is also capped below 55 W EMA (now at 0.9963). Down trend from 1.2004 is not completed yet and is in favor to resume through 0.9407 at a later stage. However, decisive break of 1.0095 resistance will raise the chance of bullish trend reversal. Rise from 0.9407 should then target 1.0505 cluster resistance (2020 low at 1.0505, 61.8% retracement of 1.1149 to 0.9407 at 1.1484).
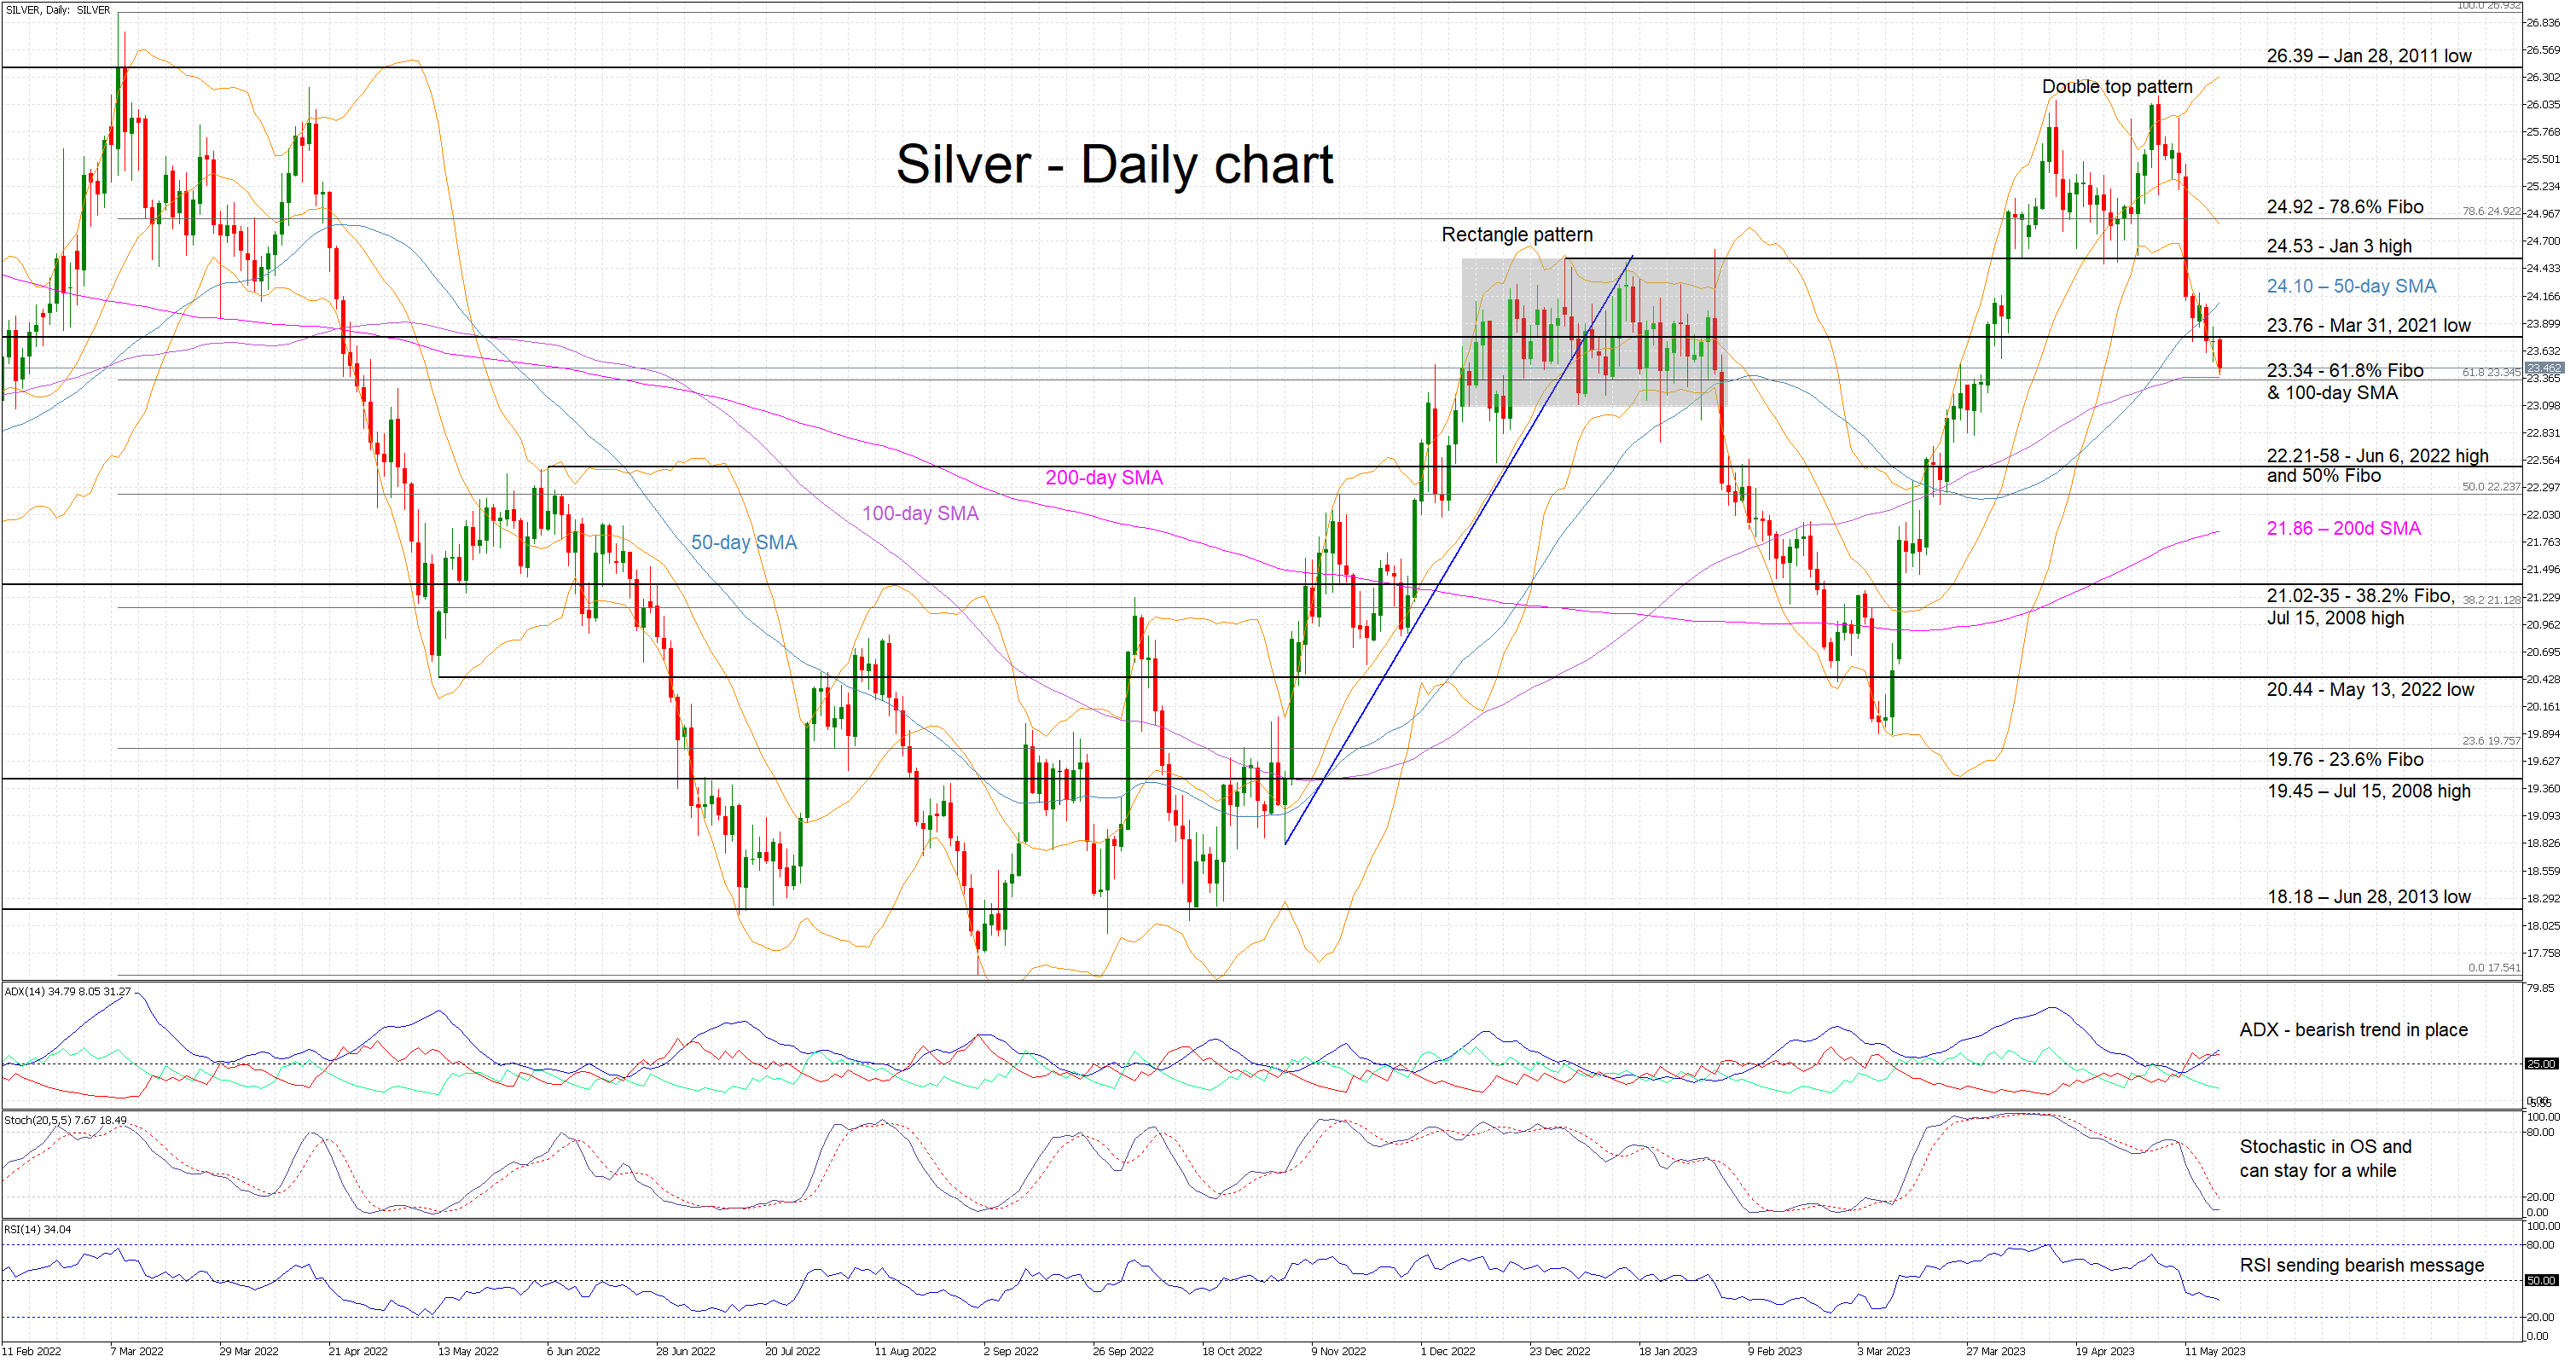
Silver Bears Ride the Curve, Ready to Test Key Support Level
Silver is edging lower today, a continuation of last week's downleg. The recent double top pattern seems to be encouraging this move lower after the break of its neckline at 24.48 on May 11. With this pattern’s target being at around 22.9, the bears could remain confident.
In the meantime, the overall technical picture remains bearish. The Average Directional Movement Index (ADX) is edging higher, confirming the presence of a muted bearish trend in silver, and the RSI has sunk below its 50-threshold. The stochastic oscillator is scraping the bottom of its oversold area and, considering the wider environment, it can stay there for a while.
Amidst this environment, the bears appear to be targeting the 23.34 level populated by the 61.8% Fibonacci retracement of March 8, 2022 – September 1, 2022 downtrend and the 100-day simple moving average (SMA). Should they manage to break this level, they would then come up against the busy 22.21-22.58 area. This range is defined by the June 6, 2022 high and the 50% Fibonacci retracement, and could prove to be a real test of bears’ resolve.
On the other hand, the bulls should not despair. A successful battle for the key 23.34 level would potentially help them build some momentum as they set their eyes on the March 31, 2021 low at 23.76. Higher, the 24.10 and 24.53 levels respectively would be critical for the fate of the current short-term bearish trend.
To conclude, silver bears have been staging an impressive decline since the early May highs. The overall technical picture is still favouring them, but the bulls appear ready for a comeback if 23.34 is not broken convincingly.
WTI Futures Stuck in Range after Bounce Off 17-month Low
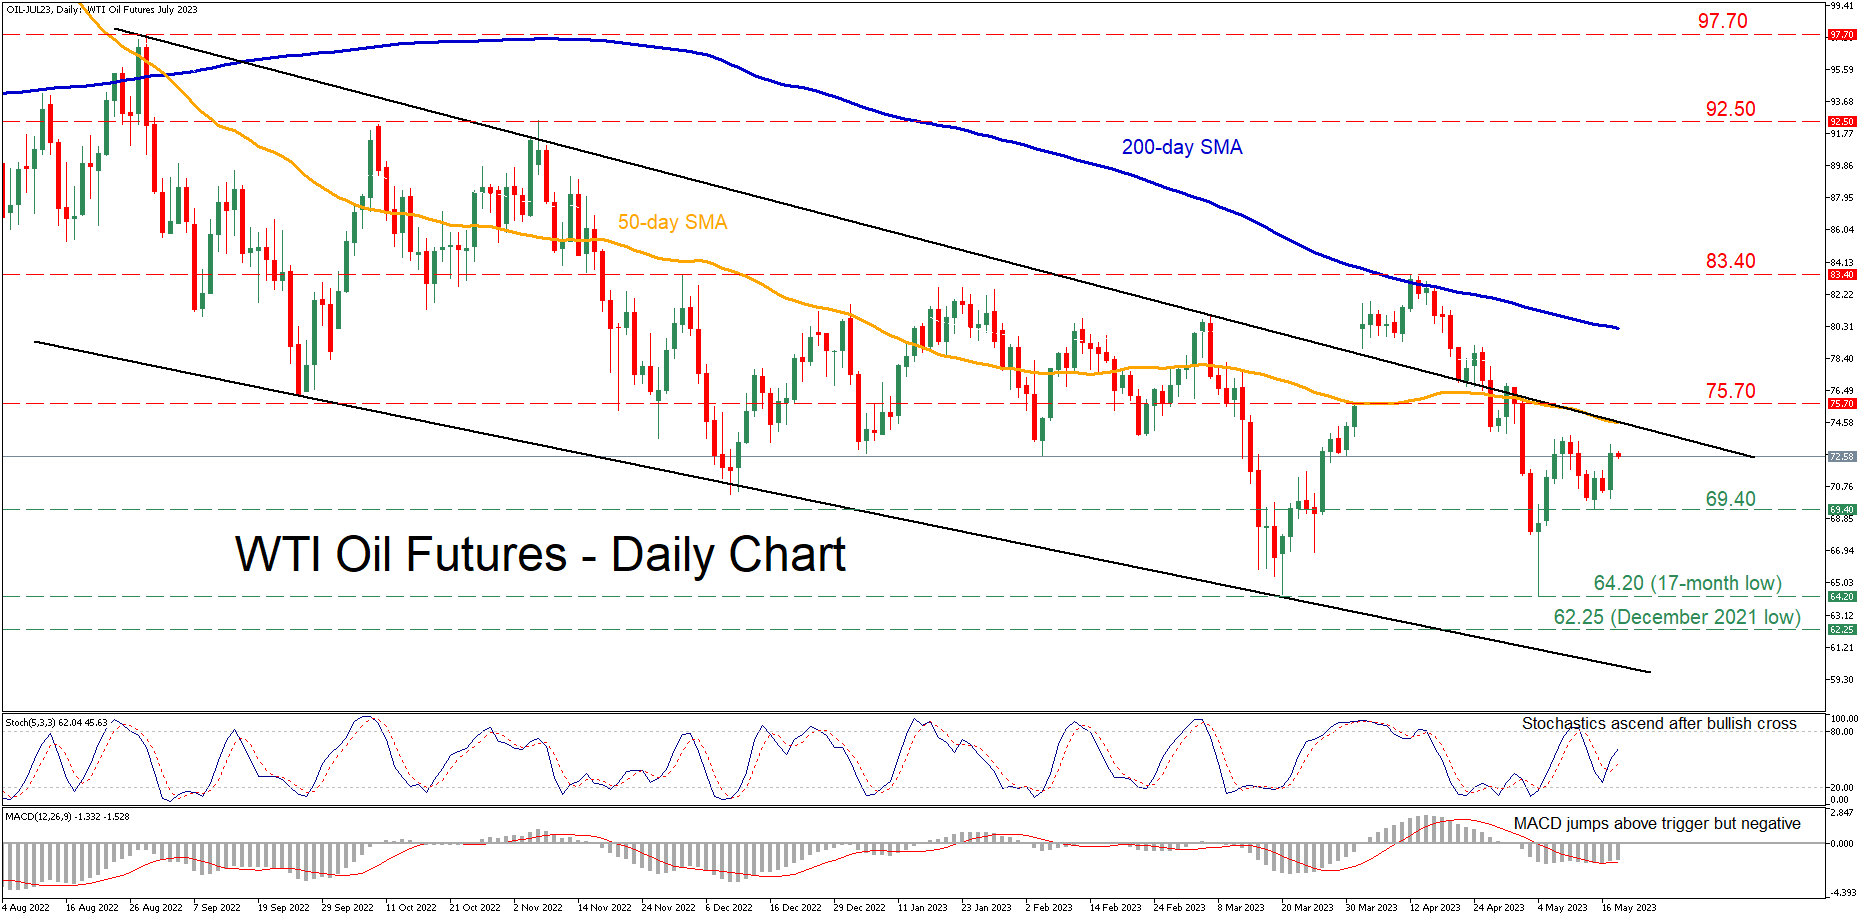
WTI oil futures (July delivery) had been in recovery mode, but the 200-day simple moving average (SMA) recently rejected their latest advance. Since then, the price plummeted to a fresh 17-month low of 64.20 before recouping some losses.
The momentum indicators currently suggest that bearish forces are subsiding but remain in control. Specifically, the stochastic oscillator is ascending after posting a bullish cross, while the MACD jumped above its trigger line in the negative area.
Should buyers re-emerge and push the price higher, immediate resistance could be met at the 75.70 hurdle. Surpassing that zone, the price may ascend to challenge the 2023 peak of 83.40. Further advances could then cease at the November 2022 high of 92.50 before the August 2022 peak of 97.70 comes under examination.
On the flipside, bearish actions could send the price to test the recent support of 69.40. A violation of that zone could open the door for the 17-month low of 64.20. Sliding beneath that floor, the price could descend towards levels not seen in the past few months, where the December 2021 low of 62.25 could provide downside protection.
In brief, WTI oil futures experienced a sharp decline and posted a fresh multi-month low, forming a bullish double-bottom pattern. For that scenario to materialize, the price needs to escape its downward sloping channel to the upside.