Sample Category Title
Nikkei 225 Technical: At the Risk of a Multi-Week Pull-Back
- Nikkei 225 recorded a month-to-day return of +5.80% for May and hit a 33-year high.
- Nikkei 225 outperformed the MSCI All Country World Index on a year-to-date basis (17% vs. 9%).
- Overbought conditions below 30,835 key resistance.
The Japanese stock market has continued to rally and outperformed the rest of the world. The benchmark Nikkei 225 has recorded a month-to-date return of +5.80% for May at this time of the writing that outperformed significantly against the US S&P 500 (-0.26%), MSCI All Country Asia ex Japan (-0.61%), MSCI Emerging Markets (+0.08%) and STOXX Europe 600 (-0.57%).
The reasons and supporting factors for its potential strategic and tactical outperformance that may persist into the second half of 2023 have been highlighted in detail in my previous articles.
The current medium-term uptrend phase of the Nikkei 225 that is in place since its 4 January 2023 low of 25,661 has hit a 52-week and 33-year high at 30,677. In the lens of technical analysis, the price actions of any liquid tradable financial instruments move in cyclical waveforms and not in a vertical fashion where there will be bouts of shorter-term periodic corrections within a higher degree timeframe trending phase as sentiments’ (both rational and irrational) of market participants adjust accordingly via greed and fear with respect to new relevant information.
Right now, after the recent steep rally of the Nikkei 225 in terms of its speed taken to reach such a current high level now faces a risk of a shorter-term corrective movement to retrace some portion of its medium-term uptrend phase from the 4 January 2023 low.
Japan 225 Technical Analysis – Watch the 30,835 key resistance
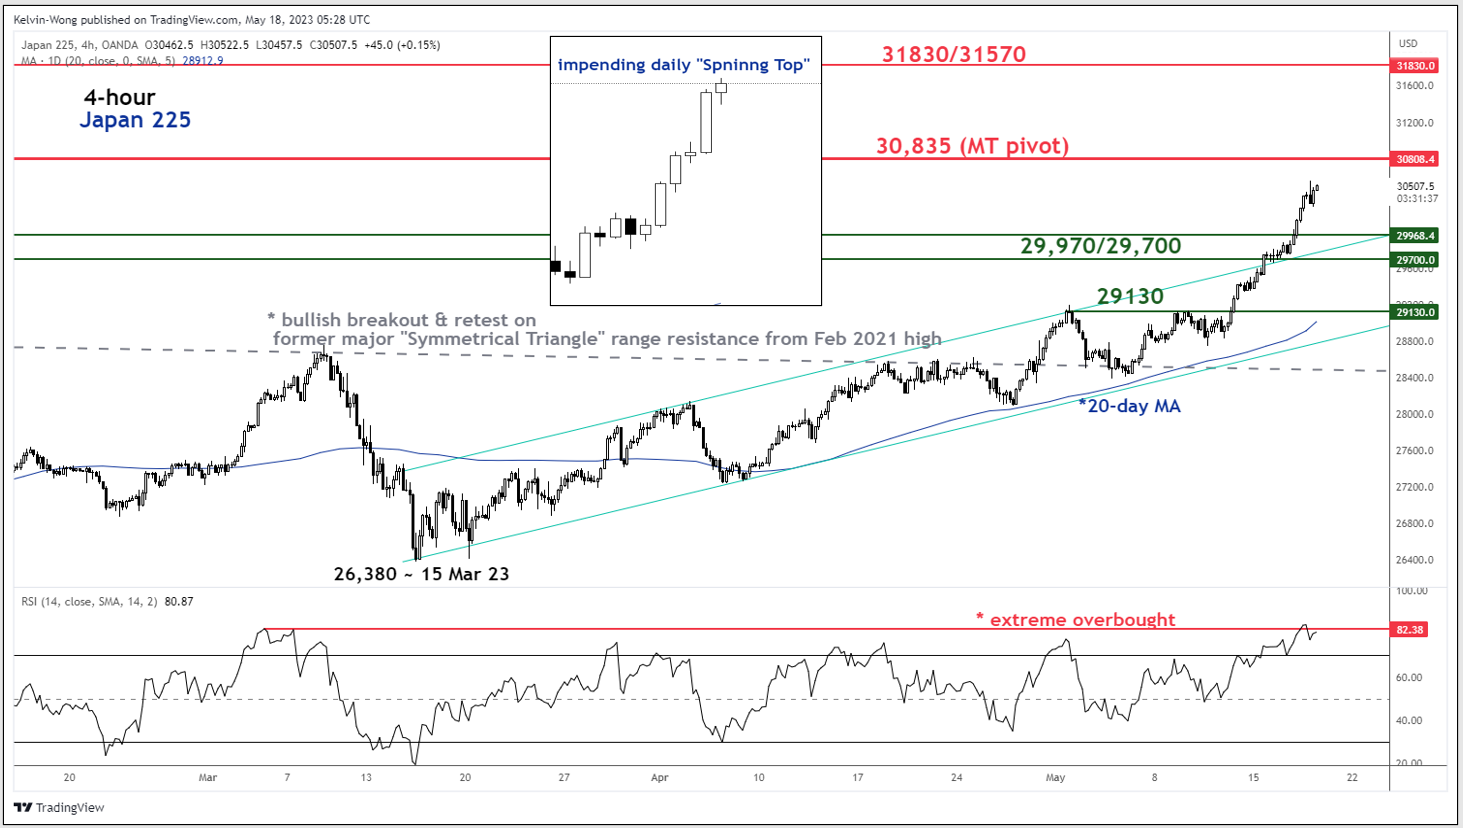
Fig 1: Japan 225 trend as of 18 May 2023 (Source: TradingView, click to enlarge chart)
The Japan 225 Index (a proxy for the Nikkei 225 futures) has formed an impending daily “Spinning Top” bullish exhaustion Japanese candlestick pattern right below a major resistance of 30,835 where the bulls have not managed to stage a breakout on prior two occasions on 15 February 2021 and 13 September 2021.
In the shorter term as seen on the 4-hour, the price actions of the Index have accelerated to the upside on 15 May 2023 via its bullish breakout of the upper boundary of the minor ascending channel from mid-March 2023 and the 4-hour RSI oscillator has reached an extreme overbought level of 82% since 5 March 2023.
These observations suggest an overstretched up move for the Index and the odds have increased for a potential short-term (multi-week) corrective pull-back within a medium-term (multi-month) uptrend phase that is still intact at this junction.
The immediate support to watch will be at 29,970/29,700 and a break below 29,700 exposes the next support at 29,130 which also confluences with the upward-sloping 20-day moving average.
On the other hand, a clearance with a 4-hour close above 30,835 sees the next resistance zone coming in at 31,830/31,570, defined by a cluster of Fibonacci extension levels and the former swing lows area of 18/25 June 1990.
Technical Outlook and Review
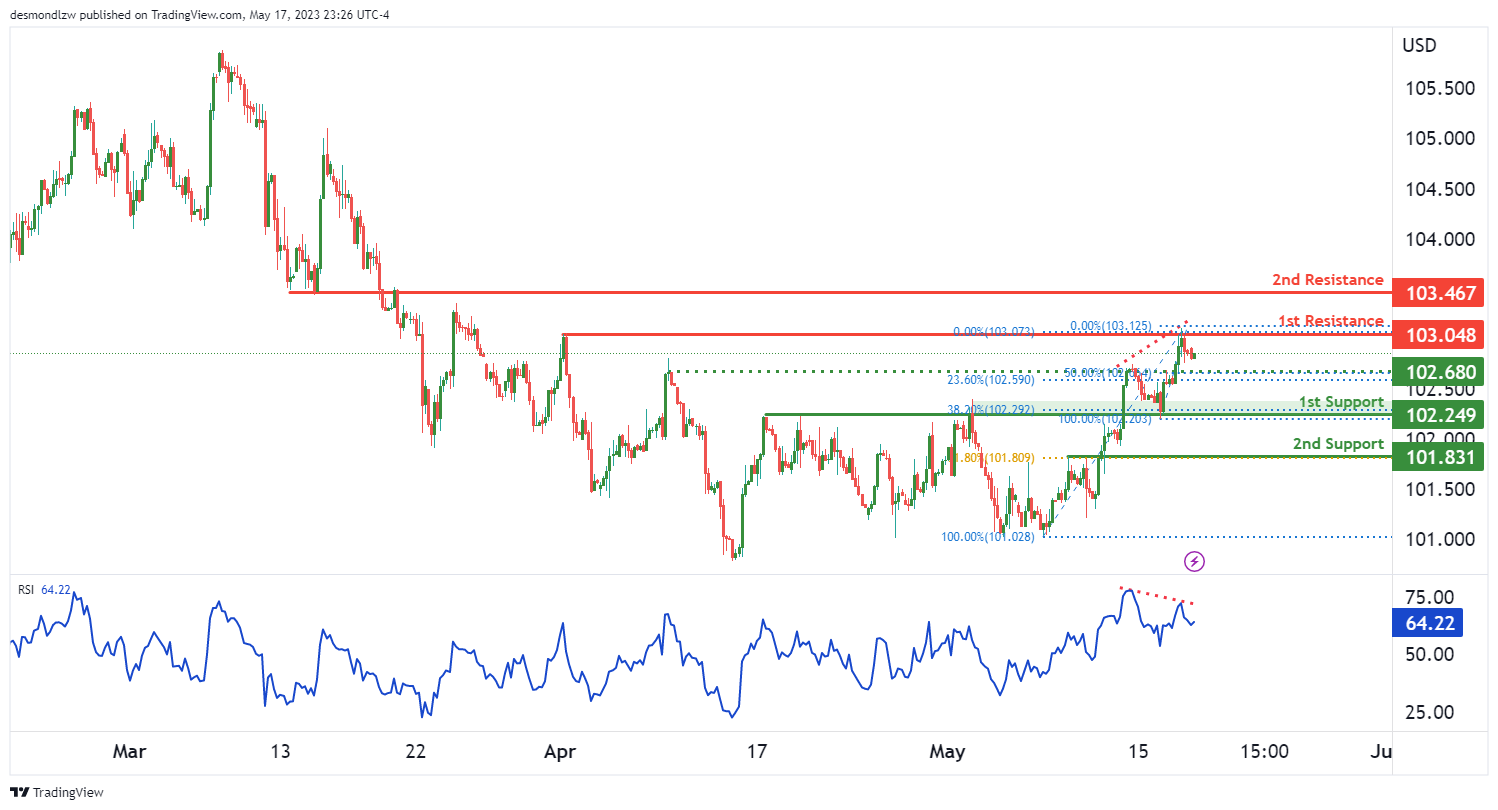
DXY:
The DXY (US Dollar Index) chart currently indicates bearish momentum, suggesting the potential for further downward movement.
In the near term, there is a possibility of a bearish continuation towards the first support level at 102.24. This level is recognized as an overlap support and coincides with a 38.20% Fibonacci retracement, enhancing its significance.
Additional support can be found at the second support level of 101.83, which is identified as a pullback support and aligns with a 61.80% Fibonacci retracement.
On the resistance side, the first resistance level is at 103.04, characterized as a multi-swing high resistance. There is also a second resistance level at 103.46, considered an overlap resistance.
Furthermore, an intermediate support level at 102.68 is observed, serving as a pullback support. This level exhibits a Fibonacci confluence, with a 23.60% Fibonacci retracement and a 50% Fibonacci retracement.
Supporting the bearish case is the bearish divergence displayed by the RSI indicator compared to the price. This suggests the potential for a rapid decline in price.
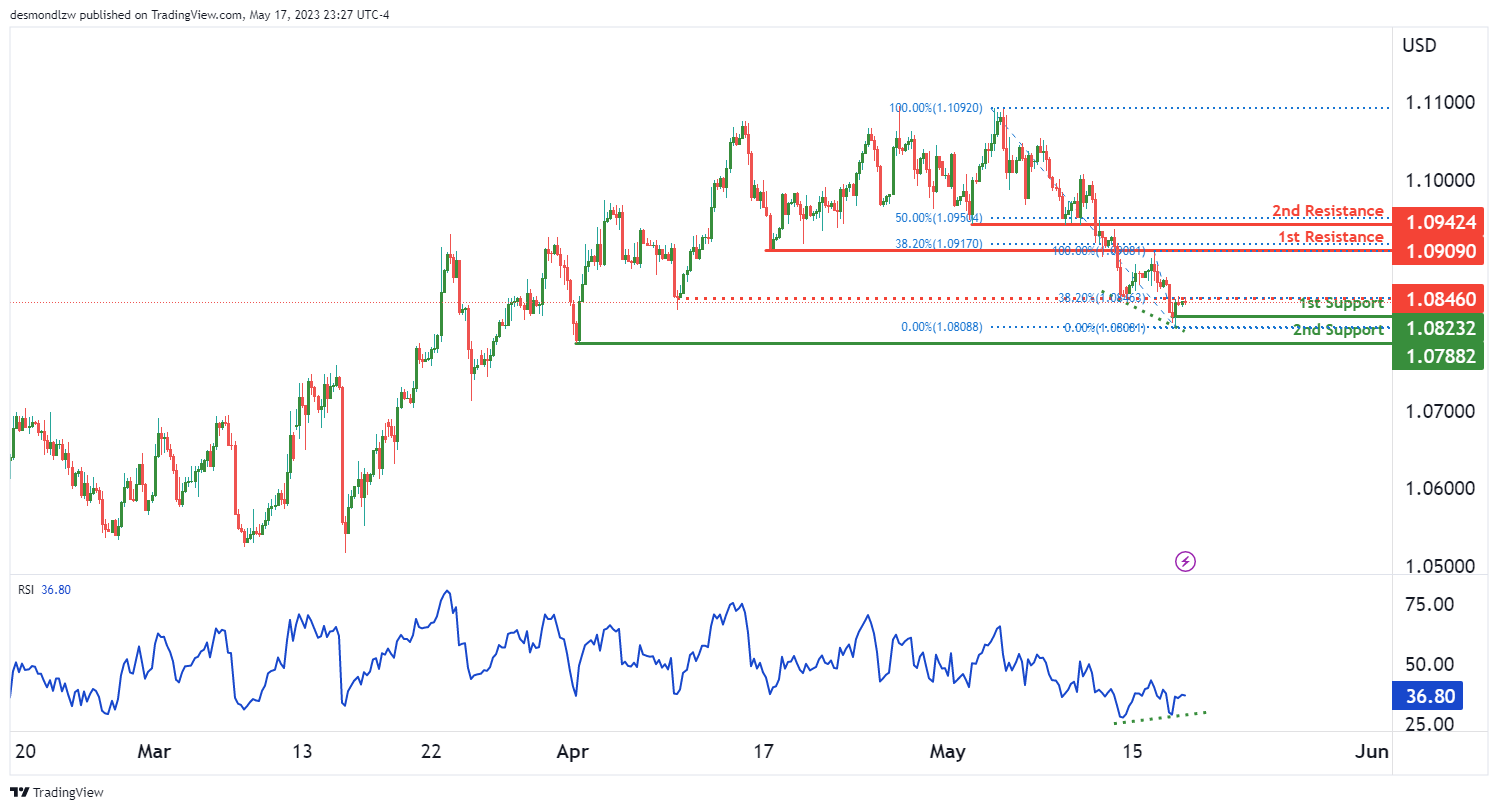
EUR/USD:
The EUR/USD chart currently demonstrates bullish momentum, indicating the potential for further upward movement.
In the near term, there is a possibility of a bullish continuation towards the first resistance level at 1.0909. This level is characterized as an overlap resistance and coincides with a 38.20% Fibonacci retracement, adding to its significance.
Support levels are also present to provide potential price floors. The first support level is at 1.0823, identified as a swing low support. Additionally, the second support level is at 1.0788, also recognized as a swing low support.
Furthermore, there is an intermediate resistance level at 1.0846, which is an overlap resistance. This level aligns with a 38.20% Fibonacci retracement, further reinforcing its importance.
An additional factor supporting the bullish case is the bullish divergence observed in the RSI indicator when compared to the price. This suggests the potential for a rapid increase in price.
GBP/USD:
The GBP/USD chart currently exhibits bullish momentum, indicating the potential for further upward movement.
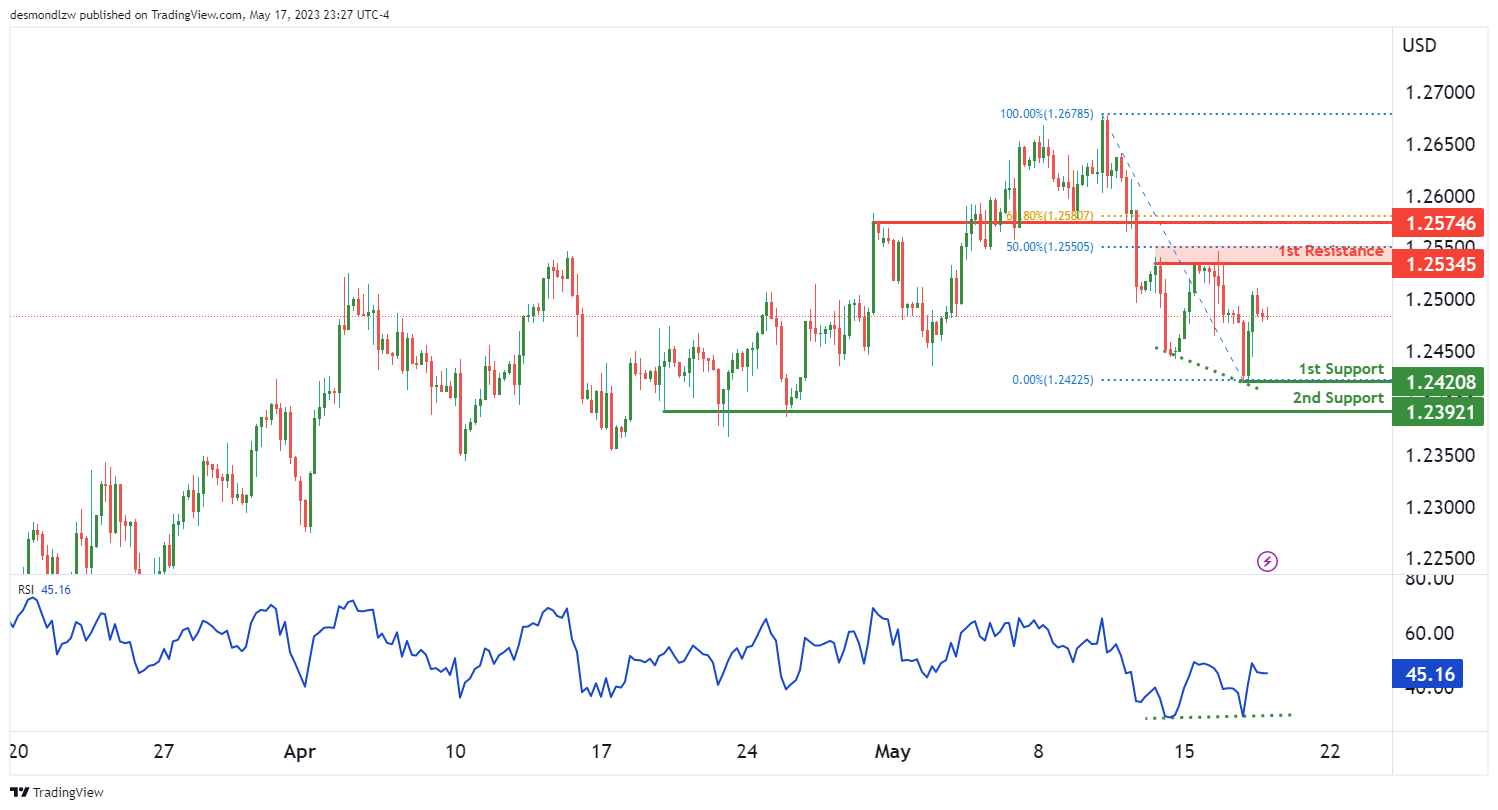
In the near term, there is a possibility of a bullish continuation towards the first resistance level at 1.2534. This level is identified as a multi-swing high resistance and coincides with a 50% Fibonacci retracement, adding to its significance.
Additional support can be found at the second support level of 1.2574, which is recognized as a pullback resistance and aligns with a 61.80% Fibonacci retracement.
On the support side, the first support level is at 1.2420, characterized as a swing low support. There is also a second support level at 1.2392, identified as a multi-swing low support.
In support of the bullish case, the RSI indicator displays bullish divergence compared to the price. This suggests the likelihood of a rapid increase in price.
USD/CHF:
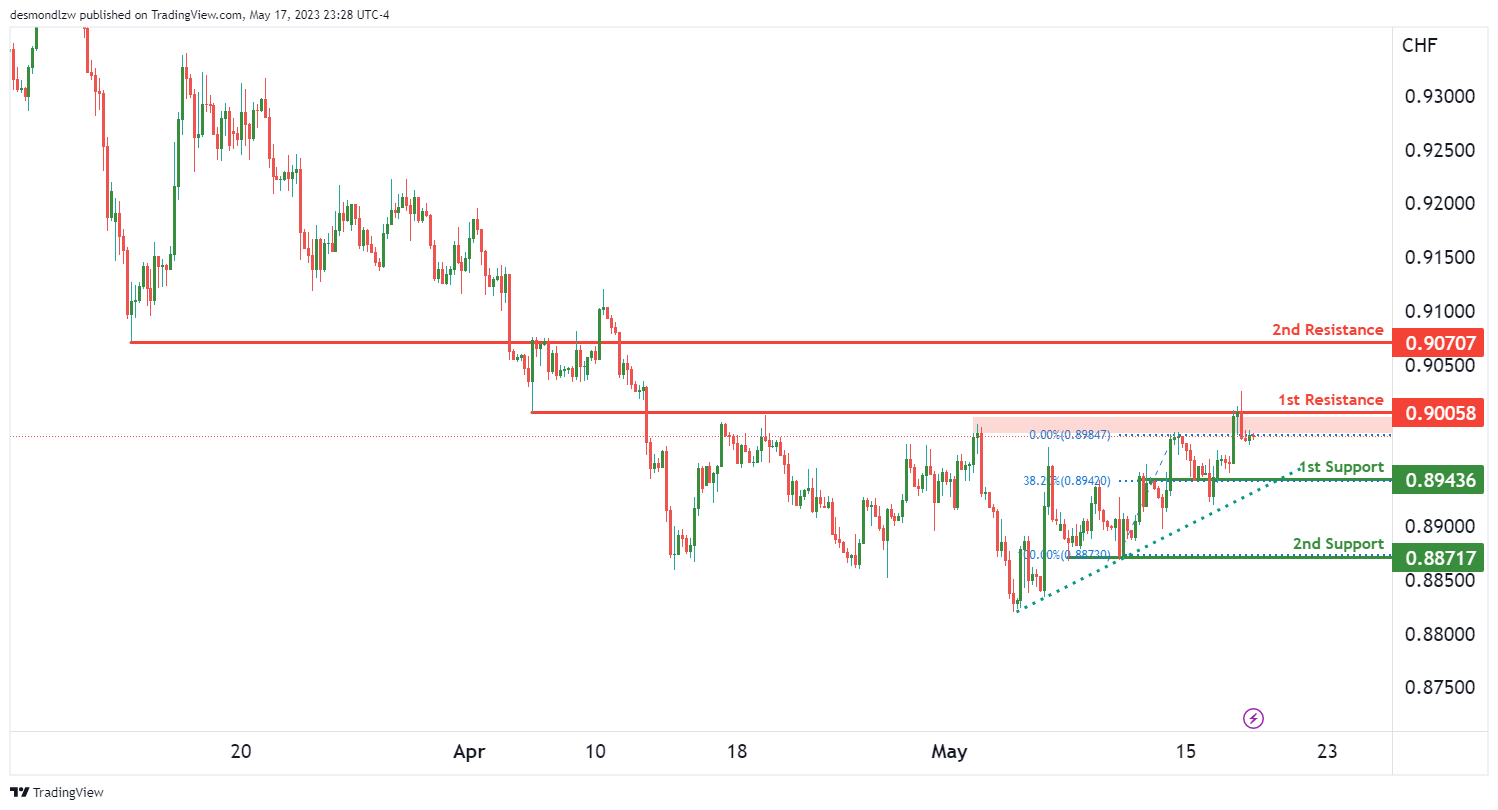
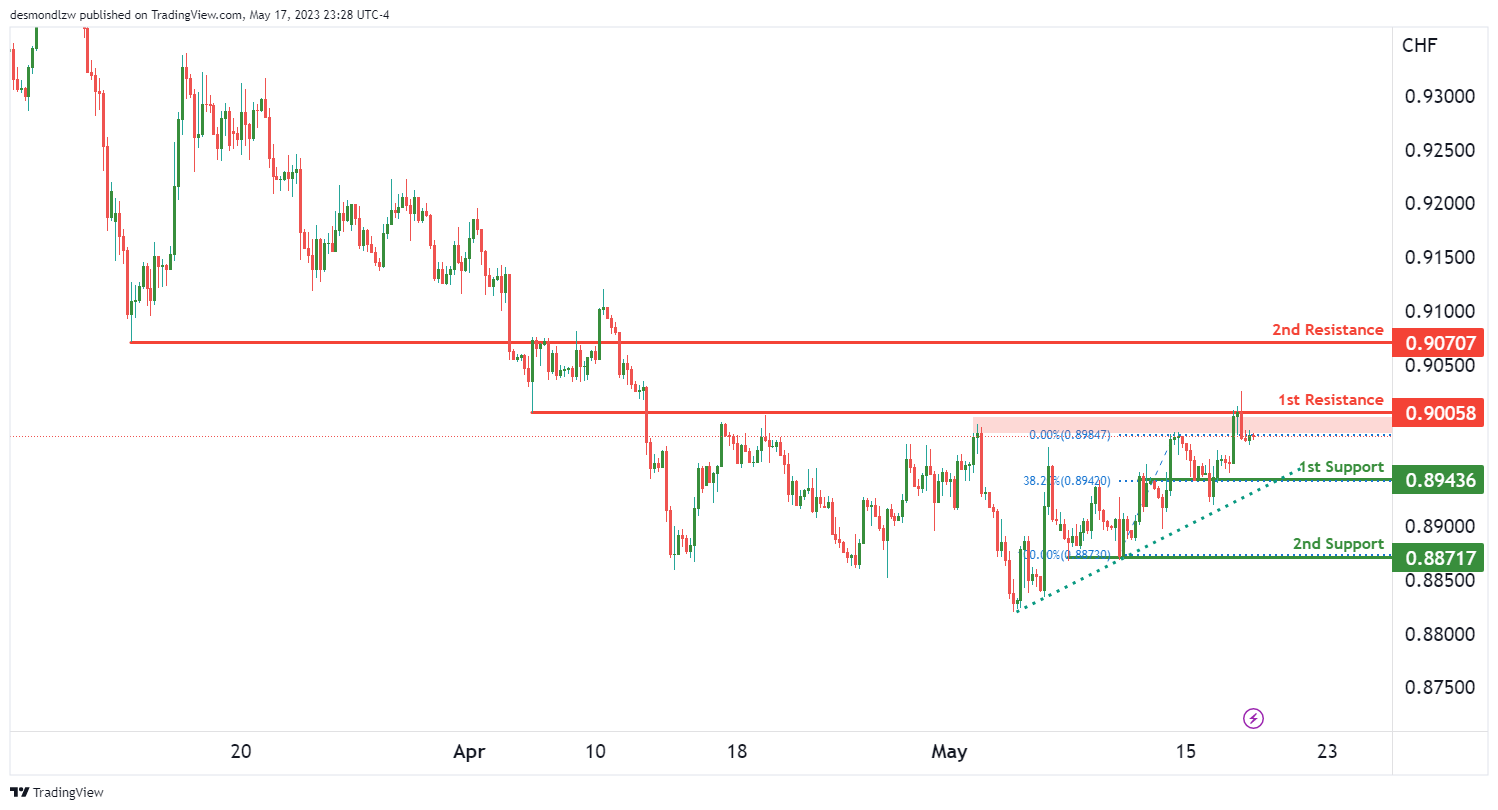
The USD/CHF chart currently demonstrates bullish momentum, with price positioned above a major ascending trend line, suggesting the potential for further upward movement.
In the short term, there is a possibility of a drop towards the first support level at 0.8943 before bouncing from that level and rising towards the first resistance.
The first support level at 0.8943 is identified as an overlap support and coincides with a 38.20% Fibonacci retracement, indicating its significance as a potential price floor.
In the event of a further drop, the second support level at 0.8871 can provide additional support. This level is recognized as a multi-swing low support.
On the resistance side, the first resistance level at 0.9950 is an overlap resistance level. Further upward movement could encounter resistance at this level.
There is also a second resistance level at 0.9070, identified as a pullback resistance, which may pose additional hurdles for the price.
USD/JPY:
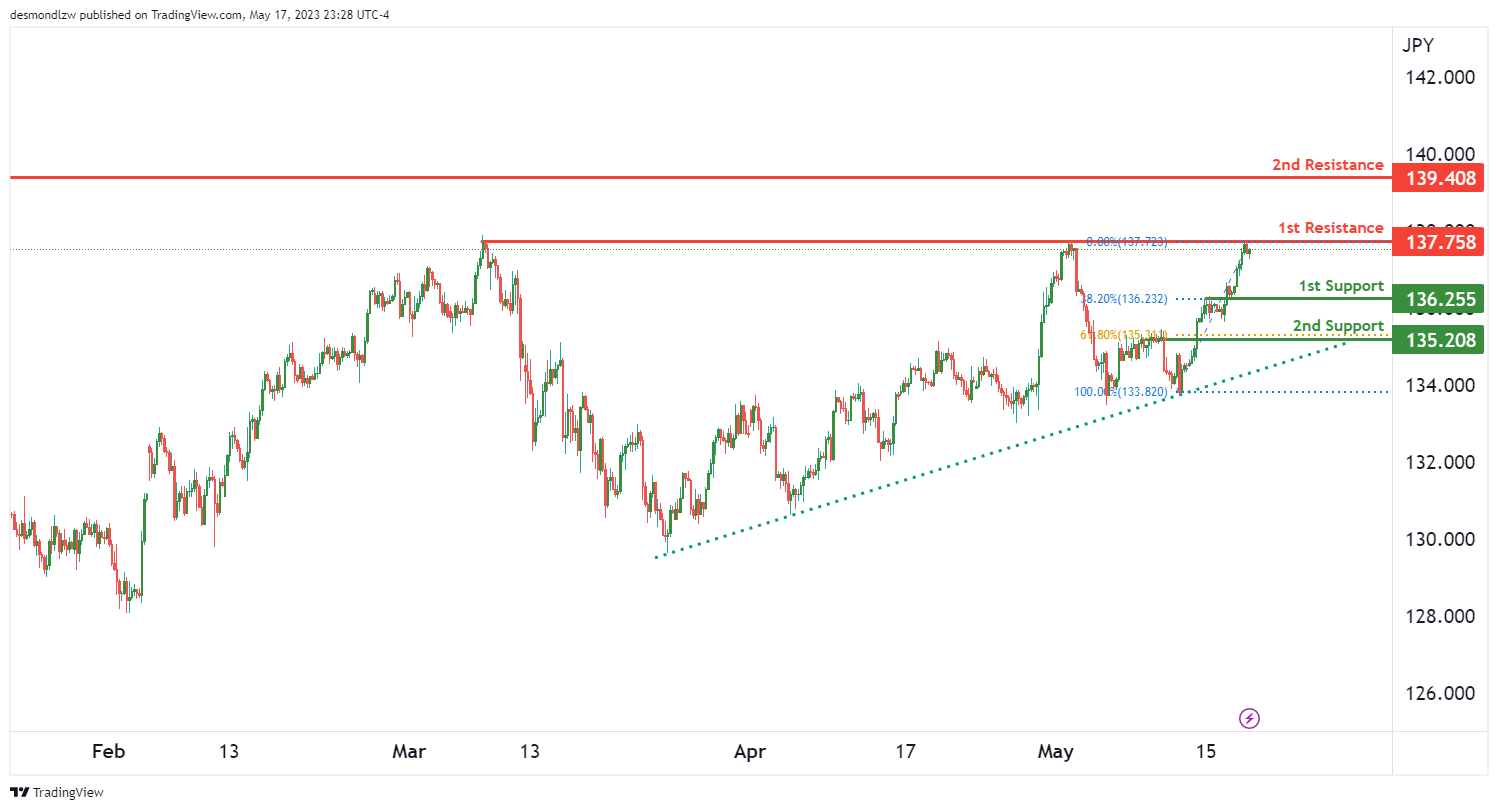
The USD/JPY chart is currently showing bullish momentum, with price positioned above a major ascending trend line, suggesting the potential for further upward movement.
In the short term, there is a possibility of a drop towards the first support level at 136.25 before bouncing from that level and rising towards the first resistance.
The first support level at 136.25 is identified as an overlap support and coincides with a 38.20% Fibonacci retracement, indicating its significance as a potential price floor.
In the event of a further drop, the second support level at 135.20 can provide additional support. This level is recognized as a pullback support and coincides with a 61.80% Fibonacci retracement.
On the resistance side, the first resistance level at 137.75 is an overlap resistance level. Further upward movement could encounter resistance at this level.
There is also a second resistance level at 139.40, which is a swing high resistance. This level may pose a significant hurdle for the price.
Considering these factors, the overall momentum of the USD/JPY chart is bullish, suggesting the potential for a drop towards the first support level before a bounce and subsequent rise towards the first resistance level.
AUD/USD:
The AUD/USD chart is currently displaying bullish momentum, indicating the potential for further upward movement.
In line with this bullish momentum, there is a possibility of a bullish continuation towards the first resistance level at 0.6707.
To support this potential upward movement, there are two levels of support. The first support level is at 0.6635, identified as an overlap support. This level may provide a price floor and support any potential pullbacks.
The second support level is at 0.6582, recognized as a swing low support. This level also contributes to the overall bullish bias.
On the resistance side, the first resistance level at 0.6707 is a multi-swing high resistance level. If the price continues to rise, it may encounter resistance at this level.
Additionally, there is a second resistance level at 0.6750, identified as a pullback resistance. This level, coinciding with a 61.80% Fibonacci retracement, could present a stronger barrier for the price.
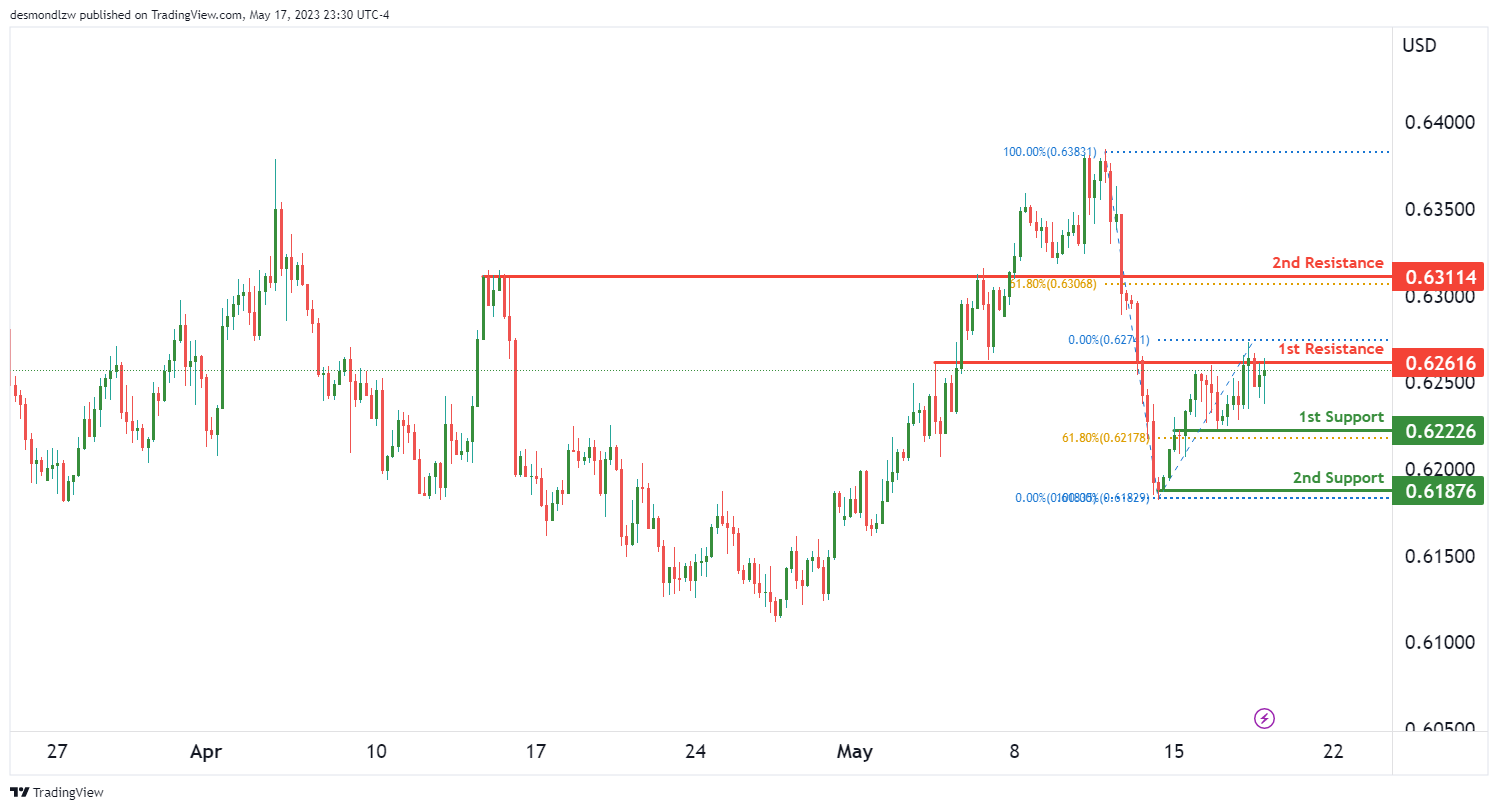
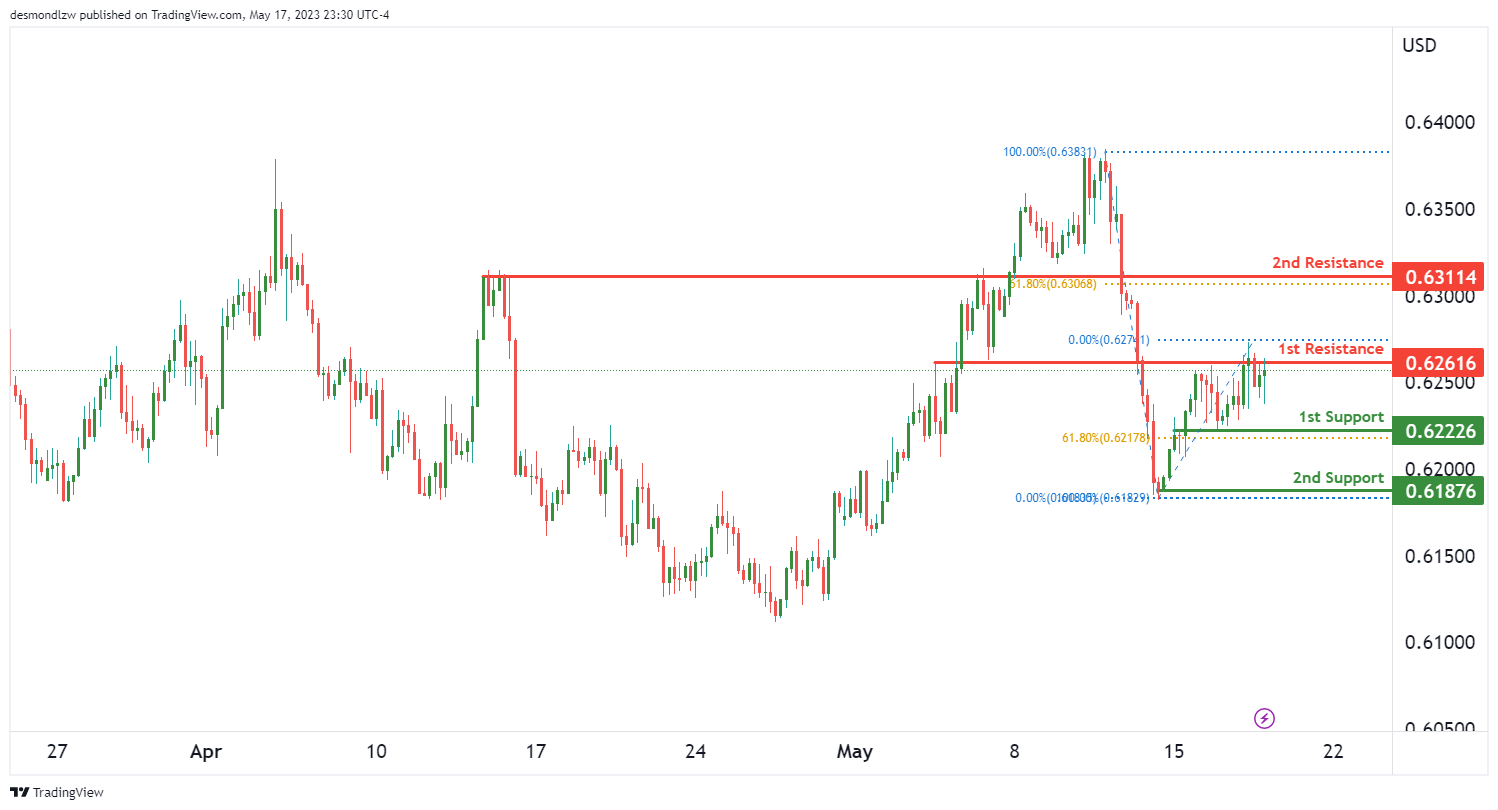
NZD/USD
The NZD/USD chart is currently exhibiting bullish momentum, indicating the potential for further upward movement.
In the short term, there is a possibility of a drop towards the first support level at 0.6222. This support level is identified as an overlap support and coincides with a 61.80% Fibonacci retracement, suggesting it could act as a strong price floor.
If the price reaches the first support and bounces from there, it could potentially rise towards the first resistance level at 0.6261. This resistance level is recognized as an overlap resistance.
Furthermore, there is a second support level at 0.6187, identified as a multi-swing low support, which provides additional support if the price were to drop further.
On the resistance side, the second resistance level at 0.6311 is a pullback resistance. This level, coinciding with a 61.80% Fibonacci retracement, could present a stronger barrier for the price.
Overall, the momentum of the NZD/USD chart is bullish, suggesting the potential for a drop to the first support level in the short term, followed by a bounce and a rise towards the first resistance level.
USD/CAD:
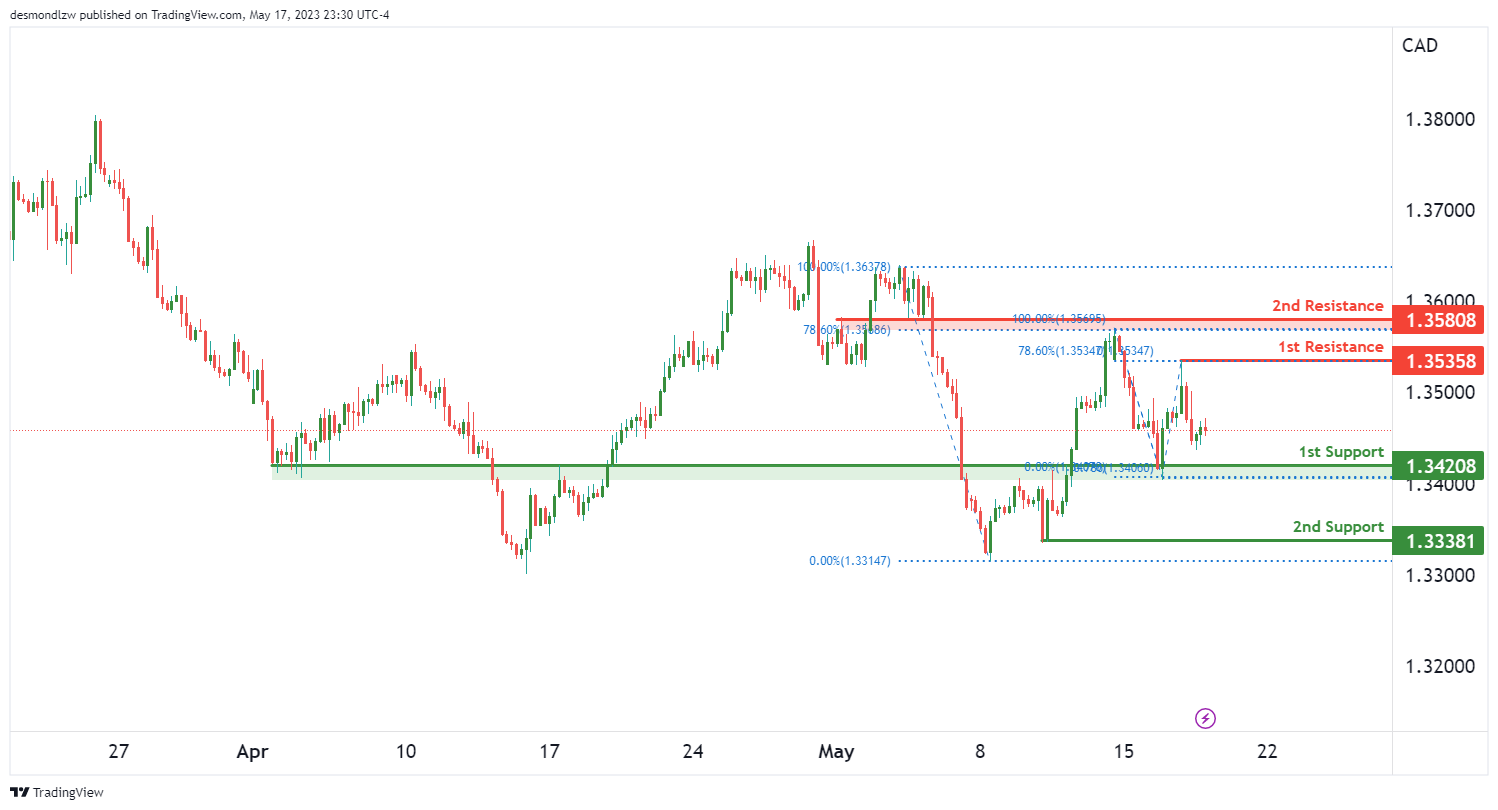
The USD/CAD chart is currently exhibiting bullish momentum, indicating the potential for further upward movement.
In the short term, there is a possibility of a bullish continuation towards the first resistance level at 1.3535. This resistance level is identified as a swing high resistance and coincides with a 78.60% Fibonacci retracement, suggesting it could pose a significant challenge for the price.
On the support side, the first support level at 1.3420 is recognized as an overlap support. This level may provide support if the price were to drop.
Additionally, there is a second support level at 1.3338, identified as a swing low support, which provides further support if the price were to drop.
For further upward movement, the second resistance level at 1.3580 is a pullback resistance. This level, coinciding with a 78.60% Fibonacci retracement, could present a stronger barrier for the price.
DJ30:
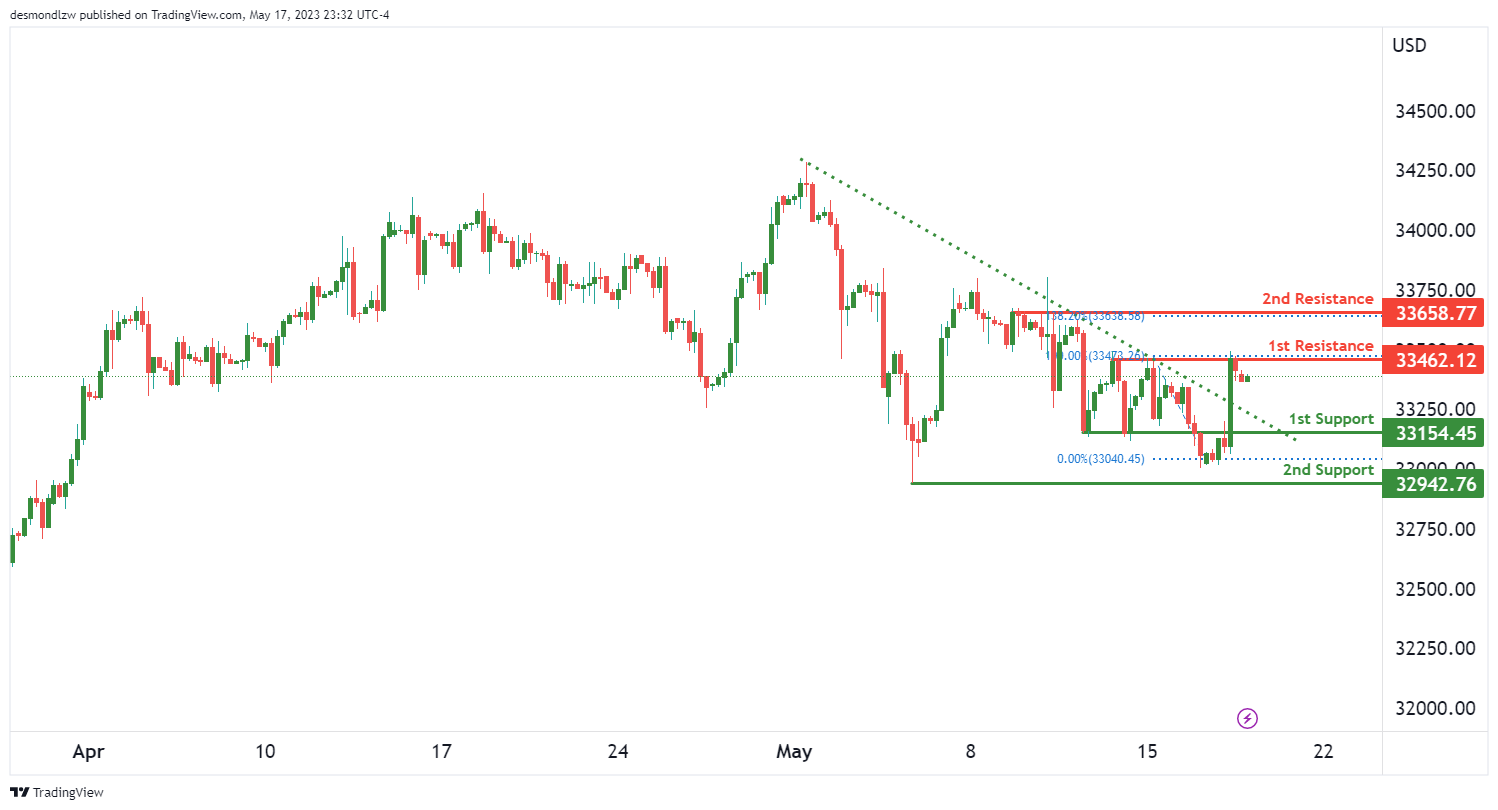
The DJ30 (Dow Jones Industrial Average) chart is currently displaying bullish momentum, suggesting the potential for further upward movement.
One of the factors contributing to this momentum is that the price has broken above a descending resistance line, triggering a potential bullish move.
In terms of potential price action, there is a possibility of a bullish breakout through the first resistance level at 33462.12. This level is identified as a multi-swing high resistance, indicating it could pose a significant challenge for the price. If the price successfully breaks through this level, it may rise towards the second resistance level at 33658.77. This level is also a multi-swing high resistance and coincides with a 138.20% Fibonacci extension, suggesting it could provide strong resistance.
On the support side, the first support level is at 33154.45, which is identified as a pullback support. This level may provide support if the price were to drop. Additionally, there is a second support level at 32942.76, recognized as a swing low support, providing further potential support for the price.
GER30:
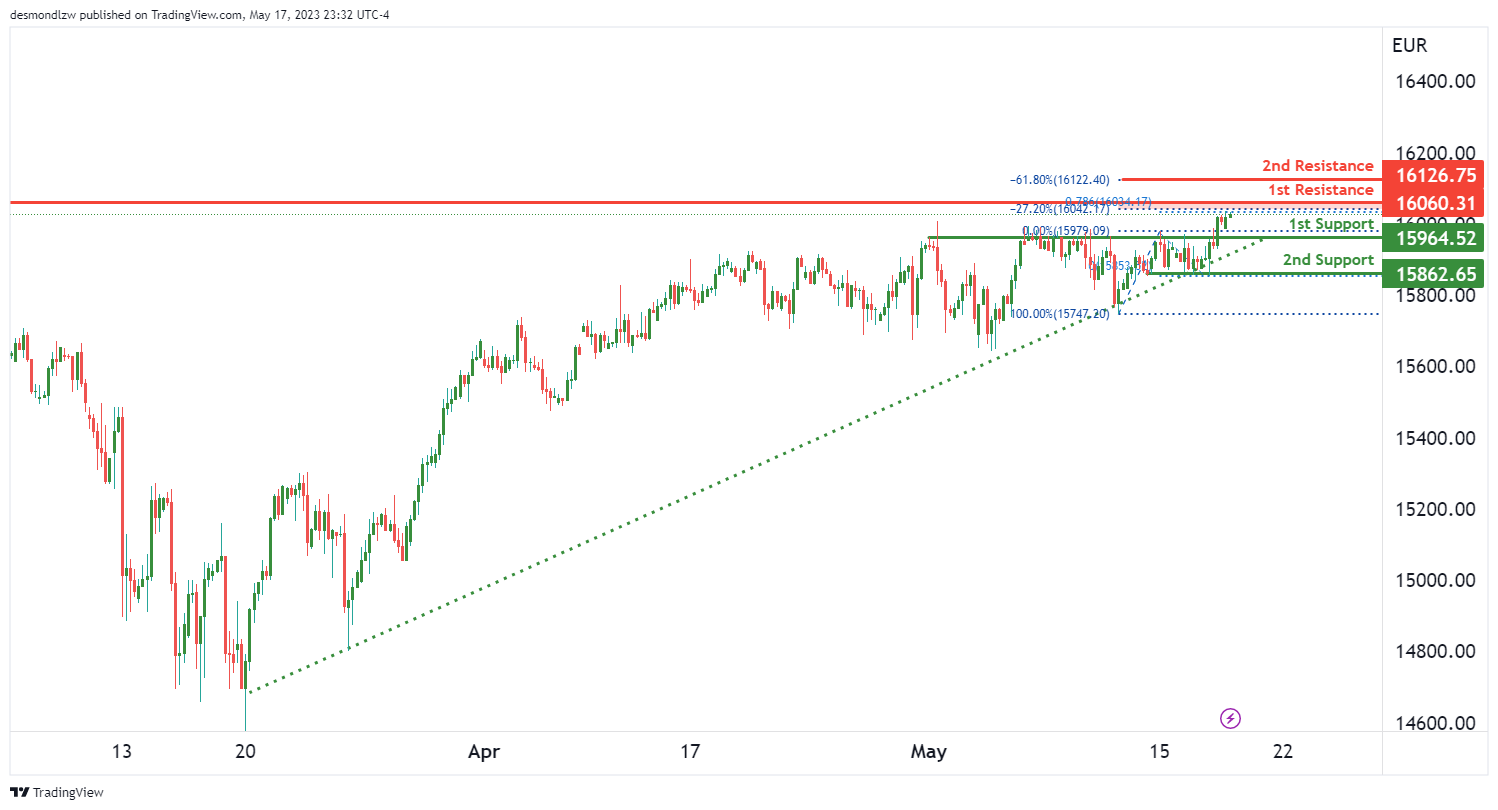
The GER30 (DAX 30) chart is currently showing bullish momentum, indicating the potential for further upward movement.
One of the factors contributing to this momentum is that the price is above a major ascending trend line, suggesting the presence of bullish momentum. Additionally, there is an ascending trend line acting as support, further reinforcing the bullish sentiment.
In terms of potential price action, there is a possibility of a bullish breakout through the first resistance level at 16060.31. This level is identified as a swing high resistance and may pose a challenge for the price. If the price successfully breaks through this level, it could potentially rise towards the second resistance level at 16126.75. This level is associated with a -61.8% Fibonacci expansion, which adds to its significance as a potential resistance level.
On the support side, the first support level is at 15964.52, identified as an overlap support. This level may provide support if the price were to drop. Additionally, there is a second support level at 15862.65, recognized as a multi-swing low support, which could provide additional support for the price.
BTC/USD:
The BTC/USD chart is currently showing bearish momentum, indicating a potential downward movement.
One of the factors contributing to this bearish momentum is that the price is below a major descending trend line, suggesting the presence of ongoing bearish pressure.
In terms of potential price action, there is a possibility of a bearish continuation towards the first support level at 26540. This level is identified as an overlap support and may act as a price floor. If the bearish momentum persists, the price could potentially drop further towards the second support level at 25807, which is recognized as a swing low support.
On the resistance side, the first resistance level is at 27675, identified as an overlap resistance. This level coincides with a 78.60% Fibonacci retracement and a 61.80% Fibonacci projection, indicating it is a significant level of resistance. Additionally, there is a second resistance level at 28291, which is also an overlap resistance.
Overall, the momentum of the BTC/USD chart is bearish, and there is a potential for a bearish continuation towards the first support level.
US500
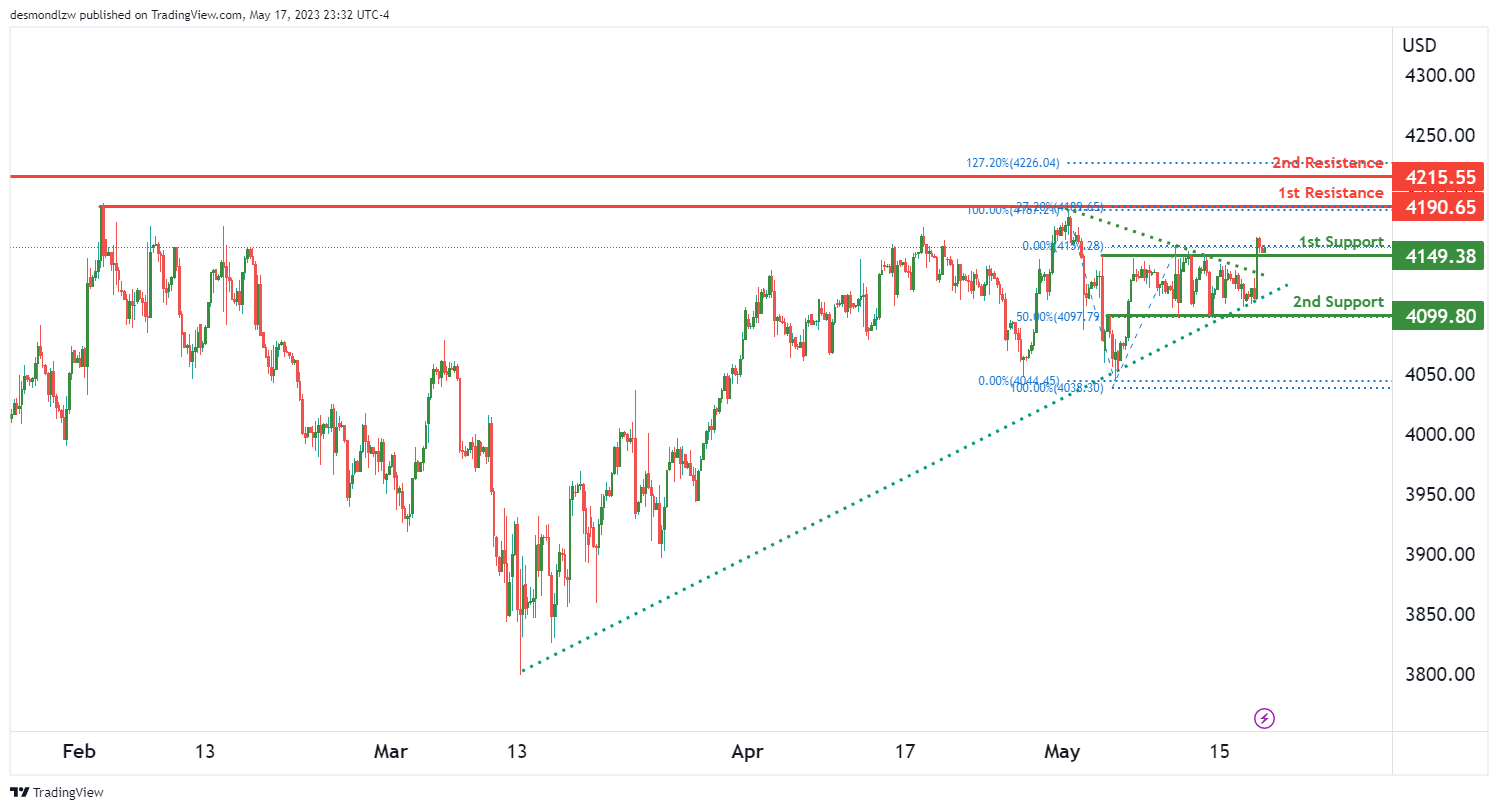
The US500 chart is currently displaying bullish momentum, indicating a potential upward movement.
There is a possibility of a bullish continuation towards the first resistance level at 4190.65. This level is identified as a multi-swing high resistance and could pose a significant challenge for the price. If the bullish momentum continues, the price could potentially rise further towards the second resistance level at 4215.55, which is a swing high resistance and coincides with a 127.20% Fibonacci retracement.
On the support side, the first support level is at 4149.38, identified as a pullback support. This level could potentially act as a price floor. If the price were to drop, the second support level at 4099.80, an overlap support, could provide additional support. It coincides with a 50% Fibonacci retracement, making it a significant level to watch.
Additionally, a symmetrical triangle chart pattern is observed, and a breakout from the upper trendline indicates the start of a new bullish trend.
ETH/USD:
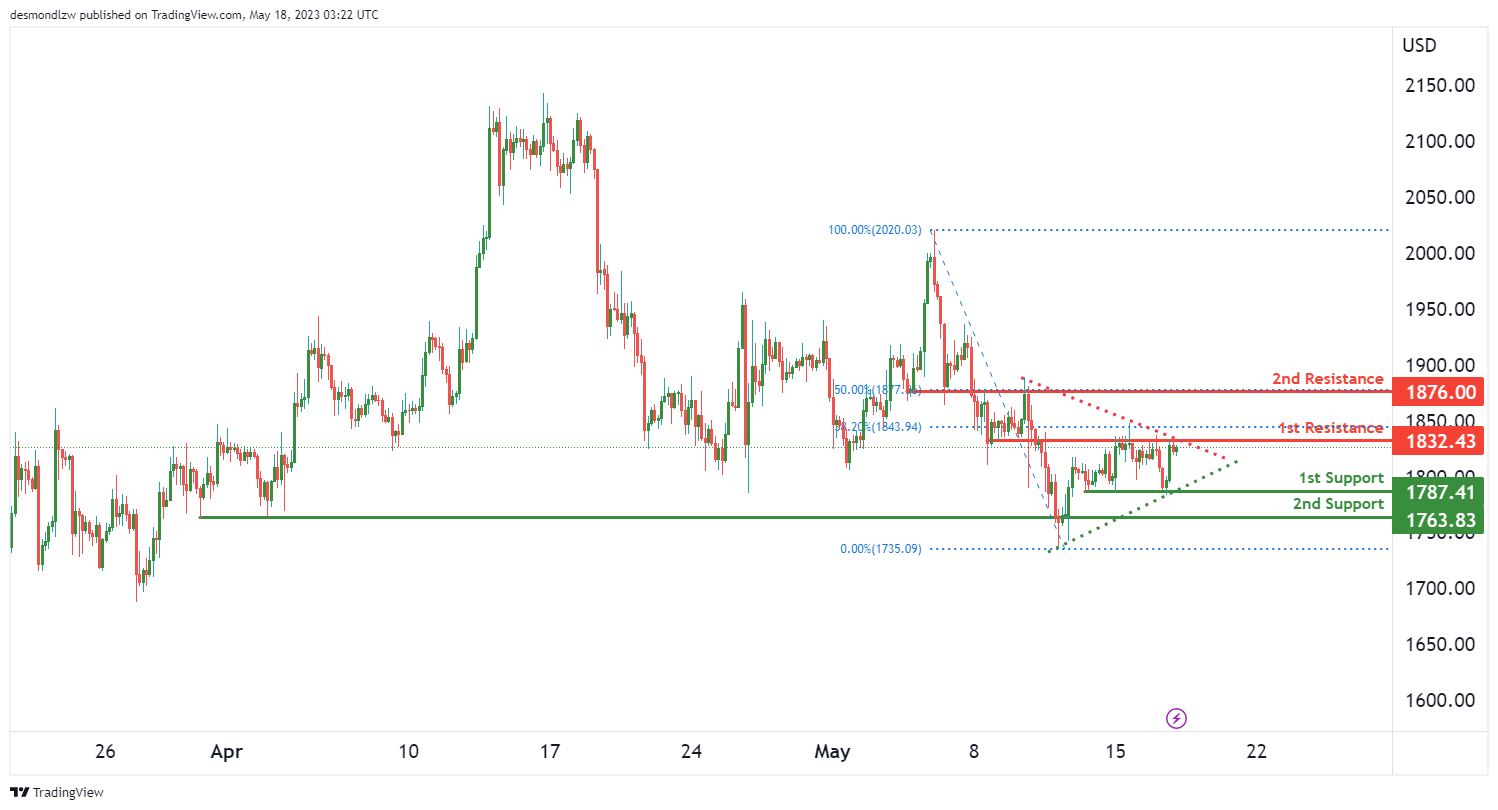
The EUR/USD chart is currently showing neutral momentum, indicating a lack of clear directional bias.
There is a possibility of price fluctuating between the first resistance and first support levels. The first support level is at 1787.41, identified as a multi-swing low support. This level may provide a price floor if the price were to drop. The second support level is at 1763.83, another multi-swing low support, and it coincides with a 50% Fibonacci retracement, making it a significant level to monitor.
On the resistance side, the first resistance level is at 1832.43, identified as an overlap resistance. If the price were to rise, this level could potentially act as a price ceiling. The second resistance level is at 1876.00, another overlap resistance, and it coincides with a 50% Fibonacci retracement.
In addition, a symmetrical triangle chart pattern is observed, which represents a period of consolidation before the price is forced to break out or break down. A break above the upper trendline of the pattern could signal a bullish breakout, while a break below the lower trendline might indicate a bearish breakdown.
WTI/USD:
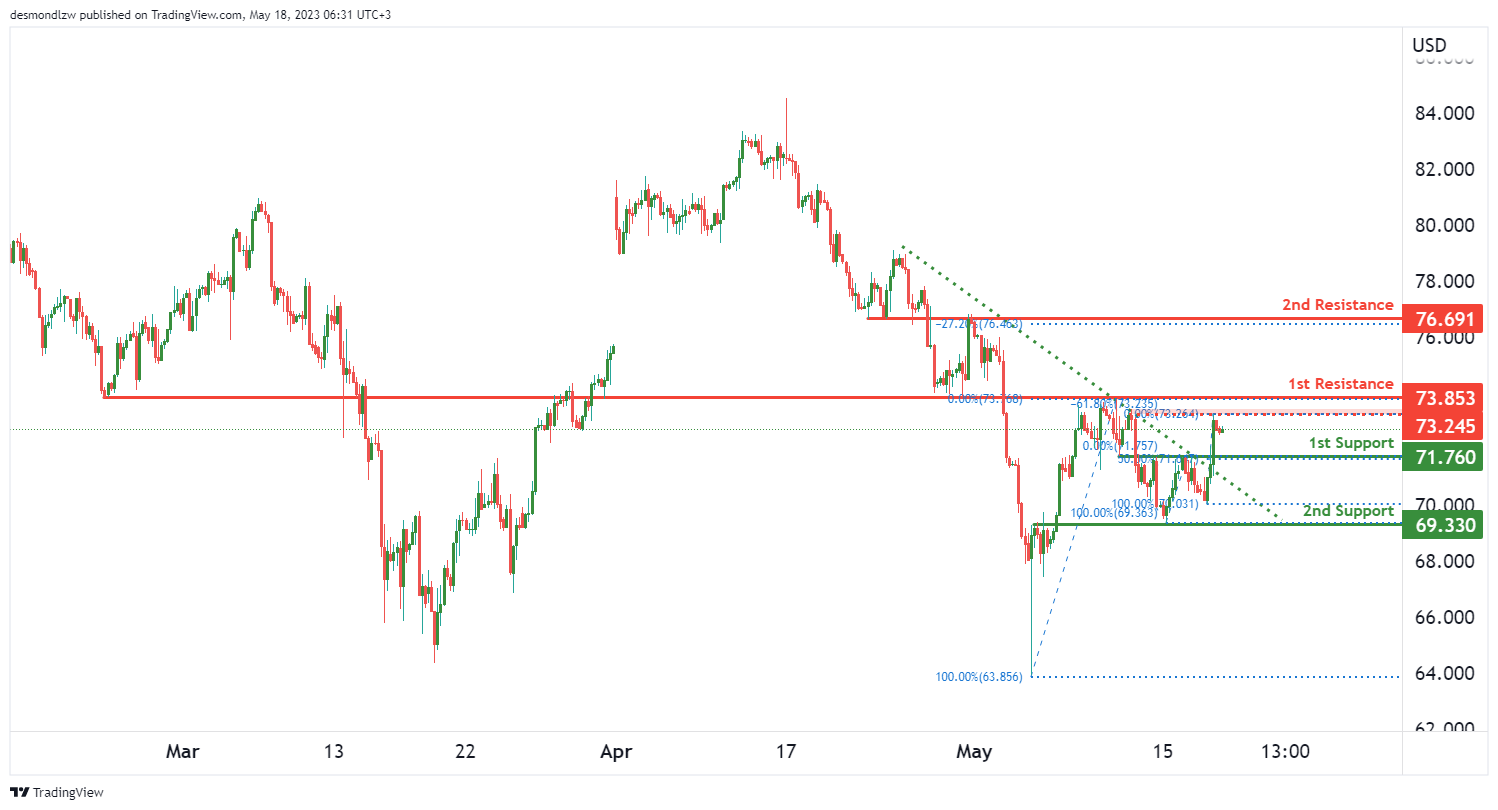
The WTI chart is currently demonstrating bullish momentum, supported by the fact that the price broke above a descending resistance line, triggering a potential bullish move.
In the short term, there is a possibility of the price dropping further towards the first support level at 71.76. This level is identified as a pullback support and coincides with a 50% Fibonacci retracement, making it a significant level to watch. If the price reaches this support level, it could potentially bounce from there.
The second support level is at 69.33, which is an overlap support. This level may also provide support if the price were to drop further.
On the resistance side, the first resistance level is at 73.85, identified as an overlap resistance. If the price were to rise, this level could potentially act as a price ceiling. The second resistance level is at 76.69, another overlap resistance, and it coincides with a -27% Fibonacci expansion.
There is also an intermediate resistance level at 73.24, which has been a significant multi-swing high resistance in the past.
Overall, the momentum of the WTI chart is bullish, and the price could potentially drop to the first support before bouncing and rising towards the identified resistance levels.
XAU/USD (GOLD):
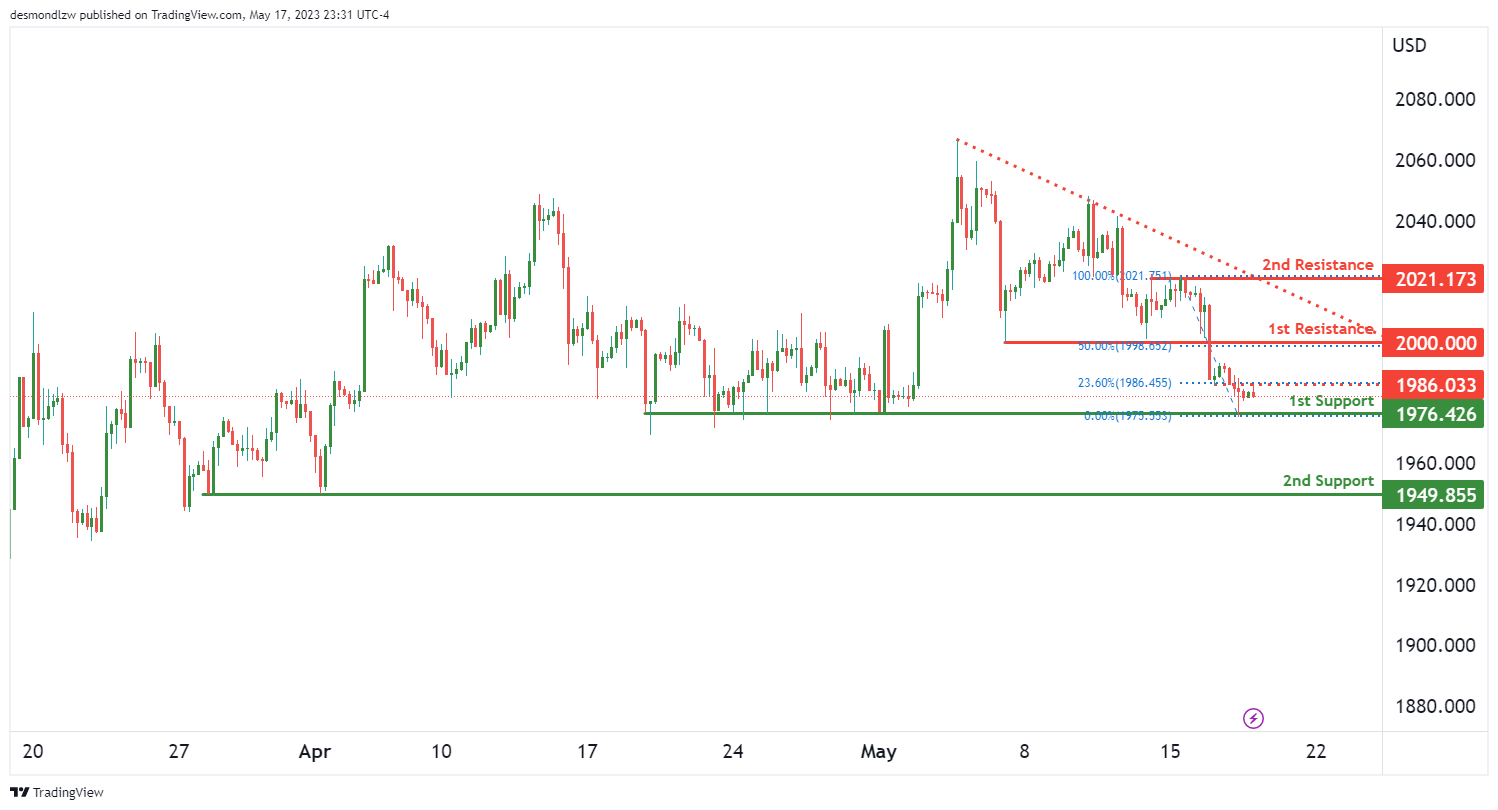
The XAU/USD chart is currently showing bearish momentum, indicated by the fact that the price is below a major descending trend line, suggesting further potential for bearish movement.
In terms of potential price action, there is a possibility of a bearish continuation towards the first support level at 1976.42. This level is identified as a multi-swing low support, indicating its significance. If the price were to drop further, it could find additional support at the second support level at 1949.85, which is another multi-swing low support.
On the resistance side, the first resistance level is at 2000.00, which is a pullback resistance and coincides with a 50% Fibonacci retracement. If the price were to rise, this level may present a significant hurdle. The second resistance level is at 2021.17, identified as a multi-swing high resistance.
Additionally, there is an intermediate resistance level at 1986.00, which is an overlap resistance and coincides with a 23.60% Fibonacci retracement. This level may provide additional resistance if the price attempts to move higher.
Japan’s exports grow at slowest pace since Feb 2021 despite setting record high for Apr
Japan's exports grew by a modest 2.6% yoy to JPY 8288B in April. Although this represented the lowest growth in exports since February 2021, it still marked the largest export figure for April on record.
A closer examination of the data reveals a shift in trading dynamics. Exports to China fell by -2.9% yoy, marking the fifth consecutive month of decline. The decrease was driven by downturns in shipments of cars, car parts, and steel. Similarly, exports to Asia overall declined by -6.6% yoy, continuing a contraction trend for the fourth month in a row.
However, things looked rosier elsewhere. Exports to the US and EU showed robust growth, rising by 10.5% yoy and 11.7% yoy respectively. This uptick was led by a rebound in exports of cars and car parts, which have seen easing supply constraints.
Contrasting with export trends, imports fell by -2.3% yoy to JPY 8721B, the first annual decline witnessed in 27 months. This decrease was largely attributed to a slump in imports of crude oil and liquefied natural gas. Consequently, Japan recorded a trade deficit of JPY -432B for the 21st month running.
In seasonally adjusted term, the situation presents a slightly different picture. Exports rose by 2.5% mom to JPY 8259B, while imports inched up by 0.1% mom to JPY 9276B. In light of this, trade deficit narrowed to JPY -1017B.
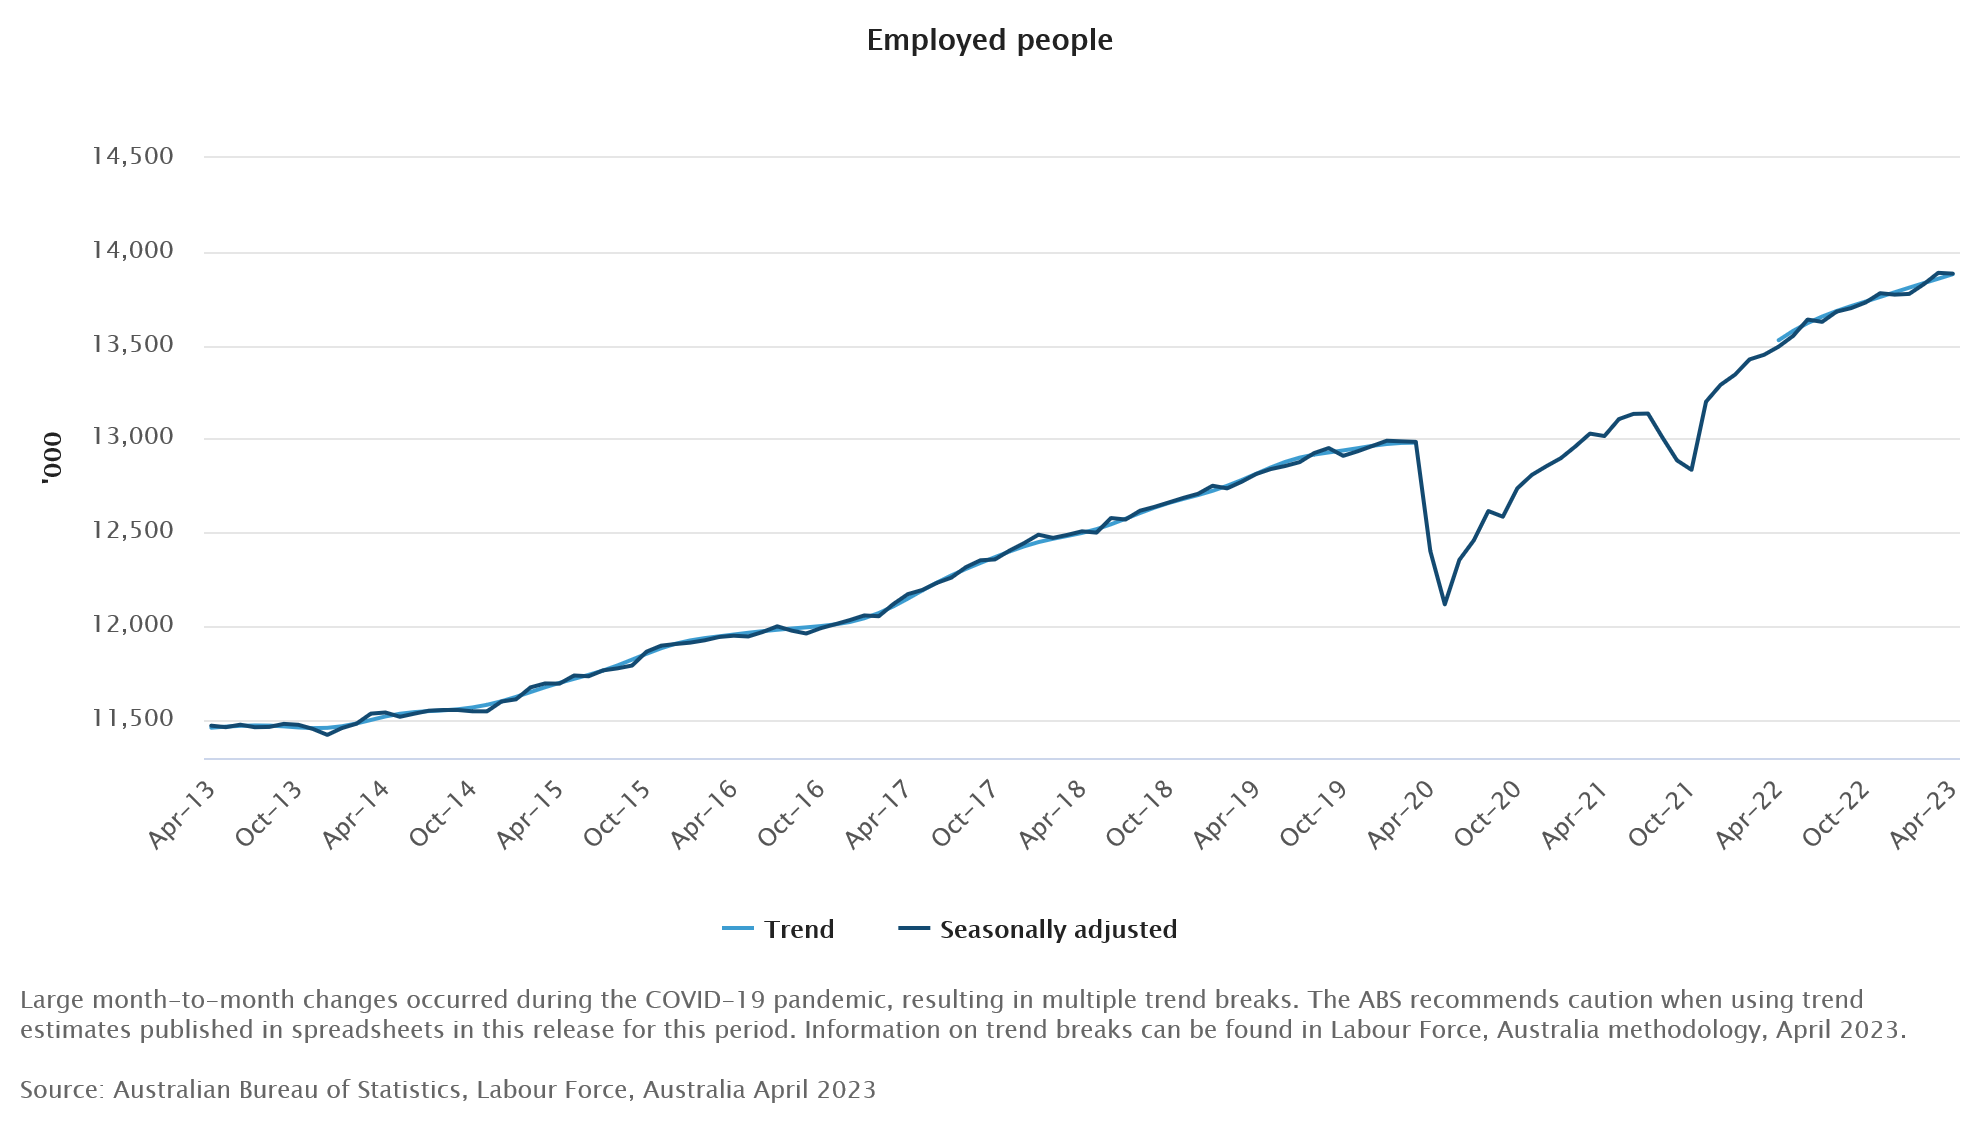
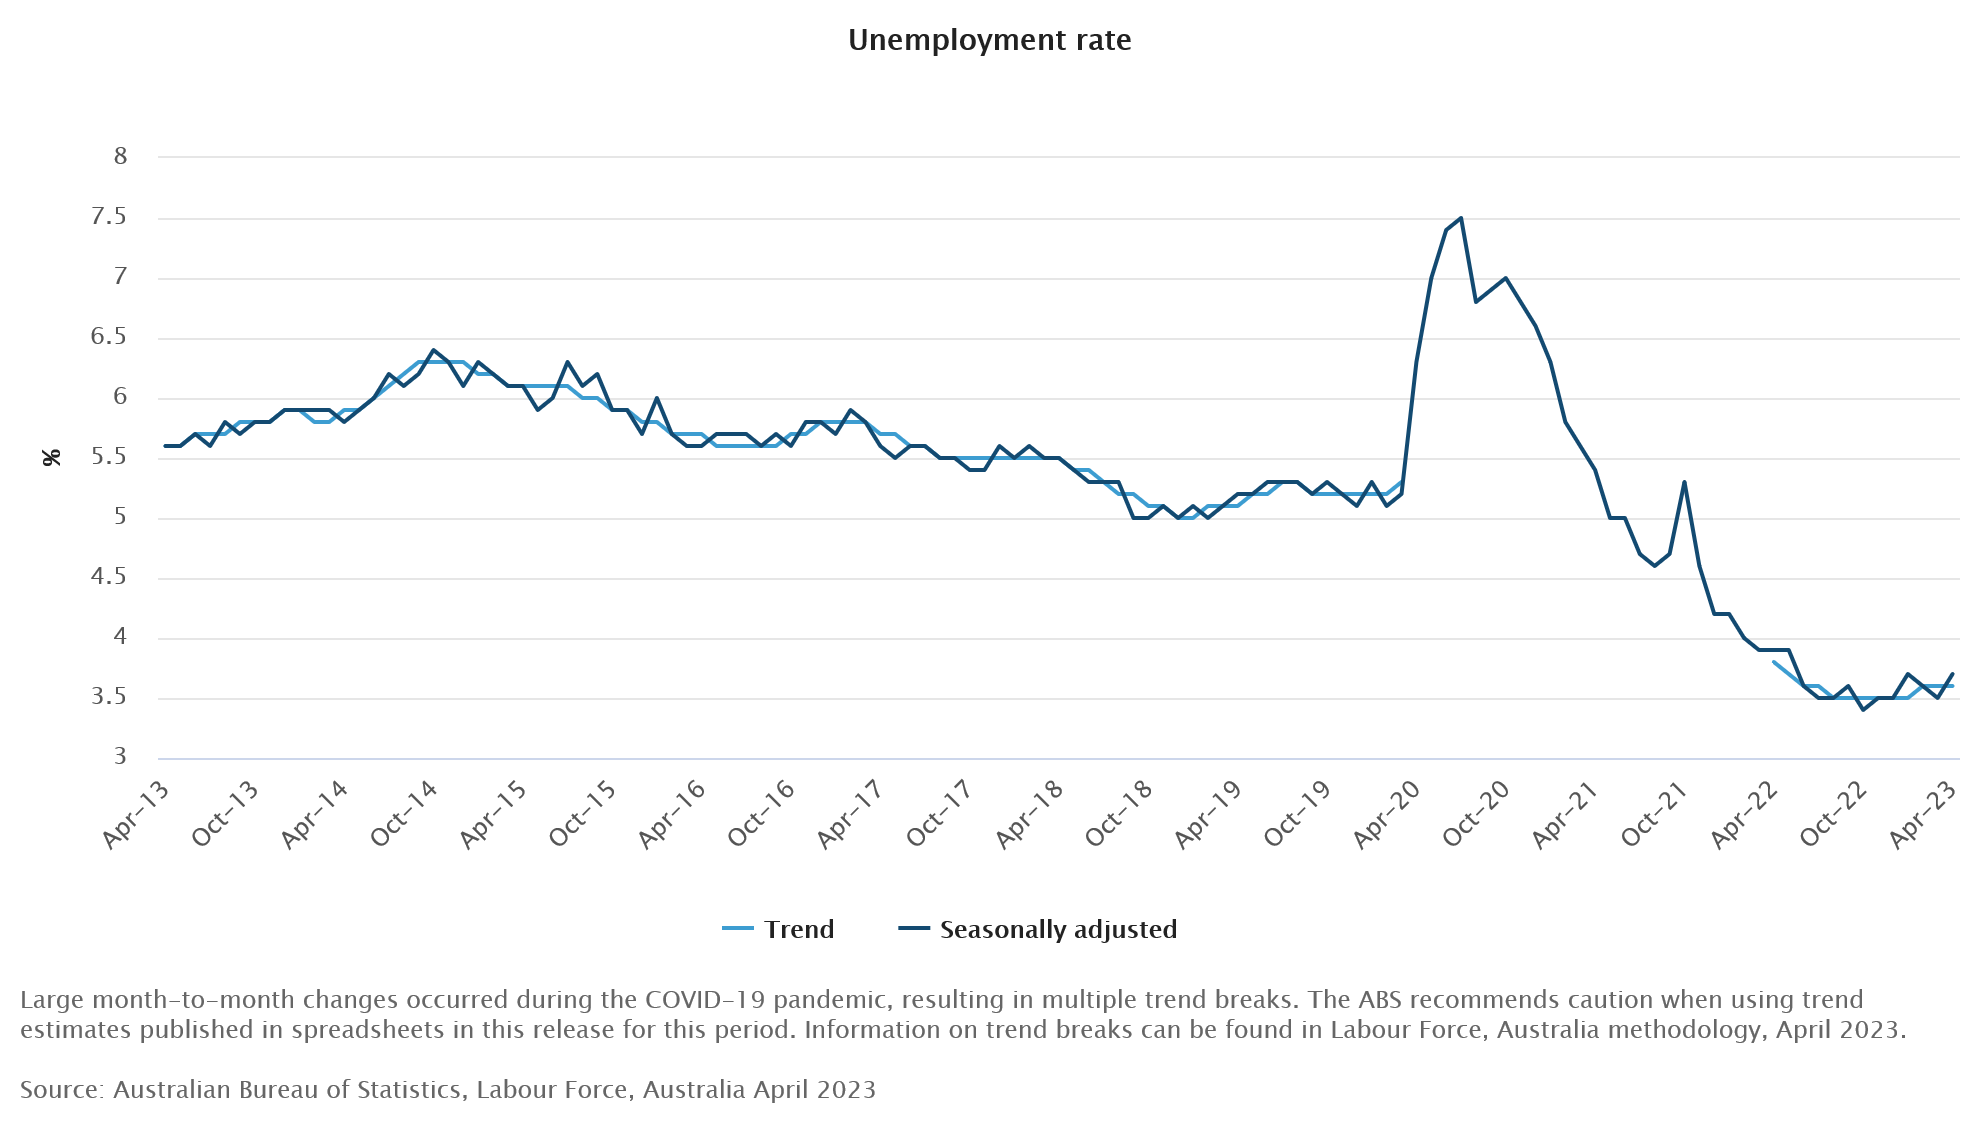
Australia employment down -4.3k in Apr, unemployment rate up to 3.7%
Australia employment contracted -4.3k in April, much worse than expectation of 25k growth. Full time job decreased -27.1k while part-time jobs rose 22.8k. Unemployment rate rose from 3.5% to 3.7%, above expectation of being unchanged at 3.5%. Participation rate dropped -0.1% to 66.7%. Employment-to-population ratio fell -0.2% to 64.2%. Monthly hours worked rose 2.6% mom or 49m hours.
Bjorn Jarvis, ABS head of labour statistics, said: "The small fall in employment followed an average monthly increase of around 39,000 people during the first quarter of this year." Meanwhile, both employment-to-population ratio and participation rate "were still well above pre-COVID-19 pandemic levels and close to their historical highs in 2022".
Crude Oil Price Starts Recovery But Faces Hurdle
Key Highlights
- Crude oil prices started a recovery wave above $70.
- It broke a major bearish trend line with resistance near $70.80 on the 4-hour chart.
- EUR/USD extended its decline and spiked below 1.0840.
- Gold price is consolidating losses near the $1,975 support.
Crude Oil Price Technical Analysis
Crude oil prices remained well-bid above the $65 level against the US Dollar. The price started a recovery wave above the $68 and $68.50 resistance levels.
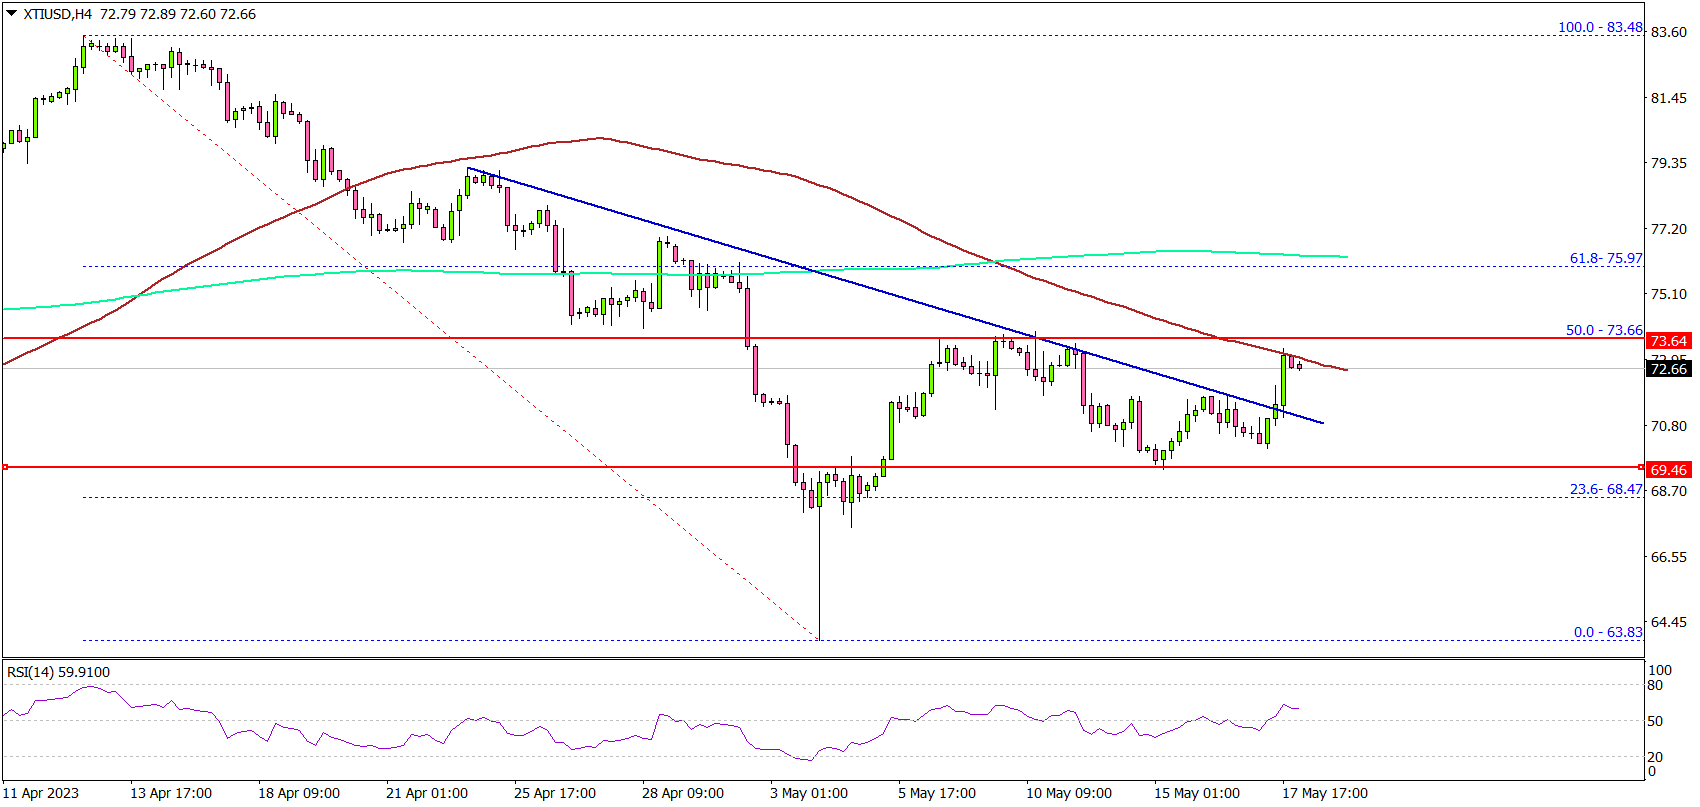
Looking at the 4-hour chart of XTI/USD, the price was able to settle above the $70 level. Besides, there was a break above a major bearish trend line with resistance near $70.80.
The price is now testing the $73 resistance and the 100 simple moving average (red, 4-hour). The first major resistance is near the $73.65 level which is near the 50% Fib retracement level of the downward move from the $83.48 swing high to the $63.83 low.
The next key resistance is near $76 and the 200 simple moving average (green, 4-hour), above which the price may perhaps accelerate higher.
On the downside, initial support is near the $70.80 level. The next major support sits near the $70.00 level. Any more losses might call for a test of the $68.00 support zone in the coming sessions.
Looking at EUR/USD, the pair is moving lower and there is now a risk of a downside break below the 1.0800 support zone.
Economic Releases to Watch Today
- US Initial Jobless Claims - Forecast 254K, versus 264K previous.
Analyzing Litecoin (LTCUSD) Impulsive Surge with Elliott Wave Theory
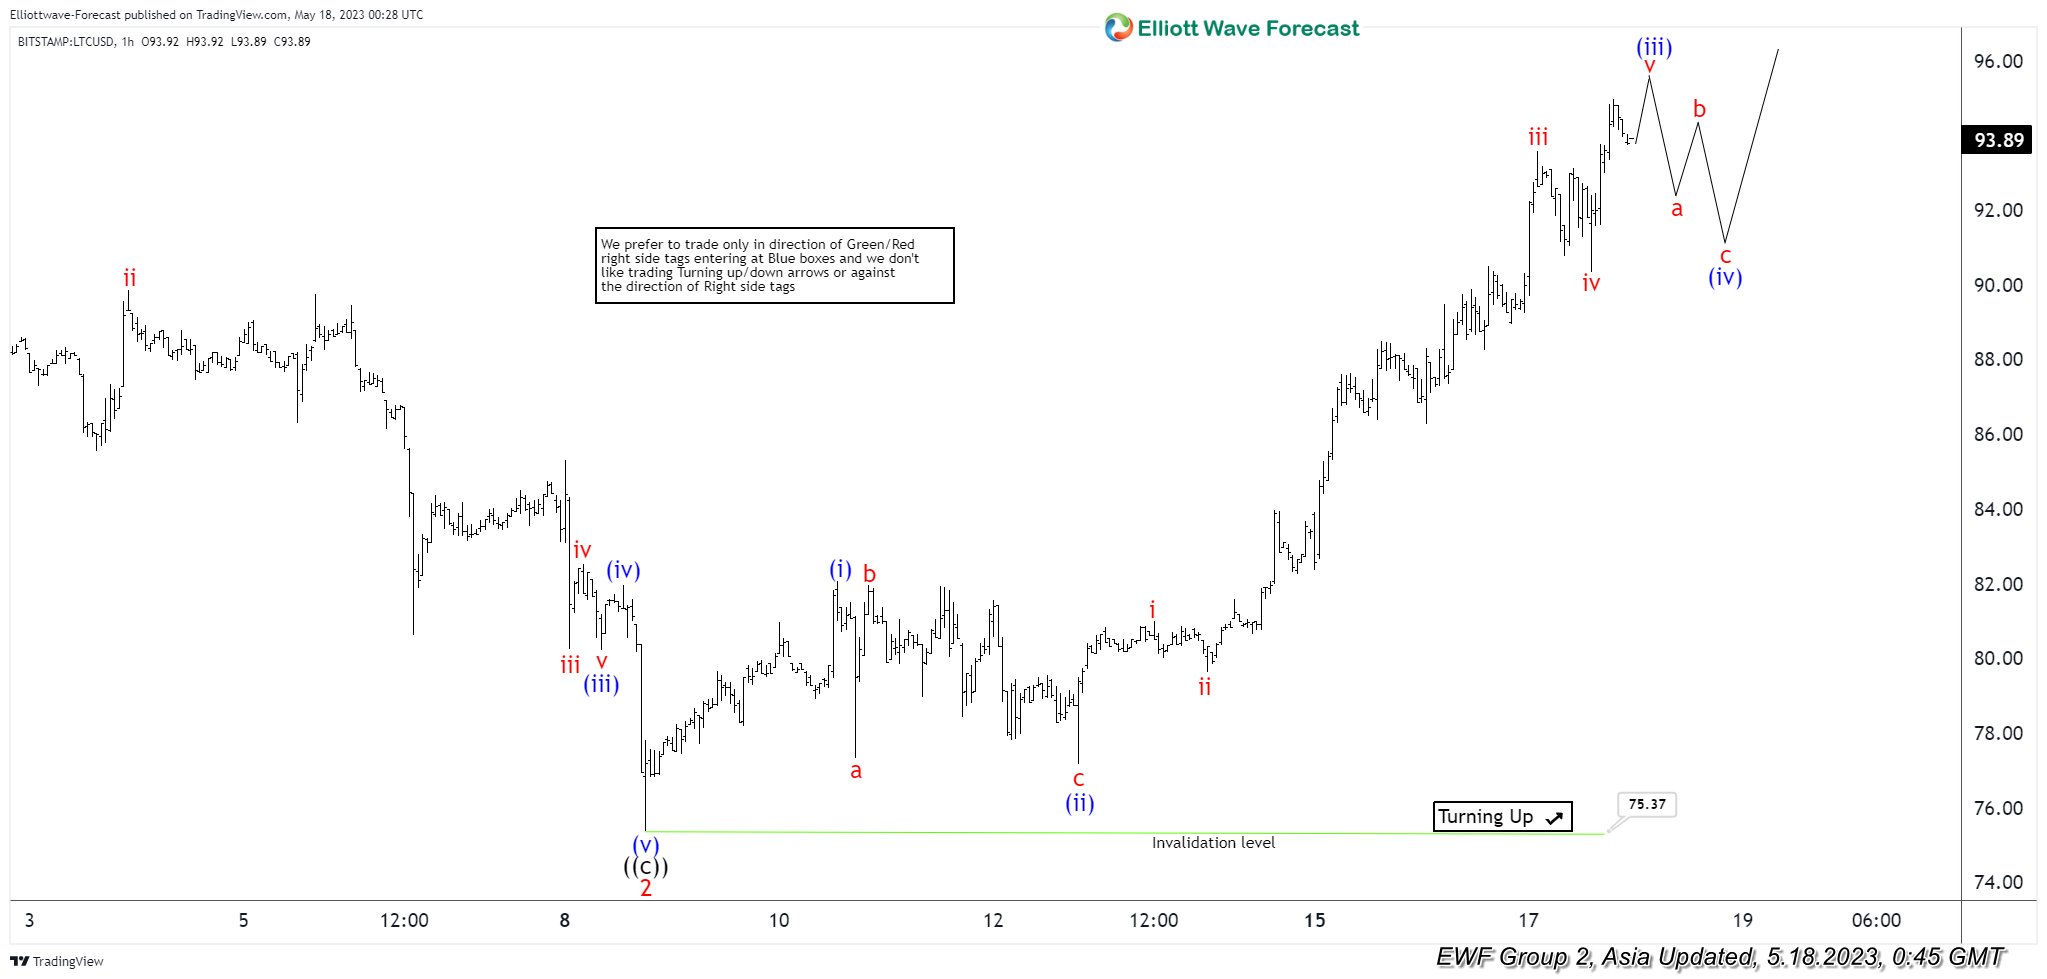
Short term Elliott Wave View in Litecoin (LTCUSD) suggests the rally from 3.11.2023 low takes the form of an impulsive Elliott Wave structure. Up from 3.11.2023 low, wave 1 ended at 103.41 and pullback in wave 2 ended at 75.37. The crypto-currency has now rallied higher in wave 3. Up from wave 2, wave (i) ended at 82.07 and pullback in wave (ii) ended at 77.17. Internal subdivision of wave (ii) unfolded as a zigzag where wave a ended at 77.33, wave b ended at 81.95, and wave c lower ended at 77.17. This completed wave (ii) in higher degree. Up from there, wave i ended at 81 and pullback in wave ii ended at 79.64.
Wave iii higher ended at 93.59 and pullback in wave iv ended at 90.34. Final leg higher wave v ended at 94.98 which completed wave (iii). Expect Litecoin to pullback in wave (iv) before turning higher again in wave (v). This would complete wave ((i)), and the crypto currency should then pullback in wave ((ii)) to correct cycle from 5.8.2023 low before the rally resumes again. Near term, as far as pivot at 75.37 low stays intact, expect pullback to find support in 3, 7, or 11 swing for further upside.
Litecoin (LTCUSD) 60 Minutes Elliott Wave Chart
Litecoin Elliott Wave Video
https://www.youtube.com/watch?v=nX1QaKTDeZ0
CADJPY Wave Analysis
- CADJPY broke key resistance level 101.00
- Likely to rise to resistance level 103.00
CADJPY under the bullish pressure after the earlier breakout of the key resistance level 101.00 (which has been reversing the pair from the start of December).
The breakout of the resistance level 101.00 continues the C-wave of the active intermediate ABC correction (2) from the start of May.
CADJPY can be expected to rise further toward the next resistance level 103.00 (forecast price for the completion of the active ABC correction (2)).

GBPJPY Wave Analysis
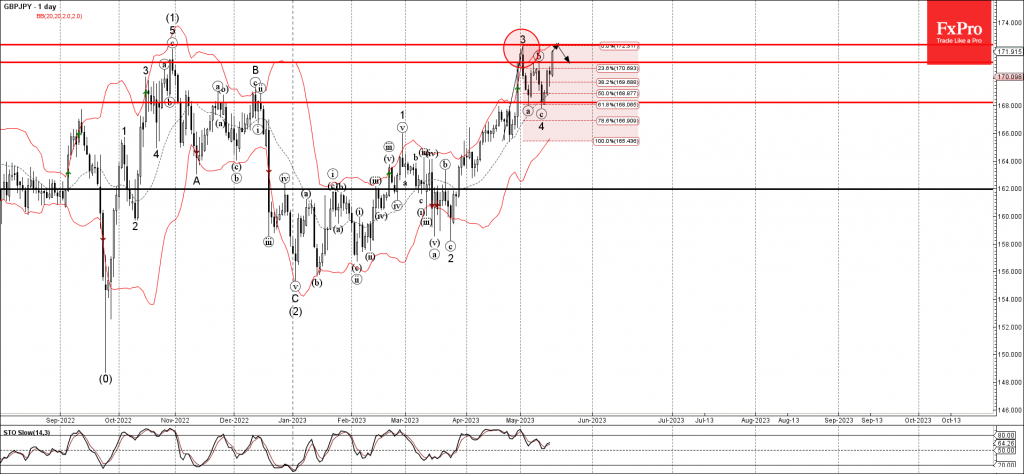
- GBPJPY broke resistance level 171.10
- Likely to test next resistance level 172.40
GBPJPY continues to rise after the earlier breakout of the resistance level 171.10 (upward target set in our previous report for this currency pair).
The breakout of the resistance level 171.10 continues the active short-term impulse wave 5, which belongs to wave (3) from January.
Given the predominant daily uptrend, GBPJPY can be expected to rise further toward the next resistance level 172.40 – from where the downward correction is likely.
British Pound Drifts Lower, Markets Eye Bailey Testimony
- BoE Governor Bailey to testify before Treasury Committee on Thursday
- Fed says remains open to rate hikes
- JP Morgan expects Fed to cut rates
Will monetary hearings shake up British pound?
The Bank of England will be in the spotlight on Thursday, as Governor Bailey testifies before the Treasury Committee. Lawmakers will likely pepper the Governor with questions about red-hot inflation, which remains in double-digits despite the BoE’s aggressive tightening. The BoE remains optimistic that inflation will fall more rapidly but there is pressure on the BoE to ratchet up the rate hikes to 50 or 75 basis points, as it did last year. Bailey will have his work cut out as he attempts to convince lawmakers to patiently wait for the tightening to percolate through the economy and dampen inflation.
Bailey stated today at a public engagement that inflation remains much too high, and that he would tighten policy if there was evidence of stronger inflationary pressures. I expect Bailey to reiterate this stance before the Treasury Committee on Thursday.
The Federal Reserve continues to pump out the message that rate hikes are on the table but rate cuts are not in the cards. Richmond Fed President Tom Barkin and Atlanta Fed President Raphael Bostic said earlier this week that the Fed could hike rates if high inflation persisted. The markets still think that the Fed could cut rates before the end of the year, and JP Morgan said on Tuesday “the market is right to be penciling in cuts”, as inflation remains too high and the US was likely headed for a recession.
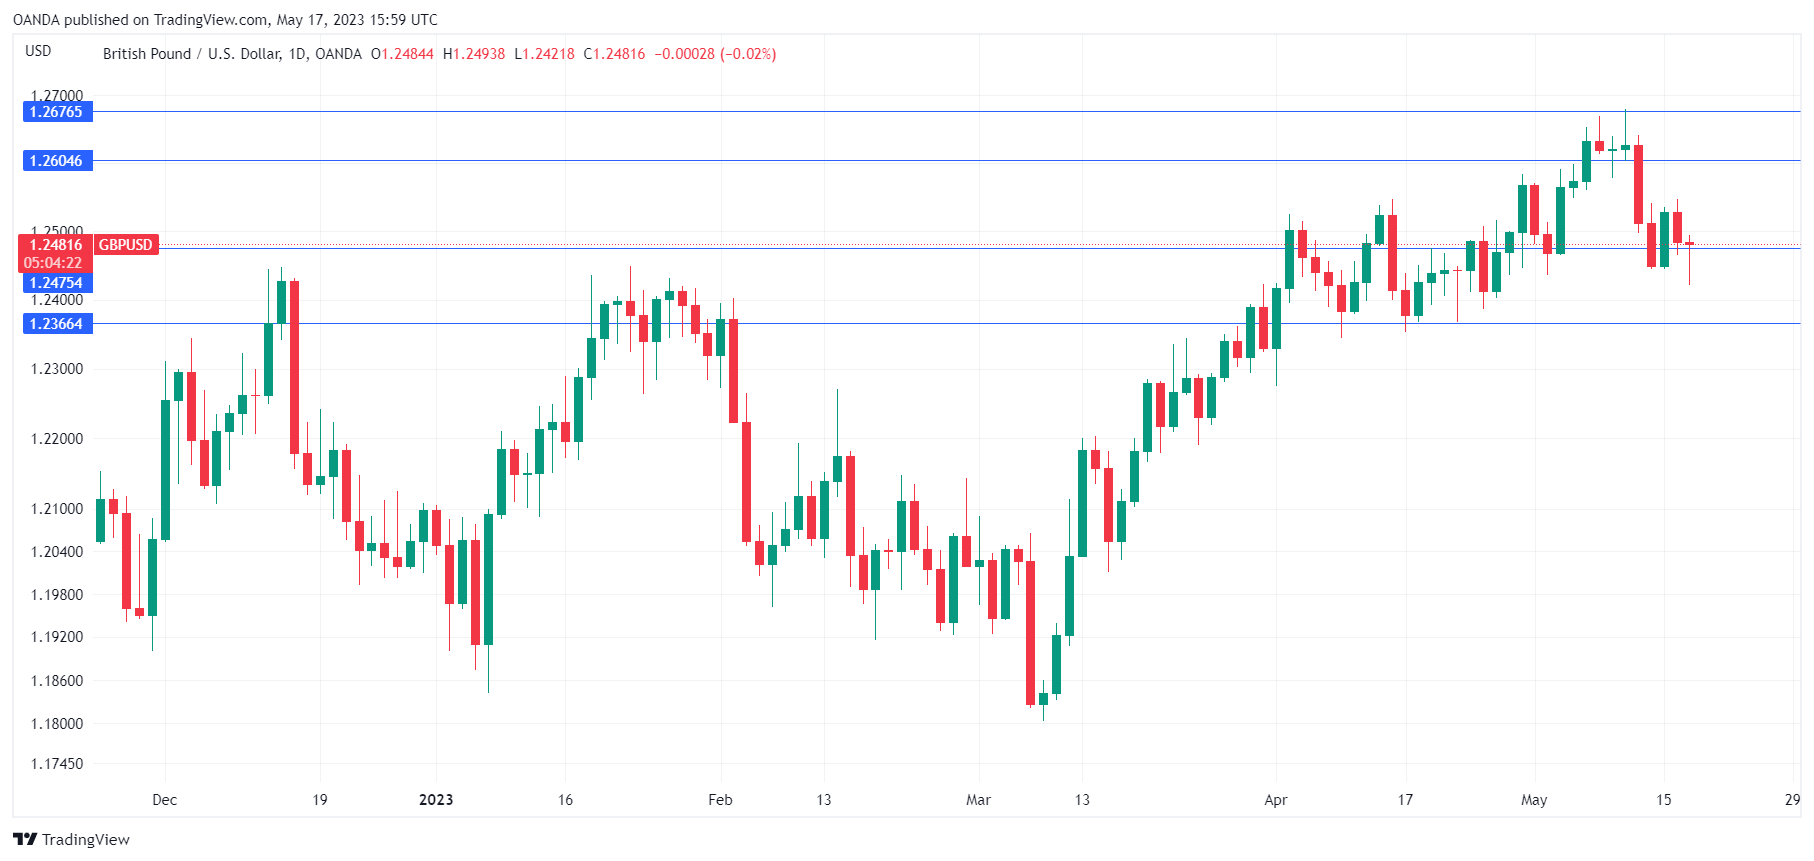
GBP/USD Technical
- GBP/USD is testing support at 1.2475. The next support line is 1.2366
- 1.2604 and 1.2676 are the next resistance levels