Sample Category Title
EUR/GBP Daily Outlook
Daily Pivots: (S1) 0.8681; (P) 0.8699; (R1) 0.8720; More...
Intraday bias in EUR/GBP stays neutral as consolidation from 0.8660 is still in progress. Further decline is expected as long as 0.8758 resistance holds. On the downside, break of 0.8660 will resume recent decline to 100% projection of 0.8977 to 0.8717 from 0.8874 at 0.8614. Nevertheless, break of 0.8758 minor resistance will turn bias back to the upside for stronger rebound.
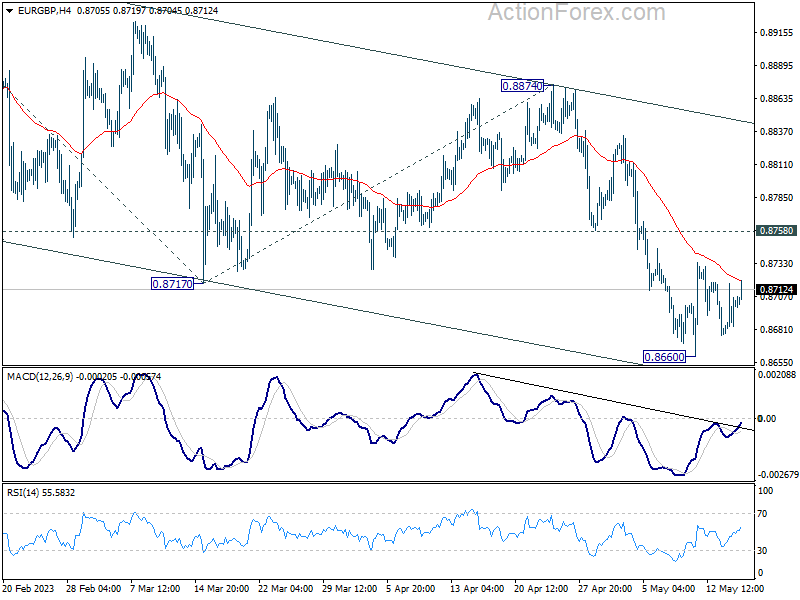
In the bigger picture, current development argues that whole decline from 0.9267 (2022 high) is still in progress. This is part of the long term range pattern from 0.9499 (2020 high). Deeper fall would be seen through 0.8545 support. his will now remain the favored case as long as 0.8874 resistance holds.
EUR/AUD Daily Outlook
Daily Pivots: (S1) 1.6247; (P) 1.6290; (R1) 1.6365; More...
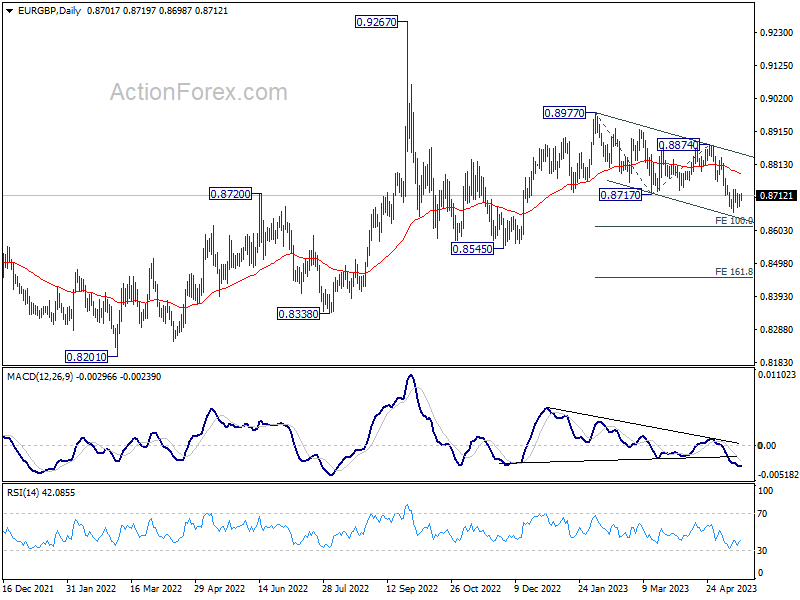
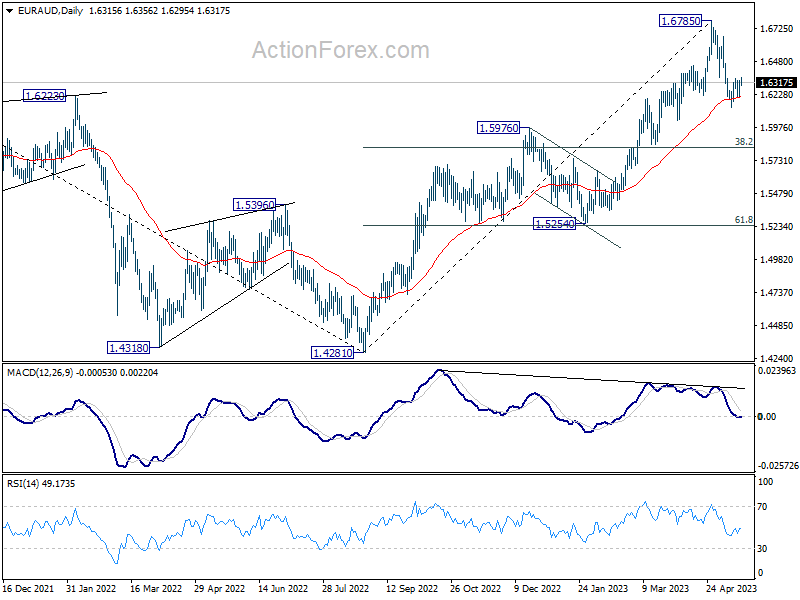
Intraday bias in EUR/AUD remains neutral as it's still bounded in consolidation from 1.6134. Further decline is expected with 1.634 minor resistance intact. Considering bearish divergence condition in D MACD, fall from 1.6785 might be a correction to whole up trend from 1.4281. Break of 1.6134 will target 38.2 retracement of 1.4281 to 1.6785 at 1.5828, which is inside 1.5254/5976 support zone. Nevertheless, sustained break of 1.6354 minor resistance will turn bias back to the upside for retesting 1.6785 high instead.
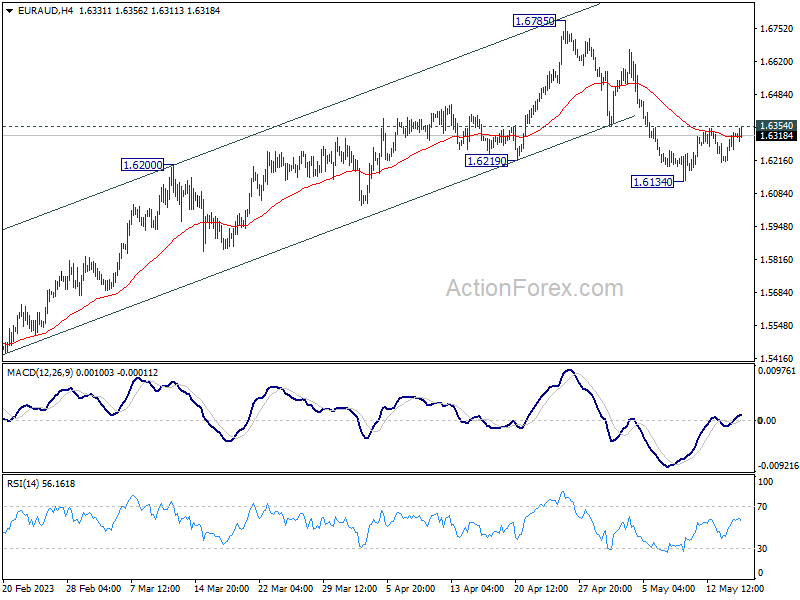
In the bigger picture, whole down trend from 1.9799 (2020 high) should have completed at 1.4281 (2022 low). Further rise should be seen to 61.8% retracement of 1.9799 to 1.4281 at 1.7691 next. For now, outlook will stay bullish as long as 1.5976 resistance turned support holds, even in case of deep pull back.
EUR/CHF Daily Outlook
Daily Pivots: (S1) 0.9724; (P) 0.9733; (R1) 0.9746; More...
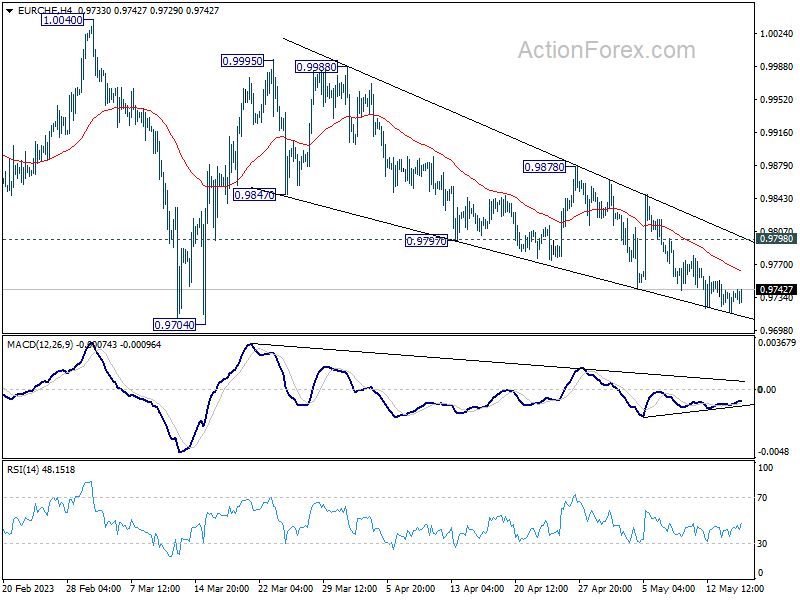
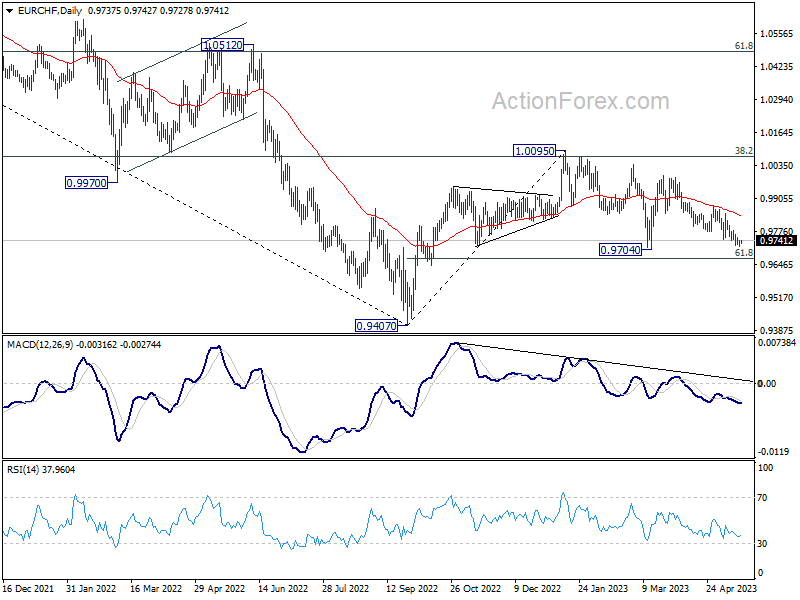
No change in EUR/CHF's outlook. Choppy decline from 0.9995 might extend lower. But strong support should be seen from 0.9704 to bring rebound. Break of 0.9847 will argue that the fall has completed and turn bias back to the downside. However, firm break of 0.9704 will resume the whole decline from 1.0095 to 61.8% retracement of 0.9407 to 1.0095 at 0.9670.
In the bigger picture, prior rejection by 38.2% retracement of 1.1149 to 0.9407 at 1.0072 suggests that medium term outlook is staying bearish. The pair is also capped below 55 W EMA (now at 0.9963). Down trend from 1.2004 is not completed yet and is in favor to resume through 0.9407 at a later stage. However, decisive break of 1.0095 resistance will raise the chance of bullish trend reversal. Rise from 0.9407 should then target 1.0505 cluster resistance (2020 low at 1.0505, 61.8% retracement of 1.1149 to 0.9407 at 1.1484).
GBP/USD Technical Analysis
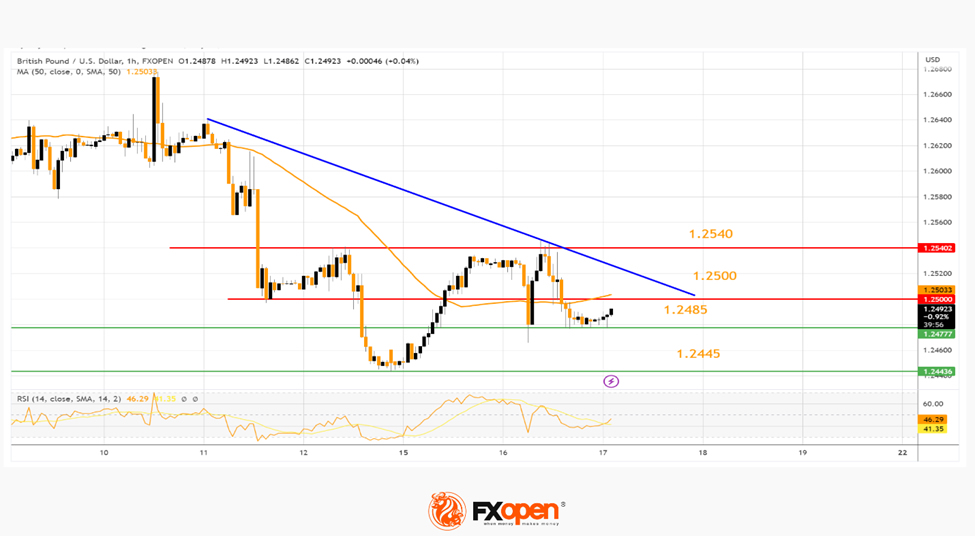
On the hourly chart of GBP/USD at FXOpen, the pair started a fresh decline from the 1.2660 zone. The British Pound declined steadily below the 1.2600 level against the US Dollar.
It tested the 1.2445 support and recently started an upside correction. The pair is now facing resistance near a key bearish trend line at 1.2500 and the 50-hour simple moving average.
If there is a clear upside break above the 1.2500 resistance, the pair could rise toward the 1.2540 level in the near term. The next major resistance sits near the 1.2600 level.
On the downside, the first major support is near the 1.2485 level. The main support is forming near the 1.2445 level. A break below the 1.2445 support could start a fresh downward move toward the 1.2350 support in the coming sessions.
Bitcoin Set for a Deeper Correction
Market picture
The cryptocurrency market capitalisation remained near $1.127 trillion as attempts to develop growth came up against selling pressure near $1.14 trillion. The top cryptocurrencies over the past 24 hours have ranged from a 0.7% decline (Solana) to a 5.6% rise (XRP), while Bitcoin is losing 0.3% and Ether is rising by the same amount.
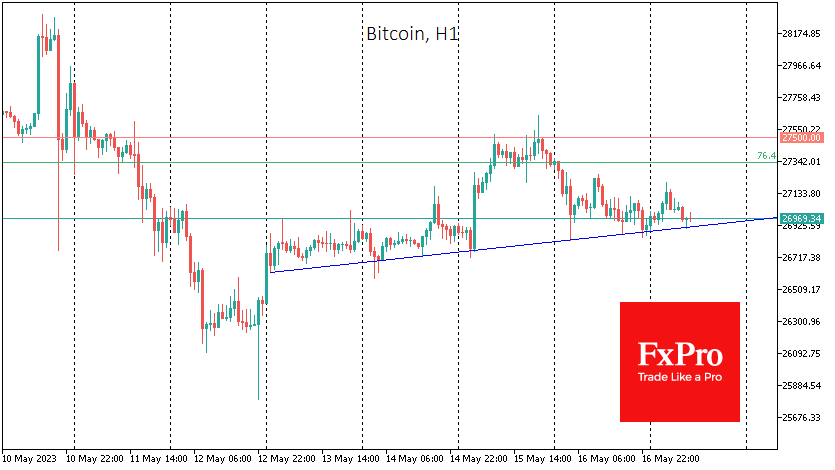
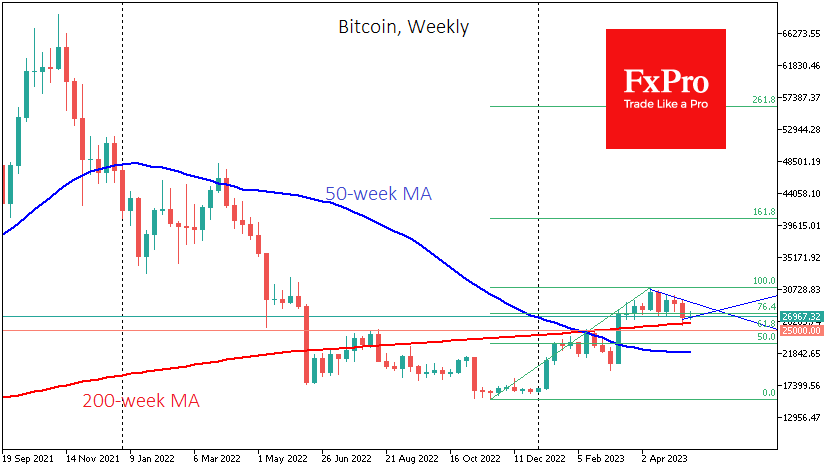
One can discern a moderately upward trend on Bitcoin’s intraday charts, but it’s worth noting that the price is failing to push up from that local support, which now passes near $27K. Investors and traders should be prepared for a price decline into the $25K area, as the market seems set for a full rally correction from the November lows.
Despite the Bitcoin network’s continued rise in transaction volume, the number of active addresses has fallen to 764K – its lowest since July 2021. Due to the hype around BRC-20 and Ordinals tokens, the average transaction fee on the blockchain rose from $2.5 last year to $16.08 at the peak. The situation is to the benefit of Bitcoin miners, who are getting more commission on transactions than from mining for the fifth time in history (6.25 BTC), Glassnode noted.
News background
Bernstein Research expects lower US interest and bank deposit rates will spur public interest in Ethereum-stacking, which generates more interest income. In turn, it could start a new bullish trend in the crypto market.
According to Bloomberg, the appeal of Bitcoin and other cryptocurrencies will decline as US crypto policy tightens and default risks increase.
During the trial of a lawsuit filed by exchange Coinbase, US Securities and Exchange Commission (SEC) officials said drafting laws to regulate cryptocurrencies will take years. In the meantime, fines will “come down”. The SEC called Coinbase’s lawsuit “unfounded”.
The number of transactions on the Dogecoin network has surpassed that of Bitcoin and Litecoin. The community speculates that this momentum is due to activity around DRC-20 tokens, which enable the creation of new digital assets on top of the blockchain.
USDJPY Aims to Revive 2023 Uptrend
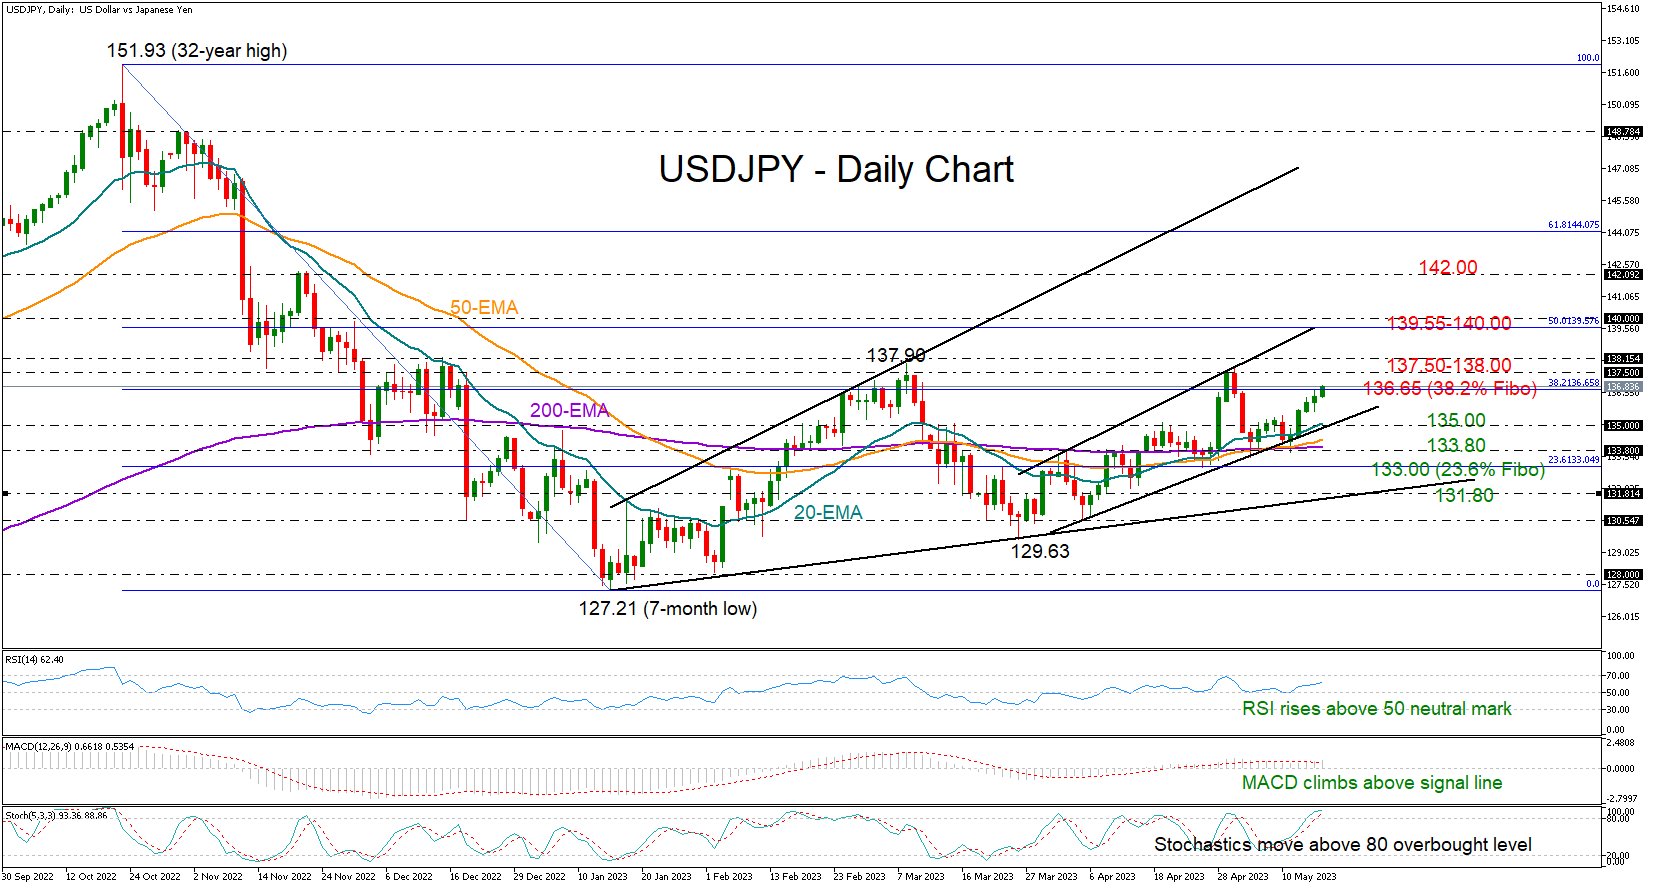
USDJPY has been in the green for almost a week, aiming to resume its 2023 uptrend above the key 137.50-138.00 resistance territory.
The technical picture suggests there is more room for improvement. The exponential moving averages (EMAs) remain positively aligned, with the price trading above those lines. Moreover, the RSI and the MACD are sloping upwards in the bullish area, reflecting a bullish bias too.
The stochastic oscillator, though, is already in the overbought region. Therefore, some caution might be necessary as the price is trading near the 38.2% Fibonacci retracement of the 151.93-127.21 downtrend at 136.65. A decisive close above that number could bring the 137.50-138.00 ceiling under examination. If the bulls successfully breach that wall, the recovery may continue towards the 50% Fibonacci level of 139.55 and the 140.00 psychological mark, where the resistance line from March is placed. Another victory here could see a remarkable rally towards the 142.00 zone.
On the downside, the 20-day EMA and the support trendline at 135.00 could delay an extension towards the 133.80-133.00 region. This is where the 50- and 200-day EMAs and the 23.6% Fibonacci mark are located. Hence, failure to bounce here could prompt a new bearish correction towards the 2023 ascending trendline seen around 131.80.
In summary, USDJPY may keep facing upside pressures in the short-term, though for an outlook improvement, it will need to print a new higher high above the 137.50-138.00 area.
EUR/USD: Bears Hold Grip and Look for Attack at Next Key Support
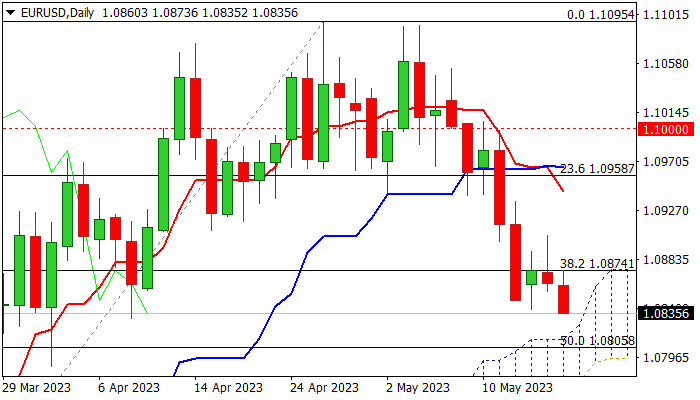
The Euro extends weakness in early European session trading on Wednesday, after the action stayed in a sideways mode in past two days but capped by broken pivotal Fibo support at 1.0874 (38.2% of 1.0516/1.1095), keeping negative near-term bias.
Comments from US policymakers that it’s too early to talk about rate cuts and the Fed should stay strong on inflation despite negative impact on the economy, could be supportive for dollar, in addition to persisting pressure from US debt ceiling crisis, which hurts risk sentiment.
Bearishly aligned daily studies (strong negative momentum / multiple bear-crosses of 10, 20, 30 DMA’s) weigh on near-term action however, strong support from rising and thickening daily cloud (top of the cloud lays at 1.0826) should be considered.
Repeated close below 1.0874 to add to negative outlook, with upticks to offer better selling opportunities while capped by falling 10DMA (1.0931).
Violation of daily cloud top and a nearby 100DMA / 50% of 1.0516/1.1095 (1.0805) to generate fresh bearish signal and expose next pivot at 1.0774 (daily cloud base).
EU inflation report is key event today, with harmonized CPI and core figure (excluding the most volatile components) are expected to remain unchanged in April at 7.0% and 5.6% respectively, which points to stubbornly high inflation and likely to add to ECB’s hawkish stance.
Res: 1.0874; 1.0904; 1.0931; 1.0969.
Sup: 1.0826; 1.0805; 1.0774; 1.0737.
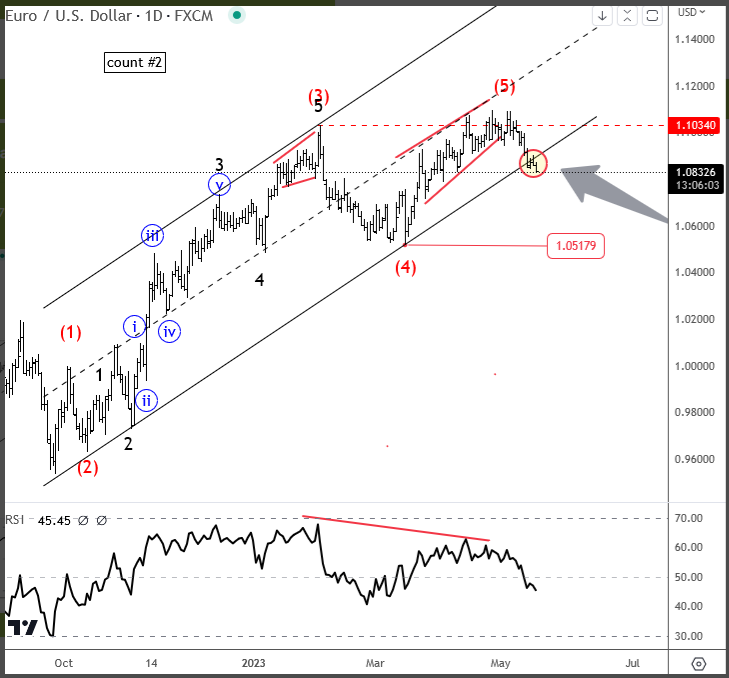
Dollar Headed Higher – EUR/USD Breaking Key Trendline Support
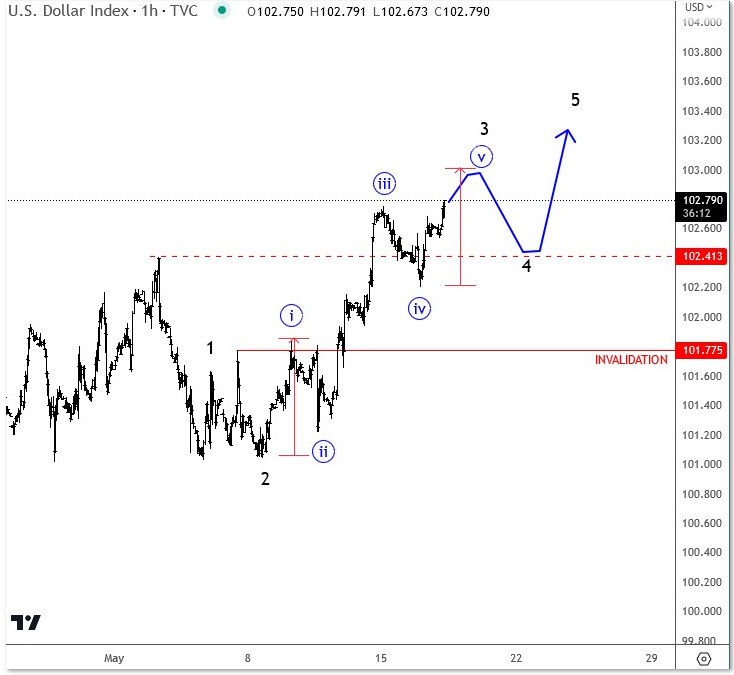
The USD is higher while stocks are still somehow sideways. The reason for the higher USD can be optimism and speculation about US debt-ceiling. We know that will approve it, otherwise, this will cause a lot of damage on the financial market. "Yellen has repeatedly warned that failure by Congress to raise the $31.4 trillion federal debt limit could spark a "constitutional crisis" and would unleash an "economic and financial catastrophe" for the U.S. and global economies" as reported by Reuters. From an Elliott wave perspective I see USD in a recovery mode, looking very impulsive on hourly chart so think there cna be more upside after next fourth wave pullback, which can once again find support near 102.40, if its retested.
EUR/USD is breaking the major trendline support.
EUR/USD and USD/JPY Weekly Chart Outlook
EUR/USD started a decent recovery above the 1.0500 resistance. USD/JPY is showing positive signs but must clear 137.30 to start a fresh increase.
Important Takeaways for EUR/USD and USD/JPY Analysis
- The Euro broke a few hurdles near 1.0500 and 1.0820 against the US Dollar.
- There was a break above a key bearish trend line with resistance near 1.0500 on the weekly chart of EUR/USD at FXOpen.
- USD/JPY corrected lower from the 152.00 resistance and found support at 127.20.
- There is a connecting bullish trend line forming with support at 133.00 on the weekly chart at FXOpen.
EUR/USD Technical Analysis
On the weekly chart of EUR/USD at FXOpen, the pair started a decent recovery wave after it settled above the 1.0000 level. The Euro was able to gain pace above 1.0200 against the US Dollar.
During the increase, it traded above a key bearish trend line with resistance near 1.0500 and the 50-week simple moving average. Recently, there was a move above the 50% Fib retracement level of the last major decline from the 1.2266 swing high to the 0.9535 low.
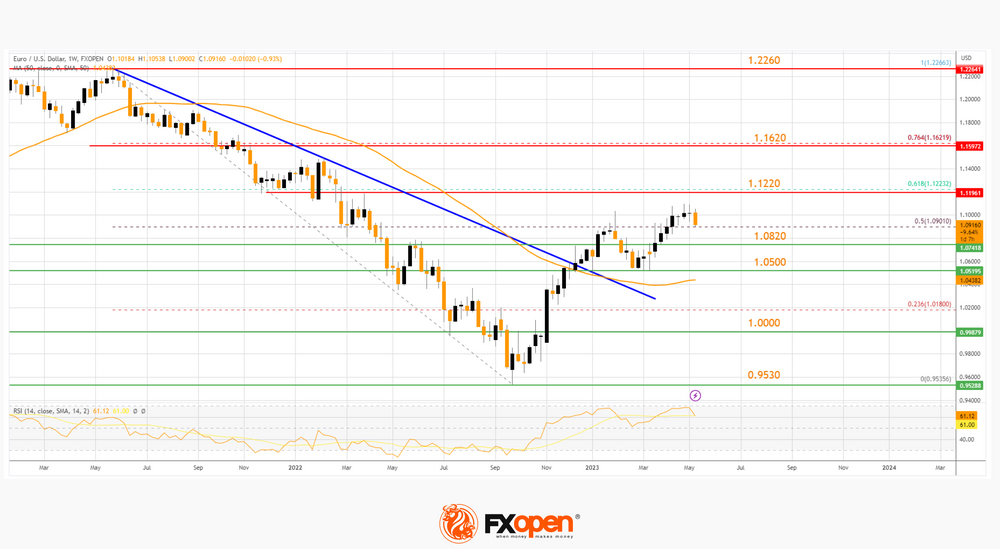
On the upside, the first major resistance is forming near the 61.8% Fib retracement level of the last major decline from the 1.2266 swing high to the 0.9535 low at 1.1220.
The next major resistance on the EUR/USD chart is near the 1.1620 level, above which the pair might revisit the 1.2260 resistance zone if the weekly RSI stays above 50.
Conversely, if EUR/USD fails to climb higher above the 1.1220 resistance, it could correct gains. Immediate support is near the 1.0820 level. The first major support is near the 1.0500 level, below which the pair could decline toward 1.0000.
USD/JPY Technical Analysis
On the weekly chart of USD/JPY, the pair faced strong rejection near the 152.00 level. The US Dollar started a downside correction below the 137.30 support against the Japanese Yen.
The pair tested the 127.20 support. A low was formed near 127.21 and the pair is now rising. It broke the 23.6% Fib retracement level of the downward move from the 151.94 swing high to the 127.21 low.
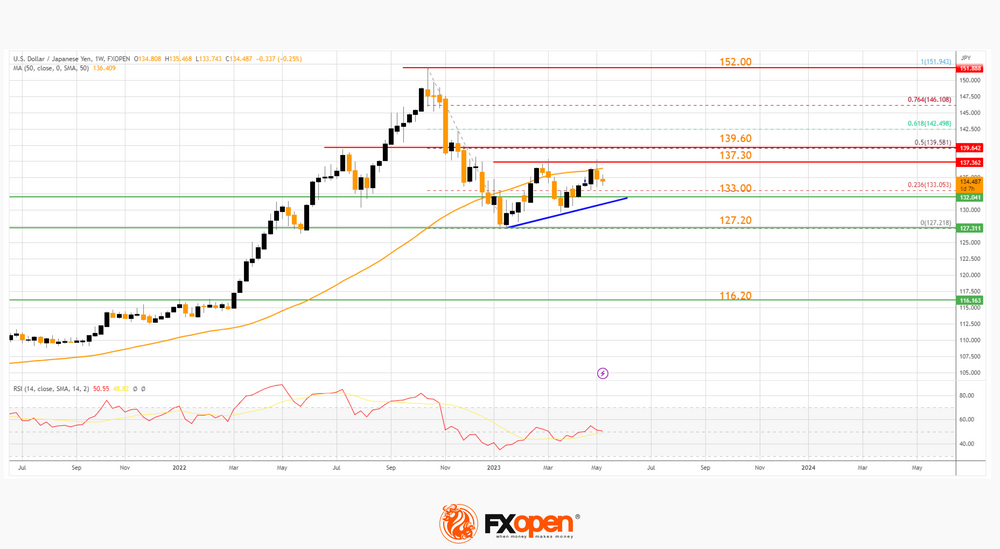
On the upside, the pair is facing resistance near the 50-week simple moving average and 137.20. The next major resistance on the USD/JPY chart is near the 50% Fib retracement level of the downward move from the 151.94 swing high to the 127.21 low at 139.60.
A successful close above 139.60 is likely to start a strong upward move toward 152.00 in the coming weeks. Conversely, if USD/JPY fails to break 139.60, it could retreat lower and revisit the 133.00 support area.
Besides, there is also a connecting bullish trend line forming with support at 133.00. A downside break below the trend line might send the pair toward 127.20.
Any more losses might push the pair into a bearish zone. In the stated case, there is a risk of a drop toward the 116.20 support zone in the medium term.
NZDUSD Battles With 50-Day SMA after Decline Pauses
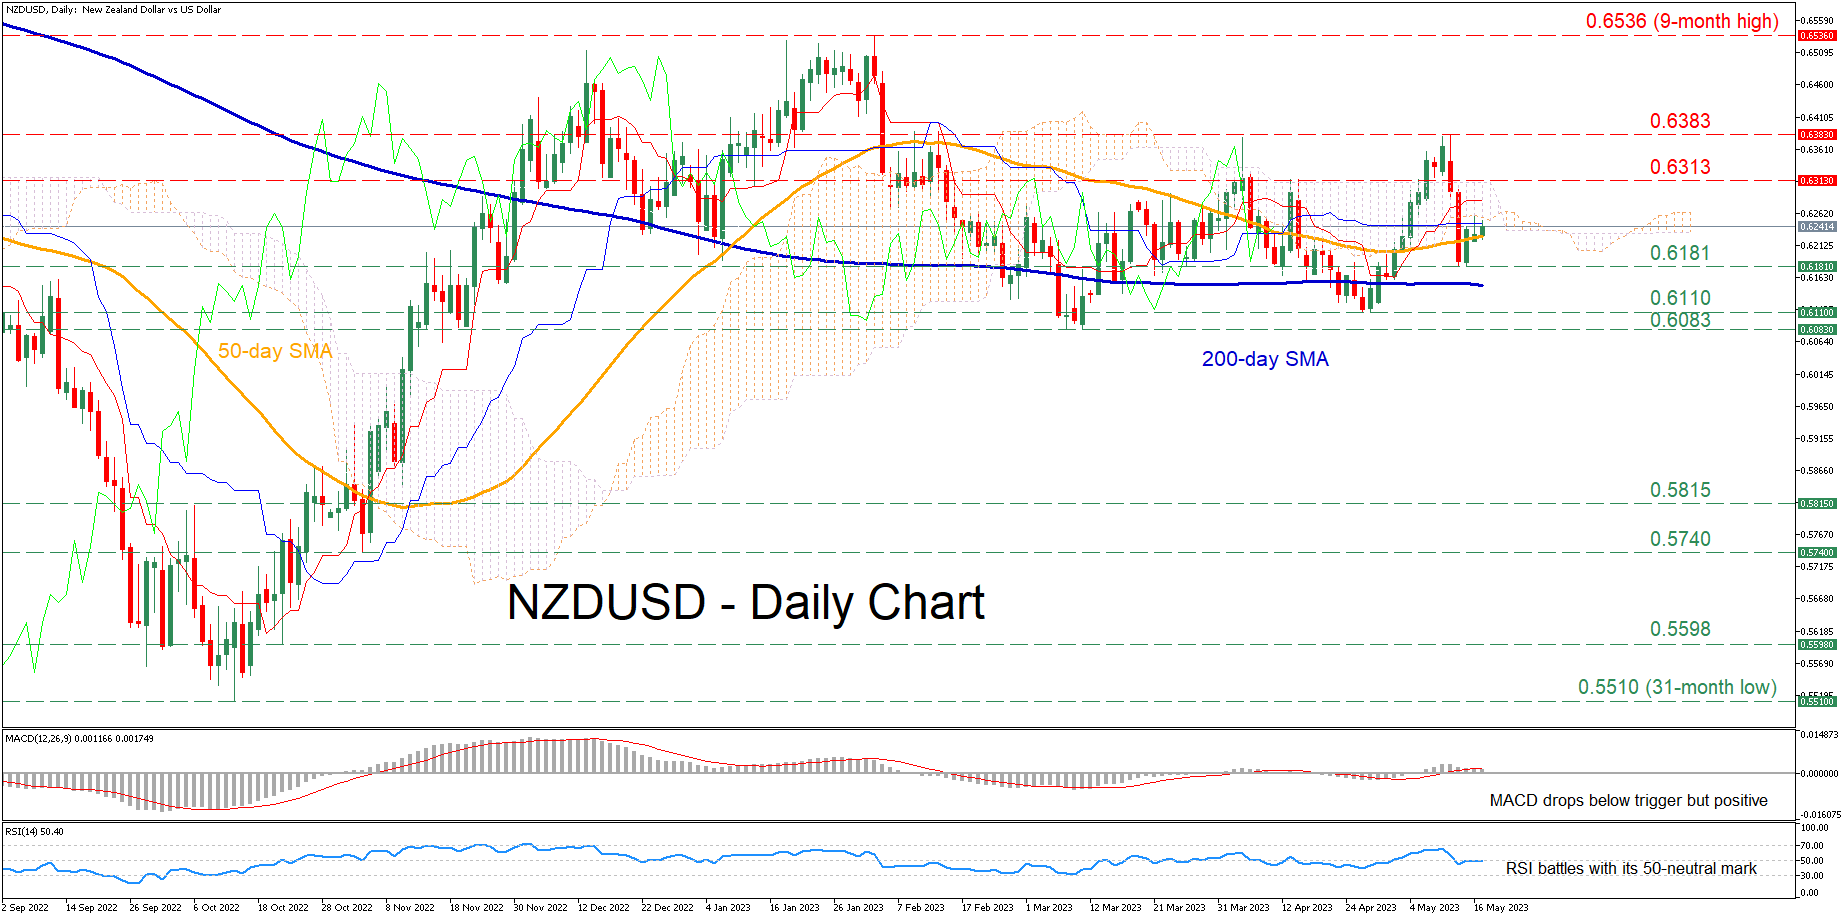
NZDUSD was in a steady short-term uptrend, posting a fresh three-month high of 0.6378 before experiencing a significant pullback. Although the pair managed to halt its retreat and recoup some losses, its attempt for a recovery stalled at the congested region that includes the 50-day simple moving average (SMA) and the lower end of the Ichimoku cloud.
The momentum indicators are reflecting a loss of positive momentum. Specifically, the MACD dropped beneath its red signal line but remains above zero, while the RSI is hovering around its 50-neutral threshold.
Should the selling interest persist, the recent support of 0.6181 could act as the first line of defense. Sliding beneath that floor, the price might descend towards the April low of 0.6110 before the 2023 bottom of 0.6083 gets tested. Further declines might then cease at the 0.5815 hurdle.
On the flipside, if the pair manages to overcome the fortified zone, 0.6313 may prove to be the first barrier for buyers to clear. Conquering this barricade, the bulls could aim for the May peak of 0.6383, which is also a three-month high. A violation of that region could open the door for the nine-month peak of 0.6536.
Overall, NZDUSD has been challenging a crucial technical region in the past couple of daily sessions after its downside correction paused. Therefore, a clear close above both its 50-day SMA and the lower boundary of the Ichimoku cloud is needed to revive bulls’ hopes for a sustained recovery.