Sample Category Title
Forex Markets See Uncertainty, Yen’s Slide Persists, Gold Back Below 2000
Clear direction is yet to be established in the forex markets this week, with the exception of Yen's continued depreciation, albeit at a slow pace. Canadian Dollar's rally, spurred by CPI data, was abruptly halted due to worsening risk sentiment, marked by DOW's over -330pts drop. US Treasury Secretary Janet Yellen amplified her warning about the urgent need to increase the debt limit, cautioning that failure to do so could result in "a number of financial markets break – with worldwide panic triggering margin calls, runs and fire sales."
Currently, most major pairs and crosses remain within last week's range, with the exceptions of USD/JPY, GBP/CAD, and AUD/CAD. Yen, Dollar, and Euro are showing weakness, while New Zealand Dollar, Canadian Dollar, and Swiss Franc are demonstrating strength. Aussie and Sterling are mixed. Considering the sparse economic calendar for today and tomorrow, trading may continue to be subdued. However, Australian Dollar could see some action tomorrow with the release of Australian job data.
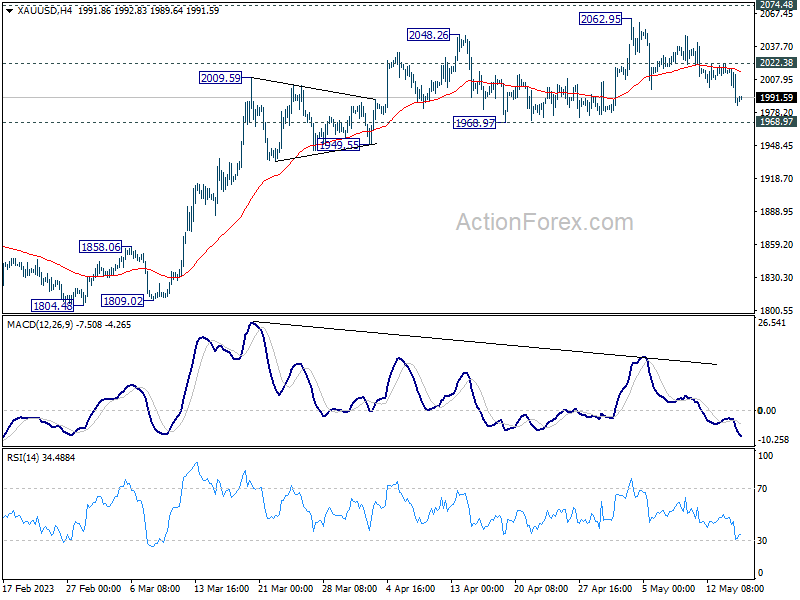
On the technical side, Gold is continuing its pullback from 2062.92 and has dipped below the 2000 mark. Near-term outlook remains bullish as long as 1968.97 support level holds. break of 2022.38 minor resistance could indicate readiness a rally resumption, potentially testing record high of 2074.48. However, firm break below 1968.97 could signal that near-term bearish reversal is already underway.
In Asia, at the time of writing, Nikkei is up 0.85%, back above 30k handle. Hong Kong HSI is down -0.55%. China Shanghai SSE is down -0.23%. Singapore Strait Times is down -0.83%. Japan 10-year JGB yield is down -0.0231 at 0.373. Overnight, DOW dropped -1.01%. S&P 500 dropped -0.64%. NASDAQ dropped -0.18%. 10-year yield rose 0.041 to 3.549.
Fed Logan: Slower tightening shouldn't signal any less commitment
Dallas Fed President Lorie Logan semphasized the importance of a cautious approach to tightening monetary policy amidst uncertainty, suggesting that a slower pace doesn't diminish commitment to achieving inflation goals.
Logan stated in a conference, "when conditions are uncertain, you may need to travel more slowly. But a slower pace of tightening shouldn't signal any less commitment to achieving the inflation goal." She further noted the potential for nonlinear deterioration of financial conditions, advocating for smaller, less frequent rate hikes to mitigate this risk.
Logan also underscored the multifaceted nature of monetary policy's impact. She said, "The restrictiveness of monetary policy comes from the entire policy strategy - how fast rates rise, the level they reach, the time spent at that level and the factors that determine further increases or decreases."
Seaprately, New York Fed President John Williams highlighted the time lag between policy decisions and their full impact on the economy, underlining the importance of monitoring the economy's behavior post-decision. "We've got to make our decisions and then watch what happens, get that feedback, see how the economy's behaving," Williams explained.
In another occasion, Chicago's Austan Goolsbee, however, indicated it may be too soon to discuss rate cuts or changes to monetary policy. He said, "I think it's far too premature to be talking about rate cuts and premature to be saying — even for the next meeting — are we going to pause? Are we going to raise? Are we going to cut."
Japan's economy bounced back in Q1, up 1.6% annualized, 0.4% qoq
Japan's economy delivered a robust performance in Q1, expanding at annualized rate of 1.6%, which significantly surpassed expectation of 0.7%. This marks the first expansion in three quarters, thanks to a potent combination of strong private consumption and a rebound in inbound tourism.
In terms of real GDP, adjusted for inflation, there was an increase of 0.4% qoq, beating the forecast growth of 0.1% qoq. The positive data signals a welcome resurgence in Japan's economy, signaling a potential turn-around after short period of technical recession.
Looking into the details, private consumption for the quarter rose by 0.6%, driven by robust demand for cars and durable goods. Concurrently, consumers boosted spending on services such as dining out, culminating in the fourth consecutive quarterly gain. Meanwhile, capital spending rose by 0.9%, aided by increased car-related investments and marking the first increase in two quarters.
However, not all sectors exhibited positive trends. Exports took a hit, declining by -4.2% due to a slump in shipments of cars and machinery used for chip production. Imports also fell by 2-.3%. Public investment remained largely flat.
Australia wage growth accelerated to 0.8% in Q1, highest in over a decade
Australia wage price index posted 0.8% qoq increase in Q1 2023, slightly short of expected 0.9% rise. Despite this, annual wage growth accelerated to 3.7%, marking the highest level since Q3 2012. This uptick is attributable to a combination of factors, including low unemployment, tight labour market, and high inflation.
Private sector emerged as the primary engine of growth, with wages climbing 0.8% over Q1 and experiencing an annual rise of 3.8%. According to Leigh Merrington, ABS's acting head of prices statistics, several private sector industries witnessed an annual wage growth exceeding 4%, with the remaining industries all recording an annual growth above 3%.
In the public sector, the highest quarterly (0.9%) and annual (3.0%) wage growth in a decade was reported. Increase in public sector wages is attributed to outcomes from enterprise agreement bargaining, regular scheduled rises, and higher wage caps.
Merrington further highlighted wage outcomes for Q1 2023, stating, "There was a continued lift in the share of jobs receiving wage rises of between 4 and 6 per cent, which is the highest share since 2009. The share of jobs with a wage rise of 2 per cent or less has fallen from over 50 per cent in mid-2021 to less than 20 per cent."
Looking ahead
Eurozone CPI final will be the main focus in European session while Italy trade balance will be featured too. US will release housing starts and building permits later in the day.
USD/JPY Daily Outlook
Daily Pivots: (S1) 135.82; (P) 136.26; (R1) 136.82More...
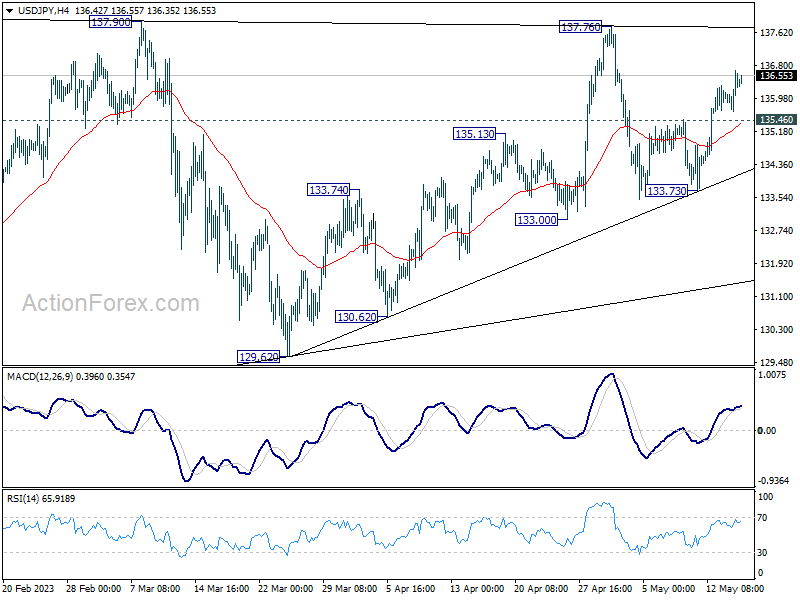
USD/JPY's rally from 133.73 is still in progress and intraday bias remains on the upside for 137.76/90 resistance zone. Decisive break there will resume whole rebound from 127.20. On the downside, though, below 135.46 minor support will turn bias back to the downside for 133.73. Firm break there will resume the fall from 137.76 through 133.00.
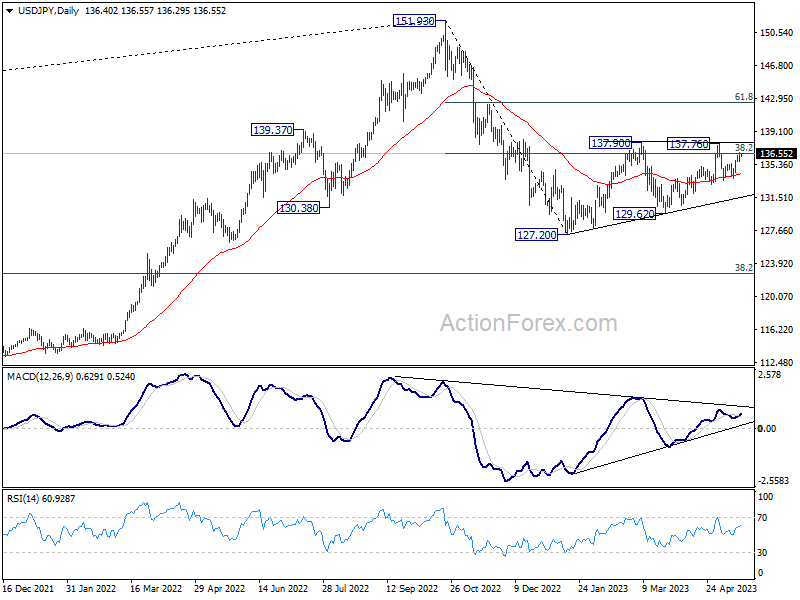
In the bigger picture, price actions from 151.93 high are currently seen as a corrective pattern to the long term up trend. The first leg should have completed at 127.20. Rebound from there is seen as the second leg. Sustained break of 38.2% retracement of 151.93 to 127.20 at 136.34 will bring stronger rise to 61.8% retracement at 142.48. Meanwhile, break of 129.62 will argue that the third leg is starting through 127.20 low.
Economic Indicators Update
| GMT | Ccy | Events | Actual | Forecast | Previous | Revised |
|---|---|---|---|---|---|---|
| 23:50 | JPY | GDP Annualized Q1 P | 0.40% | 0.20% | 0.10% | |
| 23:50 | JPY | GDP Deflator Y/Y Q1 P | 2.00% | 2.00% | 1.20% | |
| 01:30 | AUD | Wage Price Index Q/Q Q1 | 0.80% | 0.90% | 0.80% | |
| 04:30 | JPY | Industrial Production M/M Mar F | 1.10% | 0.80% | 0.80% | |
| 08:00 | EUR | Italy Trade Balance (EUR) Mar | 2.50B | 2.11B | ||
| 09:00 | EUR | Eurozone CPI Y/Y Apr F | 7.00% | 7.00% | ||
| 09:00 | EUR | Eurozone CPI Core Y/Y Apr F | 5.60% | 5.60% | ||
| 12:30 | USD | Housing Starts Apr | 1.40M | 1.42M | ||
| 12:30 | USD | Building Permits Apr | 1.44M | 1.43M | ||
| 14:30 | USD | Crude Oil Inventories | -1.5M | 3.0M |
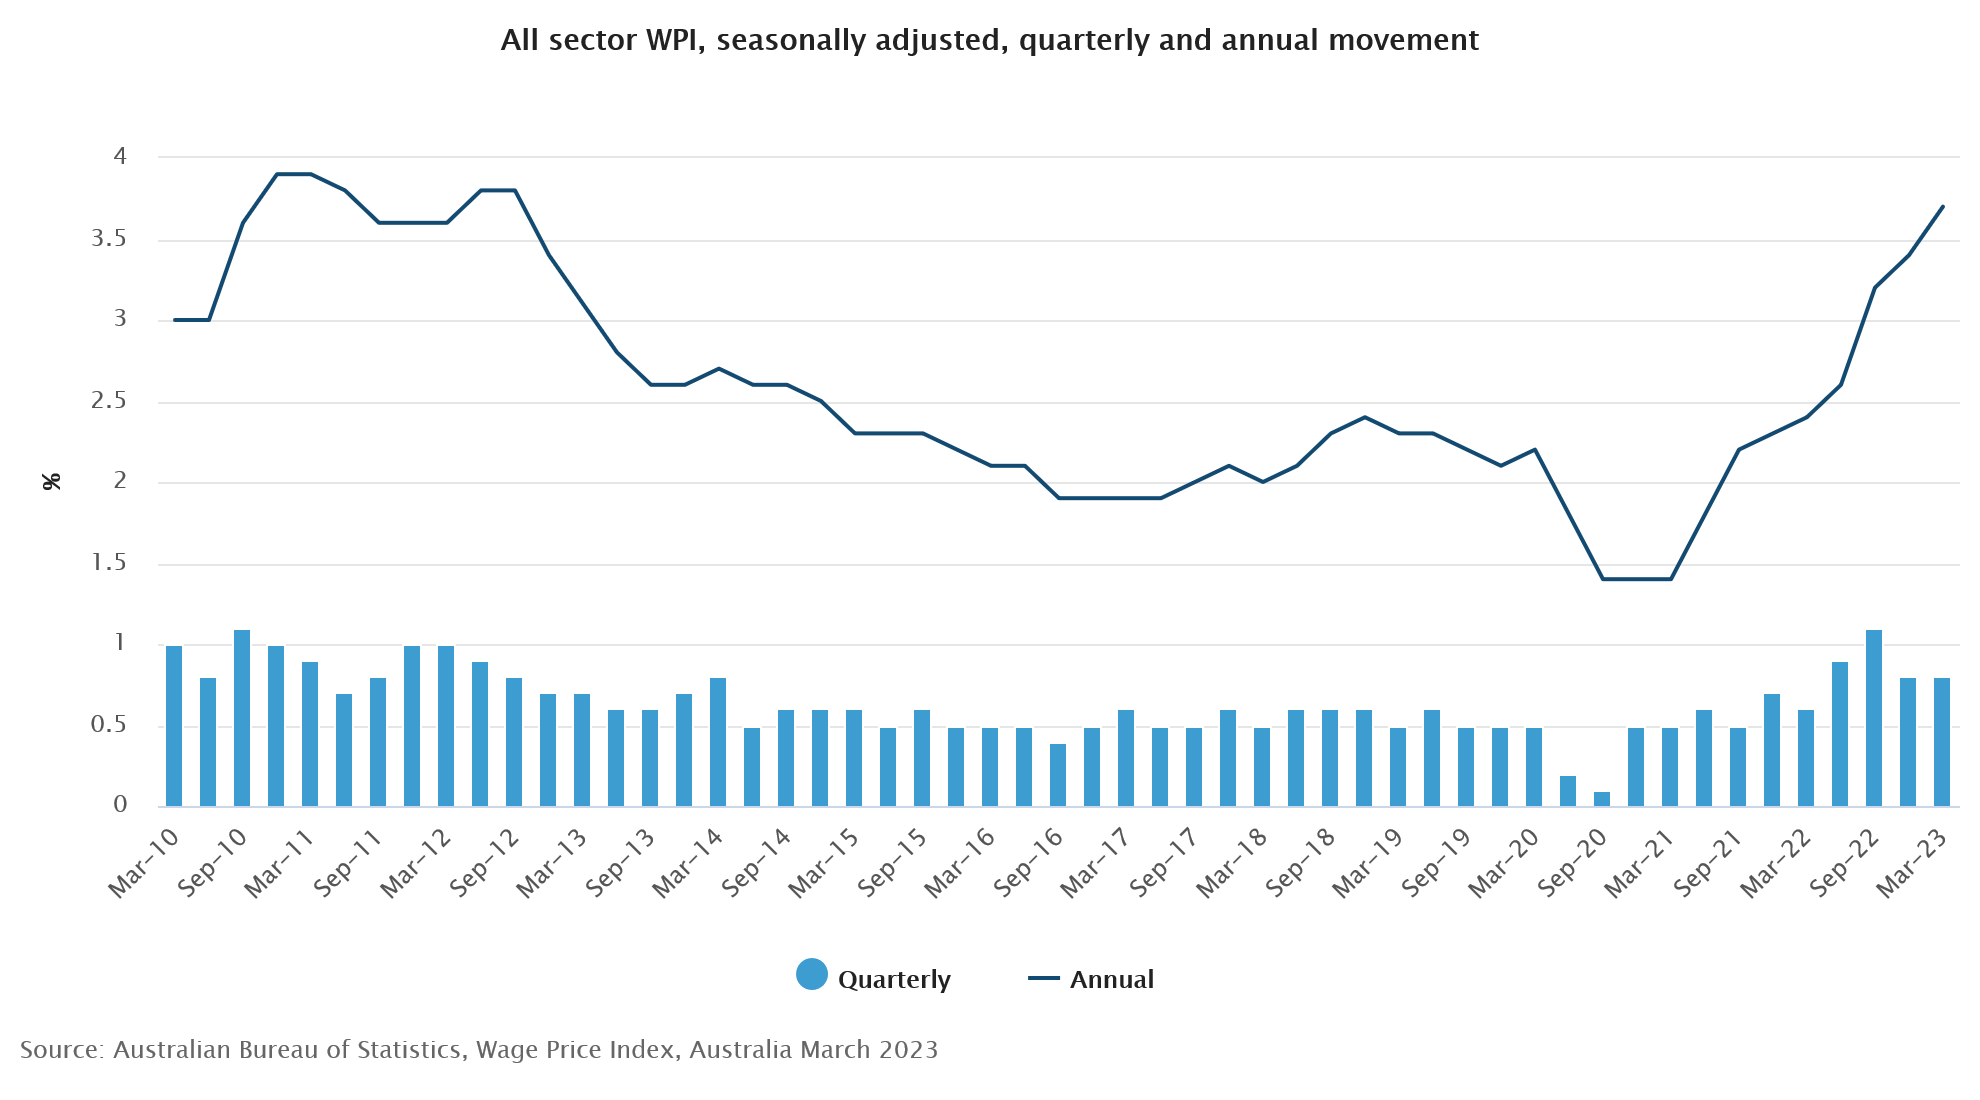
Australia wage growth accelerated to 0.8% in Q1, highest in over a decade
Australia wage price index posted 0.8% qoq increase in Q1 2023, slightly short of expected 0.9% rise. Despite this, annual wage growth accelerated to 3.7%, marking the highest level since Q3 2012. This uptick is attributable to a combination of factors, including low unemployment, tight labour market, and high inflation.
Private sector emerged as the primary engine of growth, with wages climbing 0.8% over Q1 and experiencing an annual rise of 3.8%. According to Leigh Merrington, ABS's acting head of prices statistics, several private sector industries witnessed an annual wage growth exceeding 4%, with the remaining industries all recording an annual growth above 3%.
In the public sector, the highest quarterly (0.9%) and annual (3.0%) wage growth in a decade was reported. Increase in public sector wages is attributed to outcomes from enterprise agreement bargaining, regular scheduled rises, and higher wage caps.
Merrington further highlighted wage outcomes for Q1 2023, stating, "There was a continued lift in the share of jobs receiving wage rises of between 4 and 6 per cent, which is the highest share since 2009. The share of jobs with a wage rise of 2 per cent or less has fallen from over 50 per cent in mid-2021 to less than 20 per cent."
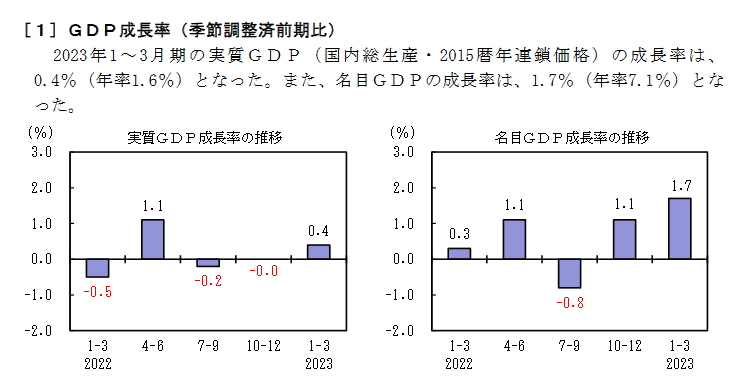
Japan’s economy bounced back in Q1, up 1.6% annualized, 0.4% qoq
Japan's economy delivered a robust performance in Q1, expanding at annualized rate of 1.6%, which significantly surpassed expectation of 0.7%. This marks the first expansion in three quarters, thanks to a potent combination of strong private consumption and a rebound in inbound tourism.
In terms of real GDP, adjusted for inflation, there was an increase of 0.4% qoq, beating the forecast growth of 0.1% qoq. The positive data signals a welcome resurgence in Japan's economy, signaling a potential turn-around after short period of technical recession.
Looking into the details, private consumption for the quarter rose by 0.6%, driven by robust demand for cars and durable goods. Concurrently, consumers boosted spending on services such as dining out, culminating in the fourth consecutive quarterly gain. Meanwhile, capital spending rose by 0.9%, aided by increased car-related investments and marking the first increase in two quarters.
However, not all sectors exhibited positive trends. Exports took a hit, declining by -4.2% due to a slump in shipments of cars and machinery used for chip production. Imports also fell by 2-.3%. Public investment remained largely flat.
Fed Logan: Slower tightening shouldn’t signal any less commitment
Dallas Fed President Lorie Logan emphasized the importance of a cautious approach to tightening monetary policy amidst uncertainty, suggesting that a slower pace doesn't diminish commitment to achieving inflation goals.
Logan stated in a conference, "when conditions are uncertain, you may need to travel more slowly. But a slower pace of tightening shouldn't signal any less commitment to achieving the inflation goal." She further noted the potential for nonlinear deterioration of financial conditions, advocating for smaller, less frequent rate hikes to mitigate this risk.
Logan also underscored the multifaceted nature of monetary policy's impact. She said, "The restrictiveness of monetary policy comes from the entire policy strategy - how fast rates rise, the level they reach, the time spent at that level and the factors that determine further increases or decreases."
Seaprately, New York Fed President John Williams highlighted the time lag between policy decisions and their full impact on the economy, underlining the importance of monitoring the economy's behavior post-decision. "We've got to make our decisions and then watch what happens, get that feedback, see how the economy's behaving," Williams explained.
In another occasion, Chicago's Austan Goolsbee, however, indicated it may be too soon to discuss rate cuts or changes to monetary policy. He said, "I think it's far too premature to be talking about rate cuts and premature to be saying — even for the next meeting — are we going to pause? Are we going to raise? Are we going to cut."
Gold Price Approaches Make-or-Break Levels
Key Highlights
- Gold price started a downside correction from the $2,050 resistance zone.
- A major bearish trend line is forming with resistance near $2,015 on the 4-hour chart.
- EUR/USD is consolidating above the 1.0840 support.
- GBP/USD might continue to move down below the 1.2440 support.
Gold Price Technical Analysis
Gold price started a downside correction from the $2,050 zone against the US Dollar. The price traded below the $2,020 support to move into a short-term bearish zone.
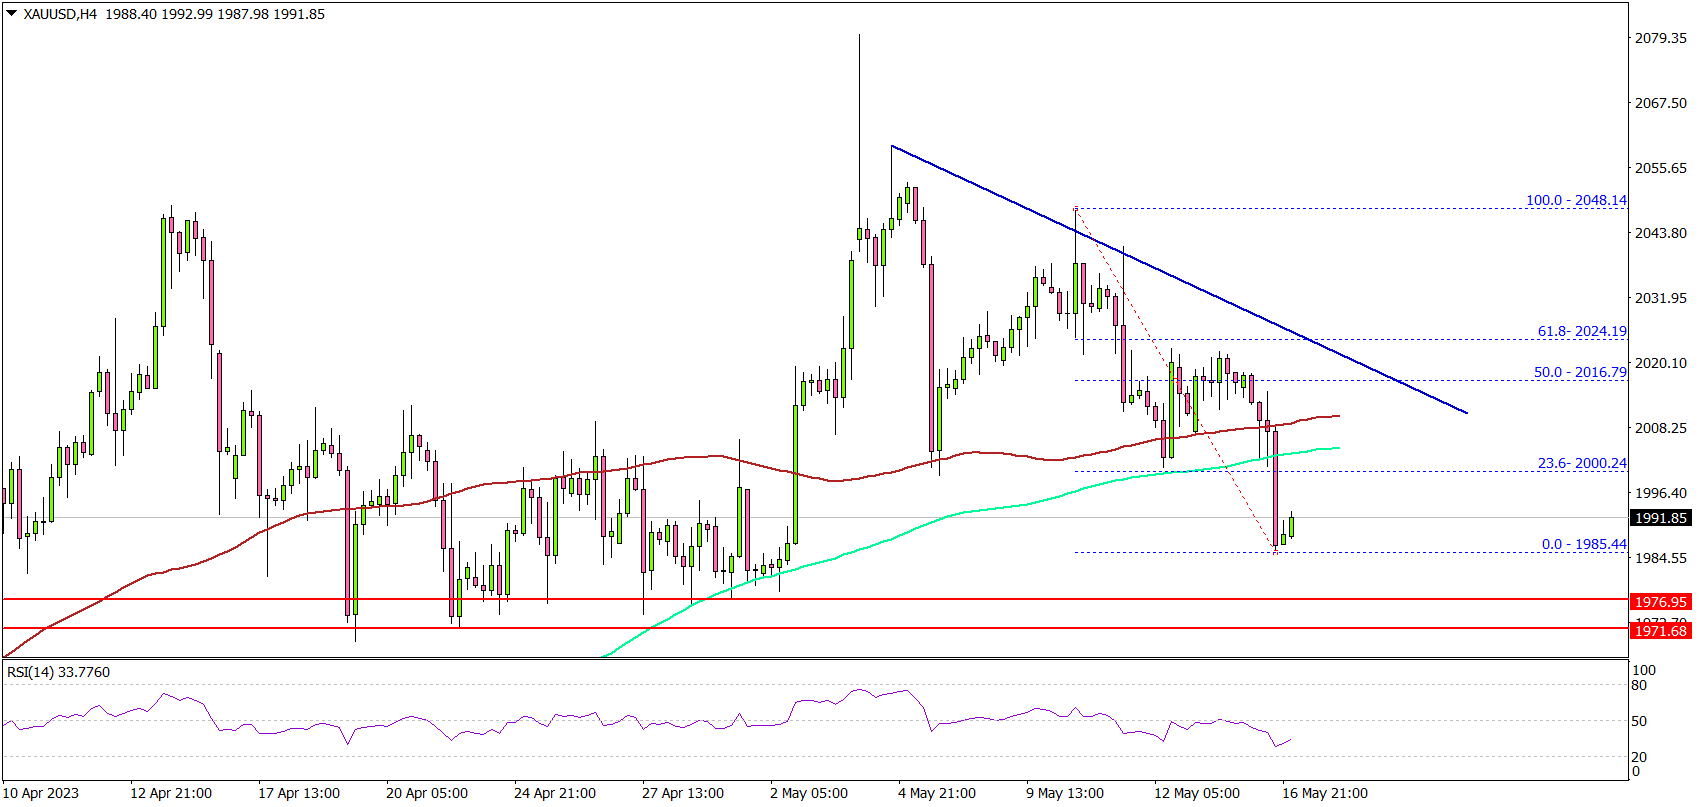
The 4-hour chart of XAU/USD indicates that the price traded below the $2,000 support, the 200 Simple Moving Average (green, 4 hours), and the 100 Simple Moving Average (red, 4 hours).
It seems to be approaching major support near the $1,975 level. If the bulls fail to protect the $1,975 support, there is a risk of a major decline. In the stated case, the price could decline toward the $1,950 level.
Immediate resistance near the $2,008 level. The next major resistance is near the $2,015 level. There is also a major bearish trend line forming with resistance near $2,015 on the same chart.
Any more gains might send the price toward the $2,020 resistance level. A close above $2,020 might start a fresh increase toward the $2,050 resistance level.
Looking at EUR/USD, the pair tested the 1.0840 support and is currently consolidating losses with a risk of more losses.
Economic Releases to Watch Today
- Euro Zone CPI for April 2023 (YoY) - Forecast +7%, versus +7% previous.
- Euro Zone CPI for April 2023 (MoM) - Forecast +0.7%, versus +0.7% previous.
Gold (XAUUSD) Short Term Elliott Wave Support Area
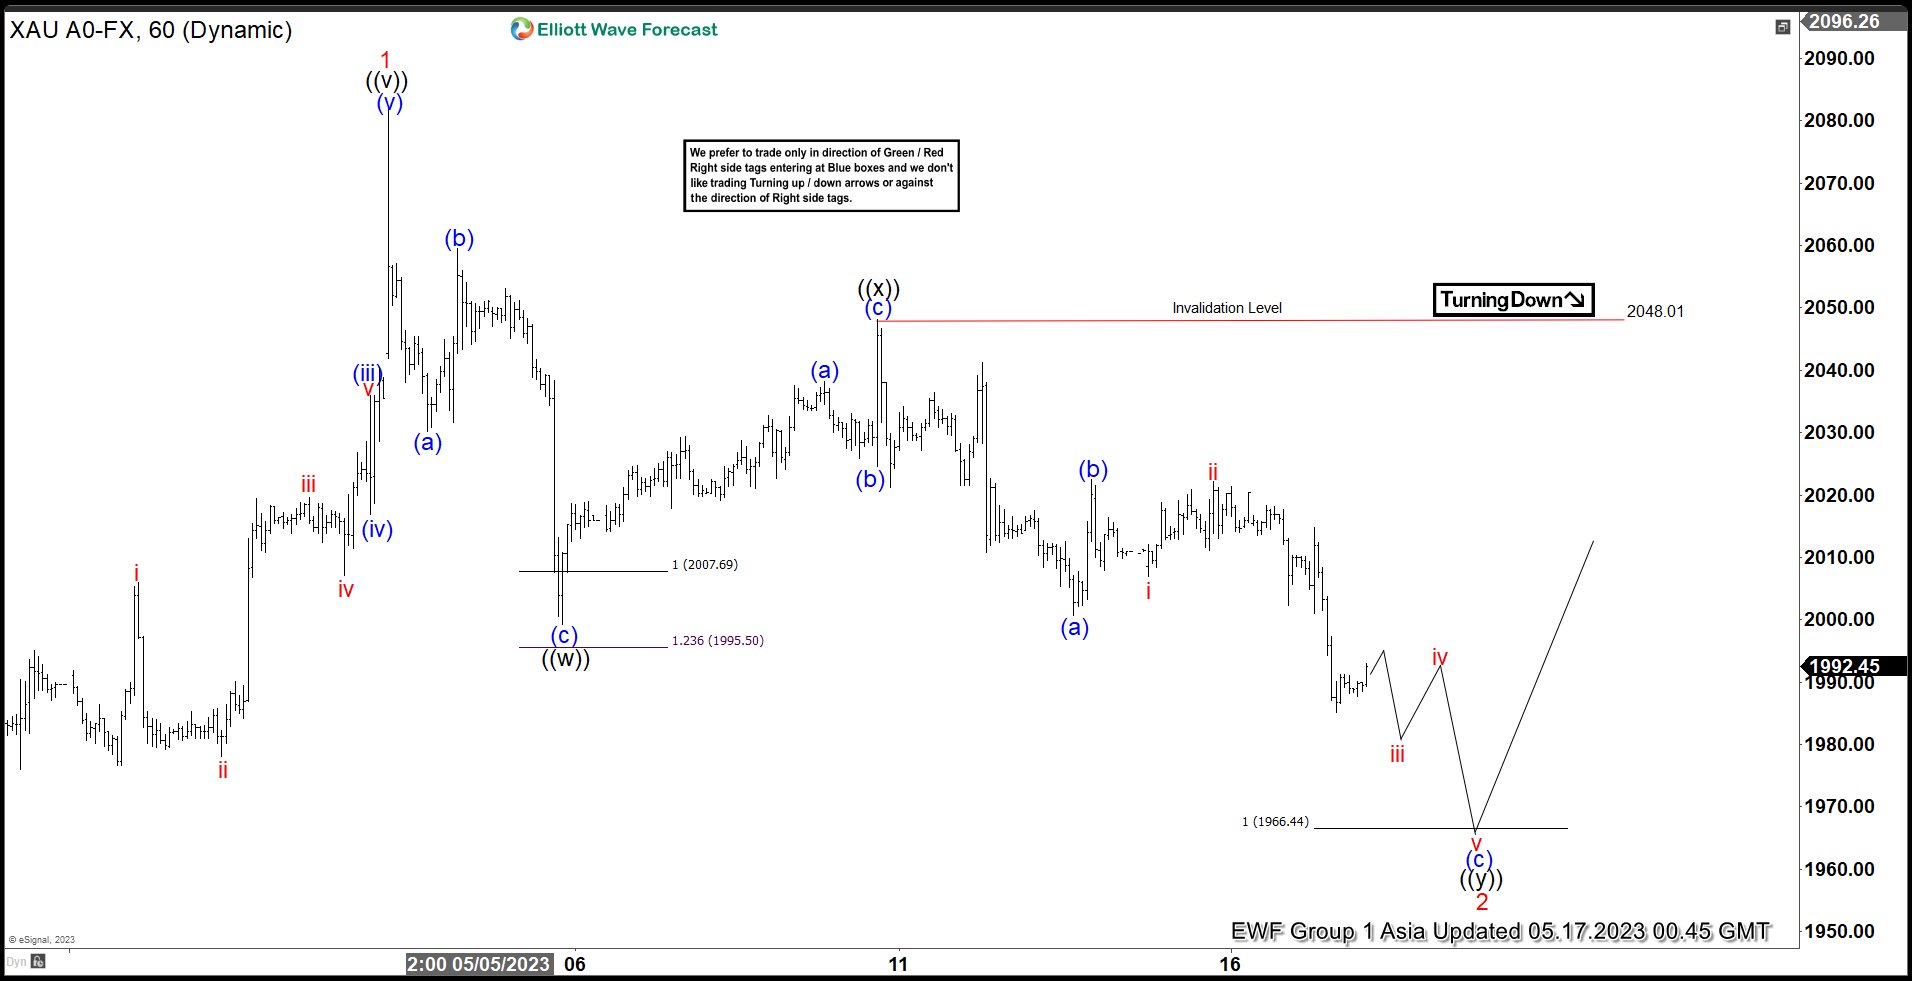
Short Term Elliott Wave view suggests Gold ended wave 1 rally at 2081.82. Pullback in wave 2 is in progress as a double three Elliott Wave structure. Down from wave 1, wave (a) ended at 2030.21 and rally in wave (b) ended at 2059.56. Wave (c) lower ended at 1999.30 which completed wave ((w)). Wave (c) ended at the 100% – 123.6% Fibonacci extension of wave (a). We have here a clear 3 waves pullback which ended at the 100% extension area. This suggests the right side of the market remains bullish despite the pullback. From wave ((w)), the metal ended wave ((x)) at 2048.01 with internal subdivision as a zigzag. Up from wave ((w)), wave (a) ended at 2038.20, pullback in wave (b) ended at 2024.6, and wave (c) higher ended at 2048.15. This completed wave ((x)).
Wave ((y)) lower is currently in progress with internal subdivision as a zigzag structure. Down from wave (x)), wave (a) ended at 2000.6 and rally in wave (b) ended at 2022.56. The metal has resumed lower in wave (c) in 5 waves. Down from wave (b), wave i ended at 2007 and wave ii rally ended at 2022.11. Expect the metal to continue lower a few more to end wave iii, wave iv, and wave v. This should complete wave (c) of ((y)) of 2 and end the entire corrective pattern. Potential target lower is 100% – 161.8% Fibonacci extension of wave ((w)). This area comes at 1915 – 1966. Expect buyers to appear here for more upside or 3 waves rally at least.
Google ($XAUUSD) 60 Minutes Elliott Wave Chart
Gold Elliott Wave Video
https://www.youtube.com/watch?v=eoP26ajMBcE
USDCHF: Elliott Wave Bearish Sequence & Next Extreme Areas
USDCHF has seen a strong decline since October 2022 peak with shallow bounces in-between. In today’s blog, we will take a look at the Elliott wave structure of the decline from October 21, 2022 peak, market sequence and next extreme areas which should be potential entry areas for both sellers and buyers. We will also present a details Elliott wave count of the decline from 03.02.2023 peak and also look at the structure of the corrective bounce since 05.04.2023 low.
USDCHF Bearish Elliott Wave Sequence and Double Extreme Area
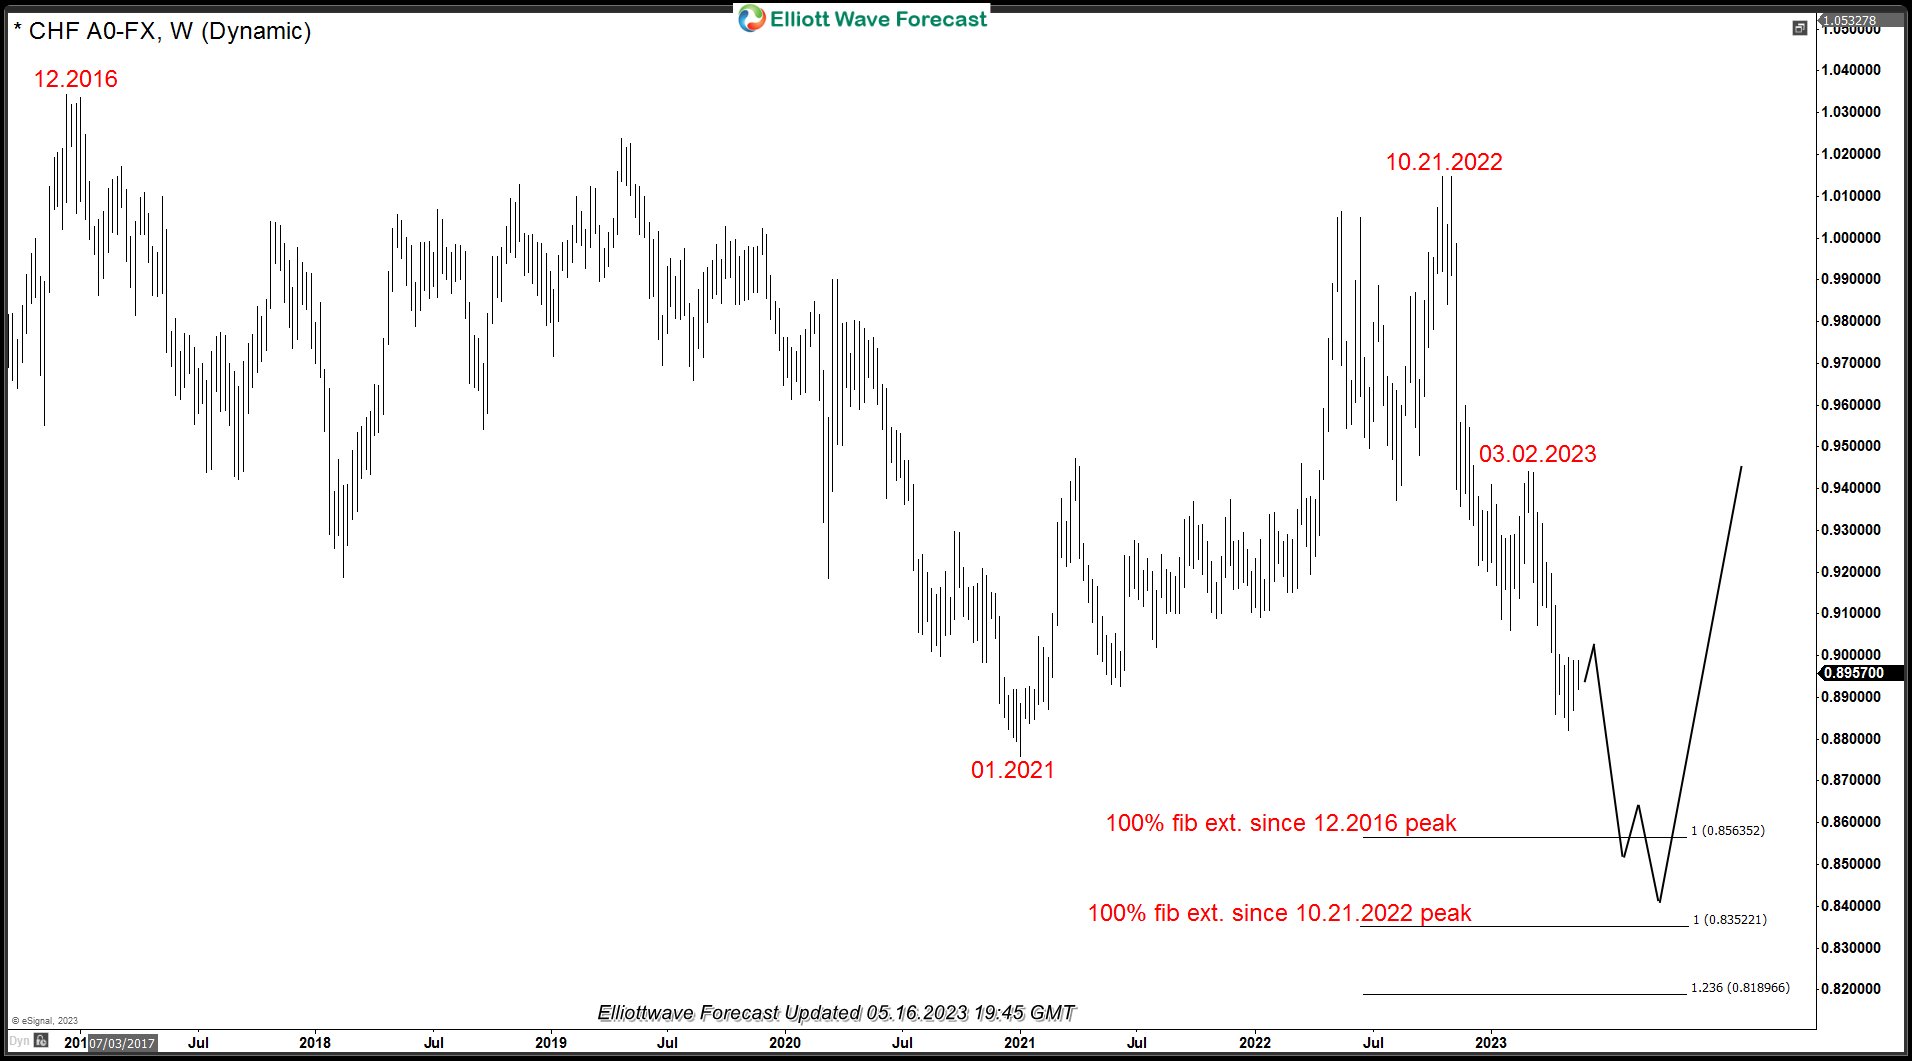
Chart above shows USDCHF forex pair showing an incomplete bearish sequence down from 10.21.2022 peak with 03.02.2023 being the connector. So we expect the bounces to fail below 03.02.2023 peak for continuation lower. 100% Fibonacci extension from 10.21.2022 peak comes at 0.83422 which is below January 2021 low which will create an incomplete bearish sequence down from December 2016 peak with 100% Fibonacci extension coming at 0.8563. So while below 03.02.2023 peak, expect the pair to continue lower toward a double extreme area from December 2016 peak and from October 2022 peak and it should act as a power reversal area. This area should produce a reaction higher in USDCHF and US Dollar in general for a minimum of 3 waves and should be a very good area for buyers once reached.
USDCHF 4 Hour Elliott Wave Analysis and Blue Box Area
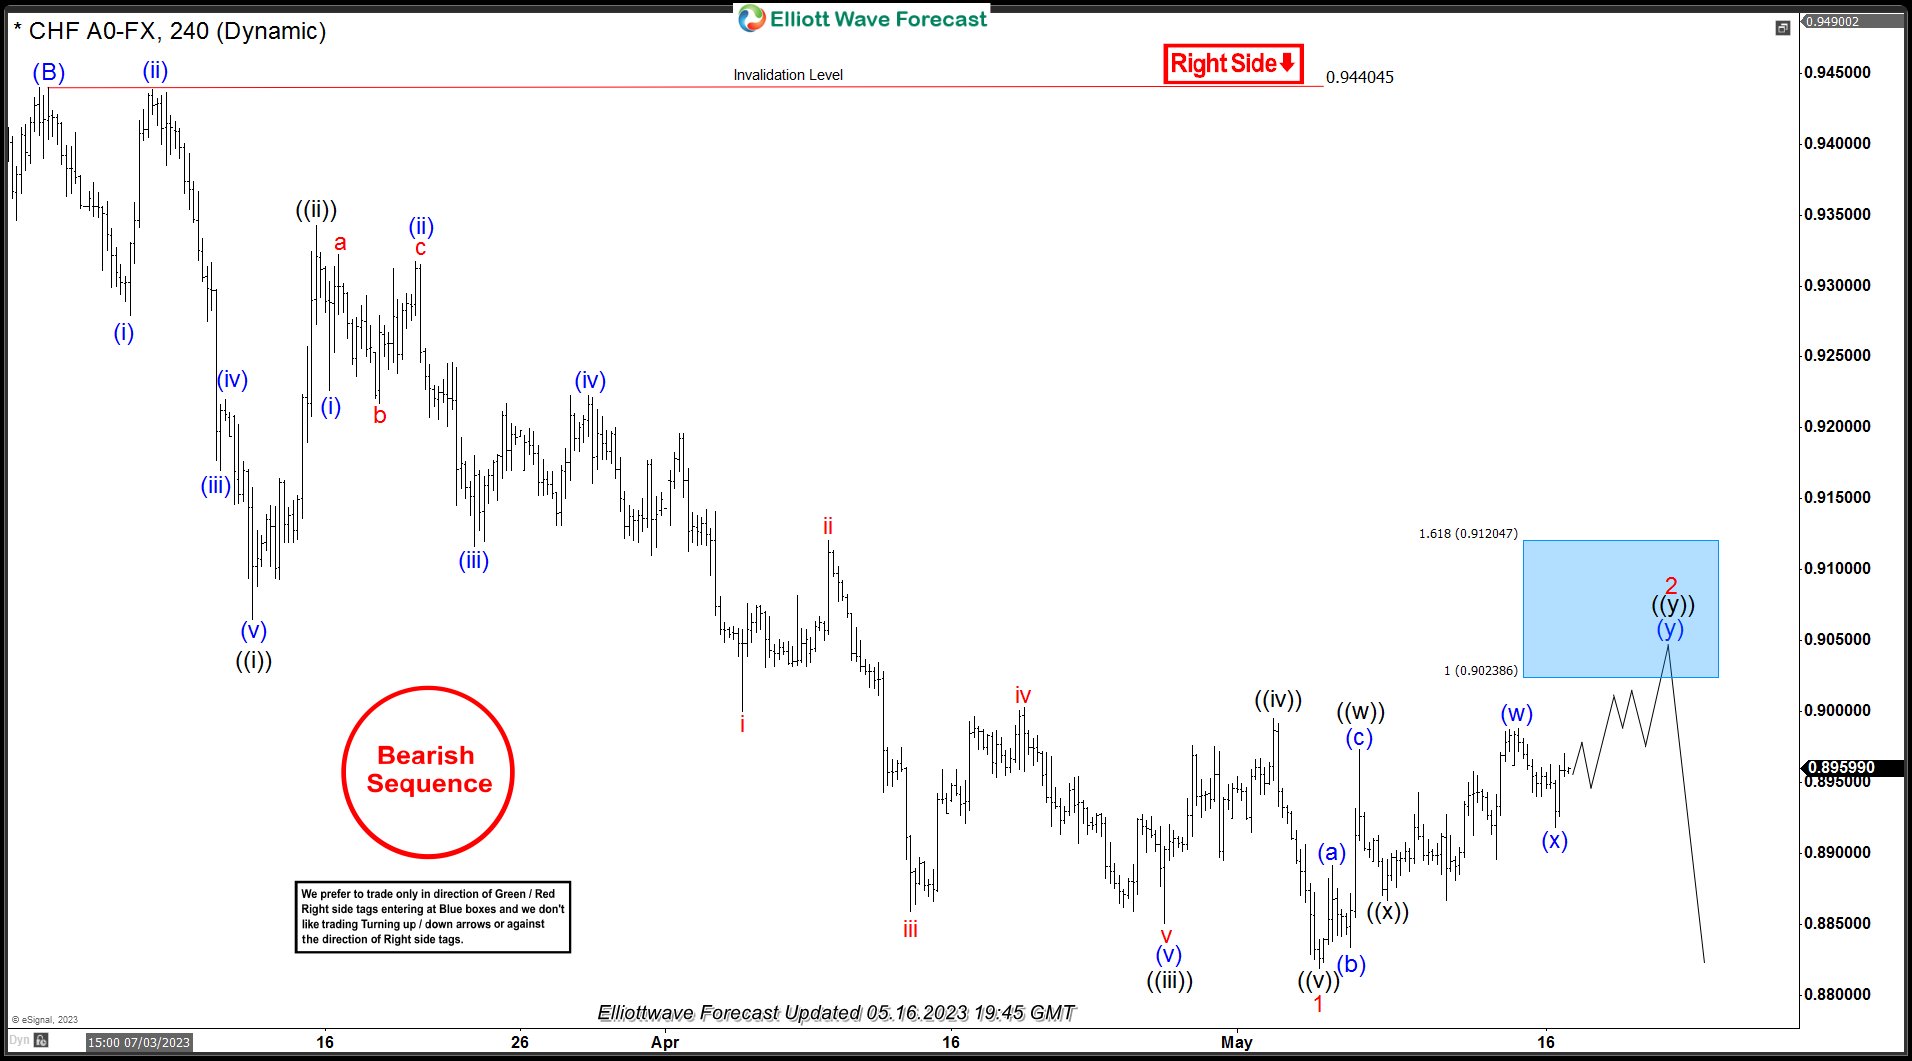
Chart above shows USDCHF cycle from 03.02.2023 ended as an impulse and pair is now bouncing to correct the decline from 03.02.2023 peak at 0.94404. Pair is showing 5 swings up from the low and we expect another swing higher to complete double there Elliott wave structure. 0.90238 – 0.92104 is the ideal area to complete 7 swings and this is where we expect sellers to appear to resume the decline toward the double extreme area shown on the weekly chart above or produce a reaction lower in three waves at least to allow sellers to get into a risk free position.
Gold Wave Analysis
- Gold reversed from long-term resistance level 2070.00
- Likely to fall to support level 1966.00
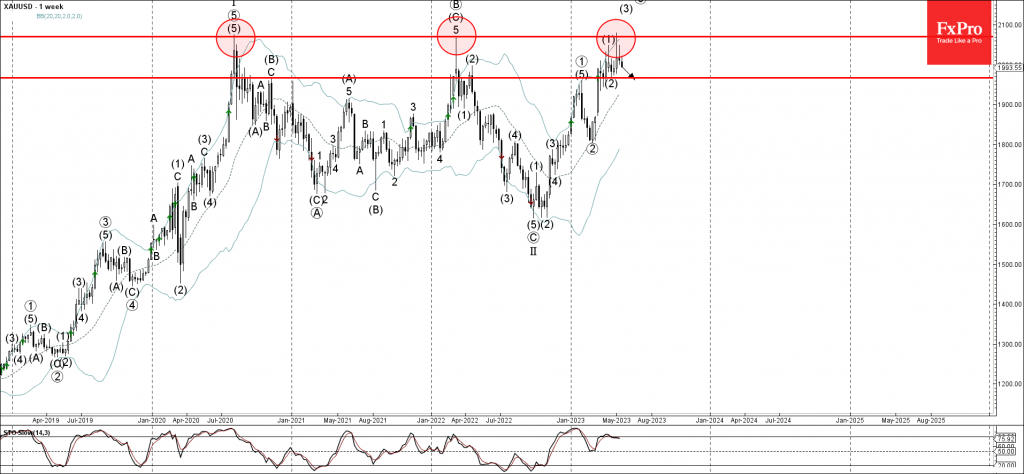
Gold recently reversed down from the strong, long-term resistance level 2070.00 (previous yearly high from 2020 and 2022).
The resistance level 2070.00 was further strengthened by the upper weekly Bollinger Band.
Given the strength of the resistance level 2070.00 and the bearish divergence on the weekly Stochastic, Gold can be expected to fall toward the next support level 1966.00 (bottom of the previous weekly correction (2)).
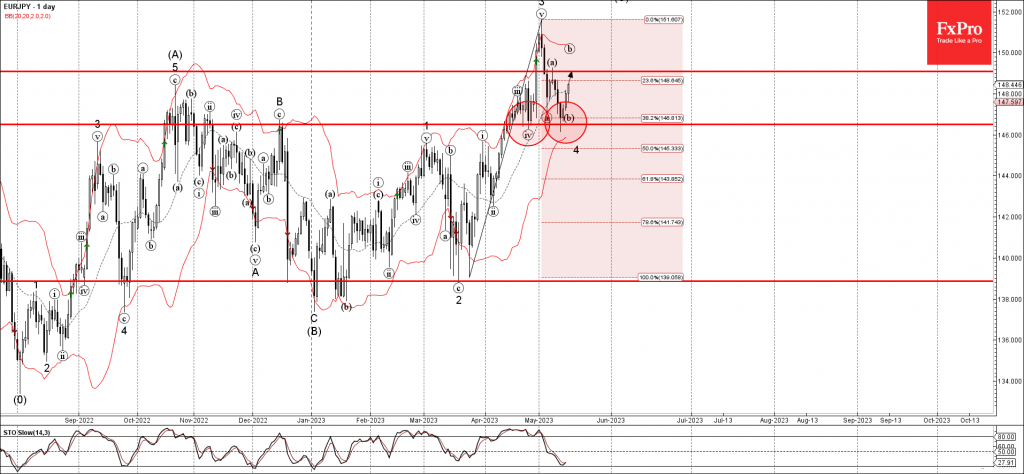
EURJPY Wave Analysis
- EURJPY reversed from support level 146.50
- Likely to rise to resistance level 149.00
EURJPY recently reversed up from the key support level 146.50 (former strong resistance from November and December).
The upward reversal from the support level 146.50 formed the daily Piercing Line, which stopped the (b)-wave of the active ABC correction (b).
Given the clear daily uptrend and the continuation of the strong yen sales from yesterday, EURJPY can be expected to rise toward the next resistance level 149.00 (top of the previous short-term correction (a)).